 Open Access Article
Delignified wood aerogels as scaffolds coated with an oriented chitosan–cyclodextrin co-polymer for removal of microcystin-LR
Diego Gomez-Maldonado a,
Autumn Marie Reynoldsa,
Daniel J. Burnettb,
R. Jayachandra Babuc,
Matthew N. Watersd and
Maria S. Peresin*a
aForest Products Development Center, College of Forestry, Wildlife and Environment, Auburn University, Auburn, AL 36849, USA. E-mail: soledad.peresin@auburn.edu
bSurface Measurement Systems, Allentown, PA 18103, USA
cHarrison School of Pharmacy, Auburn University, Auburn, AL 36849, USA
dDepartment of Crop, Soil and Environmental Sciences, Auburn University, Auburn, AL 36849, USA
First published on 13th July 2022
Abstract
Nano-porous aerogels are an advantageous approach to produce low-density materials with high surface area, particularly when using biobased materials. Frequently, most biobased aerogels are synthesized through a bottom-up approach, which requires high energy inputs to break and rebuild the raw materials, and for elimination of water. To curb this, this work focused on generating aerogels by a top-down approach through the delignification of a wood substrate while eliminating water by solvent exchange. To diversify the surface chemistry for use in water treatment, the delignified wood–nanowood-was coated with a chitosan–cyclodextrin co-polymer and tested in the capture of microcystin-LR. The generated nanowood structure had 75% porosity after coating, with up to 339% water swelling and an adsorption capacity of 0.12 mg g−1 of the microcystin. This top-down technique enables the generation of low-cost aerogels by reducing steps, using a biobased self-assembled coating with hydrophobic active sites, and avoiding costly energetic input.
1. Introduction
Wood is one of the most used materials, as it has been used since pre-history times for fuel, constructions (first wood house made 10![[thin space (1/6-em)]](https://www.rsc.org/images/entities/char_2009.gif) 000 years ago), and as a material for tools and weapons.1 Even in more modern times, its application has made incursions into furniture and paper, which makes it an important day-to-day resource. Furthermore, it is estimated that up to 1.6 billion people depend on this industry, as well as it derivatives in products and services, for their sustenance, as it translates in the market to about $450 billion USD.2 It is estimated that there were 530.5 billion cubic meters of stock in 2015, but regions like Europe, East Asia, and North America have consistently reported an increase in their forest coverage.3–5
000 years ago), and as a material for tools and weapons.1 Even in more modern times, its application has made incursions into furniture and paper, which makes it an important day-to-day resource. Furthermore, it is estimated that up to 1.6 billion people depend on this industry, as well as it derivatives in products and services, for their sustenance, as it translates in the market to about $450 billion USD.2 It is estimated that there were 530.5 billion cubic meters of stock in 2015, but regions like Europe, East Asia, and North America have consistently reported an increase in their forest coverage.3–5
As wood is a biosynthesis product, its chemical composition varies depending on the selected tree, species, geographical location, available soil nutrients, and age, among other.6,7 However, the three main components are cellulose, hemicellulose, and lignin, with the polysaccharide components-cellulose and hemicellulose-accounting for 65 to 70% of the dry weight.8 Traditional processing for wood such as commodities and high-end products is based on breaking of the inherent structure, homogenization, and separation of the components.9 Thereafter, product development takes a bottom-up route, rebuilding the components into new structures such as paper and films,10,11 or into more complex structures such as aerogels and hydrogels.12–14 Even though isolation is an important process for the generation of products and materials, a great side effect is the hornification of the cellulose nanofibrils that were present in the cellular wall.15 To obtain again nanofibrils from the pulp or other cellulosic biomass, processes as high pressure homogenizer and grinding by a super mass colloider have been developed; nevertheless, these processes require a high energetic input.16–18
As some of the more novel applications, such as water treatment, it is desired to maintain the high surface area of the cellulose nanofibrils and a low density such as the obtained with aerogels and hydrogels from nanocellulose. A recently develop alternative to form aerogels has been the separation of the lignin and hemicellulose from the wood natural structure by softer chemical processes derived from the more tradition pulping methods.13,19–23 However, most of these processes still use a high energy drying step, freeze-drying.
These wood-based aerogels (also called nanowood), have been mostly used for radiation cooling, solar cells and windows, or for energy storage after carbonization but not much work has been reported on the utilization of nanowood in water remediation, despite their high surface area and renewability.24 Furthermore, for this type of applications, extra processing is still needed as the surface chemistry is limited to the inherent cellulose side groups, and consequent partial negative charge that comes with some side reactions on the delignification process.6 Therefore, some extra modification is needed, which ideally will be done with little to no energy input and green materials. This could be achieved like in traditional bottom-up aerogels and other porous materials, with active nanoscale coatings, such as adsorption of nanoparticles,25–27 or other active polymers.28–30
A good strategy to add functionality to polysaccharides is to adsorb other β-linked polysaccharides that has the desired functional group, such as chitosan or alginates.31,32 Furthermore, when chitosan is used, the amino groups that are added serve both as functionality by their positive charge that can interact with negative charged pollutants,33,34 as well as a new surface group that can be easily modified with other active molecules with different molecular interactions like β-cyclodextrin or with enzymes by green chemistry such as EDC/NHS chemistry.35–37
Thus, this work is based on the following hypotheses: (i) nanowood can be generated without the use of freeze-drying. (ii) Nanowood can be modified with biopolymeric derivatives by entropically-driven methodologies-such as impregnation and adsorption – and (iii) modified nanowood can remove pollutants from water.
In order to corroborate the first hypothesis, solvent exchange adapted from Toivonen et al. was done,38 where the final solvent is octane allowing to be air dried, avoiding the high energy input. The second hypothesis was addressed with a pre-modified chitosan with TEMPO oxidized β-cyclodextrin; the coating was done by sole immersion of the aerogels in a buffer solution with an ionic strength of 50 mM, which promotes the adsorption of chitosan and cellulose by hydrogen bonding. Finally, to assess the third hypothesis and the activity of the coating material, adsorption on the increasingly concerning cyanotoxin–microcystin-LR-was done, as it has a known to form inclusion complexes with β-cyclodextrin.39,40
2. Experimental
2.1. Materials
Pine wood was obtain from the School of Forestry and Wildlife Science at Auburn University; β-cyclodextrin (CD, >95% purity) and N-hydroxysuccinimide (NHS, 98.0% purity) were purchased from Tokyo Chemical Industry (Portland, OR, USA); chitosan (DSacetylation of 0.15, MRU 167.3 g mol−1) and octane (98+%) were purchased from Alfa Aesar (Haverhill, MA, USA); microcystin-LR (MC, >95%) was purchase from Cayman Chemicals (Ann Arbor, MI, USA); sodium hydroxide (50% w/w) was obtained from J. T. Baker (Phillipsburg, NJ, USA); sodium chlorite (80% purity) was purchased from BeanTown Chemical (Hudson, NH, USA); sodium hypochlorite (12.5% w/w, 2 M in water), peroxide (35% w/w) and isopropanol were obtained from VWR chemicals (Radnor, PA, USA); sodium sulfate (Na2SO3) was bought from Fisher Scientific company (Walthman, MA, USA); sulfuric acid (72% w/w) was obtained from Ricca Chemical company (Arlington, TX, USA); 2,2,6,6-tetramethylpiperidinooxy (TEMPO, 98% purity) was bought from Acros Organics (Geel, Belgium); 3-(3-dimethylaminopropil)-1-ethyl-carbodiimide hydrochloride (EDC, 99.9% purity) was obtained from Chem-Impex International (Wood Dale, IL, USA); ethanol (200 proof pure) purchased from Decon Labs, Inc. (King of Prussia, PA, USA); the water used was deionized and purified with a Thermo Scientific Barnstead Nanopure (18.2 MΩ cm). Unless specified, all the weights in this paper are expressed in oven dry basis.2.2. Synthesis of TEMPO oxidized β-cyclodextrin (TOCD)
β-Cyclodextrin was carboxylated by neutral TEMPO-NaClO-NaClO2 oxidation in aqueous media.36,41 For this, 5 g of β-cyclodextrin were dissolved in 450 mL of sodium phosphate buffer (0.05 M, pH 6.8). Then 0.08 g of TEMPO (0.1 mmol g−1) and 5.65 g sodium chlorite (80%, 10 mmol) were added to the cyclodextrin solution. Simultaneously, the 2 M sodium hypochlorite stock solution was diluted to a 0.1 M in the same buffer and 23 mL of this dilution were added in one step to the reactive solution to obtain a final concentration of 5 mmol (1.0 mmol NaClO per g of CD). The reaction was conducted in a closed flask for 19.5 h under ambient condition and a constant stirring of 500 rpm. After modification, TEMPO-oxidize β-cyclodextrin (TOCD) was purified by dialysis against ultrapure water (18.2 Ω) in a 100–500 Da dialysis membrane tube, then freeze-dried.2.3. Synthesis of chitosan–cyclodextrin polymers (Ch–TOCD)
The synthesis of Ch-TOCD was performed considering a 2![[thin space (1/6-em)]](https://www.rsc.org/images/entities/char_2009.gif) :
:![[thin space (1/6-em)]](https://www.rsc.org/images/entities/char_2009.gif) 1 molar ratio of the functional groups COOH
1 molar ratio of the functional groups COOH![[thin space (1/6-em)]](https://www.rsc.org/images/entities/char_2009.gif) :
:![[thin space (1/6-em)]](https://www.rsc.org/images/entities/char_2009.gif) NH (TOCD
NH (TOCD![[thin space (1/6-em)]](https://www.rsc.org/images/entities/char_2009.gif) :
:![[thin space (1/6-em)]](https://www.rsc.org/images/entities/char_2009.gif) Ch) in a total of 50 mL volume with the same steps sequence. First, the TOCD was dissolved in 1% acetic acid (125 mg) to obtain a final concentration of 0.05%, then pre-dissolved EDC was added to obtain a final concentration of 0.05 M EDC and let stir before adding a pre-dissolved NHS to obtain a final concentration of 0.2 M NHS. From a stock solution of chitosan (1% in 1% acetic acid, w/w), the corresponding milliliters were added to obtain a 0.05% solution. The reaction was left for 24 h before stopping it by adding ethanol–amide (61 μL) to obtain a final concentration of 0.1 M. Purification and concentration was done by five washings in 50 kDa Pall-membrane centrifugation tubes (Macrosep Advance Centrifugal Device, Pall Corporation) at 3000 rpm for 45 min each time.
Ch) in a total of 50 mL volume with the same steps sequence. First, the TOCD was dissolved in 1% acetic acid (125 mg) to obtain a final concentration of 0.05%, then pre-dissolved EDC was added to obtain a final concentration of 0.05 M EDC and let stir before adding a pre-dissolved NHS to obtain a final concentration of 0.2 M NHS. From a stock solution of chitosan (1% in 1% acetic acid, w/w), the corresponding milliliters were added to obtain a 0.05% solution. The reaction was left for 24 h before stopping it by adding ethanol–amide (61 μL) to obtain a final concentration of 0.1 M. Purification and concentration was done by five washings in 50 kDa Pall-membrane centrifugation tubes (Macrosep Advance Centrifugal Device, Pall Corporation) at 3000 rpm for 45 min each time.
2.4. Delignified wood aerogels (nanowood) production
Wood pieces cut perpendicularly to the growth axis (10 × 10 × 3 mm) were immersed in 100 mL of 2.5 M NaOH, 0.4 M Na2SO3 and left boil for 8 h. Thereafter, the samples were rinsed with hot water and placed in another 100 mL of 2.5 M H2O2 and boiled for 1 h. The samples were then rinsed with cold DI water and placed in ethanol overnight to eliminate water excess. Solvent was then exchanged 3–4 times with fresh isopropanol and left overnight; the same was done with octane which was left to air dry after overnight exchange (ca. 72 h).2.5. Coating of wood aerogels
Treated dry wood pieces were immersed in 10 mL of 50 mM acetate buffer pH 5 (ionic strength was adjusted to the same molarity with NaCl) containing 0.5 mg mL−1 of the Ch–CD polymer. The nanowood was left in the solution for 24 h, then they were rinsed with ultrapure water until no changes in conductivity were measured.2.6. Inverse gas chromatography (IGC)
For all experiments, approximately 100 mg of each sample were packed into individual silanized glass columns (300 mm long by 4 mm inner diameter). Each column was conditioned for a period of 1 hour at 40 °C and 0% RH with nitrogen gas prior to any measurements. All experiments were conducted at 40 °C with 5 mL min−1 total flow rate of nitrogen gas, using methane for dead volume corrections. Samples were run at a series of surface coverages with n-alkanes (nonane, octane, heptane, and hexane; Aldrich, HPLC grade) and polar probe molecules (acetone, ethanol, acetonitrile, ethyl acetate, and dichloromethane; Aldrich, HPLC grade) to determine the dispersive surface energy as well as the specific free energies of adsorption, respectively. The complete IGC experiment over all surface coverages measured took approximately 24 h for one sample. Repeat experiments were completed in succession on the same column to investigate if the elapsed time or exposure to vapors caused any measurable surface changes. Dispersive surface energy values were repeatable within ±1.0 mJ m−2 and acid–base surface energy values were repeatable within ± 0.5 mJ m−2. For specific surface area determination, an appropriate isotherm with toluene was collected (type II behavior with several points between 0.05 and 0.35P/P0) at 40 °C. The traditional BET equation was used to calculate surface area.42 BET surface areas are commonly measured using nitrogen sorption at cryogenic conditions. However, the use of IGC for BET surface area determination at atmospheric conditions has shown to be more suitable for organic, polymeric and natural materials that could be altered by exposing them to vacuum and cryogenic conditions.43 The BET equation was applied and optimized for linear fit for all data points between 0.05 and 0.35P/P0. All surface energy and surface area analyses were carried out using iGC Surface Energy Analyzer (SMS, Alperton, UK) and the data were analyzed using both standard and advanced SEA Analysis Software.2.7. Adsorption of microcystin-LR (MC)
High Performance Liquid Chromatography (HPLC). For the analysis of the adsorption of the untreated wood, nanowood and coated nanowood of the microcystin, the materials were placed in 28 mL of solutions containing 5.4 μg mL−1 at room temperature and constant stirring. 150 μL aliquots were taken at the corresponding time and analysed in a Waters Alliance HPLC (Model No. e2695, Waters Corp., Milford, MA, USA) system equipped with a solvent management system 2695 and detected by a photodiode array detector (PDA, 2998). The system also counts with a thermostatically controlled column compartment and an autosampler. The method used was adapted from the one described by Meriluoto & Spoof.44 Briefly, a C-18 column (55 × 4 mm) was used as stationary phase, and 0.05% trifluoroacetic acid (TFA) aqueous solution/0.05% TFA acetonitrile with linear gradient at a flow rate of 1 mL min−1, and 10 μL injections using the autosampler in cycles of 9 min. The retention time was 4.2 min and correlation of the samples to the standard curve was of 0.9997. All experiments were done by triplicates and averaged. The analysis of the data was performed using Empower® 3 software (Waters Corp., Milford, MA, USA).The data was then the fitting of the data to calculate rate constants (k1 and k2) and adsorbed amounts in equilibrium (qe) was done for a pseudo-second order models when possible following the equations.45
 | (1) |
2.8. Characterization
| DO = 162(V2 − V1)c/[w − 36(V2 − V1)c] | (2) |
 | (3) |
 | (4) |
 | (5) |
3. Results and discussion
3.1. TEMPO oxidation of β-cyclodextrin and grafting to chitosan
One of the first indications of the success of the reaction was the red tint that the product acquired when frozen after the dialysis. When the titration was done to investigate the degree of oxidation (DO), the inflexion points were visualized by doing a second derivative to the pH curve. In Fig. 1 it can be observed that the 13 and 18 mL, which after applying the eqn (1) gave a DO of 0.27, which considering that only the hydroxyl groups from C6 can be modified48 equals that 2 of every 7 glucose units are modified, or 2 on each β-cyclodextrin.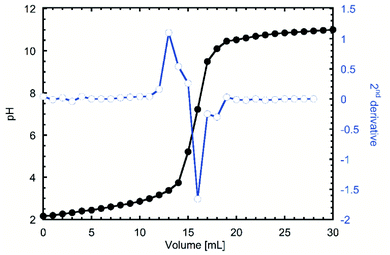 | ||
| Fig. 1 pH titration of TEMPO oxidized β-cyclodextrin (TOCD) and 2nd derivative to identify inflexion groups for DO determination. | ||
After determination of the DO on the TO–CD, the reaction with chitosan was calculated to be done into a 2![[thin space (1/6-em)]](https://www.rsc.org/images/entities/char_2009.gif) :
:![[thin space (1/6-em)]](https://www.rsc.org/images/entities/char_2009.gif) 1 molar ratio between the amino and carboxyl groups. One of the main differences was the solubility in water of the modified Ch–CD, that did not need an acid pH to solubilized like the pure chitosan did. As a first test, C% and N% were calculated by elemental analysis testing, showing a C
1 molar ratio between the amino and carboxyl groups. One of the main differences was the solubility in water of the modified Ch–CD, that did not need an acid pH to solubilized like the pure chitosan did. As a first test, C% and N% were calculated by elemental analysis testing, showing a C![[thin space (1/6-em)]](https://www.rsc.org/images/entities/char_2009.gif) :
:![[thin space (1/6-em)]](https://www.rsc.org/images/entities/char_2009.gif) N ratio of 6.41 ± 0.01 for chitosan and 8.95 ± 0.4 for the grafted co-polymer. When the molecular weight was used as reference to calculate the degree of substitution for the chitosan, the DS was found of 0.57 from a possible maximum of 0.85 considering the degree of deacetylation.
N ratio of 6.41 ± 0.01 for chitosan and 8.95 ± 0.4 for the grafted co-polymer. When the molecular weight was used as reference to calculate the degree of substitution for the chitosan, the DS was found of 0.57 from a possible maximum of 0.85 considering the degree of deacetylation.
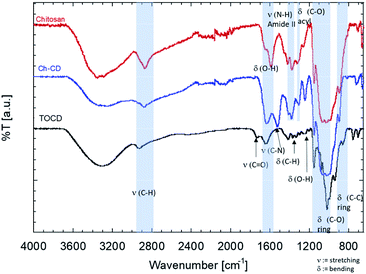
The FTIR-ATR spectra of the samples were also compared (Fig. 2). In there, it can be observed that the stretching C–H (2950–2800 cm−1) and the O–H bending (1600–1590 cm−1) from the grafted material fits in between the signals from the unmodified materials, suggesting the contribution of both species to the signal. The band corresponding to the carboxyl added (1750 cm−1) to CD during the TEMPO mediated oxidation disappeared once it was used to graft them onto the chitosan. This also came with the appearance of the stretching band of the C–N (1490 cm−1), confirming the EDC/NHS reaction. Finally, the bending of the ring of chitosan is kept but a slight shift to the blue is perceptible as a more pronounce shoulder, closer to the signal of the TOCD is seen.
3.2. Characterization of 3D structures
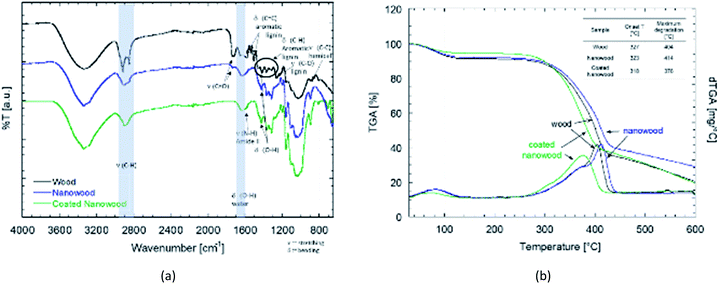
For the chemical characterization, FTIR-ATR and TGA were done after each mayor step to compare the wood with the delignified nanowood and with the nanowood after coating. In the FTIR-ATR spectra showed in Fig. 3a, the most noticeable difference is between the wood and the other two material, as the wood has present the bands related to the aromatic rings of lignin, its side chains, and the side C–O and C–H groups of the hemicelluloses.49 After extraction of most of the lignin, the spectrum is closer to the one of pure cellulose, with the bands related to bending of the polysaccharide rings having the highest intensity. As the coating material is meant to be only at the surface, the intensity of its signal is lower than the ones from the cellulose nanofibrils of the nanowood. However, some changes after coating are clear; first there is a reduction on the C–H stretching close to 2900 cm−1, this as the side groups have a more restricted movement and only the glucose side C–H on sp3 configuration can better absorb. Similarly, there is the apparition of a shoulder close to 1590 cm−1, where the N–H amide stretching should appear, suggesting the presence of chitosan.This modification was also confirmed by the elemental analysis results shown in Table 1. In there, it can be observed that the untreated wood had an average carbon content of 56.02 ± 4.1% and a nitrogen content of 0.055 ± 0.007%, close to values found in other wood-species.50–52 However, for the nanowood, the nitrogen content was removed, confirming the delignification and removal of other nitrogen carrying components besides of the cellulose and hemicelluloses, there the carbon content was of 52.09 ± 2.3%. Then, the after coating, nitrogen was again found in the material with a 0.015 ± 0.007% confirming the addition of the amino groups of the chitosan, the increase was also joined by a decrease on the C% to 47.54 ± 0.2% which is likely a result of the oxygens added with the polysaccharides from the coating.
| Sample | N (%) | C (%) | C/N ratio |
|---|---|---|---|
| Wood | 0.055 ± 0.007 | 56.02 ± 4.1 | 1018.6 |
| Nanowood | 0 | 52.09 ± 2.3 | N/A |
| Coated nanowood | 0.015 ± 0.007 | 47.54 ± 0.2 | 3169.3 |
The difference between the coated and uncoated nanowoods is clearer in the thermogravimetrical analysis (Fig. 3b). Between the wood and the nanowood there is little differences, with only 10 °C higher degradation of the nanowood and higher ash content after. The higher max temperature can be related to a faster degradation on the untreated wood due to the lignin, that when removed allows for a slower degradation as the lignin is not promoting it.53 A contrary effect is observed after the coating, as the Ch–CD on the surface prone to a faster degradation and a stiffer slope than the other two materials, lowering the maximum degradation to 375 °C. The addition of these polysaccharides also lowered the residual content to a similar value than wood.
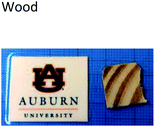
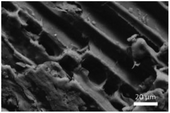
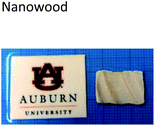
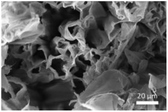
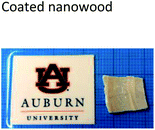
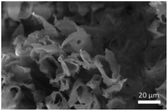
Morphologically wise, the first perceptible change between the samples is the loss of the color after delignification. The nanowood and the coated nanowood have higher dispersion of light, appearing white instead of the natural wood color of the pine wood pieces. Similarly, the density of the samples decreased to almost half after treatment. Furthermore, when the porosity and SEM images (Table 2) are compared between the different stages, the porosity increased about 10% after each step from 55.6 ± 3.28% to 75.1 ± 4.53% after delignification and coating with the Ch–CD. However, the more visible change is perceptible with the SEM images, where the structure changes from plate-like surface to more cell-like structures, where the fibers are now noticeable after the delignification process. The difference is not visible in the SEM images with the molecular coating, but as mentioned above this change can be measured with the changes in porosity, which increased again, probably due to the new cavities introduced by the cyclodextrins.
A clearer result showing the impact of delignification and coating on the wood scaffold are the values from the BET surface area obtained by the IGC.54 IGC allowed to utilize different sorption gasses and avoid under freezing conditions which could affect and collapse the cellulose-based porosity in the materials.54 There, the wood presented a SA of 0.98 m2 g−1, which increased to 2.81 m2 g−1 after delignification, and had a small decrease to 2.71 m2 g−1 after coating. A summary of the BET information can be seen in Table 3.
| Sample | Sorption constant | Monolayer capacity | BET S.A. [m2 g−1] | R2 |
|---|---|---|---|---|
| Wood | 2.60 | 0.0076 | 0.98 | 0.94 |
| Nanowood | 4.87 | 0.0101 | 2.81 | 0.99 |
| Coated nanowood | 1.97 | 0.0087 | 2.71 | 0.91 |
Most significantly, are the changes presented in the surface energy profiles (Fig. 4). Likewise, IGC allows different porous materials to be tested contrasted with the smooth surfaces required for contact angle measurements, alleviating errors that could arise with the absorption of the liquids necessary to calculate surface energy.55 In Fig. 4a, the total surface energy profile is presented. There, it can be observed an increase in the total surface energy after delignification. The delignification treatment utilized to obtain the nanowood resulted in a smoother surface, as suggested by the homogeneity in the surface energy obtained from the nanowood independently of the coverage,56 and confirms what was noted with the SEM. After coating, there is an increase of the total surface energy at the lowest coverage, which then starts to fall as the coverage increases. The high values obtained with lower number of moles of the probe gas can be suggested as a result of the presence of the cyclodextrin on the surface, where more non-polar–non-polar interaction can occur leading to the trapping of the alkaline gases in the active cavities. The decrease of totals surface energy at higher coverages of the coated nanowood compared to the nanowood is most likely related to the adsorption of the coating. The chitosan-based copolymer is interacting with the residual carboxyl and sulfate groups in the surface, as well as interacting by hydrogen bonding, as less a sharper decrease in observed in the total surface energy than in the dispersive surface energy (Fig. 4b). Also, part of this decrease of surface energy can be related to the change in rugosity and heterogeneity of the surface.55
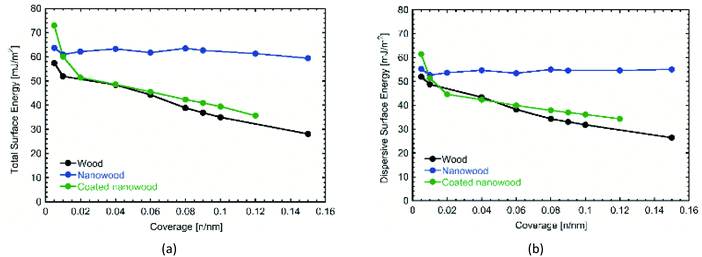 | ||
| Fig. 4 Comparison of (a) total and (b) dispersive surface energies obtained by IGC from wood, nanowood and coated nanowood samples. | ||
The difference between the interactions that each material can allow is also perceptible in their interactions with water when measurements of swelling and water uptake were done. As a first observation, the untreated wood floated during most of the swelling time, even if the mass did not change after sinking. Meanwhile, the nanowood coated and pristine, sank in the first couple minutes.
When the water uptake and swelling values were compared in Fig. 5, the nanowood before coating was the material that was able to uptake the most water, with almost 300% increase in equilibrium, while the untreated wood had only an increment of 100%. After coating, the water uptake of the nanowood decreased to 260%, which also indirectly suggest the surface modification after the adsorption of the Ch–CD material as less attachment points were able to interact correlating with the surface energy calculated. Another interesting trend was that the wood reached stability before the other two materials, in less than 1 h, while the nanowood needed 2 h to reach similar stability.
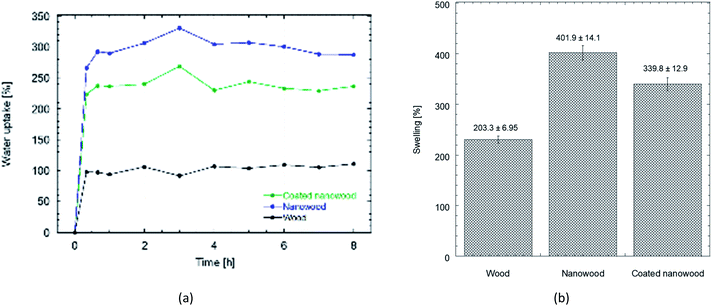 | ||
| Fig. 5 (a) Plot comparing the water uptake on wood, nanowood and coated nanowood and (b) swelling percentage of each material after stability. | ||
When the swelling capacity was plotted (Fig. 5b), and therefore, the capacity of the material to allow water within its structure was monitored, a similar behavior is maintained. There also the nanowood presented the most swelling with 4× increase in its mass, followed by the coated nanowood and the untreated wood in last. This also confirms the trend seen in the BET S.A. and the surface energy, where the nanowood has more porosity and more active points available to interact with the water, while the coated nanowood, despite of having a similar surface area, has less energetic points to adsorb the water.
Reswelling test were also done of the materials. For this, a new solvent exchange was done to the swollen aerogels to dry them once more before letting them reswell on ultrapure water. The redrying was successful with no significant change on the initial mass in either of the three systems, assessing that the coated material remained disregarding the different solvents. Similarly, the masses after swelling were not different to the ones obtained the first time, confirming the possibility of reusing the structures after redrying, even when utilizing solvents to recuperate the molecules captured with the cyclodextrins.
3.3. Microcystin adsorption
To assess the capacity of the coating material to be utilized for the capturing of molecules and the elimination of pollutants, the aerogels were immersed in the solution containing microcystin. In Fig. 6 it can be observed that the wood and nanowood increased the concentration of the pollutant as only water was absorbed into the dry materials, non-microcystin was removed from the solution. This behavior is congruent with other literature where using cellulose-based structures with microcystin45 had no adsorption on the unmodified materials. Furthermore, the water absorption observed is consistent with the swelling times that are presented in Fig. 5.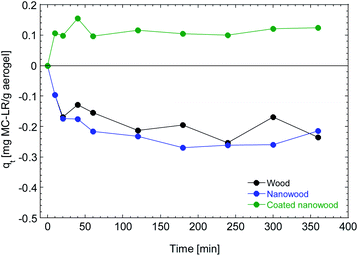 | ||
| Fig. 6 Adsorption kinetic of wood, nanowood and the coated nanowood on a 5.4 μg mL−1 on a solution for 6 h. | ||
In contrast, the nanowood coated with the chitosan–cyclodextrin copolymer presented a clear adsorption since the beginning, with an adsorption peak at 40 min that is then decrease to a more stable value close to the qe that was calculated with the pseudo-second-order kinetic fitting at 0.12 mg g−1.
As mentioned before, the data was fitted into a pseudo-second kinetic model (Fig. 7); this model was selected as the driving mechanism utilized is a chemisorption mechanisms where adsorption times are longer than 30 min, which are usually fitted to the pseudo-first order kinetic model.57 The adsorption for wood and nanowood were then calculated as −0.22 and −0.24 mg g−1 and R2 of 0.92 and 0.97, demonstrating the concentration of the microcystin in the solution. However, for the coated nanowood had a value of adsorption in equilibrium of 0.12 mg g−1 with a fitting of 0.98. Furthermore, the half-time saturation was of only 0.84 min, indicating that the surface area and porosity was enough to allow the toxin to be captured easily without any energy input to force diffusion.
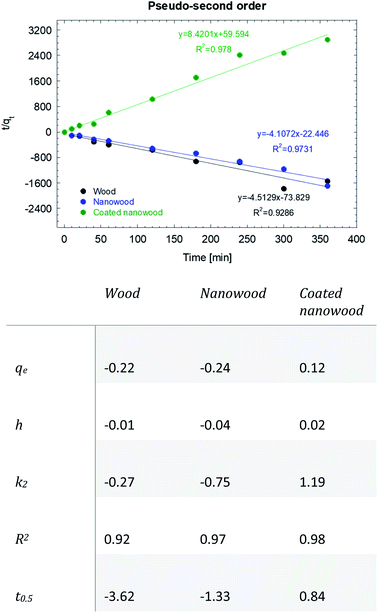 | ||
| Fig. 7 Pseudo-second order kinetic model and data of the adsorption of microcystin-LR with wood, nanowood and the coated nanowood. | ||
The value obtained in equilibrium under this condition (5.4 μg mL−1) was higher that the values achieved in our previous work with initial concentrations of 0.8 and 1.5 μg mL−1,58 but lower than another work where an adsorption of 96 mg g−1 was achieved utilizing a 3.7 μg mL−1 initial concentration, and using a chitosan, cellulose, and [BMIm + Cl] composite.45 It is worth pointing out that the grams by which the adsorption capacity was calculated was the total mass of the coating and the nanowood, and the active materials is only a small fraction of the total weight. The lower value then, can also be attributed to the probability that the scaffold surface was not saturation; however, it can be observed that the coating was successful in capturing the microcystin molecule driven by the hydrophobic cavities added with the coating. Testing with only the coating material were tried, but due to the low water stability of the film formed from the pure coating material, no results could be measured.
The versatility of the coating to adsorb onto cellulosic-based scaffolds without decreasing the surface area, as shown by the BET S.A. calculations, allows for the use of this coating material with different substrates which could be improved to maximize the adsorption of pollutants. Likewise, the method used for drying the nanowood can break the interactions of the toxin and the cyclodextrins without affecting the presence of the coating, allowing for the regeneration of the material, the recovery of the toxin, and the drying in preparation for the next cycles in the same step.
4. Conclusions
This work proves that nano-porous bio-based aerogels can be generated by low-energy input procedures using a top-down approach instead of the more common bottom-up. The delignification of the wood to obtain the nanowood was achieved by a simple process that do not require extensive pressures or hard chemicals. The removal of the lignin allows the wood to increase its swelling 2-folds compared with the untreated wood to up to 400%, and to increase 3-folds its surface area. Furthermore, the solvent exchange process can be done more than once, allowing the easy regeneration of the material.Beside the properties obtained after the delignification, the aerogels were passively coated with the chitosan–cyclodextrin material that increased the surface reactivity by adding a hydrophobic cavity, the coated nanowood proved to be capable of capturing molecules with hydrophobic moieties as exemplified with the capturing of the microcystin toxin without sacrificing much of the surface area or the swelling capacity of the material. Likewise, the drying by solvent exchange allows for the regeneration of the adsorbent while prepping it for reuse. These results indicate that the hypotheses stated for this work were fulfilled, demonstrating that sustainable bio-based systems for water treatment can be obtained from top-down approaches without high energy inputs.
Author contributions
Diego Gomez-Maldonado: conceptualization, methodology, investigation, writing. Autumn M. Reynolds: methodology, investigation, writing. Daniel J. Burnett: investigation, writing. Ramapuram Jayachandra Babu: methodology, resources. Matthew N. Waters: methodology, resources. Maria S. Peresin: conceptualization, methodology, supervision, resources, writing.Conflicts of interest
The authors declare no conflict of interest.Acknowledgements
This work was supported by the National Science Foundation CAREER [award 2119809] through the BMAT program in the Division of Materials Research and the EPSCoR program. Support was also provided by the USDA National Institute of Food and Agriculture, Hatch program [ALA013-17003] and McIntire-Stennis program [1022526]. The support of the Bioenergy Center of Auburn University for the access to their thermogravimetric analyzer is appreciated. Special thanks to Tawsif Rahman.References
- S. Woods, A History of Wood from the Stone Age to the 21st Century, Architect Magazine, accessed 5 May 2020, https://www.architectmagazine.com/technology/products/a-history-of-wood-from-the-stone-age-to-the-21st-century_o.
- R. Munang, I. Thiaw, J. Thompson, D. Ganz, E. Girvetz and M. Rivington, Sustaining Forests : Sustaining forests: Investing in our common future, 2011 Search PubMed.
- J. L. Howard, J. Am. Inst. Archit., 2016, 1965–2013 Search PubMed.
- M. Köhl, R. Lasco, M. Cifuentes, Ö. Jonsson, K. T. Korhonen, P. Mundhenk, J. de Jesus Navar and G. Stinson, For. Ecol. Manage., 2015, 352, 21–34 CrossRef.
- J. L. Howard and S. Liang, U.S. Timber production, trade, consumption, and prices statistics, 1965-2017, FPL-RP-7012019 n.d., 2019, 96 Search PubMed.
- M. C. Iglesias, D. Gomez-Maldonado, B. K. Via, Z. Jiang and M. S. Peresin, For. Prod. J., 2020, 70, 10–21 CAS.
- R. C. Pettersen and R. M. Rowell, in The chemistry of solid wood, ed. R. Rowell, American Chemical Society, Washington, 1984, pp. 57–126 Search PubMed.
- R. Rowell, R. Pettersen and M. Tshabalala, in Handbook of Wood Chemistry and Wood Composites, 2nd edn, 2012, pp. 33–72 Search PubMed.
- H. Sixta, Handbook of pulp, Wiley Online Library, 2006, vol. 1 Search PubMed.
- G. F. Dahl, Process of manufacturing cellulose from wood, US Pat. 000296935, 1884 Search PubMed.
- S. Aila-Suárez, H. M. Palma-Rodríguez, A. I. Rodríguez-Hernández, J. P. Hernández-Uribe, L. A. Bello-Pérez and A. Vargas-Torres, Carbohydr. Polym., 2013, 98, 102–107 CrossRef PubMed.
- K. De France, Z. Zeng, T. Wu and G. Nyström, Adv. Mater., 2021, 33, 2000657, DOI:10.1002/adma.202000657.
- R. Ajdary, B. L. Tardy, B. D. Mattos, L. Bai and O. J. Rojas, Adv. Mater., 2021, 33, 2001085, DOI:10.1002/adma.202001085.
- K. Pillai, F. Navarro Arzate, W. Zhang and S. Renneckar, J. Visualized Exp., 2014, 1–14 Search PubMed.
- J. M. B. Fernandes Diniz, M. H. Gil and J. A. A. M. Castro, Wood Sci. Technol., 2004, 37, 489–494 CrossRef CAS.
- Handbook of Green Materials, ed. K. Oksman, A. P. Mathew, A. Bismarck, O. Rojas and M. Sain, World Scientific, Singapore, 1st edn, 2014, vol. 5 Search PubMed.
- I. Solala, M. C. Iglesias and M. S. Peresin, Cellulose, 2020, 27, 1853–1877 CrossRef CAS.
- C. A. de Assis, M. C. Iglesias, M. Bilodeau, D. Johnson, R. Phillips, M. S. Peresin, E. M. T. Bilek, O. J. Rojas, R. Venditti and R. Gonzalez, Biofuels, Bioprod. Biorefin., 2018, 12, 251–264 CrossRef CAS.
- Z. Chu, P. Zheng, Y. Yang, C. Wang and Z. Yang, Compos. Sci. Technol., 2020, 198, 108320 CrossRef CAS.
- M. Zhu, J. Song, T. Li, A. Gong, Y. Wang, J. Dai, Y. Yao, W. Luo, D. Henderson and L. Hu, Adv. Mater., 2016, 28, 5181–5187 CrossRef CAS PubMed.
- M. B. Wu, S. Huang, C. Liu, J. Wu, S. Agarwal, A. Greiner and Z. K. Xu, J. Mater. Chem. A, 2020, 8, 11354–11361 RSC.
- Y. Li, Q. Fu, R. Rojas, M. Yan, M. Lawoko and L. Berglund, ChemSusChem, 2017, 10, 3445–3451 CrossRef CAS PubMed.
- T. Saito, Y. Nishiyama, J. L. Putaux, M. Vignon and A. Isogai, Biomacromolecules, 2006, 7, 1687–1691 CrossRef CAS PubMed.
- X. Chen, X. Zhu, S. He, L. Hu and Z. J. Ren, Adv. Mater., 2021, 33, 2001240 CrossRef CAS PubMed.
- M. S. Toivonen, A. Kaskela, O. J. Rojas, E. I. Kauppinen and O. Ikkala, Adv. Funct. Mater., 2015, 25, 6618–6626 CrossRef CAS.
- H. Dong, J. F. Snyder, D. T. Tran and J. L. Leadore, Carbohydr. Polym., 2013, 95, 760–767 CrossRef CAS PubMed.
- R. K. Sullivan, M. Erickson and V. A. Oyanedel-Craver, Environ. Sci.: Nano, 2017, 4, 2548–2555 RSC.
- S. Lombardo and A. Villares, Molecules, 2020, 25, 4420 CrossRef CAS PubMed.
- H. Guo, P. Fuchs, E. Cabane, B. Michen, H. Hagendorfer, Y. E. Romanyuk and I. Burgert, Holzforschung, 2016, 70, 699–708 CAS.
- F. Awaja, M. Gilbert, G. Kelly, B. Fox and P. J. Pigram, Prog. Polym. Sci., 2009, 34, 948–968 CrossRef CAS.
- T. Mishima, M. Hisamatsu, W. S. York, K. Teranishi and T. Yamada, Carbohydr. Res., 1998, 308, 389–395 CrossRef CAS.
- H. Orelma, I. Filpponen, L. S. Johansson, J. Laine and O. J. Rojas, Biomacromolecules, 2011, 12, 4311–4318 CrossRef CAS PubMed.
- D. Zeng, J. Wu and J. F. Kennedy, Carbohydr. Polym., 2008, 71, 135–139 CrossRef CAS.
- J. Mao, S. Li, C. He, Y. Tang, Z. Chen, J. Huang and Y. Lai, Cellulose, 2019, 26, 6785–6796 CrossRef CAS.
- M. Prabaharan and J. F. Mano, Macromol. Biosci., 2005, 5, 965–973 CrossRef CAS PubMed.
- H. Orelma, T. Virtanen, S. Spoljaric, J. Lehmonen, J. Seppälä, O. J. Rojas and A. Harlin, Biomacromolecules, 2018, 19, 652–661 CrossRef CAS PubMed.
- S. Smith, K. Goodge, M. Delaney, A. Struzyk, N. Tansey and M. Frey, Nanomaterials, 2020, 10, 1–39 CrossRef CAS PubMed.
- M. S. Toivonen, S. Kurki-Suonio, F. H. Schacher, S. Hietala, O. J. Rojas and O. Ikkala, Biomacromolecules, 2015, 16, 1062–1071 CrossRef CAS PubMed.
- A. S. Archimandritis, T. Papadimitriou, K. A. Kormas, C. S. Laspidou, K. Yannakopoulou and Y. G. Lazarou, Sustainable Chem. Pharm., 2016, 3, 25–32 CrossRef CAS.
- D. Gomez-Maldonado, I. B. Vega Erramuspe, I. Filpponen, L.-S. Johansson, S. Lombardo, J. Zhu, W. Thielemans and M. S. Peresin, Polymers, 2019, 11, 2075 CrossRef CAS PubMed.
- T. Saito, M. Hirota, N. Tamura, S. Kimura, H. Fukuzumi, L. Heux and A. Isogai, Biomacromolecules, 2009, 10, 1992–1996 CrossRef CAS PubMed.
- S. Brunauer, P. H. Emmett and E. Teller, J. Am. Chem. Soc., 1938, 60, 309–319 CrossRef CAS.
- A. Kondor, A. Santmarti, A. Mautner, D. Williams, A. Bismarck and K.-Y. Lee, Front. Chem. Eng., 2021, 3, 1–12 Search PubMed.
- J. Meriluoto and G. A. Codd, Cyanobacterial Monitoring and Cyanotoxin Analysis, 2005 Search PubMed.
- C. D. Tran, S. Duri, A. Delneri and M. Franko, J. Hazard. Mater., 2013, 253, 355–366 CrossRef PubMed.
- D. da Silva Perez, S. Montanari and M. R. Vignon, Biomacromolecules, 2003, 4, 1417–1425 CrossRef CAS PubMed.
- H. Sehaqui, Q. Zhou and L. A. Berglund, Compos. Sci. Technol., 2011, 71, 1593–1599 CrossRef CAS.
- T. Saito, I. Shibata, A. Isogai, N. Suguri and N. Sumikawa, Carbohydr. Polym., 2005, 61, 414–419 CrossRef CAS.
- V. Emmanuel, B. Odile and R. Céline, Spectrochim. Acta, Part A, 2015, 136, 1255–1259 CrossRef CAS PubMed.
- C. Martius, Holz Roh- Werkst., 1992, 50, 300–303 CrossRef CAS.
- B. Waliszewska, W. Pradzynski, M. Zborowska, A. Stachowiak-Wencek, H. Waliszewska and A. Spak-Dzwigala, Ann. Warsaw Univ. Life Sci.–SGGW, For. Wood Technol., 2015, 91, 182–187 CAS.
- M. S. Strickland, E. Osburn, C. Lauber, N. Fierer and M. A. Bradford, Funct. Ecol., 2009, 23, 627–636 CrossRef.
- M. C. Iglesias, F. Hamade, B. Aksoy, Z. Jiang, V. A. Davis and M. S. Peresin, BioResources, 2021, 16, 4831–4845 CAS.
- A. Kondor, A. Santmarti, A. Mautner, D. Williams, A. Bismarck and K.-Y. Lee, Front. Chem. Eng., 2021, 3, 1–12 Search PubMed.
- J. Yu, X. Lu, C. Yang, B. Du, S. Wang and Z. Ye, IOP Conf. Ser.: Mater. Sci. Eng., 2017, 242, 012001 Search PubMed.
- J. M. Martinez-Alejo, Y. Benavent-Gil, C. M. Rosell, T. Carvajal and M. M. Martinez, Carbohydr. Polym., 2018, 200, 543–551 CrossRef CAS PubMed.
- Adsorption: Fundamental Processes and Applications, ed. M. Ghaedi, Academic Press, London, UK, 1st edn, 2021 Search PubMed.
- D. Gomez-Maldonado, A. M. Reynolds, L.-S. Johansson, D. J. Burnett, J. B. Ramapuram, M. N. Waters, I. B. Vega Erramuspe and M. S. Peresin, J. Porous Mater., 2021, 28, 1725–1736 CrossRef CAS.
| This journal is © The Royal Society of Chemistry 2022 |

