 Open Access Article
Experimental study of the effects of a magnetic field/magnetic field-ferromagnetic nanocomposite pour point depressant on wax deposition†
Chuanshuo Wang a,
Yang Liu
 *a,
Shanwei Hub,
Xiaofang Lv
 *a,
Biao Zhaoc,
Qianli Maa and
Shidong Zhou
 a
a
aJiangsu Key Laboratory of Oil and Gas Storage and Transportation Technology, Changzhou University, Changzhou, 213164, P. R. China. E-mail: liu.y@cczu.edu.cn; lvxiaofang5@cczu.edu.cn
bChina Oil & Gas Pipeline Network Corporation Comprehensive Supervision Department, Beijing, 100013, P. R. China
cNo. 9 Plantform of CHANGQING Oilfield, Yinchuan, 750001, P. R. China
First published on 19th February 2024
Abstract
A magnetic field and pour point depressant, as a new avenue for improving the submarine pipeline flow of waxy oils, has attracted increasing attention along with the development of efficient wax mitigation techniques. Although advances have been made recently in understanding the rheological behavior and crystallization properties of waxy oils, the effect of magnetic field and pour point depressants on wax deposition remains an open question. In this work, a ferromagnetic nanocomposite pour point depressant (FNPPD) was prepared. The variations in wax deposition mass and component under the effect of different magnetic treatments and magnetic field-FNPPDs were investigated using cold fingers and high-temperature gas chromatography. It was evident that both the high-intensity and high-frequency magnetic fields generated by the magnet and magnetic coil can effectively reduce the deposition mass and have a long-term magnetic history effect. The synergistic effect of magnetic fields and FNPPDs concurrently reduced the thickness/mass and wax content in the deposition layer, as compared to the individual use of magnetic fields or FNPPDs. The wax precipitation properties and wax crystal morphology of waxy oils under the action of the magnetic field were characterized by differential scanning calorimetry, focused beam reflectance measurement and polarizing microscopy experiments, and the mechanism of the magnetic field was elaborated from the perspective of crystallization kinetics by combining the fitting analysis of Avrami and size-independent growth model.
1. Introduction
The prevalence of wax deposition raises a very urgent need in the field of the flow assurance of waxy oils in pipelines to explore wax mitigation techniques including various physical (heating, electric and magnetic fields, and mixing/dilution)1,2 and chemical treatments (pour point depressants and microorganisms).3,4 The magnetic fields and pour point depressants have recently received attention due to their cost-effectiveness compared to other techniques.5,6 The magnetic fields used in waxy oils mainly include electromagnetic coils and permanent magnets.7,8 Based on these two types of magnetic processing equipment, scholars have explored the influencing factors of magnetic field intensity, frequency, treatment temperature and time, etc.9–11Chen et al.12 measured the viscosity of a variety of Chinese crude oils using a magnetic rheometer at different magnetic field intensities (0–1 T). At 1 T, the viscosity of highly paraffinic oil and heavy oil was comparatively low, and the viscosity reduction efficiency could reach 13–26%. The viscosity reduction mechanism of the magnetic field was proposed by the morphology of suspended crude oil particles. Other factors are also thought to affect magnetic treatment efficiency.13 The viscosity of waxy oils under different magnetic treatment conditions such as treatment temperature, shear rate, and intensity of magnetic field were compared.14,15 The viscosity reduction efficiency increased with the decrease in magnetic treatment temperature or shear rate. Through the cold finger wax deposition experiment, Wen et al.15 preliminarily found the inhibition of magnetic treatment on wax deposition mass and rate. It was suggested that the magnetic field promoting the nucleation of wax crystal was the major cause of reducing viscosity and inhibiting deposition of magnetized oil, as observed using a polarizing microscope. In addition to the magnetic coil used by these scholars, Nguyen et al.16 studied the deposition and viscosity reduction efficiency of Vietnam crude oil under the action of neodymium–iron–boron (Nd–Fe–B) magnets. A few seconds (<5 s) of magnetization treatment can effectively reduce the viscosity, and the magnet inhibition deposition efficiency can reach 20–25% in a flowline apparatus. It was also found that magnetic treatment has a better viscosity reduction effect on waxy crude oil with high resin and asphaltene contents.
The magnetic field frequency has been paid sufficient attention in most previous studies and it deserves further investigation. The thermal effect of high-frequency magnetic field was widely used due to its uniform heating, energy conservation, high efficiency, and controllable process.17–19 The synergistic application of ferromagnetic nanoparticles and a high-frequency magnetic field on the biomedical industry is certainly the most mature, mainly used in organ transplantation,20,21 cancer treatment,22,23 and so on.
Andreina et al.24 found that the magnetocaloric effect was decided by the intensity and frequency of the magnetic field rather than the nanoparticle size and composition. Ferromagnetic Fe3O4 nanoparticles (10 mg Fe per mL) can achieve high-temperature rise rates of up to 321 °C min−1 under the 42.5 kA m−1, 278 kHz alternating magnetic field. Prachi et al.25 first tried to apply the magnetocaloric effect for flow assurance in subsea flowlines. He embedded ferromagnetic Fe3O4 nanoparticles into the inner wall coating of the submarine pipe. Under the action of the high-frequency alternating magnetic field, the nano-coating on the inner surface of the pipeline can generate heat, so as to prevent the formation of methane hydrate and wax. It was found that ferromagnetic Fe3O4 nanoparticles dispersed in solutions or embedded in the coating had a similar magnetocaloric effect. The magnetocaloric efficiency of pipelines in the flowing state was about 5–8 times higher than that in the static state. The synergy of magnetic field and pour point depressant can provide a new way for inhibition of wax deposition in oil and gas pipelines. Huang et al.26 studied the effects of magnetic field intensity and frequency on the yield stress of waxy oils and waxy oils with nanocomposite pour point depressants under an alternating magnetic field. The reduction rate of yield stress of magnetized doped waxy oils up to 80% was double that of waxy oils under the magnetic field.
The inhibition of magnetic treatment on wax deposition motivated extensive research, which nevertheless did not culminate in a satisfactory understanding of the characteristics and mechanism of wax deposition layer under magnetic treatment. Moreover, the effect of magnetic field-ferromagnetic nanocomposite pour point depressant (FNPPD) synergy on wax deposition remains an open question. In this article, the effects of different magnetic treatments (high-frequency electromagnetic coil and Nd–Fe–B magnet) and magnetic field-FNPPD on the variation in wax deposition mass and component were investigated using cold fingers and HTGC. The FNPPD hybrid of nano iron oxide particles and EVA copolymers was prepared, and the deposition characteristics of waxy oils under the synergistic action of magnetic field and FNPPD were explored. The combined wax precipitation characteristic experiments, Avrami and size-independent growth theory, were used to analyze the mechanism of the magnetic field on wax deposition.
2. Materials and methods
2.1. Materials
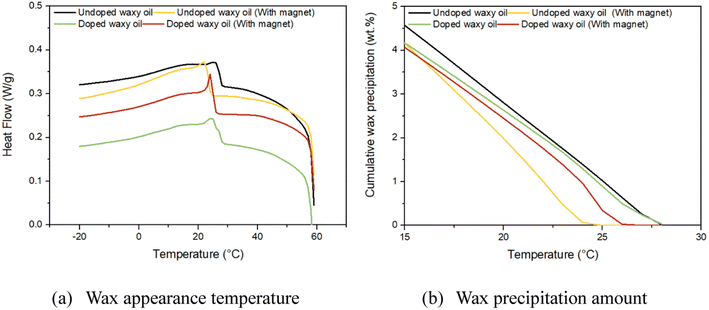
The waxy oil contained 10 wt% paraffin wax and model oil (D80) with a wax appearance temperature of 28.3 °C (Fig. 9a). At 35 °C, the viscosity was 1.18 mPa s. The paraffin wax was produced by Daqing Refining and Chemical Company, with a carbon number distribution range of C25–C41.27 The wax precipitation characteristic curve of the waxy model oil at different temperatures is shown in Fig. 9b.The ferromagnetic nanocomposite pour point depressant (FNPPD) used in our experiments was synthesized by the ultrasonic blending of organically modified ferromagnetism nanoparticles Fe3O4 and ethylene/vinyl acetate copolymers. Ferromagnetism nanoparticles Fe3O4 (20 nm) and ethylene/vinyl acetate copolymers (VA content 32 wt%) were purchased from Beijing InnoChem Science & Technology Co., Ltd. In order to improve the dispersion of nanoparticles, organically modified magnetic nanoparticles were prepared by a modified silica coating method, which was obtained by hydrolysis of tetraethyl orthosilicate and methacryloxy propyl trimethoxy silane and followed by the surface radical polymerization reaction of methyl methacrylate. For more details on synthetic processes and methodologies of the FNPPD, we referred the reader to recent articles by Frickel et al.28 and Nayeem et al.29 To ensure the homogeneity of the nanocomposites, EVA copolymers were dissolved in a D130 model oil at a concentration of 3 wt%, followed by ultrasonic processing with organically modified ferromagnetism nanoparticles at 40 kHz for 2 h. Then, EVA copolymers and nanoparticles in a mass ratio of 5/1 were added to the waxy oil for our experiments.
2.2. Methods
| Conditions | Parameters |
|---|---|
| Samples | (1) Undoped waxy oil, (2) waxy oil with 50 ppm FNPPD (doped waxy oil), (3) undoped waxy oil with magnet treatment, (4) doped waxy oil with magnet treatment, (5) undoped waxy oil with magnetic coil treatment, (6) doped waxy oil with magnetic coil treatment |
| Temperature | Oil temperature 35 °C, wall temperature 15 °C |
| Magnetic treatment | Processing at 40 °C for 10 s |
| Stirring speed | 300 rpm |
| Time | 0.5, 1, 3, 6, 9 h |
A circular neodymium–iron–boron magnet with a diameter of 25 mm and a thickness of 6.9 mm was used to generate a high-intensity magnetic field. The magnetic field intensity of the magnet tested using a Gauss meter was 50 mT (range: 200 mT; accuracy: ±2.0%).
A variable frequency power supply-magnetic coil system BTG-15 KW made in China was used to generate a high-frequency oscillating magnetic field (ESI Material A†). The power supply provides alternating current to the coil with a varying frequency between 30 and 100 kHz, thereby generating an oscillating magnetic field inside the coil. The oscillation frequency and magnetic field intensity are closely related to the coil structure. A ten-turn coil (radius: 5 cm; height: 13 cm) was used to produce a 50 kHz field. The magnetic field intensity in the center of the coil is 5 mT.
The wax crystal size, number, and morphology can be performed in different ways (shear histories, thermal conditions, etc.), all of which strongly and directly affect the morphology of waxy crystals. In all the experiments, the beaker for the oil sample was equipped with a circulating water bath and an agitator, so that the cooling process and stirring speeds could be controlled. Before characterization and observation, the oil sample was cooled from 35 °C to 15 °C. The cooling rate was maintained constant at 0.5 °C min−1 via the same pump speed of the water bath (F25 Julabo, Germany). In order to compare and analyze the wax crystal of the experimental sample in a flowing state, the stirring speed was set to the same value (300 rpm) for different oil samples. After the constant temperature at 15 °C for 5 min, we started recording the number and size of crystals. Finally, we dipped the oil sample in the experimental beaker with a dropper and dropped it on the slide. A 20× magnification objective lens was used to observe the morphology of waxy crystals. Sampling and observation were repeated.
2.2.6.1 Avrami. Avrami equation is the well-known principle to gain insights into such crystallization kinetics.31–33 Continuing efforts have been dedicated to deducing and simplifying Avrami's original equation,34,35 especially application in bulk crystallization. For waxy oils,36,37 the Avrami equation can be written as follows:
log[−ln(1 − X(t))] = log![[thin space (1/6-em)]](https://www.rsc.org/images/entities/char_2009.gif) K + nlog(t) K + nlog(t)
| (1) |
ln![[thin space (1/6-em)]](https://www.rsc.org/images/entities/char_2009.gif) n(L) = ln n(L) = ln![[thin space (1/6-em)]](https://www.rsc.org/images/entities/char_2009.gif) n0 − L/Gτ n0 − L/Gτ
| (2) |
| B = n0G | (3) |
![[thin space (1/6-em)]](https://www.rsc.org/images/entities/char_2009.gif) n0 and slope −1/(G) were obtained. For the known average residence time of crystal suspensions, the calculation results of nucleation rate and growth rate of undoped/doped waxy oils before and after magnetic field treatment can be obtained. This has important consequences for our understanding of the mechanism of wax deposition under the action of the magnetic field.
n0 and slope −1/(G) were obtained. For the known average residence time of crystal suspensions, the calculation results of nucleation rate and growth rate of undoped/doped waxy oils before and after magnetic field treatment can be obtained. This has important consequences for our understanding of the mechanism of wax deposition under the action of the magnetic field.3. Results and discussion
3.1. Wax deposition mass
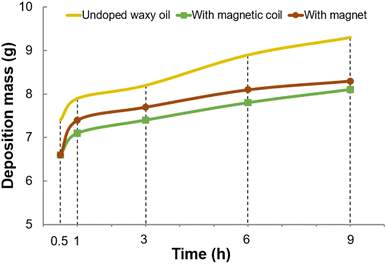
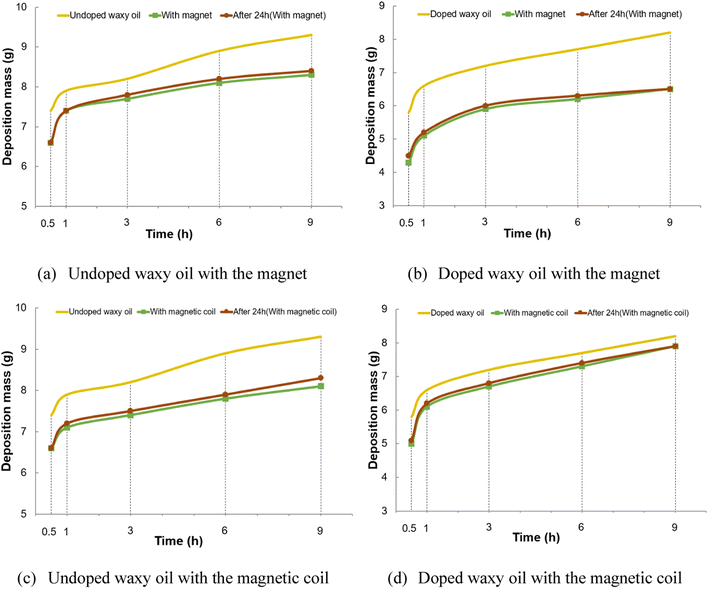
As shown in Fig. 1, the growth curve of the deposition layer after wax oil treatment with a magnet or magnetic coil is positioned farther to below the undoped waxy oil. The growth of wax deposition layers was inhibited by magnetic treatment at different deposition times. For example, at 9 h, the wax deposition mass decreased from 9.3 g to 8.3 g and 8.1 g under the action of the magnet and magnetic coil, respectively. The wax deposition mass inhibition efficiency was 10.75% (with magnet) and 12.90% (with magnetic coil). These results indicated that high temperature (above the wax appearance temperature), short time (10 s), and off-line magnetic treatment can effectively inhibit wax deposition.After long-distance and time-consuming pipeline transportation, the temperature of magnetized oil near the pipe wall will decrease below the wax precipitation point, making the dissolved waxy molecules crystallized and deposited near the pipe wall. It is of interest to investigate the historical effects of magnetic treatment, which is accomplished by wax deposition experiments with magnetic treatment and left at room temperature for 24 h. The growth curves of wax deposition after magnetic treatment without resting and after resting for 24 h almost overlap, covering both the undoped/doped waxy oil and magnetic treatment with magnet/magnetic coil (Fig. 2). It was shown that both the high-intensity and high-frequency magnetic fields generated by the magnet and magnetic coil have historical effects. The obtained experimental results demonstrated the promising prospects of magnetic processing applications.
Additionally, the effect of wax deposition mass inhibition by the combined magnetic field and FNPPD was investigated.
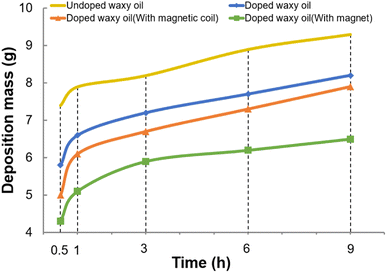
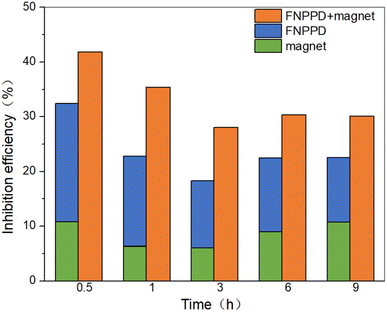
The experimental data presented in Fig. 3 provided that the magnetic field can further improve the wax deposition mass efficiency of the FNPPD. The deposition mass of the doped waxy oil with the magnet or magnetic coil treatment was less than that of the doped waxy oil. As can be seen, by comparison to the result in Fig. 3, the wax deposition mass of the doped waxy oil with the magnetic coil is larger than that of the doped waxy oil with the magnet. The combined action of the magnet and FNPPD has a better suppression effect on the wax deposition mass compared to the magnetic coil. It is important to point out that the magnetocaloric effect of the magnetic coil might cause the oil temperature to rise (the doped waxy oil can be rapidly heated from 40 °C to around 80 °C with the 10 s magnetic coil treatment), disentanglement of EVA copolymers and destabilization of the structure of FNPPD, thus resulting in the magnetic coil and agent working together poorly.4,6 For instance, the 9 h deposition mass of the doped waxy oil (with 50 ppm FNPPD) under the action of the magnet and magnetic coil was 6.5 g and 7.9 g, and the wax deposition inhibition efficiency was 30.11% and 15.05%, respectively. Moreover, we noted that the wax inhibition efficiency was up to 30.11% with the combined action of magnet and FNPPD, and its inhibition efficiency is about triple that of a single magnetic treatment or FNPPD. The 9 h deposition mass inhibition efficiency of the undoped waxy oil by the magnet and FNPPD was 10.75% and 11.83%, respectively. It is estimated that the 30.11% inhibition efficiency of wax deposition mass under the combined action of magnet and FNPPD exceeds the sum of the magnetic treatment and FNPPD (10.75% + 11.83% = 22.58%) by about 7.5%. This combination acts in synergy to inhibit wax deposition. A similar rule, shown in Fig. 4, exists for the other deposition time.
3.2. Wax deposition components
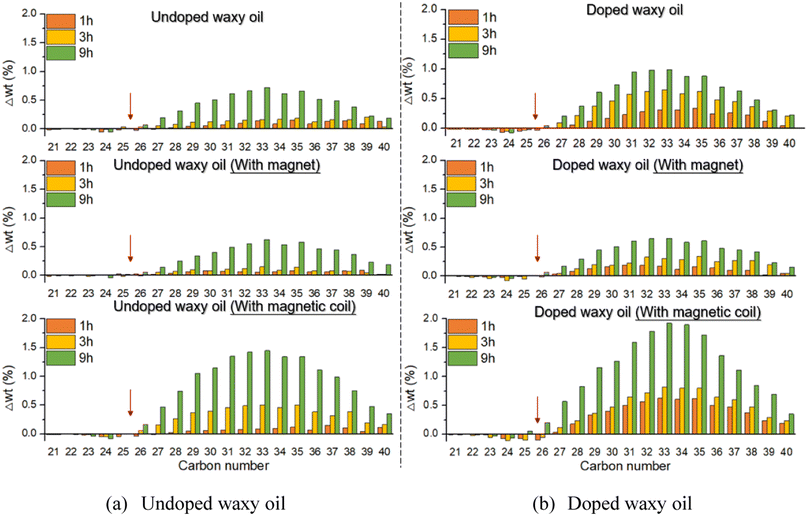
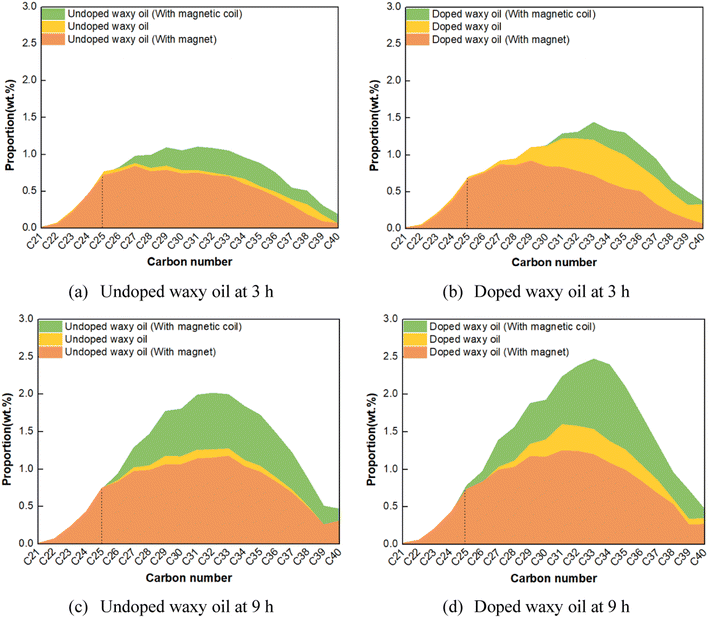
The composition attributes of the wax deposition layer such as the critical carbon number, carbon number distribution and wax content (sum of the proportion of C ≥ 18 components) were compared under two magnetic treatments via HTGC analysis.As can be seen from Fig. 5 (red arrows), the critical carbon number of wax deposition does not change significantly with the magnetic fields/FNPPD. Contrast differences to deposition components were mainly reflected in the diffusion and deposition of high carbon wax molecules above the critical carbon number (≥C25). Fig. 6 compares the carbon number distribution of the deposition layer of the undoped/doped waxy oil under the action of the magnet or magnetic coil at 3 h and 9 h deposition time.
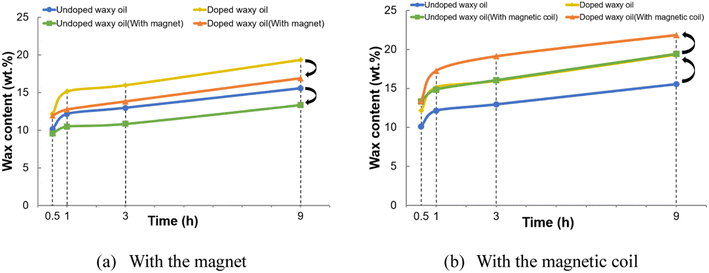
Fig. 6 showed that high levels of the heavy component wax content in the deposition layer were distinctive of the undoped/doped waxy oil with the magnetic coil (green area chart). However, the high-intensity magnetic field generated by the magnet reduced the heavy component wax content in the deposition layer (orange area chart). Complementarily, the summary graph of the total wax content (sum of the proportion of C ≥ 18 components) of the undoped/doped waxy oil deposit layer as a function of time under the action of the magnet and magnetic coil enabled us to verify this argument.
As shown by the black arrows in Fig. 7, the total wax content of the undoped/doped waxy oil deposition layer decreased under the magnet action at different deposition times while an opposite trend was apparent on the magnetic coil. A possible partial explanation of this fact is as follows. The magnetocaloric effect of the magnetic coil might trigger an increase in the oil temperature and the difference between the oil and the wall temperature, leading to an enhanced diffusion drive of wax molecules. Furthermore, the effect of the combination of magnetic field and FNPPD on the wax content of the deposition layers was investigated.
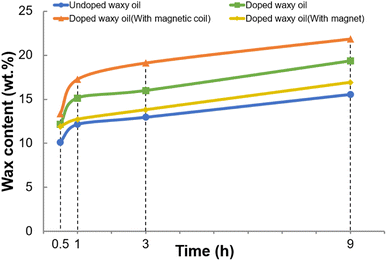
In comparison to the wax content of the deposited layer without magnetic fields, the amount of the doped waxy oil with the magnetic coil was significantly bigger (Fig. 8 orange line). Unsurprisingly, the wax content of the deposited layer would be further increased if the magnetic coil together with the FNPPD was applied to the doped waxy oil. Note that the magnet used in this study can reduce the 9 h wax content of the doped waxy oil deposit layer (Fig. 8 green line and yellow line). In the case of the above-mentioned example, with the magnet, the 9 h wax content of the doped waxy oil deposit layer would decrease from 19.34% (doped waxy oil) to 16.92% (doped waxy oil with the magnet).
 | ||
| Fig. 8 Wax content of the doped waxy oil in the deposition layer under different magnetic treatments. | ||
The synergistic effect between the magnet and the FNPPD appeared, resulting in an increase of 1.36% (undoped waxy oils: 15.56%; doped waxy oils with magnet: 16.92%) to the wax content of the 9 h deposition layer, which is less than that obtained using the FNPPD or magnet alone (3.78–2.22 = 1.56%). In particular, the wax content of the 9 h deposition layer increased by 3.78% (undoped waxy oils: 15.56%; doped waxy oils: 19.34%) and decreased by 2.22% (undoped waxy oils: 15.56%; undoped waxy oils with the magnet: 13.34%) for doped waxy oils and waxy oils with the magnet, respectively. The motivation for this synergistic effect and magnetic field action is related to the wax precipitation properties and crystallization kinetics in general, as discussed below.
3.3. Discussion and analysis
Clearly, using the magnetic treatment enables the undoped/doped waxy oil to reduce the wax appearance temperature and wax precipitation amount (Fig. 9 and Table 2). For the undoped waxy oil, after applying the magnetic treatment, the wax appearance temperature reduced from 28.28 °C to 24.58 °C. The wax appearance temperature, however, reduced from about 28.49 °C to 25.89 °C as the doped waxy oil was treated with magnetic fields in Fig. 9 and Table 2. The percentage of the cumulative percentage wax precipitation at 15 °C (wall temperature) was also included.| Wax appearance temperature, °C | Cumulative percentage wax precipitation at 15 °C, wt% | |
|---|---|---|
| Waxy oil | 28.28 | 4.57 |
| Waxy oil with magnet | 24.58 | 4.16 |
| Waxy oil with FNPPD | 28.49 | 4.17 |
| Waxy oil with magnet-FNPPD | 25.89 | 4.07 |
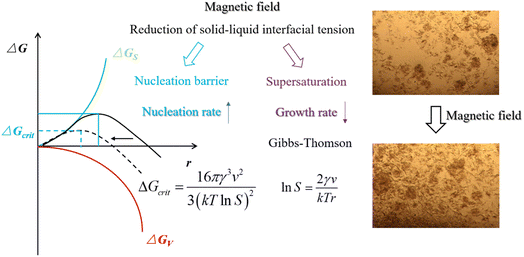
The magnetization energy of the magnetic field reduces solid–liquid interfacial tension and supersaturation.40,41 As a result, the equilibrium concentration (total wax content minus wax precipitation amount) increases and the wax precipitation amount decreases. The thermodynamic theory of wax deposition will also emphasize the variation in wax precipitation characteristics, such as the wax appearance temperature and the amount of wax precipitation as important factors in determining the wax deposition inhibition efficiency. Given the decrease in the wax appearance temperature and wax precipitation amount as a result of using the magnetic field, the mass and component of wax deposition would further be suppressed by the magnet. Due to the minimum amount of wax precipitation with the synergistic effect of the FNPPD and magnetic field, it is feasible in the application to reduce the thickness and hardness of field pipeline deposition.
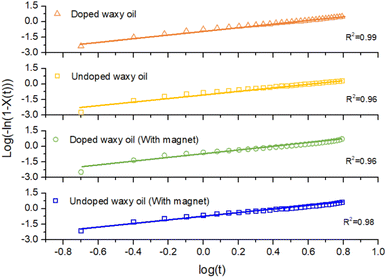
There is some crystallization kinetics information available by analyzing the wax precipitation curves using the Avrami theory, explaining the mechanisms behind inhibiting the wax deposition by the magnetic field. We performed line fitting on the crystallinity regarding wax precipitation amount using least-squares matching, and the fitting diagram is shown in Fig. 10. The R2 value of the Avrami model fitting of different experimental oil samples was greater than or equal to 0.96. This implies that the Avrami theory is a strictly feasible solution to explore the magnetic field action mechanism.
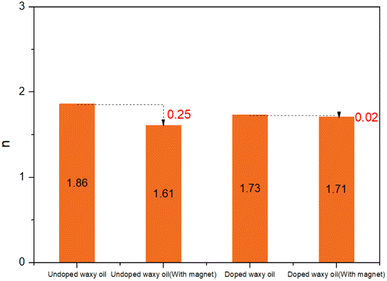
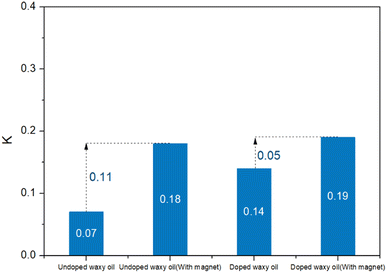
The Avrami index n and crystallization kinetic parameters K obtained from the slope and intercept of the Avrami fitting plot are summarized in Fig. 11 and 12.
The Avrami exponent n is related to the morphological structures of crystals. In general, for polymeric and organic systems, the Avrami exponents are 1, 2, and 3 for needle, disc, and spherical crystals, respectively. As can be seen from Fig. 11, the n values of all four waxy oils were between 1 and 2. The magnetic field or/and FNPPD did not significantly change the crystal morphology, which remained mainly needle and disc-like. However, with the action of the magnetic field, the undoped/doped waxy oil was decreasing slightly in the n value and this decrease will most likely be accompanied by a decrease in wax crystal size. The n value of the undoped waxy oil decreased from 1.86 to 1.61. The n value of the doped waxy oil decreased from 1.73 to 1.71.
The most obvious thing was the K increase in the doped/undoped waxy oil with the action of the magnetic field. Specific results are shown in Fig. 12, where the K value of the undoped waxy oil showed a 1.6-fold increase from 0.07 to 0.18. The doped waxy oil showed an approximately 36% increase from 0.14 to 0.19. The K value was determined by the number and morphology of wax crystals, as described in eqn (4)
| K = gNvn, | (4) |
| Wax crystal number | Wax crystal density, mm−3 | |
|---|---|---|
| Undoped waxy oil | 29987.67 | 0.60 |
| Undoped waxy oil (with magnet) | 44191.48 | 0.88 |
| Doped waxy oil | 61793.33 | 1.24 |
| Doped waxy oil (with magnet) | 62314.44 | 1.25 |
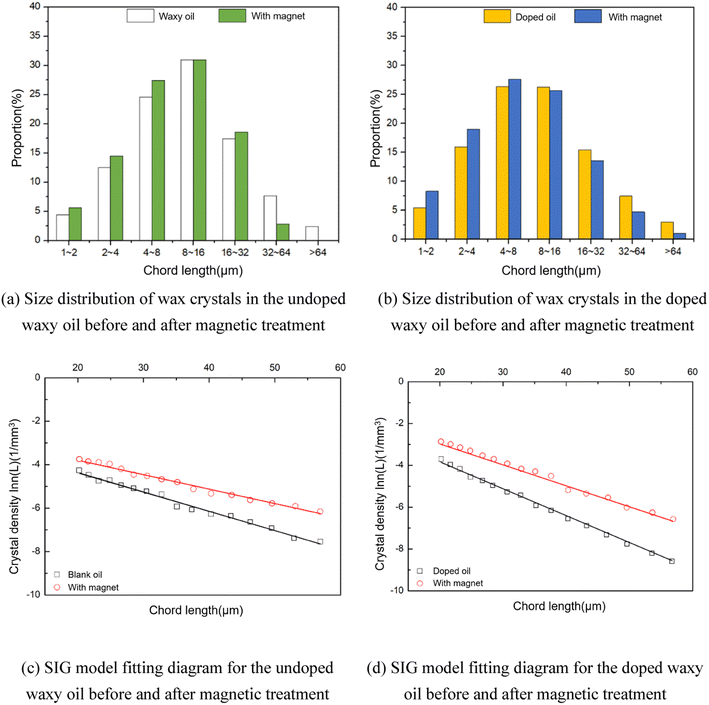
To further elucidate the mechanism of magnetic field action from the perspective of crystallization kinetics, the SIG kinetic model was used to analyze its crystallization nucleation and growth rate parameters. We implemented the linear fitting based on the size distribution of wax crystals, and the fitting results are shown in Fig. 13 and Table 4.
| Fitted equation (L > 20 μm) | R2 | G (m s−1) | B (s−1 m−3) | |
|---|---|---|---|---|
| Undoped waxy oil | ln![[thin space (1/6-em)]](https://www.rsc.org/images/entities/char_2009.gif) n(L) = −2.4701 − 0.0921L n(L) = −2.4701 − 0.0921L |
0.94 | 1.206 × 10⁻⁸ | 1.02 × 10⁹ |
| Undoped waxy oil (with magnet) | ln![[thin space (1/6-em)]](https://www.rsc.org/images/entities/char_2009.gif) n(L) = −2.3508 − 0.0717L n(L) = −2.3508 − 0.0717L |
0.94 | 1.162 × 10⁻⁸ | 1.11 × 10⁹ |
| Doped waxy oil | ln![[thin space (1/6-em)]](https://www.rsc.org/images/entities/char_2009.gif) n(L) = −1.1410 − 0.0998L n(L) = −1.1410 − 0.0998L |
0.92 | 1.113 × 10⁻⁸ | 3.56 × 10⁹ |
| Doped waxy oil (with magnet) | ln![[thin space (1/6-em)]](https://www.rsc.org/images/entities/char_2009.gif) n(L) = −0.9867 − 0.1083L n(L) = −0.9867 − 0.1083L |
0.96 | 1.026 × 10⁻⁸ | 3.82 × 10⁹ |
It can be seen that in all four cases the points and high R2 values reflect a good linear fit, indicating the effectiveness of SIG crystallization kinetics analysis. Comparing the nucleation rate and growth rate results, it was found that under magnetic field treatment, the nucleation rate of the undoped/doped waxy oil increased, while the growth rate decreased. It is possible that the reduction in interfacial tension and free energy due to magnetization energy of the magnetic fields would lead to a reduced nucleation barrier, resulting in a larger nucleation rate and more wax crystals. In addition, there is a decrease in the wax crystal growth rate and wax crystal size on account of a smaller supersaturation with the magnetic field. More importantly, the effect of the magnetic field on the number and morphology of the wax crystals will further weaken their ability to encapsulate oil, and can thus potentially inhibit wax deposition.43 Once the magnetic field was used in conjunction with the FNPPD, the synergistic effect can be shown by a nucleation rate of the relative maxima and minima in the growth rate. Superparamagnetic nano-Fe3O4 in the FNPPD increases the magnetic susceptibility and magnetization energy of waxy oils, further amplifies the magnetic field effect, and thus improves the wax deposition inhibition efficiency.
4. Conclusions
The objectives of this work are to investigate the effect of applying magnetic fields and their combination with a ferromagnetic nanocomposite pour point depressant (FNPPD) on the wax deposition layer, such as wax deposit mass, carbon number distribution, and wax content. Furthermore, we explored the underlying inhibition mechanisms by analysis of wax precipitation characteristics, wax crystal number and size, and crystallization kinetics.The wax deposition mass of waxy oils can be effectively reduced using high-frequency magnetic fields and high-intensity magnetic fields generated by magnetic coils and magnets, even after 24 h resting time. The magnetocaloric effect caused by the high-frequency magnetic field can further promote the wax deposition aging, resulting in an increase in the heavy component wax content and total wax content of the deposition layer. The magnetization energy of the magnetic field caused a drop in the solid–liquid interfacial tension/free energy and wax molecular nucleation barrier, leading to an increase in the crystal number/nucleation rate and a reduction in the growth rate/encapsulated oil amount. Given the decrease of the wax appearance temperature and wax precipitation amount as a result of using the magnetic field, the mass and component of wax deposition would further be suppressed. Note that if the magnetic field-FNPPD was used, there was synergistic inhibition of wax deposition. The detrimental effects of the FNPPD causing an increase in the wax content/hardness in the deposition layer could be reduced by the magnetic field-FNPPD approach.
Nomenclature
| FNPPD | Ferromagnetic nanocomposite pour point depressant |
| Nd–Fe–B | Neodymium–iron–boron |
| EVA | Ethylene/vinyl acetate |
| VA | Vinyl acetate |
| DSC | Differential scanning calorimeter |
| HTGC | High-temperature gas chromatography |
| FBRM | Focused beam reflectance measurement |
| X | Crystallinity |
| t | Time |
| SIG | Size-independent growth |
| n | Crystal density |
| L | Chord length |
| G | Growth rate |
| τ | Mean residence time |
| B | Nucleation rate |
| n | Avrami index |
| K | Crystallization kinetic parameter |
| g | Geometrical factor |
| N | Number of crystals |
| v | Growth rate |
Conflicts of interest
There are no conflicts to declare.Acknowledgements
This work was supported by the National Natural Science Foundation of China (Grant No. 52274061 & 52004039 & 51974037), China Postdoctoral Science Foundation (Grant No.2023T160717 & 2021M693908), CNPC Innovation Found (Grant No. 2022DQ02-0501), Changzhou Applied Basic Research Program (Grant No. CJ20230030), The major project of universities affiliated with Jiangsu Province basic science (natural science) research (Grant No.21KJA440001), The Jiangsu Qinglan Project, Changzhou Longcheng Talent Plan – Youth Science and Technology Talent Recruitment Project.References
- E. Bell, Y. Lu, N. Daraboina and C. Sarica, J. Nat. Gas Sci. Eng., 2021, 88, 103798 CrossRef.
- C. Balan, D. Broboana, E. Gheorghiu and L. Velas, J. Non-Newtonian Fluid Mech., 2008, 154, 22–30 CrossRef CAS.
- Y. Chi, J. Yang, C. Sarica and N. Daraboina, Energy Fuels, 2019, 33, 2797–2809 CrossRef CAS.
- W. Li, H. Li, H. Da and K. Hu, Fuel Process. Technol., 2021, 217, 106817 CrossRef CAS.
- H. Huang, W. Wang, Z. Peng, K. Li, D. Gan, S. Zhang, Y. Ding, H. Wu and J. Gong, J. Pet. Sci. Eng., 2019, 175, 828–837 CrossRef CAS.
- H. Huang, W. Wang, Z. Peng, Y. Ding, K. Li, Q. Li and J. Gong, Fuel, 2018, 221, 257–268 CrossRef CAS.
- H. Huang, W. Wang, Z. Peng, F. Yang, X. Zhang, Y. Ding, K. Li, C. Wang, D. Gan and J. Gong, Langmuir, 2020, 36, 591–599 CrossRef CAS PubMed.
- X. Chen, L. Hou, W. Li, S. Li and Y. Chen, J. Mol. Liq., 2018, 249, 1052–1059 CrossRef CAS.
- R. Tao and X. Xu, Energy Fuels, 2006, 20, 2046–2051 CrossRef CAS.
- F. Homayuni, A. A. Hamidi, A. Vatani, A. A. Shaygani and R. F. Dana, Pet. Sci. Technol., 2011, 29, 2407–2415 CrossRef CAS.
- J. L. Goncalves, A. J. F. Bombard, D. A. W. Soares and G. B. Alcantara, Energy Fuels, 2010, 24, 3144–3149 CrossRef CAS.
- C. Jiang, L. Guo, Y. Li, S. Li, Y. Tian, L. Ma and J. Luo, Colloids Surf., A, 2021, 629, 127372 CrossRef CAS.
- J. L. Goncalves, A. J. F. Bombard, D. A. W. Soares, R. D. M. Carvalho, A. Nascimento, M. R. Silva, G. B. Alcantara, F. Pelegrini, E. D. Vieira, K. R. Pirota, M. I. M. S. Bueno, G. M. S. Lucas and N. O. Rocha, Energy Fuels, 2011, 25, 3537–3543 CrossRef CAS.
- J. Jing, W. Shi, Q. Wang and B. Zhang, Energy Sources, Part A, 2019, 44, 5080–5093 CrossRef.
- W. Shi, J. Jing, Q. Wang and B. Zhang, Pet. Sci. Technol., 2021, 39, 878–895 CrossRef CAS.
- P. T. Nguyen, V. V. Nguyen, Q. K. L. Bui, Q. V. Ngo and V. H. Pham, SPE Asia Pacific Oil and Gas Conference, SPE 68749, 2001 Search PubMed.
- X. Zhang and Y. Zhang, Int. J. Therm. Sci., 2021, 164, 106897 CrossRef CAS.
- C.-H. Park, S.-J. Kang, L. D. Tijing, H. R. Pant and C. S. Kim, Ceram. Int., 2013, 39, 9785–9790 CrossRef CAS.
- A. A. Adewunmi, M. S. Kamal and T. I. Solling, J. Pet. Sci. Eng., 2021, 196, 107680 CrossRef CAS.
- C. A. M. Iglesias, J. C. R. de Araujo, J. Xavier, R. L. Anders, J. M. de Araujo, R. B. da Silva, J. M. Soares, E. L. Brito, L. Streck, J. L. C. Fonseca, C. C. Pla Cid, M. Gamino, E. F. Silva, C. Chesman, M. A. Correa, S. N. de Medeiros and F. Bohn, Sci. Rep., 2021, 11, 11867 CrossRef CAS.
- N. Manuchehrabadi, Z. Gao, J. Zhang, H. L. Ring, Q. Shao, F. Liu, M. McDermott, A. Fok, Y. Rabin, K. G. M. Brockbank, M. Garwood, C. L. Haynes and J. C. Bischof, Sci. Transl. Med., 2017, 9, 379 Search PubMed.
- J.-H. Lee, J.-T. Jang, J.-S. Choi, S. H. Moon, S.-H. Noh, J.-W. Kim, J.-G. Kim, I.-S. Kim, K. I. Park and J. Cheon, Nat. Nanotechnol., 2011, 6, 418–422 CrossRef CAS PubMed.
- M. I. A. Abdel Maksoud, M. M. Ghobashy, A. S. Kodous, R. A. Fahim, A. I. Osman, A. A. H. Al-Muhtaseb, D. W. Rooney, M. A. Mamdouh, N. Nady and A. H. Ashour, Nanotechnol. Rev., 2022, 11, 372–413 CrossRef CAS.
- A. Chiu-Lam, E. Staples, C. J. Pepine and C. Rinaldi, Sci. Adv., 2021, 7, 3005 CrossRef PubMed.
- M. Prachi, H. Chun and L. B. Steven, International Petroleum Technology Conference, 2014, IPTC-18090-MS Search PubMed.
- H. Huang, W. Wang, Z. Peng, K. Li, Y. Ding, W. Yu, D. Gan, C. Wang, Y. Xue and J. Gong, Pet. Sci., 2020, 17, 838–848 CrossRef CAS.
- C. Wang, M. Zhang, W. Wang, Q. Ma, S. Zhang, H. Huang, Z. Peng, H. Yao, Q. Li, Y. Ding and J. Gong, Energy Fuels, 2020, 34, 12239–12246 CrossRef CAS.
- N. Frickel, R. Messing, T. Gelbrich and A. M. Schmidt, Langmuir, 2010, 26, 2839–2846 CrossRef CAS.
- J. Nayeem, M. A. A. Al-Bari, M. Mahiuddin, M. A. Rahman, O. T. Mefford, H. Ahmad and M. M. Rahman, Colloids Surf., A, 2021, 611, 125857 CrossRef CAS.
- C. Wang, H. Chen, H. Shi, K. Ma, Q. Ma and J. Gong, ACS Omega, 2022, 7, 11200–11207 CrossRef CAS.
- P. Zemenova, R. Kral, M. Rodova, K. Nitsch and M. Nikl, J. Therm. Anal. Calorim., 2020, 141, 1091–1099 CrossRef CAS.
- R. Wang, S. Zou, B. Jiang, B. Fan, M. Hou, B. Zuo, X. Wang, J. Xu and Z. Fan, Cryst. Growth Des., 2017, 17, 5908–5917 CrossRef CAS.
- K. Dimitra and C. Konstantinos, Thermochim. Acta, 2021, 704, 179030 CrossRef CAS.
- M. Avrami, J. Chem. Phys., 1939, 7, 1103–1112 CrossRef CAS.
- M. Avrami, J. Chem. Phys., 1940, 8, 212–224 CrossRef CAS.
- L. Ismail, R. E. Westacott and X. Ni, Chem. Eng. J., 2008, 137, 205–213 CrossRef CAS.
- A. Hosseinipour, A. Japper-Jaafar, S. Yusup and L. Ismail, Int. J. Eng., Trans. A, 2019, 32, 18–27 Search PubMed.
- B. Wierzbowska, N. Hutnik, K. Piotrowski and A. Matynia, Cryst. Growth Des., 2011, 11, 1557–1565 CrossRef CAS.
- D. B. Sigourney, B. H. Letcher, M. Obedzinski and R. A. Cunjak, J. Fish Biol., 2010, 72, 2435–2455 CrossRef.
- M. Dalvi-Isfahan, N. Hamdami, E. Xanthakis and A. Le-Bail, J. Food Eng., 2017, 195, 222–234 CrossRef.
- Q. Guan, Y. Liu, B. Ling, G. Zeng, H. Ji, J. Zhang and Q. Zhang, Int. J. Chem. Kinet., 2020, 52, 463–471 CrossRef CAS.
- S. Z. D. Cheng and B. Wunderlich, Macromolecules, 1988, 21, 3327–3328 CrossRef CAS.
- Y. Gan, Q. Cheng, Z. Wang, J. Yang, W. Sun and Y. Liu, J. Pet. Sci. Eng., 2019, 179, 56–69 CrossRef CAS.
Footnote |
| † Electronic supplementary information (ESI) available. See DOI: https://doi.org/10.1039/d3ra08875h |
| This journal is © The Royal Society of Chemistry 2024 |

