
 Open Access Article
 This Open Access Article is licensed under a Creative Commons Attribution-Non Commercial 3.0 Unported Licence
Correlated solvent coordinates accelerate multi-donor proton-coupled electron transfer
Gerald F.
Manbeck
 *,
Brian N.
DiMarco
,
Laura
Rotundo
,
Dmitry E.
Polyansky
and
Mehmed Z.
Ertem
*,
Brian N.
DiMarco
,
Laura
Rotundo
,
Dmitry E.
Polyansky
and
Mehmed Z.
Ertem
Chemistry Division, Brookhaven National Laboratory, Upton, New York 11973-5000, USA. E-mail: gmanbeck@bnl.gov
First published on 1st December 2025
Abstract
The rate of charge transfer within a discrete donor–acceptor (D/A) pair is well-described by semi-classical electron transfer theory, but the effects of multiple equivalent redox sites remain less understood. We report a series of ground-state intramolecular proton-coupled electron transfer (PCET) complexes designed to isolate the effects of donor number, N, while holding geometry, coupling, and driving forces constant. The [Ru(L)3−N(OH)N]2+ complexes incorporate one, two, or three identical phenolic electron donors linked to Ru through rigid phenanthroline bridges (OH = 2,4-di-tert-butyl-6-(1-methyl-1H-imidazo[4,5-f][1,10]phenanthrolin-2-yl)phenol). Upon flash photolysis and oxidative quenching with methyl viologen (MV2+), the transient Ru(III) oxidizes an appended phenol by PCET with the hydrogen-bonded imidazole nitrogen atom functioning as the base. The rate increased by 3.4-fold and 5.7-fold (1.7-fold and 1.9-fold after statistical correction) for two- and three-donor complexes compared to the single-donor system. The supra-statistical acceleration is attributed to a reduced effective outer sphere reorganization energy (λm) modeled by a partially shared solvent reaction coordinate, in which a subset of solvent dipoles is already oriented to stabilize charge from any donor. The final phenoxyl radical state is localized due to the transfer of a proton, and the recombination reaction with the viologen radical is not accelerated. These results demonstrate the effects of solvent dynamics on intramolecular PCET rates, offering a new strategy for the design of synthetic charge transfer systems.
Introduction
Electron transfer (ET) and proton-coupled electron transfer (PCET) reactions are central to biological and synthetic energy conversion.1–5 The efficiency of energy conversion technologies may be partially connected to the rates of competitive processes, such as charge separation, charge recombination, and catalysis on a slower timescale, and for these reasons ET in synthetic structures has been analyzed in detail for several decades.5–11 These studies have revealed a variety of interesting phenomena,12–26 including long-distance electron transfer in proteins27,28 or across saturated hydrocarbon bridges,24,29,30 tunneling in molecular wires,31–35 incoherent hopping over long distances,36,37 and long-lived charge-separated states in molecular triads.38Most of these examples involve discrete donor and acceptor pairs analyzable in the context of the familiar semi-classical expression for nonadiabatic electron transfer (kNAD) (eqn (1)).39,40 In eqn (1), three intrinsic properties control the rate: (i) the free energy change (ΔG°), (ii) the total reorganization energy (λ) due to changes in bond lengths and outer sphere solvent reorientations, and (iii) the electronic coupling matrix element (HDA).41,42HDA describes the overlap of the donor and acceptor electronic wave functions at the nuclear configuration of the transition state and decreases exponentially with distance. It is also sensitive to the nature of the interceding medium.28,43 The relative magnitudes of ΔG° and λ control the free energy barrier, ΔG‡ = (ΔG° + λ)2/4λ.
 | (1) |
Reactions with multiple equivalent redox sites are less understood, but are apparent in many contexts, such as blended donor–acceptor structures in organic photovoltaics,44–48 mixed valence species,49–55 or symmetry-breaking charge transfer chromophores.56–58 Various effects, such as quantum coherence,59 or aggregation,60 may affect ET rates. In early examples of charge transfer with multiple donors or acceptors, ET rates were not adequately compared to lower multiplicity models.61–64 Some of these models were designed to study sequential charge accumulation65–67 or charge transfer in polymer-hosted donors, acceptors, and chromophores.68,69 In other cases, the second donor or acceptor may have been present as a synthetic necessity. For example, Gray and coworkers explicitly adjusted the measured ET rates by a factor of two for Ir(I) dimers with two covalently bound pyridinium acceptors, but did not provide comparison to a single-donor model.64 The Ir dimers have many degrees of conformational freedom, and the effects of delocalization or coherence are unknown.
Recent reports have compared electron transfer rates in multi-donor or multi-acceptor pairs designed with precise geometries to their single-donor, single-acceptor analogues,70–75 and theoretical methods are being developed to address such cases.76–79 A variety of mechanisms can modify ET rates. For example, at cryogenic temperatures, where system–bath interactions are weakened, quantum coherence enables rate enhancements greater than the statistical sum.70,71 In other studies, delocalization between two acceptors results in a modest rate increase due to enhanced coupling with the donor excited state.72 These contrast with incoherent localized charge transfer where the rate only varies due to small differences in reaction free energy and electronic couplings.73 When these parameters can be fixed, localized charge transfer with four acceptors results in a statistical 4-fold rate increase.74 While continued advances are being made, a priori prediction of rate effects remains elusive, especially regarding PCET chemistry. What remains unclear is how the number of equivalent donors alters the fundamental balance of coupling and reorganization in PCET when all other variables are fixed. This gap in understanding prevents defined predictions of multi-donor effects, limiting rational design of molecular systems that exploit parallel electron–transfer pathways.
Here, we address multi-donor PCET using a series of complexes, [Ru(L)3−N(OH)N]2+ (L = ancillary ligand), comprised of a transiently generated Ru(III) oxidant and 1, 2, or 3 (N) phenolic electron donors (OH = 2,4-di-tert-butyl-6-(1-methyl-1H-imidazo[4,5-f][1,10]phenanthrolin-2-yl)phenol, Fig. 1A). One of the two N = 1 systems was reported by us previously.80 The design incorporates several constraints: the donors are covalently bound to the Ru acceptor through rigid bridges at fixed donor–donor separations, the structurally analogous methylated OMe ancillary ligand minimizes geometric variations, the charge transfer chemistry takes place in the ground state, avoiding complications of directional MLCT excitations, and the donor redox potentials vary negligibly ensuring ΔG° remains nearly constant. These features isolate N as the only independent variable. The PCET reaction occurs with internal proton transfer from the phenol to the imidazole nitrogen (ImN) upon oxidation. This charge relay is analogous to the function of natural photosystem (II), where TyrZ is oxidized by P680+ and oxidizes the oxygen evolving complex.81–86 Synthetic analogues of this relay have been proposed as key components for artificial photosynthesis.87
 | ||
| Fig. 1 (A) Structures of the donor–acceptor complexes with N = 1, 2, or 3 OH ligands and control complexes with OMe ligands (N = 0). (B) Photochemical reaction pathway. Complexes without OH PCET donors proceed through steps 1, 2, and 5. Abbreviations: OH = 2,4-di-tert-butyl-6-(1-methyl-1H-imidazo[4,5-f][1,10]phenanthrolin-2-yl)phenol; OMe = 2-(3,5-di-tert-butyl-2-methoxyphenyl)-1-methyl-1H-imidazo[4,5-f][1,10]phenanthroline; RuII* = the 3MLCT excited state; ImN = the imidazole bridge with N as a hydrogen bonded internal base. | ||
The photochemical reaction sequence is shown in Fig. 1B and is comprised of excitation of Ru(II), oxidative quenching with methyl viologen, the ground state intramolecular PCET reaction of interest, and recombination with the viologen radical to restore Ru(II).80 The electron-transfer rates k2/k1 and k3/k1, where the subscript denotes the number of donors, are enhanced 1.7-fold and 1.9-fold after correction for the statistical sum for N = 2, and N = 3, respectively, indicating additional rate acceleration over the temperature range of −20 to + 30 °C. Temperature-dependent kinetic measurements enabled extraction of HDA and the outer sphere reorganization energy, λm. With increasing N and a constant HDA, the λm decreases, consistent with a proposed correlated reaction coordinate model in which the acceptor solvation shell acts as a common fluctuating polarization coordinate partially shared among N pathways and manifests as a reduction of the negative activation entropy associated with nuclear reorganization in the transition state. This work directly tests how donor multiplicity and solvent dynamics can govern PCET kinetics under rigorously controlled conditions.
Results
Synthesis and characterization
The Ru(II) complexes shown in Fig. 1 incorporate combinations of the phenolic donor ligand (OH) and either 2,2′-bipyridine (bpy) or the methyl ether of the phenol (OMe) ancillary ligands. Homoleptic species were prepared by the reaction of Ru(DMSO)4Cl2 or RuCl3·3H2O with three equivalents of ligand, while heteroleptic species were obtained from the reaction of [Ru(bpy)(η6-C6H6)Cl]Cl with two equivalents of ligand, or by the reaction of Ru(L)2Cl2 with one equivalent of the unique ligand, as detailed in the SI. Molecular identities were confirmed using high resolution mass spectrometry (Fig. S1–S6) and 1H NMR spectroscopy (Fig. S7–S12). All complexes were isolated as (PF6−)2 salts, and both (M–1PF6)+ and (M–2PF6)2+ ions were detected by HRMS. In the 1H NMR spectra, the phenolic OH proton, which is hydrogen-bonded to the imidazole N atom, appeared as a broad singlet at 11.3 ppm. Chemical shifts of the –OH protons varied by less than 0.04 ppm across the series, indicating uniform pKa values and H-bonding strength, which maintains consistent phenol/phenoxyl oxidation potentials and nearly constant ΔG° for electron transfer.The OH proton was exchanged for deuterium through three cycles of dissolution in CH3CN/CH3OD followed by solvent evaporation. Complete exchange was confirmed by the disappearance of the OH resonance in the 1H NMR spectrum and further verified by HRMS analysis in CH3CN containing 1% methanol-OD.
The absorption spectra of all complexes (Fig. 2 and S13) exhibit intense ligand-centered π → π* transitions in the UV and broad metal-to-ligand charge transfer (1MLCT) bands in the visible, which are typical of Ru(II) polypyridyl complexes.88 A broad band centered around 335 nm appears in complexes with multiple phenol donors: Ru(bpy)(OH)2, Ru(OMe)(OH)2, and Ru(OH)3. This band is absent in the single-donor complexes Ru(bpy)2(OH) and Ru(OMe)2(OH) and in the control Ru(OMe)3. The non-linear scaling of the extinction coefficient with N indicates that the feature does not arise from a simple additive effect. Because ligands are rigidly separated and no concentration dependence is observed, interactions are likely weak, and intermolecular aggregation is excluded.89 To investigate the origin of the 335 nm transition, time-dependent density functional theory (TD-DFT) calculations were performed at the M06 level of theory90 in conjunction with SMD continuum solvation model91 for acetonitrile.
The computed UV-vis spectra for the 100 lowest energy transitions of Ru(OMe)3, Ru(OMe)2(OH), Ru(OMe)(OH)2, and Ru(OH)3 are shown in Fig. 2B. Several transitions in the 280–330 nm region with intense oscillator strengths are predicted for all complexes in good agreement with experimental data. Complexes with phenol ligands additionally exhibited bands near the 350 nm region, which are absent in spectra of complexes with only bpy and/or OMe ligands. These transitions are primarily interligand π → π* excitations with minor metal d-orbital contributions. In some cases, the donor orbitals extend across multiple phenol moieties, consistent with the energetic equivalence of these chemically identical ligands (Fig. 2C; SI, Section IX).
 | ||
| Fig. 2 (A) Experimental absorption spectra of select complexes with 0–3 phenol donors. (B) Computed spectra of the same set. (C) Principal donor molecular orbitals contributing to the 350 nm band of Ru(OH)3: MO 281 (left) and MO 283 (right). A complete list of transitions and MO diagrams is provided in the SI (Fig. S35). | ||
The fluorescence quantum yields and lifetimes were measured for each donor–acceptor complex to assess possible excited state quenching. Prior work showed no excited state quenching of the 3MLCT state of Ru(bpy)2(OH) by the appended phenol. Normalized steady-state emission spectra for the Ru(bpy)(OMe/H/D)2 series (Fig. S14–S17) are superimposable with emission maxima at 611 nm. Likewise, all spectra of complexes containing OMe, OH, and OD ligands are superimposable with maxima at 606 nm (Table S1). Excitation spectra (Fig. S17) show that excitation into the 335 nm band efficiently populates the 3MLCT emissive state, confirming efficient relaxation and intersystem crossing.
The Ru(bpy)(OMe/H/D)2 series exhibits an average emission quantum yield of 0.13, which is slightly higher than the ∼0.10 values observed for the Ru(bpy)2(OMe/H/D)1 set. All complexes containing at least one bpy ligand exhibit lifetimes of ∼1.5 µs independent of the number of OH or OMe ligands (Fig. 3). Complexes incorporating the bridge-donor or bridge-control (OH and OMe) ligands show particularly high quantum yields ranging from 0.16 to 0.24 with no apparent correlation between the number of OH/D vs. OMe ligands. These efficiencies exceed those of most Ru(II) polypyridyl complexes (generally <0.1) and approach the efficiencies measured for tris-complexes of 4,7-diaryl-phenanthrolines.92 A linear decrease in lifetime is observed from 2.35 µs in Ru(OMe)3 to 1.53 µs in Ru(OD)3 as OMe ligands are progressively replaced by OH/D ligands (Fig. 3).
 | ||
| Fig. 3 Correlation between the 3MLCT excited state emission lifetimes and the number of Ph–OH/D ligands. | ||
The emission energies, quantum yields, and lifetimes confirm that excited state quenching by intramolecular electron transfer is not operative in these complexes. Complexes with bpy ancillary ligands have Ru(dπ) → bpy(π*) 3MLCT excited states with emission energies slightly red-shifted relative to those containing extended phenanthroline ligands. This trend aligns with the established emission properties of Ru(bpy)32+ and Ru(phen)32+,93,94 and it is further supported by the weak correlation between lifetimes and the number of OH donors suggesting that distant OH and OD vibrational decay channels have minimal effect on the nonradiative decay rates. In contrast, complexes with Ru(dπ) → phen(π*) 3MLCT excited states display increasing nonradiative decay rates from 3.2 to 5.5 × 10⁵ s−1 as the number of OH and OD ligands rises from zero to three (Table S1), implicating vibrational contributions from OH and OD groups. This correlation may reflect electron hopping between OMe OH/D ligands with degenerate phen(π*) energies in the 3MLCT state.
Electrochemistry
The intramolecular electron transfer from a phenol donor to the Ru(III) acceptor, which is formed by oxidative quenching of the 3MLCT state by methyl viologen, occurs in the ground state. The driving force, ΔG°, can be extracted from electrochemical potentials. Cyclic voltammetry (CV) and square wave voltammetry (SWV) at a Pt electrode (Fig. 4 and S18–S23) reveal three sequential, reversible, ligand-based reduction events for each complex (Table 1). Oxidative processes are less straightforward due to overlapping waves near 1.0 V vs. (Fc+/0). Among all complexes, Ru(bpy)(OH)2 showed the best-resolved features and was used as the model for detailed analyses. The first oxidation is quasireversible with E1/2 = 0.85 V, but if the anodic sweep extends into the second redox process, the return wave for the first oxidation disappears and a new, broad cathodic feature appears at Ep = −0.61 V. The SWV data (Fig. 4B, blue traces) confirm this behavior: two peaks are observed on the forward oxidative sweep, whereas a single peak corresponding to the second molecular oxidation appears on the reductive sweep. In Ru(OMe)2(OH), the overlapping oxidation peaks lead to an anomalous separation of the anodic and cathodic potentials of for the second process (Fig. 4C). Similar behaviors were observed previously for Ru(bpy)2(OH), although reversibility of the first process was not detected.80| Complex | Potential (V vs. Fc+/0) | |
|---|---|---|
| Oxidations | Reductions | |
| a Peak potential for an irreversible wave. Potentials are reported vs. Fc+/0 and an uncertainty of 0.07 V is assumed. | ||
| [Ru(bpy)(OMe)2]2+ | 0.87 | −1.74, −1.92, −2.16 |
| [Ru(OMe)3]2+ | 0.89 | −1.74, −1.90, −2.13 |
| [Ru(bpy)(OH)2]2+ | 0.85, 1.04 | −0.61,a −1.72, −1.90, −2.17 |
| [Ru(OMe)2(OH)]2+ | 0.85, 0.96 | −0.54,a −1.75, −1.93, −2.19 |
| [Ru(OMe)(OH)2]2+ | 0.85, 0.97 | −0.47,a −1.71, −1.88, −2.11 |
| [Ru(OH)3]2+ | 0.85, 0.96 | −0.49,a −1.71, −1.88, −2.27 |
 | ||
| Fig. 4 (A) Cyclic voltammograms of Ru(bpy)(OH)2 at 500 mV s−1 with varied switching potentials in dry acetonitrile with 0.1 M Bu4NPF6 electrolyte and ferrocene (Fc) as an internal standard. (B and C) Square wave voltammograms of Ru(bpy)(OH)2, Ru(bpy)(OMe)2, Ru(OMe)2(OH), and Ru(OMe)3 with ΔG° indicated. | ||
At a slow scan rate of 5 mV s−1, which approximates diffusion-controlled steady-state conditions, the oxidative and reductive currents of the first redox process are nearly identical (Fig. S21). In contrast, at a faster scan of 500 mV s−1, multi-sweep experiments show that the species oxidized at E1/2 = 0.85 V is not restored by reduction unless the sweep extends to the −0.6 V process (Fig. S22). In the presence of Cs2CO3, the phenol is deprotonated, and the phenoxyl/phenolate couple is observed as a quasireversible process at −0.28 V (Fig. S22).
The first oxidative redox process at 0.85 V vs. Fc+/0 is assigned as the oxidation of the phenol to the phenoxyl radical with proton transfer to the hydrogen-bonded base. This assignment is supported by theoretical data, which confirm that the first oxidation occurs on a phenol donor. Initial calculations were performed on simplified models with t-Bu replaced by CH3, and the computed potentials ranged from 0.54 to 0.56 V vs. Fc+/0, which are equivalent within computational error. Since the radical can be sensitive to the electron density of the phenol ring, calculations were repeated on the exact experimental complexes, with t-Bu groups, and each redox potential was computed as 0.57 V vs. Fc+/0, showing that substitution has a minimal impact on the computed potentials. While these values differ from the experimental data by ∼0.3 V, the difference is within the expected range of error for redox calculations of highly charged species using DFT and implicit solvation methods.95 More important than the exact modeling of experimental potentials, the theoretical data confirm that the potentials are invariant with the number of phenol groups per molecule.
The PCET oxidation of phenols with pre-associated hydrogen-bonded bases is often,96,97 though not exclusively,98,99 quasi-reversible, with dimerization suggested as a possible cause of irreversibility when sterically feasible. A broad reduction wave at −0.6 V of Ru(bpy)2(OH) was previously attributed to PCET reduction of the phenoxyl radical slowed by the weak NH+–˙OPh hydrogen bond in a modest out-of-plane twist induced by the imidazole methyl group.80 In the present work, the CV data of Ru(bpy)(OH)2 provide further support for the assignments shown in Fig. 4A. When the switching potential avoids oxidation of Ru(II) to Ru(III), the hydrogen-bonded NH+–˙OPh radical is reduced reversibly. At slow scan rates, reversibility is preserved due to conformational equilibration on the measurement timescale. The −0.6 V return wave is assigned to the reduction of non-hydrogen-bonded conformations of the radical, and its broadening is due to the PCET mechanism of phenoxyl radical reduction and slower associated kinetics due to the disrupted H-bond.
Infrared spectroelectrochemical oxidation of Ru(bpy)(OH)2 was used to confirm that the first oxidation is the phenoxyl/phenol process, rather than a RuIII/II couple. Electrolysis at 0.9 V vs. Fc+/0 produced new bands at 1630 cm−1 and 1550 cm−1 (Fig. S24) closely resembling those reported for related complexes (1626 cm−1 and 1556 cm−1) attributed to the protonated N atom of the benzimidazolium cation.100 Losses of bands at 1490 cm−1 and 1375 cm−1 are likewise consistent with literature observations. The spectral changes are not characteristic of a Ru-based oxidation and support assignment of the first redox event to phenol oxidation. This conclusion is critical for interpreting the electron transfer kinetics.
The PCET chemistry of interest occurs after oxidative quenching of the 3MLCT excited state, while the phenol remains neutral; however, the electrochemical data discussed above reflect the RuIII/II potential after oxidation of the phenol and therefore do not directly provide the PCET driving force. To estimate the relevant RuIII/II potential, the analogous OMe complexes lacking phenolic donors were examined with RuIII/II(bpy)(OMe)2 = 0.87 V vs. Fc+/0 and RuIII/II(OMe)3 = 0.89 V vs. Fc+/0 (Fig. S23 and Table 2). The ΔG° for PCET in the photo-initiated reaction is approximated as the difference between the N = 0 OMe RuIII/II potentials and the phenol oxidation potential. Using the 0.85 V phenol potential of Ru(bpy)(OH)2, the calculated ΔG° values are −20 meV for Ru(bpy)(OH)2 and −40 meV for Ru(OMe)2(OH), Ru(OMe)(OH)2, and Ru(OH)3.
| N | k ET | ΔG°b | H DA | λ m | κ A | |
|---|---|---|---|---|---|---|
| a Electron transfer rate × 10−7 s−1 at 0 °C adjusted for the number of OH donors N (kET = kobs/N). b Free energy change in eV calculated from electrochemical potentials; estimated uncertainty ± 0.01 eV. c Electronic coupling in cm−1 from fitting to eqn (3). For N = 2 or N = 3 HDA was fixed. d Reorganization energy in eV; uncertainties from the fit of eqn (3) were less than 2% and are rounded to the nearest 10 meV. e κ A = (8π2/h)(HDA2τL/λm). f Data from ref. 80 were re-analyzed to include the approach to equilibrium (see SI). g ± 18. h ± 7. | ||||||
| Ru(bpy)2(OH)f | 1 | 0.70 ± 0.02 | −0.01 | 125g | 1.18 | 1.19 |
| Ru(OMe)2(OH) | 1 | 1.08 ± 0.07 | −0.04 | 118h | 1.19 | 1.06 |
| Ru(bpy)(OH)2 | 2 | 1.26 ± 0.02 | −0.02 | 125 | 1.14 | 1.24 |
| Ru(OMe)(OH)2 | 2 | 1.65 ± 0.10 | −0.04 | 118 | 1.15 | 1.10 |
| Ru(OH)3 | 3 | 2.1 ± 0.3 | −0.04 | 118 | 1.13 | 1.11 |
Kinetics of electron transfer
The photo-induced reactivity was investigated by transient absorption spectroscopy in the presence of 0.4 M MV2+. Fig. 5 shows data for Ru(bpy)(OH)2 and Ru(bpy)(OMe)2 as representative examples. Spectra recorded 30 ns after laser excitation show features characteristic of quenching: strong absorption bands at 390 nm and 600 nm due to the methyl viologen radical cation (MV+˙)101 and ground state bleach of the Ru(II) metal-to-ligand charge transfer (1MLCT) absorption from 400–500 nm.88 The spectral features of the Ru(III)(bpy)(OMe)2 experiment persist for >5 µs, whereas the 1MLCT bleach of Ru(III)(bpy)(OH)2 recovers fully within 150 ns as Ru(III) is reduced by the PCET from the phenol donor. Simultaneously, a UV absorption centered at ca. 370 nm, which is attributable to the phenoxyl radical, appears.102 This signal is weak relative to the overlapping MV+˙ absorptions due to the relative extinction coefficients of a phenoxyl radical (∼3000 M−1 cm−1) and MV+˙ (41![[thin space (1/6-em)]](https://www.rsc.org/images/entities/char_2009.gif) 800 M−1 cm−1).101 The N-fold adjusted rate of Ru(II) recovery increases markedly with the number of phenol donors (Fig. 5C; SI Section VIII)). At 0 °C, for example, ET rates increased from (1.08 ± 0.07) × 107 s−1 for Ru(OMe)2(OH) to (1.65 ± 0.10) × 107 s−1 for Ru(OMe)(OH)2, and (2.10 ± 0.10) × 107 s−1 for Ru(OH)3.
800 M−1 cm−1).101 The N-fold adjusted rate of Ru(II) recovery increases markedly with the number of phenol donors (Fig. 5C; SI Section VIII)). At 0 °C, for example, ET rates increased from (1.08 ± 0.07) × 107 s−1 for Ru(OMe)2(OH) to (1.65 ± 0.10) × 107 s−1 for Ru(OMe)(OH)2, and (2.10 ± 0.10) × 107 s−1 for Ru(OH)3.
 | ||
| Fig. 5 (A and B) Transient absorption spectra of Ru(bpy)(OH)2 and Ru(bpy)(OMe)2 at 30 ns and 1000 ns after pulsed laser excitation in the presence of 0.4 M MV2+. (C) Kinetic traces at 470 nm showing the recovery of the Ru(II) ground-state bleach for the series of complexes 1, 2, and 3 phenoxyl donors at 0 °C. Single exponential fits yield intramolecular electron transfer rates (step 3 of Fig. 1B). See SI Section VIII for fitting procedures and corrections for statistical factors and the reverse reaction. (D) Second order kinetic plots of the MV+˙ decay, corresponding to recombination between the phenoxyl radical and MV˙+ (step 4 in Fig. 1B). | ||
The reaction sequence in Fig. 1B concludes with recombination between the phenoxyl radical and MV+˙. This process occurs on the order of 109 M−1 s−1 with second order, equal concentration kinetics, as indicated by linear plots of 1/[MV+˙] over approximately two half-lives (Fig. 5D). Importantly, the recombination rates were equivalent within the fitting uncertainty for all phenoxyl radicals, independent of the donor number. This consistency demonstrates that the intramolecular rate enhancement from multiple donors does not influence the intermolecular recombination step, enabling differential control over charge separation and recombination rates. The overall process is reversible, and the molecules remain stable through repeated photoexcitation cycles as confirmed by the absence of changes in their UV-vis spectra after flash photolysis.
Discussion
The intramolecular phenol oxidation is coupled to proton transfer (PT), and there is fundamental interest in determining whether this process proceeds by a stepwise or concerted mechanism.103–106 Concerted pathways often exhibit a kinetic isotope effect (KIE) since the proton motion contributes to the rate-determining step. However, the absence of a KIE does not necessarily exclude a concerted mechanism. The KIE can be small when the reactant and product states are tightly coupled, e.g. through a strong hydrogen bond.107 The complete expression for a PCET reaction includes overlap integrals of reactant and product vibronic states as a function of donor–acceptor distance,108 and population of vibrational excited states, particularly for deuterium, may also diminish the observable KIE.109,110In this study, no KIEs were observed across the full temperature range for any complex; however, partial electrochemical reversibility of the phenol/phenoxyl couple suggests that its oxidation could be a concerted process. To a first approximation, the semiclassical treatment of nonadiabatic electron transfer (eqn (1)) can be applied to PCET reactions,111,112 and the defining parameters, HDA and λ, can be determined using logarithmic plots of kETvs. −ΔG° or kETvs. T.12,13,23,64,113,114 In this context, the usual Marcus theory approaches can be applied to analyze the coupling and reorganization energies using ΔG° from voltammetry and the temperature-dependent electron transfer rates.
The following discussion addresses the fundamental factors responsible for the enhancement in charge transfer rates. The adjusted rates of charge transfer increase by factors of 1.7 and 1.9 as the number of OH donors is increased to two and three, respectively. A purely statistical influence from multiple independent donors would predict equivalent rates upon adjustment, provided that the ΔG°, HDA, and λ are conserved. Other systems with multiple ET sites have exhibited enhanced ET rates. For example, a Zn porphyrin electron donor with multiple naphthalene-1,8:4,5-bis(dicarboximide) (NDI) acceptors showed a three-fold rate enhancement at room temperature attributed to a combination of the acceptor multiplicity factor and a change in ΔG° between single- and double-acceptor species.73 A related system with an N,N-dimethylaniline donor and one or two NDI acceptors was two-fold accelerated at room temperature, but 2.6-fold accelerated at cryogenic temperatures due to correlation between the two acceptors.71 Similarly, an anthracene donor with two quinone acceptors showed a 5-fold cryogenic rate enhancement.70 The cryogenic rate enhancements in these examples are due to a change in behavior from incoherent to coherent ET as decreased temperature reduces thermal fluctuations. In contrast, the [Ru(L)3−N(OH)N]2+, complexes display rate enhancements that are invariant from −20 to 20 °C and occur without a change in ΔG° within the homologous series with OMe ancillary ligands.
Eqn (1) was applied as an initial model to analyze the electron transfer rates. Plots of [ln(kET·T1/2) − ln(N)] vs. 1/T, corrected for the number of donors, are linear (Fig. S32), allowing λ and HDA to be computed from the slope and intercept, respectively (Table S3). Across the series of complexes, each HDA falls in the range of 190–220 cm−1 and all are equivalent within fitting uncertainties. The associated errors in HDA are large (10–20%) due to the significant extrapolation of the fit beyond the accessible temperature range. Calculated values of λ range from 1.31–1.38 eV.
The HDA values of 190–220 cm−1 calculated using eqn (1) are quite large and suggest that the nonadiabatic model might not be appropriate. Electron transfer reactions with HDA > 200 cm−1 approach the regime for which the transfer probability is high, i.e. the transmission coefficient, κel approaches unity.115 In this limit, eqn (1), which is independent of the frequencies of nuclear motion of the medium (νm), is not valid. As the splitting (2HDA) of the intersection between donor and acceptor potential energy surfaces increases, the reaction rate becomes increasingly adiabatic and less dependent on HDA, and thus also less dependent on the electron frequency (νel). Moving toward the high coupling regime, the dynamical properties of the solvent begin to have a stronger influence on the rate.116–118
Furthermore, the calculated values of λ in Table S3 are notably higher than the expected sum of reorganizations for the two separate half reactions: ∼0.2 eV for a RuIII/II reduction119 and ∼1 eV for a phenol oxidation.120 Even upon consideration of a hypothetical range of ΔG° values from 0 to −0.08, the sum continues to be higher than expected. These discrepancies prompted evaluation of alternative models. Under conditions of small inner sphere reorganization (λi ≪ λm) and −ΔG° ≪ λm, the rate expression for adiabatic ET governed by the dynamics of the fluid medium is given in eqn (2).
 | (2) |
 , with an activation energy, EL. A commonly cited value of ∼0.2 ps is used for the ambient temperature τL of acetonitrile;122 however, there are few precise measurements of
  due to the limited availability of temperature-dependent dielectric data. To the best of our knowledge, Stoppa and coworkers' temperature-dependent dielectric relaxation spectra are the most comprehensive data set available.123 Based on their data,
  , τL = 0.31 ps at 298 K, and EL = 5.53 kJ mol−1.
For borderline cases,124 that are neither fully adiabatic nor nonadiabatic, i.e. neither the nuclear relaxation frequency νm nor the electronic frequency νel dominates, Rips and Jortner derived an expression that accounts for weak electronic coupling and slow solvent dynamics.116Eqn (3) represents a steady-state treatment of electron transfer that captures the competition between adiabatic and nonadiabatic pathways and reduces to the respective limits in the circumstances when either νel ≫ νm or νm ≫ νel. This expression provides a more complete description of electron transfer in the intermediate coupling regime where both nuclear and electronic dynamics influence the rate.
 | (3) |
Fig. 6 shows plots of experimental kETvs. T data for each complex and fits to eqn (3). The  and EL were taken from the discussion above, ΔG° values were obtained from voltammetry, and HDA and λm were fit for the two complexes with N = 1. The two examples with the slowest reaction rates provided the most reliable exponential fits of the raw data and smallest uncertainties in kf, leading to the smallest associated fitting uncertainties in HDA and λm. Upon fitting the data for Ru(OMe)2(OH), HDA = 118 ± 7 cm−1 and λm = 1.19 eV with <0.5% uncertainty (Table 2). The published data for Ru(bpy)2(OH) were re-analyzed to include consideration of the reverse reaction (see SI, Section VIII), and HDA = 125 ± 18 cm−1 and λm = 1.18 eV. These values are considerably smaller than those obtained from the nonadiabatic approach and are more physically realistic. Additional support for this model comes from close agreement with the 1.00 eV calculation of the outer sphere reorganization energy for Ru(bpy)2OH using dielectric continuum theory (eqn (4)), where rD and rA are the radii of the donor (3.58 Å) and acceptor (4.84 Å) and R (9.03 Å) is their center-to-center distance.39 Finally, as a check of the assumption that λi ≪ λm, the inner-sphere reorganization energy was calculated in the gas phase using standard methods (see the SI for details).125,126 A value of 0.23 eV was calculated, which supports the approximation and shows that differences in reorganization energies in the N = 1–3 series are traced to the outer-sphere component, as discussed in detail below.
 | (4) |
 | ||
| Fig. 6 Experimental kfvs. T data used to calculate the reorganization energy, λm, and the electronic coupling, HDA. When N = 1, solid lines are fits to eqn (3) with λm and HDA treated as adjustable parameters and ΔG° is fixed. When N = 2 or 3, HDA was fixed to 125 or 118 cm−1, obtained for complexes with N = 1 and λm was determined by fitting. | ||
The applicability of eqn (3) is further justified by evaluation of the adiabaticity parameter, κA = (8π2/h)(HDA2τL/λm), which is an empirical factor relating the electronic frequency and solvent relaxation time.116,124 For κA ≪ 1, the rate is dependent upon the frequency of electron motion, and the nonadiabatic eqn (1) applies; however, for κA ≫ 1, the reaction is solvent-controlled (eqn (2)). Computed values of κA = 1.2 and Ru(bpy)2(OH) and 1.1 for Ru(OMe)2(OH) place both complexes in the mildly adiabatic regime where electronic and nuclear timescales contribute comparably.
The supra-statistical rate enhancements for samples with N = 2 or 3 donors could arise from (a) an increase in the donor–acceptor electronic coupling, (b) an increase in the driving force, (c) a decrease in the reorganization energy, or (d) a combination of these factors. Before implementing eqn (3) for the remaining molecules, it is necessary to rationalize which parameters can be reasonably fixed.
In principle, ET rate enhancements can occur via coherent superposition effects between multiple donors as discussed above.75,77 Although the 350 nm UV-vis features in Fig. 2 indicate possible weak donor–donor interactions in the singlet excited states, such interactions are irrelevant to PCET, which occurs in the electronic ground state after quenching. Moreover, a 380 nm long-pass filter excluded probe lamp excitation of those states in the photolysis experiment. The PCET step occurs on the ns timescale, while donor coherence in a fluid medium is expected to dissipate on the fs timescale through bath interactions and vibrational dephasing.127 Furthermore, donor–donor coupling would only be significant if larger than the individual donor–acceptor couplings. The donors are separated by ∼15 Å through rigid spacers such that through–space interactions should be minimal. In addition, the acceptor lies between them, and through-bond couplings to the acceptor will be larger. The through-bond donor–donor coupling in the Ru(III) state can be approximated as half of the energy difference between the two highest occupied orbitals using a Koopman-type approach.75,128 As shown in Fig. 7, these orbitals are nearly degenerate, and although DFT is not strictly applicable to the KT method,129 the calculations indicate negligible donor–donor coupling. Accordingly, the electronic coupling between individual donor sites and the acceptor is expected to remain unchanged in the multi-donor system, and the kinetic data for N = 2 or 3 complexes were fit to eqn (3) using fixed HDA values of 118 or 125 cm−1 obtained for the N = 1 complexes.
 | ||
| Fig. 7 (A and C) Calculated doubly- or triply-degenerate orbitals in the Ru(III) state of Ru(III)(OMe)(OH)2 and Ru(III)(OH)3 prior to the intramolecular PCET reaction. (B) Spin density in [Ru(OMe)(OH)(ImNH+O˙)]3+ after PCET. Spin density plots of all complexes are shown in Fig. S47. | ||
First, the λm values for complexes with two or three phenol donors were obtained by fitting the data in Fig. 6 to eqn (3) at fixed values of HDA and ΔG° (Table 2). Each sequential substitution of an OMe ancillary ligand for an OH phenol donor ligand produced a modest decrease in the reorganization energy of ∼20–40 meV. The possible temperature-dependence of ΔG° and λm might introduce uncertainty in the parameters since eqn (3) assumes their temperature independence, but this assumption is widely used, and has been validated in other cases,17 and the plots in Fig. S32 might deviate from linearity if λm and (λm + ΔG°)2/4λm were temperature dependent.30 Even if ΔG° and/or λm varied the experimental temperature range, the effect would occur consistently across the complexes and therefore would not account for the observed rate differences.
In a similar fashion, the sensitivity of the fits to variations in ΔG° was examined while holding HDA and λm constant. Upon setting λm = 1.19 eV for Ru(OH)3, then ΔG° = −0.07 eV is needed to fit the k vs. T data. While this 30 meV increase in driving force is small, we cannot identify structural or electrostatic rationale for such a shift among molecules that differ only in number of methyl ethers in the OMe/OH series of complexes. The best estimate of ΔG° relies on the assumption that the phenol oxidation potential with Ru in the Ru(II) state, which is measured by CV, is the same as the phenol oxidation potential with Ru in the Ru(III) state, since the latter is not experimentally accessible. Likewise, the RuIII/II potential in the state of a neutral phenol is also not experimentally accessible. Evidence against a significant metal-centered potential shift dependent upon the number of donors is found in the experimental similarities of the RuIII/II potentials in the presence of a phenoxyl radical, which are equivalent within 10 meV (Table 1). Any inaccuracy in ΔG° should therefore be systematic across all molecules in the series. Variation in ΔG° is therefore not favored as the origin of the observed rate enhancements. This conclusion contrasts a literature report on double- and single-donor species where a 3-fold rate enhancement of excited state intramolecular ET was attributed to the combination of the statistical two-fold incoherent doubling, an increase of driving force by ∼100 meV, and a 2.5-fold increase in coupling.73
The decrease in λm, and the corresponding reduction in the activation energy, ΔG‡, is our preferred explanation of the non-statistical rate enhancements and can be rationalized as follows. Within the intermediate adiabatic/nonadiabatic kinetic model, the system retains dependence on both the frequency of electron motion and on the nuclear vibrations, governed primarily by the solvent longitudinal relaxation time. In order to explain the systematic decrease in λm, we propose a correlated solvent reaction coordinate, in which the acceptor's solvation shell is the common solvent-fluctuation polarization coordinate. Each donor couples to that same solvent mode, so the outer sphere reorganization energy is partially shared rather than fully independent per donor. This sharing reduces the effective reorganization energy and can be partitioned into individual and shared contributions through the correlation coefficient, ρ (eqn (5)).
 | (5) |
The experimental reorganization energies fit eqn (5) with ρ = 0.0687 (Fig. S33). The correlated solvent coordinate analysis also accounts for the diminishing decrease in λm as the N increases. Conceptually, the framework resembles the correlated reaction coordinate motion acceleration of ET for single-donor-multi-acceptor species described by Beratan and coworkers.79 However, there are important distinctions. In their work, strong acceptor–acceptor coupling delocalizes the final state, ΔG° is shifted by the magnitude of the acceptor–acceptor coupling, and the donor–acceptor coupling is weak. When acceptor–acceptor reorganization is large, the contributions from nonadditive vibronic pathways are amplified, and the effects are most pronounced at low temperature due to the quantum nature of the vibronic modes, consistent with the cryogenic 5-fold kinetic enhancement observed experimentally in the past.70 The theory shows that the 5-fold increase is not an upper limit, as the magnitude depends on the acceptor positioning. Interestingly, predicted rate enhancements are more pronounced for models with three acceptors vs. two acceptors due to the additional constructively interfering pathways.
In stark contrast, the complexes in Fig. 1 have weak donor–donor coupling, an invariant ΔG° with respect to N, and room temperature rate enhancements with negligible temperature-dependence. The proposed solvent correlated reaction pathway reflects a dynamic, rather than quantum-coherent, mechanism governed by solvent fluctuations that enable electron transfer. If each donor acted independently, the solvent would need to fluctuate into the correct polarization configuration separately for each ET pathway, effectively resetting to the average equilibrium solvent configuration before accessing another pathway. In contrast, in the correlated solvent scenario, all donor sites generate overlapping polarization fields, with the greatest overlap found in the Ru(III) solvent shell. As a result, a subset of solvent dipoles is already oriented to partially stabilize charge transfer from any donor. Instead of relaxing fully to the average equilibrium polarization after each fluctuation, the solvent can undergo small excursions that transiently favor a different donor. This partial pre-orientation lowers the effective λm.
Unlike quantum-coherence models, such as those proposed by Beratan and coworkers, the solvent correlation mechanism saturates with increasing donor (or acceptor) multiplicity. For the present system, a maximum reduction in λm of ∼9% is theoretically possible, although physically unrealizable due to design constraints.
Below, a simplified charge-dipole representation is used to illustrate how a common acceptor-centered solvent environment can simultaneously respond to multiple donor polarization fields. According to the microscopic theory of solvent reorganization for polar media,130 the single-molecule contribution to reorganization energy λi in either initial (i = 1) or and final (i = 2) state of the transferred electron can be expressed as a sum of pairwise solute–solvent energies υ(j) for all solvent molecules (j):
 | (6) |
| υi(j) = −µjE0i(rj) | (7) |
For this analysis, our intent is to illustrate the relative contributions of multiple acceptor sites on solvent polarization, and we focus solely on dipole–ion interactions between individual solvent dipoles and charged atoms as a major contributor to the reorganization energy. The energy of the interaction between charge Q and dipole µj, which is oriented at angle θ relative to the electric field  is given by eqn (8).
 | (8) |
For freely rotating solvent dipoles the angle-averaged potential can be expressed according to eqn (9).131
 | (9) |

A theoretical model of the Ru(OH)3 complex was developed with one hundred twenty explicit CH3CN molecules (Fig. 8) at the GFN2-xTB level of theory132 using a quantum cluster growth (QCG) approach133 (see SI for further details). Interactions between individual solvent dipoles and charged atoms, either Ru2+ or the N atoms of all three possible imidazolium cations, were calculated using eqn (9) at 298 K, assuming all charges behave as point charges. In this approximation, it was also assumed that the positions of solvent molecules do not change, and a more accurate computation would require explicit solvent molecular dynamics simulations. The magnitudes of charge-dipole interactions between all solvent molecules and individual charged atoms are shown in Fig. 9.
 | ||
| Fig. 8 Structure of Ru(OH)3 containing one hundred twenty explicit CH3CN solvent molecules. | ||
 | ||
| Fig. 9 Magnitude of charge-dipole interactions between charged atoms ((A): Ru2+; (B–D): each N-atom of the imidazole group of three different ligands) and CH3CN solvent dipoles. | ||
It can be assumed that a solvent dipole interacting with a single charge Qk as for example shown in Fig. 9, some of its angle-specific components υj(rk, θk) also contribute into interaction of the same dipole with another charge Qk+1. The shared contribution can be estimated as υj(rk, θk) ∩ υj(rk+1, θk+1) or as υj(rk) ∩ υj(rk+1) for angle-averaged interactions. The visual representation of these shared contributions is shown in Fig. 10 for interactions with Ru2+ and one N+ atom (A), Ru2+ and two N+ atoms (B) and Ru2+ and three N+ atoms (C). As expected, the larger number of shared contributions leads to lower overlap, which can be numerically estimated as f with the summation over j for all solvent molecules and over k for all charges atoms:
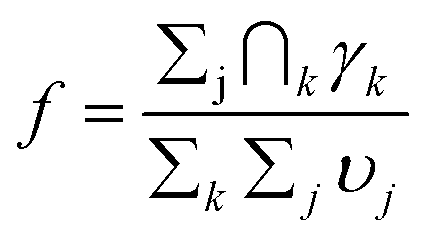 | (10) |
 | ||
| Fig. 10 Graphical representation of overlapping charge-dipole interactions involving Ru2+ and one N+ atom (A), Ru2+ and two N+ atoms (B) and Ru2+ and three N+ atoms (C). Interaction intensities have been scaled 30-fold for visualization. | ||
Using eqn (10) to quantify shared dipole contributions for interaction with Ru2+ and one or more N+ atoms, we obtain f(RuN) = 1, f(RuNN) = 0.126 and f(RuNNN) = 0.048. In the context of eqn (5), the overlaps show a nonlinear decrease, qualitatively mirroring the trend in experimental reorganizational energies. As mentioned, for this first-approximation, the solvation shell was optimized only in the Ru(II) state with neutral phenol donors to provide a possible snapshot of solvent configurations. A complete molecular dynamics analysis would presumably result in a smaller dipole overlap due to repositioning of solvent molecules.
The reduction in ΔG‡ with increasing N donors was further examined by Eyring plots of ln(kETT−1) vs. T−1 to extract the enthalpies (ΔH‡) and entropies (ΔS‡) of activation (Table 3). Across the OMe/OH series, ΔH‡ remains ∼6.5 kcal mol−1, while the ΔS‡ term becomes increasingly positive with additional phenol donors. The activation entropy can be separated into nuclear (solvent) and electronic components according to eqn (11).41,134 This partition is reasonable when HDA is weakly dependent on nuclear coordinates governing crossing dynamics, as is expected for the rigid bridges and fixed donor–acceptor geometries in our systems. Furthermore, the nuclear factor, νm, is assumed to be dominated by the solvent relaxation time, τL. The transmission coefficient is given by eqn (12).135
| ΔS‡ = ΔS‡m + ΔS‡el = ΔS‡m − kBln(κel) | (11) |
 | (12) |
| ΔG‡a | ΔH‡b | ΔS‡b | κ el | ΔS‡eld | ΔS‡m | |
|---|---|---|---|---|---|---|
| a ΔG‡ = H‡ − TΔS‡ at 298 K in kcal mol−1. b ΔH‡ in kcal mol−1 and ΔS‡ in cal mol−1 K−1 calculated from an Eyring analysis of ln(k/T) vs. 1/T. c eqn (12). d k Bln(κel). | ||||||
| Ru(bpy)2(OH) | 7.4 ± 0.2 | 6.80 ± 0.10 | −2.0 ± 0.4 | 0.62 | −0.95 | −1.05 |
| Ru(OMe)2(OH) | 7.2 ± 0.2 | 6.52 ± 0.13 | −2.3 ± 0.5 | 0.58 | −1.07 | −1.23 |
| Ru(bpy)(OH)2 | 7.1 ± 0.2 | 7.12 ± 0.17 | −2.0 ± 0.4 | 0.63 | −0.91 | −1.09 |
| Ru(OMe)(OH)2 | 7.0 ± 0.2 | 6.52 ± 0.14 | −1.5 ± 0.5 | 0.59 | −1.04 | −0.46 |
| Ru(OH)3 | 6.8 ± 0.3 | 6.5 ± 0.4 | −1.1 ± 1.3 | 0.60 | −1.02 | −0.08 |
As discussed above, νel/νm ≈ 1 shows the reaction is in the mildly adiabatic regime. Values of κel < 1 confirm the modest transmission probability. Increasing the number of donors does not affect ΔS‡el significantly. On the other hand, the correlated solvent reaction-coordinate model predicts that multiple donors couple to the same acceptor polarization coordinate, reducing the extent of independent solvent reorganization as N increases. This effect manifests as a smaller nuclear entropy loss, ΔS‡m, in the transition state. In the structurally homologous OMe/OH series, ΔS‡m increases from −1.23 to −0.46 to −0.08 cal mol−1 K−1 as OMe is substituted by OH. While the calculated trend supports the correlated solvent coordinate hypothesis, it should be noted that the propagated uncertainties ΔS‡ are large, particularly for N = 3.
The final step of the reaction sequence (Fig. 1B) is the recombination reaction between a phenoxyl radical and the methyl viologen radical cation. This reaction followed second order kinetics with rates independent of the number of donors (Fig. 5D) because the phenoxyl radical is localized on a single site (Fig. 7 and S47). The PCET nature of the reaction, combined with the weak through-bond coupling prevents delocalization of the radical state, and the recombination rates are therefore not enhanced.
Geometric effects, such as the linear donor–acceptor separation, on λ are an intriguing problem and challenging to probe independently because HDA is also distance-dependent.136,137 Recent interesting examples revealed that when λ exhibits a stronger distance-dependence than HDA for intramolecular electron transfer, it is possible to observe normal, activationless, and inverted behavior at a constant driving force.26,138 A similar scenario was observed for the radiative charge transfer emission over distances of 10–19 Å.139 In the context of artificial photosynthesis, the ability to differentially tune charge migration rates in one direction through multiple sites and reorganization effects offers opportunities to prolong charge-separated states.
To the best of our knowledge, the effects of solvent reorganization in systems with multiple rigid, equivalent donors have not been addressed previously. Extracting such effects requires precise constraints. In this study, the distance, geometry, and ΔG° have been constrained, and the short, conjugated bridge enforces strong donor–acceptor coupling such that the PCET reaction approaches the adiabatic limit. While the effect of adiabaticity on the reorganization could, in principle, be probed using slower solvents such as butyronitrile with τL = 0.53 ps,118,140 insufficient viologen solubility precluded collection of meaningful data. Future work will explore alternate donor geometries, redox potentials, and D–A coupling strengths, as well as compatibility with various solvents, to test the conclusions of this study.
Conclusions
In summary, this study demonstrated that ground state intramolecular PCET in Ru(III)-phenol complexes with multiple equivalent phenol donors exhibits supra-statistical rate enhancements (1.7- and 1.9- fold) that cannot be explained simply by changes in D–A coupling or driving force. These complexes provide a rare opportunity for kinetic analysis with variable donor numbers with rigorously constrained donor–acceptor distance, driving force, and geometry. Temperature-dependent kinetic data revealed that the PCET reactions occur in the mildly adiabatic regime, where both electronic and solvent relaxation dynamics contribute. The kinetic enhancements are rationalized by a proposed correlated solvent reaction coordinate model, in which the acceptor solvation shell provides a shared polarization mode. Partial sharing, quantified by a correlation coefficient of ρ = 0.0687 lowers the effective outer sphere reorganization energy and accelerates the rate.In contrast to prior reports of excited state ET kinetic enhancements attributed to quantum coherence across multiple sites, the ground-state charge transfer reaction in this work maintains kinetic enhancements at room temperature. When cryogenic ultrafast charge transfer is accelerated by multiple sites, quantum coherence likely plays a role, especially when donor–acceptor coupling is weaker than the acceptor–acceptor or donor–donor coupling. The correlated solvent coordinate proposed in this study is a dynamic, rather than a quantum, effect, which saturates with increasing donor number. An outstanding feature of the overall system is that while the initial charge transfer is enhanced beyond statistical expectations, recombination rates are not accelerated because the PCET nature of the donor localizes the radical state. This provides an interesting strategy for differential control of charge separation and charge recombination, complementing established methods of varying ET rates, such as through changes in free energy, coupling, and distance. More broadly, this work highlights the importance of solvent dynamics in shaping intramolecular PCET kinetics in rigid systems. Future studies varying donor geometry, coupling strength, and solvent relaxation times will be valuable in testing the generality of solvent coordinate effects in kinetic enhancements.
Author contributions
GFM designed experiments, synthesized complexes, measured redox potentials, analyzed kinetics, and wrote the manuscript. BND collected temperature-dependent PCET data. LR measured emission spectra, quantum yields, and lifetimes. DEP analyzed kinetics, computed cation-dipole energy interactions, and revised the manuscript. MZE performed theoretical calculations and revised the manuscript.Conflicts of interest
The authors declare no conflicts.Data availability
Supplementary information (SI): the SI file contains experimental details, computational details, synthesis, characterization data (NMR spectroscopy, UV-vis absorption, steady-state emission, transient absorption, cyclic voltammetry), and electron transfer kinetics. See DOI: https://doi.org/10.1039/d5sc06787a.Acknowledgements
This research was supported by the U.S. Department of Energy (DOE), Office of Science, Office of Basic Energy Sciences, Chemical Sciences, Geosciences, and Biosciences Division under contract DE-SC0012704 and utilized computational resources at the Center for Functional Nanomaterials, which is a U.S. Department of Energy Office of Science Facility, and the Scientific Data and Computing Center, a component of the Computational Science Initiative, at Brookhaven National Laboratory under Contract No. DE-SC0012704.References
- C. C. Moser, J. M. Keske, K. Warncke, R. S. Farid and P. L. Dutton, Nature of biological electron transfer, Nature, 1992, 355, 796–802 CrossRef CAS PubMed.
- S. M. Falke, C. A. Rozzi, D. Brida, M. Maiuri, M. Amato, E. Sommer, A. De Sio, A. Rubio, G. Cerullo, E. Molinari and C. Lienau, Coherent ultrafast charge transfer in an organic photovoltaic blend, Science, 2014, 344, 1001–1005 CrossRef CAS.
- M. Hambourger, G. F. Moore, D. M. Kramer, D. Gust, A. L. Moore and T. A. Moore, Biology and technology for photochemical fuel production, Chem. Soc. Rev., 2009, 38, 25–35 RSC.
- S. Fukuzumi, K. Ohkubo and T. Suenobu, Long-lived charge separation and applications in artificial photosynthesis, Acc. Chem. Res., 2014, 47, 1455–1464 CrossRef CAS PubMed.
- M. Rudolf, S. V. Kirner and D. M. Guldi, A multicomponent molecular approach to artificial photosynthesis – the role of fullerenes and endohedral metallofullerenes, Chem. Soc. Rev., 2016, 45, 612–630 RSC.
- D. Gust, T. A. Moore and A. L. Moore, Molecular mimicry of photosynthetic energy and electron transfer, Acc. Chem. Res., 1993, 26, 198–205 CrossRef CAS.
- M. R. Wasielewski, Photoinduced electron transfer in supramolecular systems for artificial photosynthesis, Chem. Rev., 1992, 92, 435–461 CrossRef CAS.
- P. F. Barbara, T. J. Meyer and M. A. Ratner, Contemporary issues in electron transfer research, J. Phys. Chem., 1996, 100, 13148–13168 CrossRef CAS.
- O. S. Wenger, Long-range electron transfer in artificial systems with d(6) and d(8) metal photosensitizers, Coord. Chem. Rev., 2009, 253, 1439–1457 CrossRef CAS.
- M. Maroncelli, J. Macinnis and G. R. Fleming, Polar-solvent dynamics and electron-transfer reactions, Science, 1989, 243, 1674–1681 CrossRef CAS PubMed.
- M. Gilbert and B. Albinsson, Photoinduced charge and energy transfer in molecular wires, Chem. Soc. Rev., 2015, 44, 845–862 RSC.
- K. K. Mentel, A. Serra, P. E. Abreu and L. G. Arnaut, Higher activation barriers can lift exothermic rate restrictions in electron transfer and enable faster reactions, Nat. Commun., 2018, 9, 2903 CrossRef.
- J. R. Miller, J. V. Beitz and R. K. Huddleston, Effect of free-energy on rates of electron-transfer between molecules, J. Am. Chem. Soc., 1984, 106, 5057–5068 CrossRef CAS.
- R. H. Goldsmith, M. R. Wasielewski and M. A. Ratner, Scaling laws for charge transfer in multiply bridged donor/acceptor molecules in a dissipative environment, J. Am. Chem. Soc., 2007, 129, 13066–13071 CrossRef CAS.
- J. X. Lin, D. Balamurugan, P. Zhang, S. S. Skourtis and D. N. Beratan, Two-electron transfer pathways, J. Phys. Chem. B, 2015, 119, 7589–7597 CrossRef CAS PubMed.
- Y. S. Luo, K. Barthelmes, M. Wachtler, A. Winter, U. S. Schubert and B. Dietzek, Increased charge separation rates with increasing donor–acceptor distance in molecular triads: the effect of solvent polarity, J. Phys. Chem. C, 2017, 121, 9220–9229 CrossRef CAS.
- Y. S. Luo, M. Wachter, K. Barthelmes, A. Winter, U. S. Schubert and B. Dietzek, Superexchange in the fast lane - intramolecular electron transfer in a molecular triad occurs by conformationally gated superexchange, Chem. Commun., 2019, 55, 5251–5254 RSC.
- M. Delor, S. A. Archer, T. Keane, A. Meijer, I. V. Sazanovich, G. M. Greetham, M. Towrie and J. A. Weinstein, Directing the path of light-induced electron transfer at a molecular fork using vibrational excitation, Nat. Chem., 2017, 9, 1099–1104 CrossRef CAS PubMed.
- A. Rosspeintner and E. Vauthey, Bimolecular photoinduced electron transfer reactions in liquids under the gaze of ultrafast spectroscopy, Phys. Chem. Chem. Phys., 2014, 16, 25741–25754 RSC.
- S. Neumann and O. S. Wenger, Fundamentally different distance dependences of electron-transfer rates for low and high driving forces, Inorg. Chem., 2019, 58, 855–860 CrossRef CAS PubMed.
- S. Neumann, C. Kerzig and O. S. Wenger, Quantitative insights into charge-separated states from one- and two-pulse laser experiments relevant for artificial photosynthesis, Chem. Sci., 2019, 10, 5624–5633 RSC.
- E. J. Piechota and C. Turro, Dynamic orientation control of bimolecular electron transfer at charged micelle surfaces, J. Chem. Phys., 2020, 153, 064302 CrossRef CAS.
- W. B. Davis, M. A. Ratner and M. R. Wasielewski, Conformational gating of long distance electron transfer through wire-like bridges in donor-bridge-acceptor molecules, J. Am. Chem. Soc., 2001, 123, 7877–7886 CrossRef CAS PubMed.
- G. L. Closs and J. R. Miller, Intramolecular long distance electron transfer in organic molecules, Science, 1988, 240, 440–447 CrossRef CAS PubMed.
- J. Sukegawa, C. Schubert, X. Z. Zhu, H. Tsuji, D. M. Guldi and E. Nakamura, Electron transfer through rigid organic molecular wires enhanced by electronic and electron-vibration coupling, Nat. Chem., 2014, 6, 899–905 CrossRef CAS PubMed.
- M. Kuss-Petermann and O. S. Wenger, Increasing electron-transfer rates with increasing donor–acceptor distance, Angew. Chem., Int. Ed., 2016, 55, 815–819 CrossRef CAS.
- J. R. Winkler and H. B. Gray, Electron-transfer in ruthenium-modified proteins, Chem. Rev., 1992, 92, 369–379 CrossRef CAS.
- H. B. Gray and J. R. Winkler, Long-range electron transfer, Proc. Natl. Acad. Sci. U. S. A., 2005, 102, 3534–3539 CrossRef CAS.
- M. N. Paddonrow, Investigating long-range electron-transfer processes with rigid, covalently-linked donor-(norbornylogous bridge)-acceptor systems, Acc. Chem. Res., 1994, 27, 18–25 CrossRef CAS.
- J. Kroon, H. Oevering, J. W. Verhoeven, J. M. Warman, A. M. Oliver and M. N. Paddonrow, Temperature effects on intramolecular electron-transfer kinetics under normal, inverted, and nearly optimal conditions, J. Phys. Chem., 1993, 97, 5065–5069 CrossRef CAS.
- M. U. Winters, E. Dahlstedt, H. E. Blades, C. J. Wilson, M. J. Frampton, H. L. Anderson and B. Albinsson, Probing the efficiency of electron transfer through porphyrin-based molecular wires, J. Am. Chem. Soc., 2007, 129, 4291–4297 CrossRef CAS.
- G. Sedghi, K. Sawada, L. J. Esdaile, M. Hoffmann, H. L. Anderson, D. Bethell, W. Haiss, S. J. Higgins and R. J. Nichols, Single molecule conductance of porphyrin wires with ultralow attenuation, J. Am. Chem. Soc., 2008, 130, 8582–8583 CrossRef CAS.
- D. M. Guldi, B. M. Illescas, C. M. Atienza, M. Wielopolskia and N. Martin, Fullerene for organic electronics, Chem. Soc. Rev., 2009, 38, 1587–1597 RSC.
- G. Sedghi, V. M. Garcia-Suarez, L. J. Esdaile, H. L. Anderson, C. J. Lambert, S. Martin, D. Bethell, S. J. Higgins, M. Elliott, N. Bennett, J. E. Macdonald and R. J. Nichols, Long-range electron tunnelling in oligo-porphyrin molecular wires, Nat. Nanotechnol., 2011, 6, 517–523 CrossRef CAS PubMed.
- F. Giacalone, J. L. Segura, N. Martin and D. M. Guldi, Exceptionally small attenuation factors in molecular wires, J. Am. Chem. Soc., 2004, 126, 5340–5341 CrossRef CAS.
- R. H. Goldsmith, L. E. Sinks, R. F. Kelley, L. J. Betzen, W. H. Liu, E. A. Weiss, M. A. Ratner and M. R. Wasielewski, Wire-like charge transport at near constant bridge energy through fluorene oligomers, Proc. Natl. Acad. Sci. U. S. A., 2005, 102, 3540–3545 CrossRef CAS.
- A. B. Ricks, K. E. Brown, M. Wenninger, S. D. Karlen, Y. A. Berlin, D. T. Co and M. R. Wasielewski, Exponential distance dependence of photoinitiated stepwise electron transfer in donor-bridge-acceptor molecules: implications for wirelike behavior, J. Am. Chem. Soc., 2012, 134, 4581–4588 CrossRef CAS.
- J. Hankache and O. S. Wenger, Microsecond charge recombination in a linear triarylamine-Ru(bpy)32+-anthraquinone triad, Chem. Commun., 2011, 47, 10145–10147 RSC.
- R. A. Marcus, On the theory of oxidation–reduction reactions involving electron transfer.1, J. Chem. Phys., 1956, 24, 966–978 CrossRef CAS.
- V. G. Levich and R. R. Dogonadze, Theory of non-radiative electron transitions from ion to ion in solutions, Dokl. Akad. Nauk SSSR, 1959, 124, 123–126 CAS.
- R. A. Marcus and N. Sutin, Electron transfers in chemisry and biology, Biochim. Biophys. Acta, 1985, 811, 265–322 CrossRef CAS.
- B. S. Brunschwig and N. Sutin, Energy surfaces, reorganization energies, and coupling elements in electron transfer, Coord. Chem. Rev., 1999, 187, 233–254 CrossRef CAS.
- M. A. Ratner, Bridge-assisted electron transfer: effective electronic coupling, J. Phys. Chem., 1990, 94, 4877–4883 CrossRef CAS.
- M. Madhu, R. Ramakrishnan, V. Vijay and M. Hariharan, Free Charge Carriers in Homo-Sorted π-Stacks of Donor–Acceptor Conjugates, Chem. Rev., 2021, 121, 8234–8284 CrossRef CAS.
- F.-J. Kahle, C. Saller, S. Olthof, C. Li, J. Lebert, S. Weiß, E. M. Herzig, S. Hüttner, K. Meerholz, P. Strohriegl and A. Köhler, Does electron delocalization influence charge separation at donor–acceptor interfaces in organic photovoltaic cells?, J. Phys. Chem. C, 2018, 122, 21792–21802 CrossRef CAS.
- N. A. Pace, O. G. Reid and G. Rumbles, Delocalization drives free charge generation in conjugated polymer films, ACS Energy Lett., 2018, 3, 735–741 CrossRef CAS.
- S. Athanasopoulos, H. Bassler and A. Kohler, Disorder vs. delocalization: Which is more advantageous for high-efficiency organic solar cells?, J. Phys. Chem. Lett., 2019, 10, 7107–7112 CrossRef CAS PubMed.
- S. Gélinas, A. Rao, A. Kumar, S. L. Smith, A. W. Chin, J. Clark, T. S. van der Poll, G. C. Bazan and R. H. Friend, Ultrafast long-range charge separation in organic semiconductor photovoltaic diodes, Science, 2014, 343, 512–516 CrossRef.
- K. Tahara, H. Koyama, M. Fujitsuka, K. Tokunaga, X. Le, T. Majima, J. I. Kikuch, Y. Ozawa and M. Abe, Charge-separated mixed valency in an unsymmetrical acceptor–donor–donor triad based on diarylboryl and triarylamine units, J. Org. Chem., 2019, 84, 8910–8920 CrossRef CAS.
- C. Lambert, R. Wagener, J. H. Klein, G. Grelaud, M. Moos, A. Schmiedel, M. Holzapfel and T. Bruhn, A photoinduced mixed-valence state in an organic bis-triarylamine mixed-valence compound with an iridium–metal-bridge, Chem. Commun., 2014, 50, 11350–11353 RSC.
- C. Huang, M. M. Sartin, N. Siegel, M. Cozzuol, Y. D. Zhang, J. M. Hales, S. Barlow, J. W. Perry and S. R. Marder, Photo-induced charge transfer and nonlinear absorption in dyads composed of a two-photon-absorbing donor and a perylene diimide acceptor, J. Mater. Chem., 2011, 21, 16119–16128 RSC.
- J. Petersson, J. Henderson, A. Brown, L. Hammarstrom and C. P. Kubiak, Time-resolved electron transfer in porphyrin-coordinated ruthenium dimers: from mixed-valence dynamics to hot electron transfer, J. Phys. Chem. C, 2015, 119, 4479–4487 CrossRef CAS.
- J. Bonvoisin, J.-P. Launay, M. Van der Auweraer and F. C. De Schryver, Organic mixed-valence systems: electrochemical and optical studies of intervalence transition in partly oxidized aromatic polyamines, J. Phys. Chem., 1994, 98, 5052–5057 CrossRef CAS.
- C. Stoian, F. Al Hussein, W. R. Browne, E. Hupf and J. Beckmann, Electronic coupling in triferrocenylpnictogens, ACS Org. Inorg. Au, 2024, 4, 545–556 CrossRef CAS.
- A.-L. Capodilupo, E. Fabiano, L. Franco, S. Gambino, M. Leoncini, G. Accorsi and G. Gigli, Control of electron transfer processes in multidimensional arylamine-based mixed-valence compounds by molecular backbone design, J. Phys. Chem. A, 2021, 125, 7840–7851 CrossRef CAS PubMed.
- V. Markovic, D. Villamaina, I. Barabanov, L. M. L. Daku and E. Vauthey, Photoinduced symmetry-breaking charge separation: The direction of the charge transfer, Angew. Chem., Int. Ed., 2011, 50, 7596–7598 CrossRef CAS PubMed.
- E. Sebastian and M. Hariharan, Symmetry-breaking charge separation in molecular constructs for efficient light energy conversion, ACS Energy Lett., 2022, 7, 696–711 CrossRef CAS.
- C. Lin, T. Kim, J. D. Schultz, R. M. Young and M. R. Wasielewski, Accelerating symmetry-breaking charge separation in a perylenediimide trimer through a vibronically coherent dimer intermediate, Nat. Chem., 2022, 14, 786–793 CrossRef CAS PubMed.
- J. D. Schultz, J. L. Yuly, E. A. Arsenault, K. Parker, S. N. Chowdhury, R. Dani, S. Kundu, H. Nuomin, Z. Zhang, J. Valdiviezo, P. Zhang, K. Orcutt, S. J. Jang, G. R. Fleming, N. Makri, J. P. Ogilvie, M. J. Therien, M. R. Wasielewski and D. N. Beratan, Coherence in chemistry: foundations and frontiers, Chem. Rev., 2024, 124, 11641–11766 CrossRef CAS PubMed.
- D. M. Cadena, J. K. Sowa, D. E. Cotton, C. D. Wight, C. L. Hoffman, H. R. Wagner, J. T. Boette, E. K. Raulerson, B. L. Iverson, P. J. Rossky and S. T. Roberts, Aggregation of charge acceptors on nanocrystal surfaces alters rates of photoinduced electron transfer, J. Am. Chem. Soc., 2022, 144, 22676–22688 CrossRef CAS.
- M. S. Lazorski, R. H. Gest and C. M. Elliott, Photoinduced multistep charge separation in a heteroleptic Cu(I) bis(phenanthroline)-based donor-chromophore-acceptor triad, J. Am. Chem. Soc., 2012, 134, 17466–17469 CrossRef CAS PubMed.
- S. L. Larson, C. M. Elliott and D. F. Kelley, Charge separation in donor chromophore acceptor assemblies – linkage and driving-force dependence of photoinduced electron transfers, J. Phys. Chem., 1995, 99, 6530–6539 CrossRef CAS.
- L. F. Cooley, S. L. Larson, C. M. Elliott and D. F. Kelley, Charge separation in linked Ru(bipyridine)3-donor–acceptor complexes, J. Phys. Chem., 1991, 95, 10694–10700 CrossRef CAS.
- L. S. Fox, M. Kozik, J. R. Winkler and H. B. Gray, Gaussian free-energy dependence of electron-transfer rates in iridium complexes, Science, 1990, 247, 1069–1071 CrossRef CAS PubMed.
- J. H. Klein, T. L. Sunderland, C. Kaufmann, M. Holzapfel, A. Schmiedel and C. Lambert, Stepwise versus pseudo-concerted two-electron-transfer in a triarylamine-iridium dipyrrin-naphthalene diimide triad, Phys. Chem. Chem. Phys., 2013, 15, 16024–16030 RSC.
- A. G. Bonn, O. Yushchenko, E. Vauthey and O. S. Wenger, Photoinduced electron transfer in an anthraquinone-Ru(bpy)32+-oligotriarylamine-Ru(bpy)32+-anthra quinone pentad, Inorg. Chem., 2016, 55, 2894–2899 CrossRef CAS.
- R. Schroot, M. Jager and U. S. Schubert, Accumulative charging of redox-active side-chain-modified polymers: experimental and computational insights from oligo- to polymeric triarylamines, Macromolecules, 2019, 52, 4673–4685 CrossRef CAS.
- J. Kubel, R. Schroot, M. Wachtler, U. S. Schubert, B. Dietzek and M. Jager, Photoredox-active dyads based on a Ru(II) photosensitizer equipped with electron donor or acceptor polymer chains: a spectroscopic study of light-induced processes toward efficient charge separation, J. Phys. Chem. C, 2015, 119, 4742–4751 CrossRef.
- T. Schlotthauer, R. Schroot, S. Glover, L. Hammarstrom, M. Jager and U. S. Schubert, A multidonor-photosensitizer-multiacceptor triad for long-lived directional charge separation, Phys. Chem. Chem. Phys., 2017, 19, 28572–28578 RSC.
- B. T. Phelan, J. Zhang, G.-J. Huang, Y.-L. Wu, M. Zarea, R. M. Young and M. R. Wasielewski, Quantum coherence enhances electron transfer rates to two equivalent electron acceptors, J. Am. Chem. Soc., 2019, 141, 12236–12239 CrossRef CAS.
- B. T. Phelan, J. D. Schultz, J. Y. Zhang, G. J. Huang, R. M. Young and M. R. Wasielewski, Quantum coherence in ultrafast photo-driven charge separation, Faraday Discuss., 2019, 216, 319–338 RSC.
- P. E. Hartnett, C. M. Mauck, M. A. Harris, R. M. Young, Y.-L. Wu, T. J. Marks and M. R. Wasielewski, Influence of anion delocalization on electron transfer in a covalent porphyrin donor–perylenediimide dimer acceptor system, J. Am. Chem. Soc., 2017, 139, 749–756 CrossRef CAS.
- L. Bancroft, J. Y. Zhang, S. M. Harvey, M. D. Krzyaniak, P. Zhang, R. D. Schaller, D. N. Beratan, R. M. Young and M. R. Wasielewski, Charge transfer and spin dynamics in a zinc porphyrin donor covalently linked to one or two naphthalenediimide acceptors, J. Phys. Chem. A, 2021, 125, 825–834 CrossRef CAS PubMed.
- J. M. Fisher, M. L. Williams, J. R. Palmer, N. E. Powers-Riggs, R. M. Young and M. R. Wasielewski, Long-lived charge separation in single crystals of an electron donor covalently linked to four acceptor molecules, J. Am. Chem. Soc., 2024, 146, 9911–9919 CrossRef CAS PubMed.
- J. Li, Y. Shi, C. Cui, Y. Li, C. Ruan and T. Cheng, Unveiling quantum coherence effects in modulating electron transfer in platinum(II) donor–acceptor–donor systems, Chem. Eur J., 2025, 31, e202404512 CrossRef CAS PubMed.
- S. V. Feskov and A. I. Ivanov, Efficiency of intramolecular electron transfer from the second excited state of the donor in molecular triads D–A1–A2, Russ. J. Phys. Chem. A, 2016, 90, 144–151 CrossRef CAS.
- N. B. Taylor and I. Kassal, Generalised marcus theory for multi-molecular delocalised charge transfer, Chem. Sci., 2018, 9, 2942–2951 RSC.
- D. Balzer and I. Kassal, Even a little delocalization produces large kinetic enhancements of charge-separation efficiency in organic photovoltaics, Sci. Adv., 2022, 8, eabl9692 CrossRef CAS PubMed.
- H. Nuomin, F.-F. Song, P. Zhang and D. N. Beratan, Correlated reaction coordinate motion produces nonadditive rate enhancement for electron and energy transfer in multiacceptor structures, J. Am. Chem. Soc., 2025, 147, 26877–26888 CrossRef CAS.
- G. F. Manbeck, E. Fujita and J. J. Concepcion, Proton-coupled electron transfer in a strongly coupled Photosystem II-inspired chromophore-imidazole-phenol complex: stepwise oxidation and concerted reduction, J. Am. Chem. Soc., 2016, 138, 11536–11549 CrossRef CAS.
- H. Kuhne and G. W. Brudvig, Proton-coupled electron transfer involving Tyrosine Z in Photosystem II, J. Phys. Chem. B, 2002, 106, 8189–8196 CrossRef.
- A. M. A. Hays, I. R. Vassiliev, J. H. Golbeck and R. J. Debus, Role of D1-his190 in the proton-coupled oxidation of tyrosine y-z in manganese-depleted Photosystem II, Biochemistry, 1999, 38, 11851–11865 CrossRef CAS.
- Y. Umena, K. Kawakami, J.-R. Shen and N. Kamiya, Crystal structure of oxygen-evolving Photosystem II at a resolution of 1.9 angstrom, Nature, 2011, 473, 55–U65 CrossRef CAS PubMed.
- J. S. Vrettos, J. Limburg and G. W. Brudvig, Mechanism of photosynthetic water oxidation: combining biophysical studies of Photosystem II with inorganic model chemistry, Biochim. Biophys. Acta, Bioenerg., 2001, 1503, 229–245 CrossRef CAS PubMed.
- V. K. Yachandra, K. Sauer and M. P. Klein, Manganese cluster in photosynthesis: Where plants oxidize water to dioxygen, Chem. Rev., 1996, 96, 2927–2950 CrossRef CAS PubMed.
- D. J. Vinyard, G. M. Ananyev and G. C. Dismukes, Photosystem II: the reaction center of oxygenic photosynthesis, Annu. Rev. Biochem., 2013, 82, 577–606 CrossRef CAS PubMed.
- Y. Zhao, J. R. Swierk, J. D. Megiatto Jr., B. Sherman, W. J. Youngblood, D. Qin, D. M. Lentz, A. L. Moore, T. A. Moore, D. Gust and T. E. Mallouk, Improving the efficiency of water splitting in dye-sensitized solar cells by using a biomimetic electron transfer mediator, Proc. Natl. Acad. Sci. U. S. A., 2012, 109, 15612–15616 CrossRef CAS PubMed.
- A. Juris, V. Balzani, F. Barigelletti, S. Campagna, P. Belser and A. Vonzelewsky, Ru(II) polypyridine complexes – photophysics, photochemistry, electrochemistry, and chemi-luminescence, Coord. Chem. Rev., 1988, 84, 85–277 CrossRef CAS.
- N. J. Hestand and F. C. Spano, Expanded theory of H- and J-molecular aggregates: the effects of vibronic coupling and intermolecular charge transfer, Chem. Rev., 2018, 118, 7069–7163 CrossRef CAS PubMed.
- Y. Zhao and D. G. Truhlar, The M06 suite of density functionals for main group thermochemistry, thermochemical kinetics, noncovalent interactions, excited states, and transition elements: two new functionals and systematic testing of four M06-class functionals and 12 other functionals, Theor. Chem. Acc., 2008, 120, 215–241 Search PubMed.
- A. V. Marenich, C. J. Cramer and D. G. Truhlar, Universal solvation model based on solute electron density and on a continuum model of the solvent defined by the bulk dielectric constant and atomic surface tensions, J. Phys. Chem. B, 2009, 113, 6378–6396 CrossRef CAS PubMed.
- P. C. Alford, M. J. Cook, A. P. Lewis, G. S. G. McAuliffe, V. Skarda, A. J. Thomson, J. L. Glasper and D. J. Robbins, Luminescent metal-complexes .5. Luminescence properties of ring-substituted 1,10-phenanthroline tris-complexes of ruthenium(II), J. Chem. Soc., Perkin Trans. 2, 1985, 2, 705–709 RSC.
- C. Creutz, Mechanism of the quenching of the emission of substituted polypyridineruthenium(II) complexes by europium(II), Inorg. Chem., 1978, 17, 1046–1051 CrossRef CAS.
- D. W. Fink and W. E. Ohnesorge, Temperature effects on charge-transfer luminescence intensity of some transition metal ion chelates, J. Am. Chem. Soc., 1969, 91, 4995–4998 CrossRef CAS.
- R. Matheu, M. Z. Ertem, C. Gimbert-Suriñach, J. Benet-Buchholz, X. Sala and A. Llobet, Hydrogen bonding rescues overpotential in seven-coordinated Ru water oxidation catalysts, ACS Catal., 2017, 7, 6525–6532 CrossRef CAS.
- T. F. Markle, I. J. Rhile, A. G. DiPasquale and J. M. Mayer, Probing concerted proton–electron transfer in phenol-imidazoles, Proc. Natl. Acad. Sci. U. S. A., 2008, 105, 8185–8190 CrossRef CAS.
- E. Odella, B. L. Wadsworth, S. J. Mora, J. J. Goings, M. T. Huynh, D. Gust, T. A. Moore, G. F. Moore, S. Hammes-Schiffer and A. L. Moore, Proton-coupled electron transfer drives long-range proton translocation in bioinspired systems, J. Am. Chem. Soc., 2019, 141, 14057–14061 CrossRef CAS.
- G. A. Parada, Z. K. Goldsmith, S. Kolmar, B. P. Rimgard, B. Q. Mercado, L. Hammarstrom, S. Hammes-Schiffer and J. M. Mayer, Concerted proton-electron transfer reactions in the Marcus inverted region, Science, 2019, 364, 471–475 CrossRef CAS.
- C. Costentin, M. Robert, J. M. Saveant and C. Tard, Inserting a hydrogen-bond relay between proton exchanging sites in proton-coupled electron transfers, Angew. Chem., Int. Ed., 2010, 49, 3803–3806 CrossRef CAS PubMed.
- M. T. Huynh, S. J. Mora, M. Villalba, M. E. Tejeda-Ferrari, P. A. Liddell, B. R. Cherry, A. L. Teillout, C. W. Machan, C. P. Kubiak, D. Gust, T. A. Moore, S. Hammes-Schiffer and A. L. Moore, Concerted one-electron two-proton transfer processes in models inspired by the Tyr-His couple of Photosystem II, ACS Cent. Sci., 2017, 3, 372–380 CrossRef CAS.
- T. Watanabe and K. Honda, Measurement of the extinction coefficient of the methyl viologen cation radical and the efficiency of its formation by semiconductor photocatalysis, J. Phys. Chem., 1982, 86, 2617–2619 CrossRef CAS.
- J. Feitelson and E. Hayon, Electron ejection and electron-capture by phenolic compounds, J. Phys. Chem., 1973, 77, 10–15 CrossRef CAS.
- R. Tyburski, T. F. Liu, S. D. Glover and L. Hammarstrom, Proton-coupled electron transfer guidelines, fair and square, J. Am. Chem. Soc., 2021, 143, 560–576 CrossRef CAS PubMed.
- A. Migliore, N. F. Polizzi, M. J. Therien and D. N. Beratan, Biochemistry and theory of proton-coupled electron transfer, Chem. Rev., 2014, 114, 3381–3465 CrossRef CAS PubMed.
- D. R. Weinberg, C. J. Gagliardi, J. F. Hull, C. F. Murphy, C. A. Kent, B. C. Westlake, A. Paul, D. H. Ess, D. G. McCafferty and T. J. Meyer, Proton-coupled electron transfer, Chem. Rev., 2012, 112, 4016–4093 CrossRef CAS PubMed.
- S. Hammes-Schiffer, Proton-coupled electron transfer: moving together and charging forward, J. Am. Chem. Soc., 2015, 137, 8860–8871 CrossRef CAS.
- S. D. Glover, G. A. Parada, T. F. Markle, S. Ott and L. Hammarstrom, Isolating the effects of the proton tunneling distance on proton-coupled electron transfer in a series of homologous tyrosine-base model compounds, J. Am. Chem. Soc., 2017, 139, 2090–2101 CrossRef CAS PubMed.
- S. Hammes-Schiffer, Proton-coupled electron transfer: classification scheme and guide to theoretical methods, Energy Environ. Sci., 2012, 5, 7696–7703 RSC.
- S. J. Edwards, A. V. Soudackov and S. Hammes-Schiffer, Analysis of kinetic isotope effects for proton-coupled electron transfer reactions, J. Phys. Chem. A, 2009, 113, 2117–2126 CrossRef CAS.
- J. P. Layfield and S. Hammes-Schiffer, Hydrogen tunneling in enzymes and biomimetic models, Chem. Rev., 2014, 114, 3466–3494 CrossRef CAS.
- J. N. Schrauben, M. Cattaneo, T. C. Day, A. L. Tenderholt and J. M. Mayer, Multiple-site concerted proton-electron transfer reactions of hydrogen-bonded phenols are nonadiabatic and well described by semiclassical marcus theory, J. Am. Chem. Soc., 2012, 134, 16635–16645 CrossRef CAS PubMed.
- J. M. Mayer, Simple marcus-theory-type model for hydrogen-atom transfer/proton-coupled electron transfer, J. Phys. Chem. Lett., 2011, 2, 1481–1489 CrossRef CAS.
- S. L. Larson, L. F. Cooley, C. M. Elliott and D. F. Kelley, Charge separation in donor chromophore acceptor complexes – inverted region behavior in reverse electron-transfer reactions, J. Am. Chem. Soc., 1992, 114, 9504–9509 CrossRef CAS.
- A. Kahnt, J. Karnbratt, L. J. Esdaile, M. Hutin, K. Sawada, H. L. Anderson and B. Albinsson, Temperature dependence of charge separation and recombination in porphyrin oligomer-fullerene donor-acceptor systems, J. Am. Chem. Soc., 2011, 133, 9863–9871 CrossRef CAS.
- M. D. Newton and N. Sutin, Electron-transfer reactions in condensed phases, Annu. Rev. Phys. Chem., 1984, 35, 437–480 CrossRef CAS.
- I. Rips and J. Jortner, Dynamic solvent effects on outer-sphere electron-transfer, J. Chem. Phys., 1987, 87, 2090–2104 CrossRef CAS.
- M. Bixon and J. Jortner, Solvent relaxation dynamics and electron-transfer, Chem. Phys., 1993, 176, 467–481 CrossRef CAS.
- M. J. Weaver, Dynamic solvent effects on activated electron-transfer reactions: principles, pitfalls, and progress, Chem. Rev., 1992, 92, 463–480 CrossRef CAS.
- R. C. Young, F. R. Keene and T. J. Meyer, Measurement of rates of electron-transfer between Ru(bpy)33+ and Fe(phen)32+ and between Ru(phen)33+ and Ru(bpy)32+ by differential excitation flash-photolysis, J. Am. Chem. Soc., 1977, 99, 2468–2473 CrossRef CAS.
- C. Costentin, M. Robert and J.-M. Saveant, Adiabatic and non-adiabatic concerted proton–electron transfers. Temperature effects in the oxidation of intramolecularly hydrogen-bonded phenols, J. Am. Chem. Soc., 2007, 129, 9953–9963 CrossRef CAS PubMed.
- D. Kivelson and H. Friedman, Longitudinal dielectric-relaxation, J. Phys. Chem., 1989, 93, 7026–7031 CrossRef CAS.
- M. J. Weaver and T. Gennett, Influence of solvent reorganization dynamics upon the kinetics of some electron-exchange reactions, Chem. Phys. Lett., 1985, 113, 213–218 CrossRef CAS.
- A. Stoppa, A. Nazet, R. Buchner, A. Thoman and M. Walther, Dielectric response and collective dynamics of acetonitrile, J. Mol. Liq., 2015, 212, 963–968 CrossRef CAS.
- H. Heitele, M. E. Michel-beyerle and P. Finckh, The influence of dielectric relaxation on intramolecular electron transfer, Chem. Phys. Lett., 1987, 138, 237–243 CrossRef CAS.
- S. F. Nelsen, S. C. Blackstock and Y. Kim, Estimation of inner shell marcus terms for amino nitrogen-compounds by molecular-orbital calculations, J. Am. Chem. Soc., 1987, 109, 677–682 CrossRef CAS.
- A. Klimkans and S. Larsson, Reorganization energies in benzene, naphthalene, and anthracene, Chem. Phys., 1994, 189, 25–31 CrossRef CAS.
- S. Rafiq and G. D. Scholes, From fundamental theories to quantum coherences in electron transfer, J. Am. Chem. Soc., 2019, 141, 708–722 CrossRef.
- K. D. Jordan and M. N. Paddon-Row, Long-range interactions in a series of rigid nonconjugated dienes. 1. Distance dependence of the .pi.+,.pi.− and .pi.+*,.pi.−* splittings determined from ab initio calculations, J. Phys. Chem., 1992, 96, 1188–1196 CrossRef CAS.
- L. A. Curtiss and J. R. Miller, Distance dependence of electronic coupling through trans alkyl chains: Effects of electron correlation, J. Phys. Chem. A, 1998, 102, 160–167 CrossRef CAS.
- D. V. Matyushov, Solvent reorganization energy of electron-transfer reactions in polar solvents, J. Chem. Phys., 2004, 120, 7532–7556 CrossRef CAS PubMed.
- J. N. Israelachvili in Intermolecular and Surface Forces, ed. J. N. Israelachvili, 3rd edn, Academic Press, San Diego, 2011 Search PubMed.
- C. Bannwarth, S. Ehlert and S. Grimme, GFN2-xTB-An accurate and broadly parametrized self-consistent tight-binding quantum chemical method with multipole electrostatics and density-dependent dispersion contributions, J. Chem. Theory Comput., 2019, 15, 1652–1671 CrossRef CAS PubMed.
- S. Spicher, C. Plett, P. Pracht, A. Hansen and S. Grimme, Automated molecular cluster growing for explicit solvation by efficient force field and tight binding methods, J. Chem. Theory Comput., 2022, 18, 3174–3189 CrossRef CAS.
- E. J. Piechota, R. N. Sampaio, L. Troian-Gautier, A. B. Maurer, C. P. Berlinguette and G. J. Meyer, Entropic barriers determine adiabatic electron transfer equilibrium, J. Phys. Chem. C, 2019, 123, 3416–3425 CrossRef CAS.
- B. S. Brunschwig, J. Logan, M. D. Newton and N. Sutin, A semi-classical treatment of electron-exchange reactions - Application to the hexaaquoiron(II)-hexaaquoiron(III) system, J. Am. Chem. Soc., 1980, 102, 5798–5809 CrossRef CAS.
- B. S. Brunschwig, S. Ehrenson and N. Sutin, Distance dependence of electron-transfer reactions - rate maxima and rapid rates at large reac-tant separations, J. Am. Chem. Soc., 1984, 106, 6858–6859 CrossRef CAS.
- E. H. Yonemoto, G. B. Saupe, R. H. Schmehl, S. M. Hubig, R. L. Riley, B. L. Iverson and T. E. Mallouk, Electron-transfer reactions of ruthenium trisbipyridyl-viologen donor-acceptor molecules - comparison of the distance dependence of electron-transfer rates in the normal and Marcus inverted regions, J. Am. Chem. Soc., 1994, 116, 4786–4795 CrossRef CAS.
- M. Kuss-Petermann and O. S. Wenger, Electron transfer rate maxima at large donor–acceptor distances, J. Am. Chem. Soc., 2016, 138, 1349–1358 CrossRef CAS.
- S. Johnson, A. Makhijani, M. Tsuji and T. Mani, Acceleration of nonradiative charge recombination reactions at larger distances in kinked donor–bridge–acceptor molecules, J. Phys. Chem. B, 2022, 126, 8851–8863 CrossRef CAS.
- I. Rips, J. Klafter and J. Jortner, Solvation dynamics in polar liquids, J. Chem. Phys., 1988, 89, 4288–4299 CrossRef CAS.
| This journal is © The Royal Society of Chemistry 2026 |