
 Open Access Article
 This Open Access Article is licensed under a Creative Commons Attribution-Non Commercial 3.0 Unported Licence
Ambroxol displaces α-synuclein from the membrane and inhibits the formation of early protein–lipid coaggregates
Jesper E.
Dreier
a,
Alisdair
Stevenson
bc,
Elliot
Carles
a,
Katharina
Schott
a,
Thomas C. T.
Michaels
 *bc and
Céline
Galvagnion
*a
*bc and
Céline
Galvagnion
*a
aDepartment of Drug Design and Pharmacology, Faculty of Health and Medical Sciences, University of Copenhagen, 2100 Copenhagen, Denmark. E-mail: celine.galvagnion@sund.ku.dk
bDepartment of Biology, Institute of Biochemistry, ETH Zurich, Otto Stern Weg 3, 8093 Zurich, Switzerland. E-mail: thomas.michaels@bc.biol.ethz.ch
cBringing Materials to Life (BML) Initiative, ETH Zurich, Switzerland
First published on 31st October 2025
Abstract
Parkinson's disease (PD) is a neurological disorder characterized by neuronal loss and the deposition of α-synuclein–lipid coaggregates in the brain of patients as well as disruptions in lipid metabolism. Mutations in the gene GBA, which encodes the lysosomal glycoprotein Glucocerebrosidase, are together the most important genetic risk factor for PD and have been associated with lysosomal dysfunction, accumulation of pathological α-synuclein as well as major changes in both the levels and properties of lipids. Ambroxol, a small molecule chaperone capable of binding and stabilizing Glucocerebrosidase, was found to revert changes in lipid levels and increase in α-synuclein levels due to GBA mutations potentially via restoring lysosomal function. Here, we show that Ambroxol also has a direct effect on α-synuclein–lipid coaggregation by inhibiting the primary nucleation step in the aggregation process. We find that Ambroxol not only displaces α-synuclein from negatively charged membranes but also prevents the formation of early α-synuclein–lipid coaggregates during primary nucleation. These results suggest that Ambroxol may have beneficial effects on other synucleinopathies, such as multiple system atrophy and dementia with Lewy Bodies, that are also characterised by the aggregation of α-synuclein into amyloid fibrils.
1 Introduction
Parkinson's disease (PD) is the second most common neurodegenerative disease, second only to Alzheimer's disease and is characterized by the loss of dopaminergic neurons which leads to bradykinesia, tremors and dementia.1,2 Another hallmark of PD is the formation of protein–lipid inclusions in the brain called Lewy bodies, whose main protein constituent is α-synuclein (αS).3,4αS is a small (14 kDa) intrinsically disordered protein (IDP) that is found at micro-molar concentrations in neuronal synapses,5 where its natural function is proposed to be involved in the budding and merging of synaptic vesicles.6 In Lewy bodies, however, αS is not found in a disordered state, but as rigid amyloid fibrils, where αS monomers aggregate through β-sheet stacking. Multiple factors have been shown to influence the propensity of αS to form amyloid fibrils in vitro, such as pH, temperature, metal ions and surfaces such as air/water, polystyrene/water,7 membrane/water8 or detergent/water9 interfaces. In particular, the interaction between αS and lipid membranes has been shown to play a dual opposite role by being crucial for the proposed biological function of the protein, i.e. synaptic plasticity, while being required for the initiation of the formation of lipid–protein coaggregates.6,8,10 The molecular events responsible for the switch from functional to deleterious αS-membrane interactions are not yet fully understood. It is now well established that αS can bind to membranes made of different lipids, including negatively charged phospholipids, gangliosides and cardiolipin,11–13 but is only able to coaggregate with some of these lipids into lipid–protein amyloid fibrils at high protein![[thin space (1/6-em)]](https://www.rsc.org/images/entities/char_2009.gif) :lipid ratios.11,14,15 In the case of 1,2-dimyristoyl-sn-glycero-3-phospho-L-serine (DMPS) membranes, we have recently provided the mechanism by which αS coaggregates with DMPS molecules into amyloid fibrils.16 Using tools from chemical kinetics modeling in combination with experimental data, we found that the mechanistic pathway is initiated with a two-step nucleation process at the surface of the membrane followed by an elongation step involving both protein and lipid molecules and thereby consuming lipids from the membrane as the reaction progresses.16,17
:lipid ratios.11,14,15 In the case of 1,2-dimyristoyl-sn-glycero-3-phospho-L-serine (DMPS) membranes, we have recently provided the mechanism by which αS coaggregates with DMPS molecules into amyloid fibrils.16 Using tools from chemical kinetics modeling in combination with experimental data, we found that the mechanistic pathway is initiated with a two-step nucleation process at the surface of the membrane followed by an elongation step involving both protein and lipid molecules and thereby consuming lipids from the membrane as the reaction progresses.16,17
Disruptions in lipid levels have been found to be associated with PD.18,19 In particular, mutations in the gene GBA encoding the enzyme Glucocerebrosidase (GCase), have been shown to be together the most important genetic risk factor for developing PD and are associated with alterations in the levels and properties of GCase's substrates glycosylceramide and glucosylsphingosine and more broadly of sphingolipids.20,21GBA mutations were found to lead to a decrease in GCase activity and/or protein levels, lysosomal dysfunction and increased levels of lipids as well as total, oligomeric and pathological αS in cellular and animal models22,23 of PD and in patients derived samples, including cerebrospinal fluid (CSF), post-mortem brain samples and fibroblasts.19–21 Similar findings were observed when GCase activity was reduced upon treatment with small molecule inhibitors such as Conduritol β Epoxide (CBE).24,25
The decreased levels of GCase protein and activity due to GBA mutations can be restored by treatment with small molecules, including the small-molecule chaperone Ambroxol (ABX) (see structure in Fig. 1a, top).26–28 ABX was initially used to treat airway mucus hypersecretion in infants but was found to also act as a molecular chaperone for GCase.29 ABX is proposed to bind to the active site of GCase in the endoplasmic reticulum, to stabilise the structure of the protein and to then dissociate from the protein when the ABX/GCase complex reaches lysosomes, thus leaving the protein active.30,31 ABX was found to revert the decrease in levels of GCase activity and protein and the increase in the levels of lipids and αS due to GBA mutations in PD, PD-GBA and/or GD NCSC-DA neurons and fibroblasts.20,29,32–37 ABX also led to a decrease in αS levels in SH-SY5Y cells and mice overexpressing αS.32,37,38 Finally, ABX is currently in phase 2 and 3 of clinical trials as a treatment for GBA associated PD as well as in clinical trials as a treatment for Dementia with Lewy Bodies (DLB).39–41
 | ||
| Fig. 1 ABX but not CBE inhibits αS–DMPS coaggregation into amyloid fibrils at pH 5.5 and 6.5. (a) Molecular structure of ABX (top) and CBE (bottom). (b and c) Change in ThT fluorescence for solutions of 50 μM αS incubated with 200 μM DMPS model membranes in the absence and presence of different ABX or CBE concentrations at pH 5.5 (b) and 6.5 (c) in non-binding plates under quiescent conditions at 30 °C. (d and e). Negative stain EM images of the reaction mixtures 50 μM αS and 200 μM DMPS model membranes at pH 5.5 after 27 hours incubation (d) and pH 6.5 after 55 hours incubation (e). | ||
Even though several studies have shown that ABX can decrease the levels of total and/or phosphorylated αS in cellular and animal models of PD (including GBA mutation and over-expression of αS), the mechanism behind this protective effect of ABX against accumulation of αS, which could be via an increase in the clearance of αS aggregate and/or inhibition of αS aggregation, is not yet established.
In the present study, we show that ABX directly prevents αS–DMPS coaggregate formation and displaces αS from the membrane. By using chemical kinetics modeling of lipid–protein coaggregation with aggregation kinetic data measured for various DMPS:αS:ABX ratios, we reveal that ABX inhibits the primary nucleation step in the pathway of αS–DMPS coaggregation. We also find that the inhibitory effect of ABX is specific to this molecule as CBE was found to affect neither αS–membrane interactions nor DMPS–αS coaggregation into amyloid fibrils.
Our findings show that a direct inhibition of αS–lipid fibril formation could be a secondary mechanism of ABX in the treatment of PD in addition to the well characterised GCase chaperone function.
2 Results and discussion
2.1 Effect of ABX on αS aggregation
To investigate the effect of ABX on the aggregation of αS, we incubated αS and DMPS model membranes in the absence and presence of different concentrations of ABX under quiescent conditions in non-binding plates (Corning 3881) at pH 6.5 and pH 5.5 and 30 °C. In all experiments, we worked with freshly prepared monomeric N-terminally acetylated αS, since N-terminal acetylation is one of the physiologically relevant post-translational modifications of the protein.42 We chose to work at pH 6.5 because the process of coaggregation of αS and DMPS into amyloid fibrils is well characterized by a range of biophysical methods under these conditions8,14,43 and the mechanistic pathway of this process has been recently characterized at this pH.16 We also studied the effect of ABX on αS and DMPS coaggregation at pH 5.5, a value close to that found in the lysosomes.In the presence of a 1:4 αS:DMPS molar ratio, we observed an increase in the ThT fluorescence, indicative of the formation of amyloid fibrils, after a lag phase, that was much shorter at pH 5.5 than at pH 6.5 (Fig. 1b and c, light blue data points). This observation is in agreement with the faster aggregation of αS previously observed under more acidic conditions.44 The presence of amyloid fibrils was confirmed with negative stain electron microscopy (EM) images of the reaction mixtures at the plateau phase (27 hours at pH 5.5, 55 hours at pH 6.5) (Fig. 1d, e, S1 and S2). At both pH values, the fibrils had a similar morphology as that of fibrils formed at pH 6.5 under the same conditions, previously determined using Atomic Force Microscopy8 and cryo-EM.43 Additionally, there was little to no membranes visible in the EM images, suggesting that most lipids have been incorporated into the amyloid fibrils which is to be expected at the lipid:protein ratios used here.8,14 With increasing ABX concentrations, the rate of aggregation decreased until an ABX:αS ratio of 6:1 and ABX:DMPS ratio of 3:2 where no aggregation was observed (Fig. 1b and c). The absence of amyloid fibrils was again confirmed with EM images of the reaction mixtures after the same incubation time as that of the sample without ABX (Fig. S3 and S4). Only few fibrils were found in the samples at both pH values, and at much lower abundance than in the samples without ABX (Fig. S1 and S2). The non-fibrillar structures seen in Fig. S3 and S4 are likely to be membranes clustering together as well as excess uranyl acetate.
In order to rule out potential quenching effects of ABX on ThT fluorescence, we monitored the kinetics of aggregation of αS (2% Alexa 488-labeled A140C αS) in the presence of DMPS and ABX using fluorescence polarisation (fp) measurements (Fig. S5), as described previously.45,46 The fp of a fluorophore is sensitive to its degree of conformational mobility and is expected to increase for decreasing conformational mobility. We utilize this property by measuring the change in fp of fluorescently labeled αS when incubated under the same conditions as in our ThT experiments (Fig. 1b and c). In the absence of ABX, the fp of the reaction mixture αS (2% Alexa 488-labeled A140CαS):DMPS at pH 6.5 started to increase at 20 hours and reached saturation after 40 hours, which is slower than the ThT-monitored aggregation. The reaction was slowed down with increasing ABX concentrations and complete inhibition was observed for the same ABX:αS and ABX:DMPS ratios as observed from our ThT experiments (Fig. 1b and c), i.e. 6:1 and 3:2, respectively.
To test if the inhibitory effect observed for ABX was specific to this molecule or generic for small molecules affecting GCase activity/protein levels, we measured the coaggregation of αS and DMPS under the same conditions as those described so far in the presence of CBE instead of ABX. CBE concentration was set to 400 μM to match that of ABX, where complete inhibition of the DMPS–αS coaggregation was observed. We found that CBE had no effect on αS–DMPS coaggregate formation at either pH values (Fig. 1b and c), suggesting that ABX specifically inhibits this process.
Having established the inhibitory effect of ABX on DMPS–αS coaggregation, we wanted to investigate if ABX could also inhibit lipid-independent aggregation of αS. We performed aggregation assays in polystyrene microwell plates (Corning 3601), where the first step of αS aggregation is proposed to occur at the polystyrene/water interface.7 Here, there was no difference in aggregation rates between αS alone and with ABX at concentrations where complete inhibition of DMPS–αS coaggregation was observed, suggesting that the compounds have no effect on the lipid-independent aggregation of αS (Fig. S6a). Finally, we also investigated whether ABX had any effect on the elongation step of lipid-independent fibril formation, by incubating αS monomers with preformed αS fibril seeds and ABX and CBE at concentrations within the range of those used for the DMPS–αS coaggregation experiments. We did not observe changes in the aggregation rate at any ABX concentrations in this experiment (Fig. S6b).
Altogether, these results show that ABX specifically inhibits the coaggregation of αS and lipids into amyloid fibrils.
2.2 Effect of ABX on αS-membrane binding
In the light of the observation that ABX specifically inhibits αS–DMPS coaggregation into amyloid fibrils, we then set out to investigate whether ABX may interfere with the binding of αS to DMPS membranes, as observed for other small molecule inhibitors such as squalamine47 and trodusquemine.48 As αS forms an alpha-helix upon binding to membranes made of negatively charged lipids,49–51 we used circular dichroism (CD) spectroscopy to probe the interaction. We chose to work under fully lipid-saturated conditions since here, no free αS can initiate protein–lipid coaggregation, and the CD-signal will reflect the fully bound population of αS. The CD signal of αS in the presence of an excess of DMPS membranes (αS:DMPS ratio of 1:50) displayed the canonical alpha helical signal as previously reported for αS–lipid complexes, with minima at 208 nm and 222 nm (Fig. 2a).8,12,52–54 With increasing ABX concentrations, the CD signal reverted to that of a protein with a random coil conformation, characteristic for IDPs, including αS monomer in solution. The increasing noise in the spectra below ∼218 nm for increasing ABX concentrations is likely due to absorption of light at these wavelengths by the small molecule55 as illustrated in Fig. S7. The return to random coil conformation for increasing ABX concentrations indicates that the interaction between αS and DMPS was disrupted by the small molecule. The disruption of αS and DMPS interaction by ABX was also observed at pH 5.5 (Fig. S8). These results suggest that ABX out competed the αS–DMPS interaction at both pH 5.5 and 6.5.
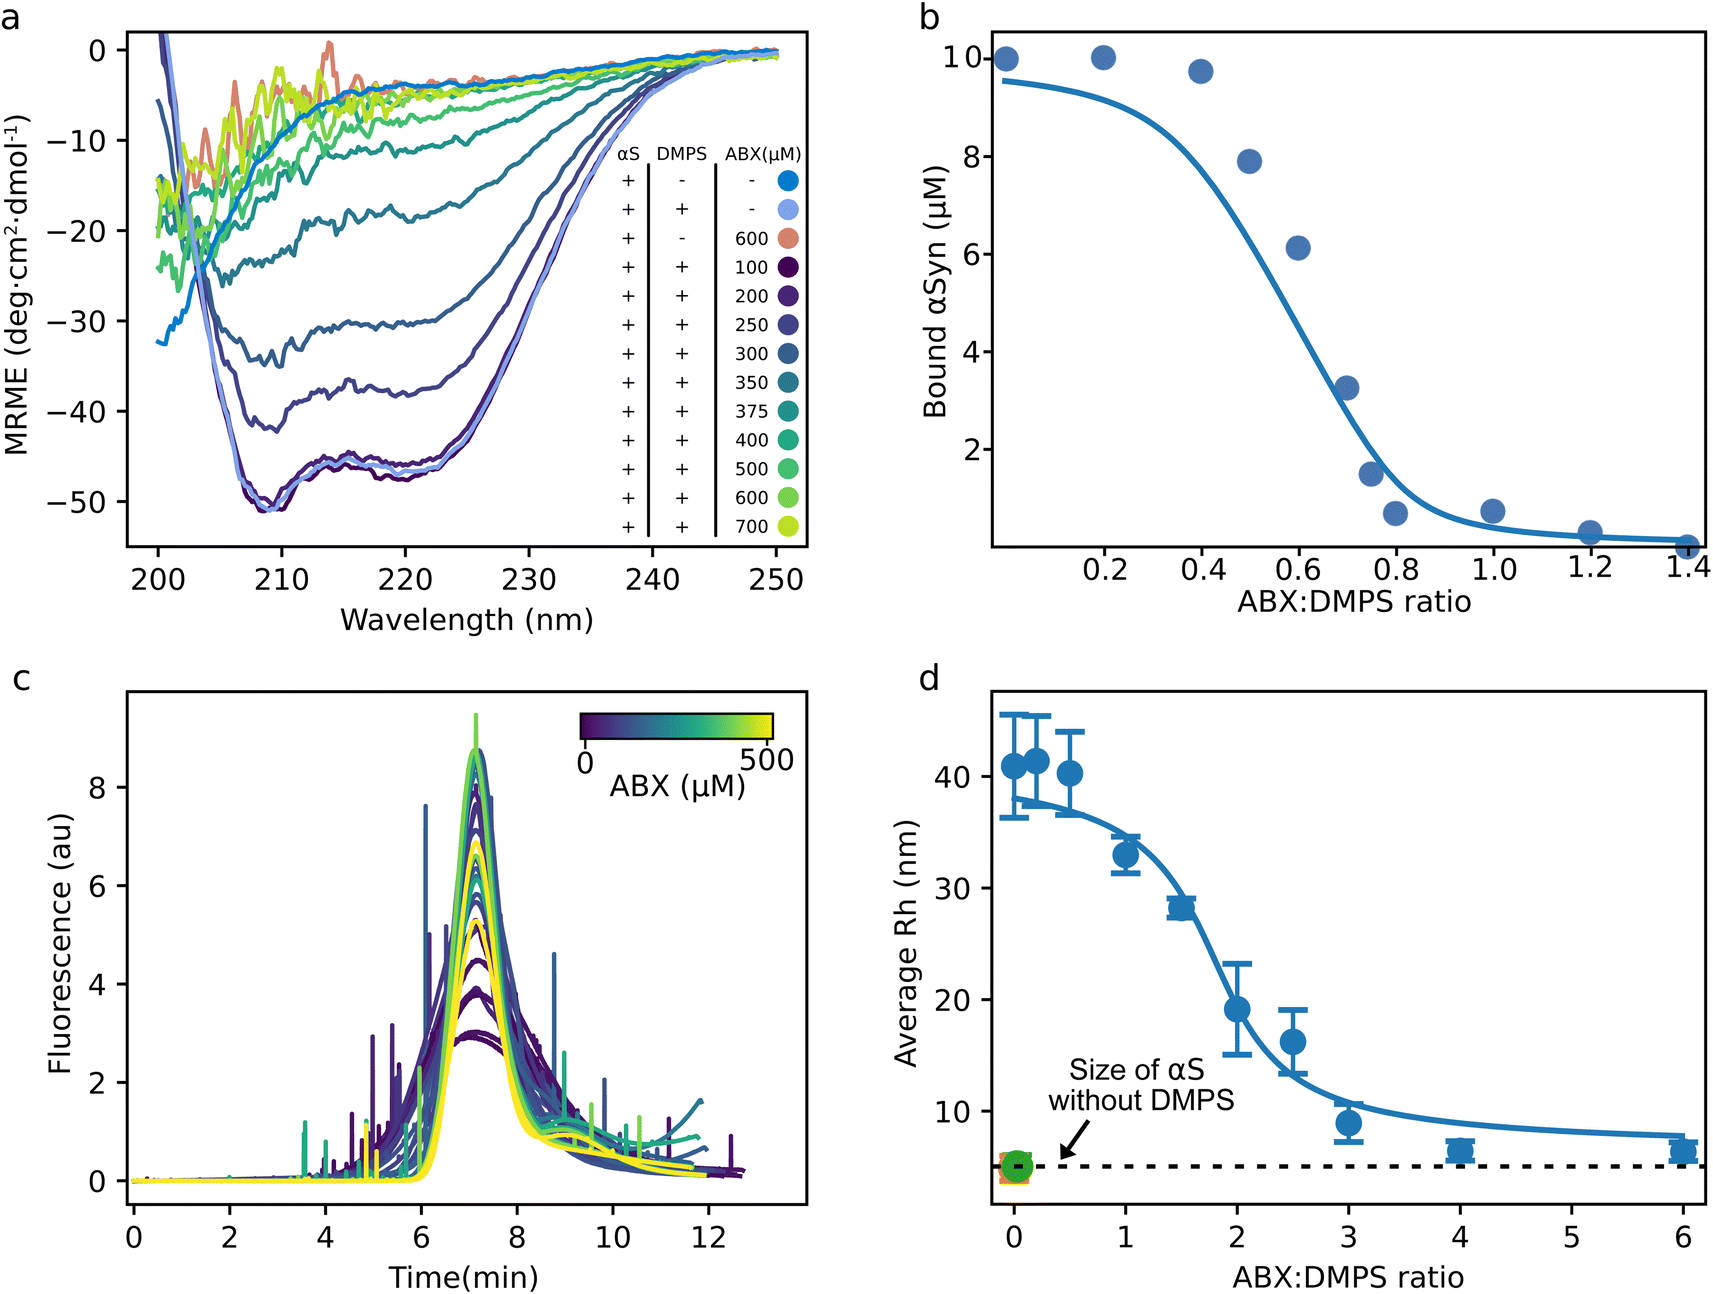 | ||
| Fig. 2 ABX displaces αS from DMPS membranes (a) circular dichroism spectra of 10 μM αS in the absence and presence of 500 μM DMPS and ABX in phosphate buffer at pH 6.5 and 30 °C. (b) Change in the concentration of bound αS with increasing ABX concentrations calculated from the MRE at 222 nm using eqn (1) and (2) (see Material and methods, SI) and data shown in (a). The solid line shows the fit to a competitive binding model between ABX, αS and DMPS with the following, previously determined values, for the binding between αS and DMPS; KD = 0.38 μM and stoichiometry of 28.2 DMPS molecules per αS monomer.8 (c) Taylor grams from FIDA measurements of 100 nM Alexa 488-labeled αS(A140C) with 30 μM DMPS and increasing concentrations of ABX measured at 30 °C. (d) Reported average Rh from the data shown in (c). The green point is αS in the absence of DMPS and ABX and the dashed line indicates the size of αS monomer. The orange point corresponds to αS in the absence of DMPS but in the presence of 500 μM ABX. Note that the green and orange point are overlapping. The error bars indicate the standard error between triplicate measurements at each titration point. The solid line shows the fit to the same model as in panel (b). | ||
To obtain more quantitative measurements of the affinity of ABX to DMPS membranes, we determined the fraction of bound αS to DMPS membranes for each ABX concentration from the CD signal at 222 nm and eqn (1) and (2), SI. We then fit the fraction bound to a competitive binding model, as previously done for β-synuclein and other small molecule inhibitors.47,56 The model quantitatively captures the data accurately and, using the known affinity and stoichiometry of αS to DMPS membranes, yielded an affinity between DMPS and ABX of KD = 86 ± 68 nM and stoichiometry of 1.23 ± 0.06 DMPS molecules per ABX molecule in the complex (KD = 62 ± 21 nM and stoichiometry of 1.30 ± 0.04 DMPS molecules per ABX molecule at pH 5.5, Fig. S8).
To confirm these results using a technique that is independent of the secondary structure change upon binding, we followed the titration of the αS–DMPS complex with ABX with flow induced dispersion analysis (FIDA). In this experiment, we measured the hydrodynamic radius (Rh) of the fluorescently labeled αS from its diffusion rate in the absence and presence of DMPS. Fig. 2c shows the raw Taylor grams of Alexa 488 labeled αS with DMPS and increasing ABX concentrations (from dark purple to light yellow). Here, the width of the peak correlates with the diffusion coefficient and thus with the hydrodynamic radius of the fluorescent molecule. The spikes in the curves indicate a larger, non-diffusive particle in the sample passing the detector. Taylor grams were converted into diffusion coefficient using the FIDA software (Fig. 2d). Fig. 2d shows the calculated average size of αS in samples with increasing ABX concentrations. In the absence of DMPS and ABX, the calculated size of αS was found to be 6 nm (green dot and dashed line, Fig. 2d), a value similar to that previously determined using microfluidics,57 pulsed-field gradient NMR,58 fluorescence correlation59 and small-angle X-ray scattering (SAXS).60 Notably, the size of monomeric αS in the presence of ABX was the same as that in the absence of the small molecule (orange dot, Fig. 2d). The complex size of αS with DMPS was determined to be approximately 40 nm in radius, a value in the range of what we expected when the DMPS model membranes were produced by extrusion with pore sizes of 100 nm, and is similar to that measured using microfluidics, Dynamic Light Scattering (DLS) and SAXS measurements.14,57 With increasing ABX concentrations, the average size of αS in the samples was reduced until it reached ∼6 nm, corresponding to the size we determined for αS without DMPS. Interestingly, the ABX:DMPS ratio at which we observed a change in the αS:DMPS complex is much higher in the FIDA measurements than it was in the CD measurements. This could suggest that αS stays transiently bound to the DMPS model membranes after the alpha helix is lost. The fit of the average Rh of αS for increasing ABX:DMPS ratio to the same binding model used for the CD data in Fig. 2b gives a KD of 0.4 ± 0.2 μM and a stoichiometry of 0.22 ± 0.02 DMPS molecules per ABX molecule in the complex (Fig. 2d).
To further investigate the interaction between ABX and DMPS, we performed fp measurements of DMPS model membranes with the fluorophore 1,6-diphenyl-1,3,5-hexatriene (DPH) and increasing ABX concentrations. The polarization of DPH depends on the fluidity of the DMPS membrane as DPH is buried in the lipid bilayer.61 In the absence of ABX, the measured fp was approximately 350 mP, a value characteristic of a membrane in the gel phase, as expected for DMPS at temperatures below the melting temperature of approximately 45 °C (Fig. S9). In the presence of increasing ABX concentrations, the measured fp decreased to around 150 mP, a value characteristic of a membrane in the fluid phase. These results indicate that ABX binds to the DMPS membrane and that ABX:DMPS binding leads to the melting of the membrane as observed for αS8 and other small molecules known to displace αS from the membrane, such as squalamine.47
Altogether, these results show that ABX displaces the protein from DMPS membranes via a competitive binding mechanism. We next used kinetic analysis to uncover the microscopic steps in the process of DMPS:αS coaggregation that ABX is affecting.
2.3 Kinetic analysis of lipid–αS coaggregation in the absence of ABX
We first established a baseline kinetic model for the uninhibited system. This kinetic analysis of aggregation in the absence of ABX is essential to later resolve the specific aggregation mechanisms perturbed by ABX. Aggregation dynamics were monitored via ThT fluorescence under two main experimental series: (i) varying initial DMPS concentrations at constant αS concentration (Fig. 3a and b), and (ii) varying αS concentrations at fixed DMPS levels (Fig. 3c and d), each conducted at pH 5.5 (Fig. 3a and c) and pH 6.5 (Fig. 3b and d). Our modeling approach builds on a previously developed chemical kinetics framework for lipid–αS coaggregation.16,17 In this model, the aggregation kinetics are governed by a two-step nucleation process, with oligomerization (with rate constant ko) and conversion (with rate constant kc), followed by coaggregate growth (with rate constant k+) (Fig. 3e). Across all conditions, the experimental data show excellent agreement with the theoretical predictions from our integrated rate laws (solid lines in Fig. 3a–d) over a broad range of protein and lipid concentrations, with explicit mathematical details of our model described in the Methods section in the SI. | ||
| Fig. 3 Kinetic analysis reveals the mechanistic difference in αS–DMPS coaggregation kinetics between pH 5.5 and pH 6.5 in the absence of ABX. (a–d) ThT fluorescence curves from experiments with either a constant concentration of αS (50 μM) and varying DMPS concentrations (a and b), or a constant concentration of DMPS (200 μM) and varying αS concentration (c and d). The experiments were performed at both pH 5.5 (a and c) and pH 6.5 (b and d). The aggregation data (scatter points) were globally fit to the integrated rate law eqn (5), SI, (solid lines) to determine the values for the different aggregation rate parameters in the absence of ABX. Details on the fitting procedure can be found in Fig. S3 and parameters in Table S1. (e and f) Schematic representation of the microscopic mechanisms in lipid–αS coaggregation (e) and overview of the rate parameters extracted from fitting the experimental kinetic data reported as the mean ± the standard deviation (f). | ||
Through globally fitting our model to the experimental data, we can quantify the associated aggregation rate constants (Fig. 3f). At pH 6.5, the values for these rate constants confirm a two-step nucleation mechanism in which both oligomer formation and conversion are kinetically relevant. In contrast, the pH 5.5 data yield a markedly higher value of kc, consistent with a regime where primary nucleation becomes effectively one-step. The shift from two-step to one-step nucleation with decreasing pH is especially clear when examining the initial time dependence of the aggregate mass concentration, M(t). According to our integrated rate laws, one-step nucleation yields a quadratic scaling at early times, M(t) ∼ t2. In contrast, a two-step mechanism gives rise to higher-order time dependence, typically M(t) ∼ tn with 2 < n < 3, reflecting the additional oligomerization step before conversion.16 Analysis of the early-time data yields a scaling close to M(t) ∼ t3 at pH 6.5, which shifts to a scaling close to M(t) ∼ t2 at pH 5.5 (Fig. S10).
2.4 Mechanism of inhibition of lipid–αS coaggregation by ABX
Next, we sought to understand how ABX inhibits the αS–DMPS coaggregation into amyloid fibrils. To this end, we employed the same two-step kinetic model used to describe the uninhibited system and, by leveraging the parameters previously extracted from the uninhibited kinetics (Fig. 3f), we systematically perturbed individual microscopic steps in the model to capture the effect of ABX on aggregation. Kinetic traces reveal the impact of varying concentrations of ABX on aggregation kinetics at pH 5.5 and 6.5 (Fig. 4a and b, respectively). The decrease in plateau fluorescence recorded in Fig. 4a and b indicates that the yield of coaggregates decreases with increasing ABX concentrations, assuming a correlation with aggregated protein mass and ThT fluorescence as previously confirmed experimentally.8 Given that the yield of amyloid fibril formation is limited by available lipid under our experimental conditions,16 and that ABX was found to displace αS from DMPS model membranes (Fig. 2), we initially considered whether ABX inhibition could be explained solely by a reduction in effective lipid concentration, i.e. by only preventing the binding of αS to DMPS membranes. However, model fitting in which only lipid availability was reduced failed to capture the full kinetic profiles (Fig. S11), suggesting that ABX is also directly inhibiting a microscopic reaction in the aggregation pathway.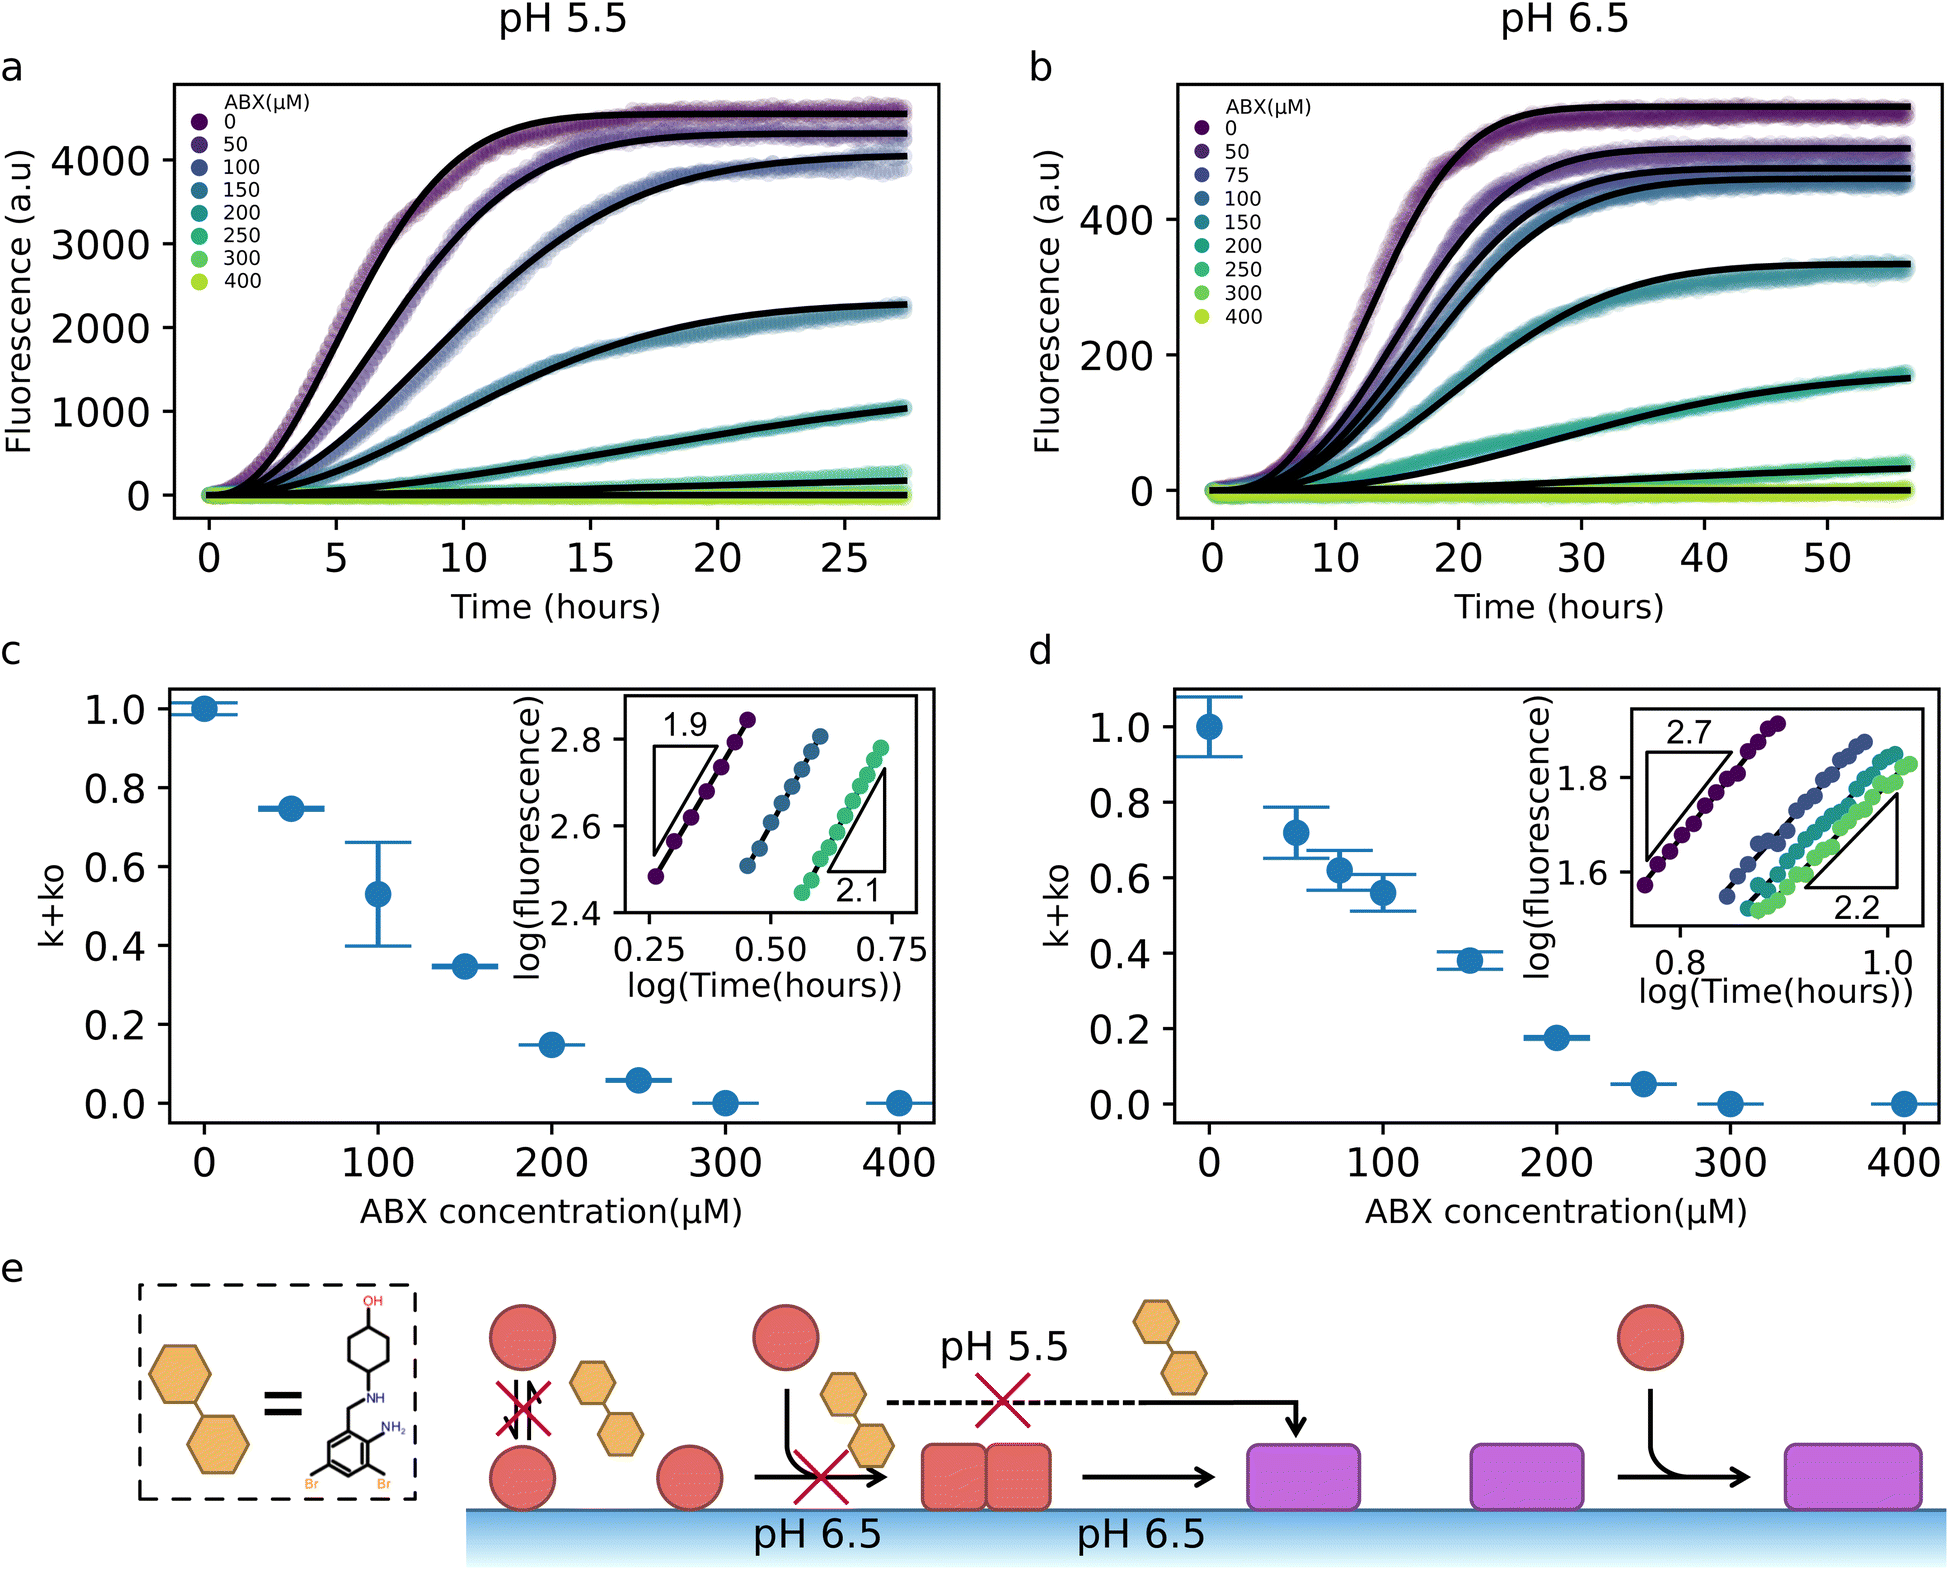 | ||
| Fig. 4 Identification of microscopic mechanism through which ABX affects αS–lipid coaggregation. (a and b) The experimental ThT profiles (scatter points – in triplicates) at different ABX concentrations and at pH 5.5 (a) or pH 6.5 (b) are compatible with our integrated rate law when the rate parameter of oligomer formation, ko, is reduced in a ABX-concentration dependent manner (black lines). (c and d) Effective microscopic rate constant ko as a function of ABX concentration, reported relative to the values in the absence of ABX. Error bars in panels were obtained by independently fitting each of the three replicate kinetic curves to our model, extracting the corresponding effective rate constants, and calculating the standard deviation across replicates. Insets: Double-logarithmic plots of ThT curves at early times show how ABX affects the early-time scaling M(t) ∼ tn. The slope of the lines corresponds to the exponent n. A value n = 2 indicates a one-step nucleation mechanism, whereas a value n = 3 indicates a two-step nucleation mechanism. All fitting parameters can be found in Table S1. (e) Schematic representation of the proposed inhibition mechanism by ABX. | ||
To identify the inhibited step, we therefore perturbed specific microscopic rate constants in our kinetic model in response to changing ABX concentration. This analysis indicates that our experimental data are consistent with a scenario where only the oligomer formation rate k+ko was reduced in an ABX-dependent manner, while kc was held fixed (Fig. 4c and d). This strategy yielded excellent agreement with the data across a wide range of ABX concentrations and at both pH values. The extracted k+ko values exhibit a monotonic decrease with increasing ABX concentrations (Fig. 4c and d).
Furthermore, the proposed inhibition of oligomer formation as the mechanism of action of ABX is consistent with the changes in the early-time curvature of the kinetic traces as the ABX concentration increases (insets of Fig. 4c and d). Specifically, early-time log–log plots of aggregate mass versus time at pH 6.5 show a reduction in the effective scaling exponent from ∼3 to ∼2 as ABX concentration increases (inset of Fig. 4d). A t3 scaling is typically indicative of a two-step nucleation process with a rate-limiting oligomer conversion step, while a t2 scaling implies that the oligomer conversion process is no longer rate-limiting and that, therefore, the oligomer formation process is rate limiting.62 The shift towards a quadratic scaling indicates that the presence of ABX slows down the overall aggregation rate by inhibiting oligomer formation, making the conversion step less rate-limiting. At pH 5.5, where kc is already high and conversion is not rate-limiting, the early-time kinetics remain quadratic, consistent with a picture where ABX targets the oligomer formation step (inset of Fig. 4c). Taken together, these results are compatible with a mechanism whereby ABX inhibits αS–DMPS coaggregation into amyloid fibrils by interfering with the formation of early oligomeric nuclei (Fig. 4e).
3 Conclusions
In this study, we show that ABX, a small molecule known to stabilise GCase and restore lysosomal function associated with GBA mutations, can act directly on the aggregation of αS by inhibiting its coaggregation with lipid molecules into amyloid fibrils. Using kinetic analysis of DMPS–αS coaggregation curves, we discovered that ABX specifically inhibits the primary nucleation step of the process of lipid–protein coaggregation and decreases the rate of formation of early oligomers. The inhibitory effect of ABX was specific to the small molecule as we did not observe an effect of CBE, a small molecule inhibitor of GCase, on DMPS–αS coaggregation. Moreover, ABX specifically inhibits the process of DMPS–αS coaggregation into amyloid fibrils as we did not observe any effect of the small molecule chaperone on αS aggregation in the absence of lipids, i.e. in polystyrene plates or in the presence of seeds in non-binding plates under quiescent conditions.In light of the fact that ABX inhibits specifically DMPS–αS coaggregation, we investigated the effect of ABX in the interaction between αS and DMPS model membranes using both CD spectroscopy, a spectroscopic method dependent on secondary structure changes upon binding, and Taylor dispersion analysis, a diffusion based method independent of secondary structure changes upon binding. The results from the titrations of ABX into the DMPS:αS system show that ABX displaces αS from the lipid model membranes. Measurements of the fluidity of the DMPS model membranes revealed that increasing ABX concentrations also increased the fluidity of the model membranes (Fig. S9). Since ABX has no effect on αS aggregation in the absence of DMPS (Fig. S6), these binding data suggest that ABX does not interact directly with αS in solution but displaces the protein from the DMPS membranes via a competitive binding. In this study we used N-terminally acetylated αS because this PTM is found on the physiological form of the protein.42 Other PTMs have been reported for αS in vivo, some of them affecting the protein–membrane interactions.42,63,64 To gain a deeper understanding of the effect of ABX in vivo on αS–membrane binding and αS–lipid coaggregation into amyloid fibrils, it would be necessary to extend our study to αS with other physiologically relevant PTMs.
Given that pH varies through the lysosomal maturation where ABX performs its chaperonal activity on GCase,29,30 and has been shown to change αS aggregation rate, we investigated the effect of ABX at both pH 6.5 and 5.5. Aggregation occurred faster at lower pH, as has been shown in previous studies.44,65 The kinetic analyses of the aggregation curves at pH 6.5 and 5.5 show that this acceleration is mainly due to an increase in the conversion rate. Even under these faster aggregating conditions, ABX still inhibited the DMPS–αS coaggregation at pH 5.5.
Altogether, these results highlight a dual role for ABX as a small molecule capable of both stabilizing GCase and inhibiting αS:lipid coaggregation. ABX is a promising molecule for the treatment of PD and is currently in phase 2 and 3 of clinical trials as a treatment for GBA associated PD as well as in clinical trials as a treatment for dementia with Lewy bodies (DLB).39–41 Our study suggests that ABX may prevent αS aggregation in different synucleinopathies including PD, DLB and Multiple System Atrophy.
Author contributions
Designed research: JED, AS, TCTM, CG; performed research: JED, AS, EC, KS; analyzed data: JED, AS, TCTM, CG; wrote the paper: JED, AS, TCM, CG.Conflicts of interest
There are no conflicts to declare.Data availability
Data for this article, including raw experimental data (ThT fluorescence, CD, FIDA, fluorescence polarisation measurements) are available at https://zenodo.org/records/17492431.Supplementary information: materials and methods, Tables S1, S2 and Fig. S1–S11. See DOI: https://doi.org/10.1039/d5sc06116d.
Acknowledgements
This work was supported by ETH Zurich (A. S., T. C. T. M.), the Swiss National Science Foundation (Grant Number SNS 219703) (T. C. T. M.), the Novo Nordisk Foundation (Grant number: NNF20OC0059417, J. E. D., E. C., C. G.) and the Independent Research Fund Denmark (Grant number: 3103-00220B, K. S. and C. G.). We acknowledge the Core Facility for Integrated Microscopy, Faculty of Health and Medical Sciences, University of Copenhagen.Notes and references
- E. R. Dorsey, A. Elbaz, E. Nichols, N. Abbasi, F. Abd-Allah, A. Abdelalim, J. C. Adsuar, M. G. Ansha, C. Brayne, J.-Y. J. Choi, D. Collado-Mateo, N. Dahodwala, H. P. Do, D. Edessa, M. Endres, S.-M. Fereshtehnejad, K. J. Foreman, F. G. Gankpe, R. Gupta, S. Hamidi, G. J. Hankey, S. I. Hay, M. I. Hegazy, D. T. Hibstu, A. Kasaeian, Y. Khader, I. Khalil, Y.-H. Khang, Y. J. Kim, Y. Kokubo, G. Logroscino, J. Massano, N. Mohamed Ibrahim, M. A. Mohammed, A. Mohammadi, M. Moradi-Lakeh, M. Naghavi, B. T. Nguyen, Y. L. Nirayo, F. A. Ogbo, M. O. Owolabi, D. M. Pereira, M. J. Postma, M. Qorbani, M. A. Rahman, K. T. Roba, H. Safari, S. Safiri, M. Satpathy, M. Sawhney, A. Shafieesabet, M. S. Shiferaw, M. Smith, C. E. I. Szoeke, R. Tabarés-Seisdedos, N. T. Truong, K. N. Ukwaja, N. Venketasubramanian, S. Villafaina, K. G. Weldegwergs, R. Westerman, T. Wijeratne, A. S. Winkler, B. T. Xuan, N. Yonemoto, V. L. Feigin, T. Vos and C. J. L. Murray, Lancet Neurol., 2018, 17, 939–953 CrossRef PubMed
.
- D. K. Simon, C. M. Tanner and P. Brundin, Clin. Geriatr. Med., 2020, 36, 1–12 CrossRef
- M. G. Spillantini, M. L. Schmidt, V. M. Lee, J. Q. Trojanowski, R. Jakes and M. Goedert, Nature, 1997, 388, 839–840 CrossRef CAS PubMed
- S. H. Shahmoradian, A. J. Lewis, C. Genoud, J. Hench, T. E. Moors, P. P. Navarro, D. Castaño-Díez, G. Schweighauser, A. Graff-Meyer, K. N. Goldie, R. Sütterlin, E. Huisman, A. Ingrassia, Y. d. Gier, A. J. M. Rozemuller, J. Wang, A. D. Paepe, J. Erny, A. Staempfli, J. Hoernschemeyer, F. Großerüschkamp, D. Niedieker, S. F. El-Mashtoly, M. Quadri, W. F. J. Van IJcken, V. Bonifati, K. Gerwert, B. Bohrmann, S. Frank, M. Britschgi, H. Stahlberg, W. D. J. Van de Berg and M. E. Lauer, Nat. Neurosci., 2019, 22, 1099–1109 CrossRef CAS
- B. G. Wilhelm, S. Mandad, S. Truckenbrodt, K. Kröhnert, C. Schäfer, B. Rammner, S. J. Koo, G. A. Claßen, M. Krauss, V. Haucke, H. Urlaub and S. O. Rizzoli, Science, 2014, 344, 1023–1028 CrossRef CAS PubMed
- J. Burré, J. Parkinson's Dis., 2015, 5, 699–713 Search PubMed
- R. Gaspar, G. Meisl, A. K. Buell, L. Young, C. F. Kaminski, T. P. J. Knowles, E. Sparr and S. Linse, Q. Rev. Biophys., 2017, 50, e6 CrossRef PubMed
- C. Galvagnion, A. K. Buell, G. Meisl, T. C. T. Michaels, M. Vendruscolo, T. P. J. Knowles and C. M. Dobson, Nat. Chem. Biol., 2015, 11, 229–234 CrossRef CAS PubMed
- M. Necula, C. N. Chirita and J. Kuret, J. Biol. Chem., 2003, 278, 46674–46680 CrossRef CAS PubMed
- K. J. Vargas, N. Schrod, T. Davis, R. Fernandez-Busnadiego, Y. V. Taguchi, U. Laugks, V. Lucic and S. S. Chandra, Cell Rep., 2017, 18, 161–173 CrossRef CAS PubMed
- C. Galvagnion, J. W. P. Brown, M. M. Ouberai, P. Flagmeier, M. Vendruscolo, A. K. Buell, E. Sparr and C. M. Dobson, Proc. Natl. Acad. Sci. U. S. A., 2016, 113, 7065–7070 CrossRef CAS
- Z. Martinez, M. Zhu, S. Han and A. L. Fink, Biochemistry, 2007, 46, 1868–1877 CrossRef CAS
- T. Ryan, V. V. Bamm, M. G. Stykel, C. L. Coackley, K. M. Humphries, R. Jamieson-Williams, R. Ambasudhan, D. D. Mosser, S. A. Lipton, G. Harauz and S. D. Ryan, Nat. Commun., 2018, 9, 817 CrossRef PubMed
- C. Galvagnion, A. Barclay, K. Makasewicz, F. R. Marlet, M. Moulin, J. M. Devos, S. Linse, A. Martel, L. Porcar, E. Sparr, M. C. Pedersen, F. Roosen-Runge, L. Arleth and A. K. Buell, Phys. Chem. Chem. Phys., 2024, 26, 10998–11013 RSC
- J. Ramirez, S. X. Pancoe, E. Rhoades and E. J. Petersson, Biomolecules, 2023, 13, 1476 CrossRef CAS PubMed
- A. Stevenson, R. Staats, A. J. Dear, D. Voderholzer, J. E. Dreier, G. Meisl, R. Guido, T. P. J. Knowles, C. Galvagnion, A. K. Buell, M. Vendruscolo and T. C. T. Michaels, Proc. Natl. Acad. Sci. U. S. A., 2025, 122, e2422427122 CrossRef CAS
- A. Stevenson, D. Voderholzer and T. C. T. Michaels, J. Chem. Phys., 2025, 163, 144905 CrossRef CAS PubMed
- C. Galvagnion, J. Parkinson's Dis., 2017, 7, 433–450 CAS
- S. S. Muñoz, D. Petersen, F. R. Marlet, E. Kücükköse and C. Galvagnion, Biophys. Chem., 2021, 273, 106534 CrossRef
- C. Galvagnion, F. R. Marlet, S. Cerri, A. H. V. Schapira, F. Blandini and D. A. Di Monte, Brain, 2022, 145, 1038–1051 CrossRef PubMed
- C. E. G. Leyns, A. Prigent, B. Beezhold, L. Yao, N. G. Hatcher, P. Tao, J. Kang, E. Suh, V. M. Van Deerlin, J. Q. Trojanowski, V. M. Y. Lee, M. E. Kennedy, M. J. Fell and M. X. Henderson, npj Parkinson's Dis., 2023, 9, 74 CrossRef CAS PubMed
- J. Mazzulli, Y.-H. Xu, Y. Sun, A. Knight, P. McLean, G. Caldwell, E. Sidransky, G. Grabowski and D. Krainc, Cell, 2011, 146, 37–52 CrossRef CAS
- M. Ikuno, H. Yamakado, H. Akiyama, L. K. Parajuli, K. Taguchi, J. Hara, N. Uemura, Y. Hatanaka, K. Higaki, K. Ohno, M. Tanaka, M. Koike, Y. Hirabayashi and R. Takahashi, Hum. Mol. Genet., 2019, 28, 1894–1904 CrossRef CAS PubMed
- G. Legler, Hoppe-Seyler's Z. Physiol. Chem., 1966, 345, 197–214 CrossRef CAS PubMed
- E. I. Ginns, S. K.-K. Mak, N. Ko, J. Karlgren, S. Akbarian, V. P. Chou, Y. Guo, A. Lim, S. Samuelsson, M. L. LaMarca, J. Vazquez-DeRose and A. B. Manning-Boğ, Mol. Genet. Metab., 2014, 111, 152–162 CrossRef CAS PubMed
- S. R. L. Vieira and A. H. V. Schapira, J. Neural Transm., 2022, 129, 1105–1117 CrossRef PubMed
- R. Balestrino and A. H. V. Schapira, Neuroscientist, 2018, 24, 540–559 CrossRef CAS PubMed
- E. Menozzi, M. Toffoli and A. H. Schapira, Pharmacol. Ther., 2023, 246, 108419 CrossRef CAS
- G. H. B. Maegawa, M. B. Tropak, J. D. Buttner, B. A. Rigat, M. Fuller, D. Pandit, L. Tang, G. J. Kornhaber, Y. Hamuro, J. T. R. Clarke and D. J. Mahuran, J. Biol. Chem., 2009, 284, 23502–23516 CrossRef CAS
- I. Bendikov-Bar, G. Maor, M. Filocamo and M. Horowitz, Blood Cells, Mol., Dis., 2013, 50, 141–145 CrossRef CAS PubMed
- Z. Luan, L. Li, K. Higaki, E. Nanba, Y. Suzuki and K. Ohno, Brain Dev., 2013, 35, 317–322 CrossRef PubMed
- S.-Y. Yang, M. Beavan, K.-Y. Chau, J.-W. Taanman and A. H. Schapira, Stem Cell Rep., 2017, 8, 728–742 CrossRef CAS
- S.-y. Yang, M. Gegg, D. Chau and A. Schapira, Neurobiol. Dis., 2020, 134, 104620 CrossRef CAS PubMed
- S. Y. Yang, J.-W. Taanman, M. Gegg and A. H. V. Schapira, Hum. Mol. Genet., 2022, 31, 2396–2405 CrossRef CAS PubMed
- G. Ambrosi, C. Ghezzi, R. Zangaglia, G. Levandis, C. Pacchetti and F. Blandini, Neurobiol. Dis., 2015, 82, 235–242 CrossRef CAS PubMed
- A. Sanchez-Martinez, M. Beavan, M. E. Gegg, K.-Y. Chau, A. J. Whitworth and A. H. V. Schapira, Sci. Rep., 2016, 6, 31380 CrossRef CAS PubMed
- A. McNeill, J. Magalhaes, C. Shen, K.-Y. Chau, D. Hughes, A. Mehta, T. Foltynie, J. M. Cooper, A. Y. Abramov, M. Gegg and A. H. V. Schapira, Brain, 2014, 137, 1481–1495 CrossRef PubMed
- A. Migdalska-Richards, L. Daly, E. Bezard and A. H. V. Schapira, Ann. Neurol., 2016, 80, 766–775 CrossRef CAS PubMed
- L. J. Chwiszczuk, M. H. Breitve, B.-E. B. Kirsebom, P. Selnes, J. C. Fløvig, A.-B. Knapskog, R. E. Skogseth, J. Hubbers, E. Holst-Larsen and A. Rongve, Front. Aging Neurosci., 2023, 15, 1163184 CrossRef CAS PubMed
- F. Colucci, M. Avenali, R. De Micco, M. Fusar Poli, S. Cerri, M. Stanziano, A. Bacila, G. Cuconato, V. Franco, D. Franciotta, C. Ghezzi, M. Gastaldi, A. E. Elia, L. Romito, G. Devigili, V. Leta, B. Garavaglia, N. Golfrè
Andreasi, F. Cazzaniga, C. Reale, C. Galandra, G. Germani, P. Mitrotti, G. Ongari, I. Palmieri, M. Picascia, A. Pichiecchio, M. Verri, F. Esposito, M. Cirillo, F. Di Nardo, S. Aloisio, M. Siciliano, S. Prioni, P. Amami, S. Piacentini, M. G. Bruzzone, M. Grisoli, F. Moda, R. Eleopra, A. Tessitore, E. M. Valente and R. Cilia, BMJ Neurol. Open, 2023, 5, e000535 CrossRef PubMed
- O. Siemeling, S. Slingerland, S. van der Zee and T. van Laar, BMC Neurol., 2024, 24, 146 CrossRef CAS PubMed
- J. P. Anderson, D. E. Walker, J. M. Goldstein, R. de Laat, K. Banducci, R. J. Caccavello, R. Barbour, J. Huang, K. Kling, M. Lee, L. Diep, P. S. Keim, X. Shen, T. Chataway, M. G. Schlossmacher, P. Seubert, D. Schenk, S. Sinha, W. P. Gai and T. J. Chilcote, J. Biol. Chem., 2006, 281, 29739–29752 CrossRef CAS PubMed
- C. Galvagnion, D. Topgaard, K. Makasewicz, A. K. Buell, S. Linse, E. Sparr and C. M. Dobson, J. Phys. Chem. Lett., 2019, 10, 7872–7877 CrossRef CAS PubMed
- A. K. Buell, C. Galvagnion, R. Gaspar, E. Sparr, M. Vendruscolo, T. P. J. Knowles, S. Linse and C. M. Dobson, Proc. Natl. Acad. Sci. U. S. A., 2014, 111, 7671–7676 CrossRef CAS
- C. M. Haney, C. L. Cleveland, R. F. Wissner, L. Owei, J. Robustelli, M. J. Daniels, M. Canyurt, P. Rodriguez, H. Ischiropoulos, T. Baumgart and E. J. Petersson, Biochemistry, 2017, 56, 683–691 CrossRef CAS PubMed
- K. C. Luk, E. G. Hyde, J. Q. Trojanowski and V. M.-Y. Lee, Biochemistry, 2007, 46, 12522–12529 CrossRef CAS
- M. Perni, C. Galvagnion, A. Maltsev, G. Meisl, M. B. D. Müller, P. K. Challa, J. B. Kirkegaard, P. Flagmeier, S. I. A. Cohen, R. Cascella, S. W. Chen, R. Limbocker, P. Sormanni, G. T. Heller, F. A. Aprile, N. Cremades, C. Cecchi, F. Chiti, E. A. A. Nollen, T. P. J. Knowles, M. Vendruscolo, A. Bax, M. Zasloff and C. M. Dobson, Proc. Natl. Acad. Sci. U. S. A., 2017, 114, E1009–E1017 CrossRef CAS PubMed
- M. Perni, P. Flagmeier, R. Limbocker, R. Cascella, F. A. Aprile, C. Galvagnion, G. T. Heller, G. Meisl, S. W. Chen, J. R. Kumita, P. K. Challa, J. B. Kirkegaard, S. I. A. Cohen, B. Mannini, D. Barbut, E. A. A. Nollen, C. Cecchi, N. Cremades, T. P. J. Knowles, F. Chiti, M. Zasloff, M. Vendruscolo and C. M. Dobson, ACS Chem. Biol., 2018, 13, 2308–2319 CrossRef CAS PubMed
- C. C. Jao, B. G. Hegde, J. Chen, I. S. Haworth and R. Langen, Proc. Natl. Acad. Sci. U. S. A., 2008, 105, 19666–19671 CrossRef CAS
- A. J. Trexler and E. Rhoades, Biochemistry, 2009, 48, 2304–2306 CrossRef CAS PubMed
- T. Schwarz, A. Beier, K. Ledolter, T. Gossenreiter, T. Höfurthner, M. Hartl, T. Baker, R. Taylor and R. Konrat, Proc. Natl. Acad. Sci. U. S. A., 2023, 120, e2201910120 CrossRef CAS PubMed
- W. S. Davidson, A. Jonas, D. F. Clayton and J. M. George, J. Biol. Chem., 1998, 273, 9443–9449 CrossRef CAS PubMed
- E. Jo, J. McLaurin, C. M. Yip, P. St. George-Hyslop and P. E. Fraser, J. Biol. Chem., 2000, 275, 34328–34334 CrossRef CAS PubMed
- E. Cholak, K. Bugge, A. Khondker, K. Gauger, E. Pedraz-Cuesta, M. E. Pedersen, S. Bucciarelli, B. Vestergaard, S. F. Pedersen, M. C. Rheinstädter, A. E. Langkilde and B. B. Kragelund, FASEB J., 2020, 34, 7462–7482 CrossRef CAS PubMed
- L. Kalyani and C. V. Rao, Karbala Int. J. Mod. Sci., 2018, 4, 171–179 CrossRef
- J. W. P. Brown, A. K. Buell, T. C. T. Michaels, G. Meisl, J. Carozza, P. Flagmeier, M. Vendruscolo, T. P. J. Knowles, C. M. Dobson and C. Galvagnion, Sci. Rep., 2016, 6, 36010 CrossRef CAS PubMed
- H. Gang, C. Galvagnion, G. Meisl, T. Müller, M. Pfammatter, A. K. Buell, A. Levin, C. M. Dobson, B. Mu and T. P. J. Knowles, Anal. Chem., 2018, 90, 3284–3290 CrossRef CAS PubMed
- A. S. Morar, A. Olteanu, G. B. Young and G. J. Pielak, Protein Sci., 2001, 10, 2195–2199 CrossRef CAS PubMed
- M. Wolff, J. J. Mittag, T. W. Herling, E. D. Genst, C. M. Dobson, T. P. J. Knowles, D. Braun and A. K. Buell, Sci. Rep., 2016, 6, 22829 CrossRef CAS PubMed
- V. N. Uversky, J. Li and A. L. Fink, J. Biol. Chem., 2001, 276, 10737–10744 CrossRef CAS PubMed
- A. M. T. M. do Canto, J. R. Robalo, P. D. Santos, A. J. P. Carvalho, J. P. P. Ramalho and L. M. S. Loura, Biochim. Biophys. Acta, 2016, 1858, 2647–2661 CrossRef CAS PubMed
- G. A. Garcia, S. I. A. Cohen, C. M. Dobson and T. P. J. Knowles, Phys. Rev. E: Stat., Nonlinear, Soft Matter Phys., 2014, 89, 032712 CrossRef PubMed
- R. Bell and M. Vendruscolo, Front. Neurol., 2021, 12, 661117 CrossRef PubMed
- F. Samuel, W. P. Flavin, S. Iqbal, C. Pacelli, S. D. Sri Renganathan, L.-E. Trudeau, E. M. Campbell, P. E. Fraser and A. Tandon, J. Biol. Chem., 2016, 291, 4374–4385 CrossRef CAS PubMed
- W. Hoyer, T. Antony, D. Cherny, G. Heim, T. M. Jovin and V. Subramaniam, J. Mol. Biol., 2002, 322, 383–393 CrossRef CAS PubMed
| This journal is © The Royal Society of Chemistry 2026 |