DOI:
10.1039/D5NA00916B
(Paper)
Nanoscale Adv., 2026,
8, 989-1004
Morphology-driven ionic pathway engineering in CuCo2O4/carbon nanotubes for high diffusion hybrid supercapacitors across diverse electrolyte conditions
Received
25th September 2025
, Accepted 20th November 2025
First published on 18th December 2025
Abstract
In tandem with conductive carbon nanomaterials, redox-active spinel oxides offer a promising strategy to improve the efficacy of electrochemical energy storage devices. Among them, CuCo2O4 (CCO) has attracted considerable attention; however, systematic evaluations of its controlled morphology and diffusion dynamics in varied electrolytes remain scarce. In this study, we engineered CCO nanorods, spherical particles, and their nanocomposites with carbon nanotubes (5, 10, and 15 wt%), named CCO-I, CCO-II, and CCO-III, to investigate diffusion behaviour using the galvanostatic intermittent titration technique across different electrolytic conditions, along with key performance parameters. Electron microscopy verified the successful formation of the desired morphologies, where nanorods provided large surface-active sites and spherical particles offered high volumetric energy density. Electrochemical measurements in 1 M KOH, coupled with theoretical investigation using Dunn's model and determination coefficients (R2), revealed a mixed capacitive-faradaic charge storage nature of the samples. Among all variants, CCO-II delivered the best performance, with a specific capacity of 1702.01 C g−1 along with an energy density of 113.46 Wh kg−1. It also retained 99.94% capacity after 4500 cycles at 0.4 A g−1, while galvanostatic intermittent titration technique showed balanced diffusion coefficients of 3.9 × 10⁻¹¹ cm2 s−1 in 1 M KOH and 4.1 × 10⁻¹¹ cm2 s−1 in 3 M NaOH. Further, the optimized sample exhibited low internal resistance and high ionic conductivity. Overall, these results highlight the potential of the CCO-II as a promising candidate for high-performance energy storage electrodes.
1 Introduction
The rapid development of energy storage devices (ESDs) has become a key focus of scientific research, driven by an urgent need to meet global energy demands while addressing environmental concerns.1–4 Given the scarcity of fossil fuel reserves and their detrimental effects on the environment, the search for sustainable and alternative energy storage solutions has become essential.5 Various ESDs, including batteries and fuel cells, have been extensively studied in this context.6 The seventh Sustainable Development Goal set by the United Nations aims to provide clean, reliable, and affordable energy by 2030, further fuelling research into effective solutions.7,8 Among the wide range of ESDs, supercapacitors (SCs), also known as electrochemical (EC) capacitors, have emerged as revolutionary devices that combine features of batteries and traditional capacitors.9–11 These devices are vital for numerous applications such as portable devices, electric vehicles, and renewable energy systems because of their long cycle life, superior power density (Pd), and fast charge/discharge (CD) capabilities.12–15 However, their relatively low energy density (Ed) compared to batteries limits widespread use, prompting the development of new strategies to enhance their performance.13–17
The energy storage mechanism of SCs primarily involves two processes: faradaic and non-faradaic. The faradaic process involves quick redox reactions at the surface of the electrode, while the non-faradaic process results from the electrostatic accumulation of ions at the electrode–electrolyte interface.18,19 Early on, SCs mainly utilized carbonaceous materials because they offer a large surface area (SA) and high conductivity, which is suitable for electric double-layer capacitors (EDLCs). Nonetheless, the purely electrostatic nature of ion adsorption inherently limits their Ed. This led to the development of pseudocapacitors (PCs), which employ transition metal oxides (TMOs) like RuO2 and MnO2 and conductive polymers to boost energy storage via faradaic reactions. The technological advancement was further accelerated by hybrid capacitors (HCs), which combine PCs and EDLC materials to enhance both Ed and Pd.20,21
Binary metal oxides, such as CCO, have garnered attention as pseudocapacitive materials because of their high theoretical capacity, excellent rate capability, eco-friendliness, and cost-effectiveness.22–24 The mixed oxidation states of cobalt and copper in CCO improve stability and redox activity through their coordinated actions.25 Despite these advantages, CCO faces challenges like low conductivity, limited specific capacitance (Csp), and structural degradation during cycling. To overcome these issues, researchers have explored hybridizing CCO with carbon-based materials to create high-performance composites.22,24 Incorporating carbon nanotubes (CNTs) into electrode materials is a promising approach to address these limitations. CNTs are renowned for their exceptional mechanical strength, electrical conductivity, and high aspect ratio, making them ideal for enhancing structural integrity and charge transfer in composites.26–28 Owing to their unique properties, HCs often include CNTs alongside pseudocapacitive materials to improve overall performance.29
Extensive studies have been undertaken to explore the EC characteristics of CCO-based materials for SC applications. For example, BoopathiRaja et al. synthesized CCO nanoparticles via hydrothermal methods and achieved a maximum specific capacity (Qs) of 764.9 mAh g−1 with a capacitance retention (CR) of 94.5%.30 Bhagwan et al. enhanced the Csp of CuCo2O4 nanoplates by adding multi-walled CNTs using co-precipitation, reaching a Csp of 1052.7 F g−1.31 Arulkumar et al. fabricated CCO/CuO composites on nickel foam (NF), reporting a Csp of 892.7 F g−1 and nearly 100% cyclic stability after 10![[thin space (1/6-em)]](https://www.rsc.org/images/entities/char_2009.gif) 000 cycles.32 Liu et al. synthesized CCO/CuO nanoflowers combined with CNTs, resulting in a Csp of 1083.7 F g−1 along with a CR of 98% over 9000 cycles.33 Semerci et al. developed a CCO/rGO composite using a stepwise synthesis method, achieving a CR of 99% after 10000 cycles along with a Csp of 761.9 F g−1.22 These studies highlight how tailoring structural architecture and hybridization with conductive materials can significantly improve the EC characteristics of CCO for high-efficiency SCs.
000 cycles.32 Liu et al. synthesized CCO/CuO nanoflowers combined with CNTs, resulting in a Csp of 1083.7 F g−1 along with a CR of 98% over 9000 cycles.33 Semerci et al. developed a CCO/rGO composite using a stepwise synthesis method, achieving a CR of 99% after 10000 cycles along with a Csp of 761.9 F g−1.22 These studies highlight how tailoring structural architecture and hybridization with conductive materials can significantly improve the EC characteristics of CCO for high-efficiency SCs.
Most existing research on CCO has focused on its synthesis methods and the fabrication of composites with other carbon-based materials and metal oxides, primarily evaluating metrics like Qs, Ed, and Pd. However, no studies have reported on the ionic conductivity (σ), relaxation time (τ), and diffusion coefficient (Do) of the CCO/CNTs nanocomposite using the galvanostatic intermittent titration technique (GITT). This study aims to synthesize and optimize a CCO/CNTs composite for advanced SCs. Four samples, such as CCO, CCO-I, CCO-II, and CCO-III, were synthesized with CNT ratios of 0, 5, 10, and 15%, respectively. An optimized hydrothermal process, known for producing uniform morphologies, was used to synthesize pristine CCO. Subsequently, a single-step solvothermal process was employed to produce composites with precise control over particle size and CNTs inclusion (CCO-I, CCO-II, CCO-III). This systematic approach enables a detailed investigation into how different CNT concentrations influence the morphology, structure, and EC properties of the composites. Among all samples, CCO-II delivered the best performance, demonstrating excellent cyclic stability, Qs, Ed, and Pd. Key EC parameters, including σ, Do, and τ, were thoroughly examined to understand their impact. These findings underscore the potential of this material for effective and scalable applications in advanced SC systems.
2 Experimental section
2.1 Synthesis of CCO nanoparticles
An optimized hydrothermal approach was used to synthesize the CCO sample, as shown in Fig. 1. The sources and exact quantities of all chemical precursors are provided as SI, and were incorporated as procured, without further treatment, because of their high purity. To form an aqueous solution, stoichiometric quantities of copper(II) nitrate trihydrate, together with cobalt(II) nitrate hexahydrate, were first dissolved in deionized (DI) water. After adding urea (reducing agent) and ammonium fluoride (AF) (fluoride source) to the solution in a 1:1 molar ratio in relation to the metal nitrates, a few drops of ethylene glycol were added. AF was essential in guiding the particular morphology of the final product, while ethylene glycol (solvent) was added to regulate the particle size.16 To facilitate full dissolution and even dispersion of the reactants, the resultant mixture was put on a magnetic stirrer and rapidly agitated for 1 h at room temperature (RT). After that, the uniform mixture was put into an autoclave (180 °C) for 16 h. The hydrothermal process made it easier for the precursors to dissolve and recrystallize under autogenous pressure, resulting in the creation of CCO with distinct morphological and structural properties. After the reaction was complete, the autoclave was cooled to RT. Impurities were eliminated by centrifuging the product and washing it many times with ethanol (dispersing agent) and DI water. The final form of CCO was obtained by drying the material overnight on a hot plate at 60 °C, followed by calcination in a muffle furnace at 550 °C for 3 h to improve crystallinity, eliminate any remaining organic components, and stabilize the material's structure.
 |
| | Fig. 1 Schematic representation of the synthesis process of CCO via the hydrothermal method, CCO-I, CCO-II, and CCO-III by the solvothermal method, followed by the electrode fabrication. | |
2.2 Synthesis of CCO/CNT nanocomposites
Using a facile solvothermal technique, the CCO/CNT nanocomposites were synthesized by integrating different weight percentages of CNTs (5, 10, and 15%) into the CCO framework, as shown in Fig. 1. To ensure equal dispersion, precisely measured amounts of CCO and CNTs were dissolved in 30 mL of ethanol and then ultrasonically treated for 1 h. To create a homogeneous blend, the fluid was then constantly stirred for 2 h at 250 rpm. This thoroughly blended mixture was carefully poured into an autoclave chamber lined with Teflon and sealed tightly. To speed up the solvothermal reaction, the autoclave was heated to 180 °C for 3 h in a muffle furnace. The final product was gathered and repeatedly centrifuged to get rid of any remaining contaminants once it had cooled to RT. After being dried, the refined composite powder was used as the active ingredient in the electrode preparation process.
2.3 Fabrication of the working electrodes
The working electrode (WE) was made by first treating NF (1 cm2) with DI water and hydrochloric acid solution, and then ultrasonically heating it for 1 h. After sonication, it was washed with DI water and subsequently dried at 60 °C for 1 h to improve adhesion. To make a clear solution for the electrode slurry, 300 mg of polyvinylidene fluoride (PVDF) was dissolved in 15 mL of dimethylformamide while being continuously stirred. The active mass, PVDF binder solution, and activated carbon (AC) were then combined in a weight ratio of 85:10:5 to produce a homogeneous slurry. To get a uniform consistency, this mixture was agitated for 8 h at 250 rpm. Through the drop-casting method, the slurry was evenly placed on the NF substrate that had been pre-heated, ensuring that the entire surface was covered, as shown in Fig. 1. The coated NF was dried in an oven (80 °C) for 30 min to harden the electrode and evaporate the solvent. The final electrode was made for EC characterization with a 2.5 mg active material loading.
2.4 Characterization techniques
X-ray diffraction (XRD, Shimadzu XRD-6100) was used for crystallographic evaluation of the synthesized materials using a Cu-Kα source with a wavelength of 1.54 Å. A scanning electron microscope (SEM, Nova Nano SEM-450) was utilized for microstructural investigation. A thin layer of gold was applied to the samples to improve conductivity. Nitrogen adsorption–desorption analysis was performed on a TriStar-II 3020 surface area analyser to evaluate the textural properties, including specific surface area and pore volume, using the Brunauer–Emmett–Teller (BET) method. The EC analysis was carried out using a Corrtest system (CS350M). The complete details of the EC setup are provided in the SI. For EC testing, several techniques were employed: Electrochemical impedance spectroscopy (EIS) to find σ and understand the charge transport, galvanostatic CD (GCD) to evaluate metrics like Ed, Pd, and Qs, cyclic voltammetry (CV) to investigate charge storage behaviour, and GITT was used to assess the Do.
3 Results and discussion
3.1 Structural analysis
XRD was employed to elucidate the crystalline structure, crystallite size, lattice parameters, and degree of crystallinity of the CCO, CCO-I, CCO-II, and CCO-III samples, and the resulting diffraction patterns are given in Fig. 2(a). The peak indexing method outlined by B.D. Cullity was used to interpret these diffraction patterns.34 At the 2θ = 18.9°, 31.2°, 36.8°, 38.4°, 44.5°, 55.5°, 59.4°, and 65.2°, the diffraction pattern of CCO displayed clear Bragg peaks, which are indexed to the (111), (220), (311), (222), (400), (422), (511), and (440) planes, respectively. The observed diffraction angles and their corresponding peaks exhibited a strong match with the reference pattern (00-001-1155A), thereby confirming the formation of the cubic spinel crystal structure of CCO. The diffraction patterns of the nanocomposites (CCO-I, CCO-II, and CCO-III) showed similar peaks at corresponding angles, with no additional peaks caused by the amorphous nature of the CNTs, indicating consistent and high phase purity. The diffraction pattern of all the as-synthesized samples featured sharp and narrow peaks, indicating a high degree of crystallinity. Furthermore, the experimental and reference XRD patterns matched well, confirming the material's structural integrity. Lastly, the average crystallite sizes and lattice constants of all the samples were determined employing Scherrer's relation (D = (λ × 0.9)/(cosθ × β)), and a = d2(h2 + k2 + l2)0.5, respectively, with the resulting values listed in Table 1.17Fig. 2(b) displays the crystal structure of pure CCO and CNTs.
 |
| | Fig. 2 (a) XRD patterns of CCO with 0, 5, 10, and 15% CNTs, (b) crystal structure of CCO and structure of CNTs, (c–e) SEM images of pristine CCO, (f–h) SEM images of CCO-III, (i) elemental mapping of CCO-III, (j–m) presence of oxygen, cobalt, copper, and carbon detected in the multi-coloured image, and (n and o) BET analysis of CCO and CCO-II. | |
Table 1 Lattice constants and crystallite size of CCO, CCO-I, CCO-II, and CCO-III composites
| Sample |
Lattice constants (Å) |
Crystallite size (nm) |
|
a
|
b
|
c
|
| CCO |
8.0 |
8.0 |
8.0 |
15.491 |
| CCO-I |
8.0 |
8.0 |
8.0 |
15.509 |
| CCO-II |
8.0 |
8.0 |
8.0 |
15.790 |
| CCO-III |
8.0 |
8.0 |
8.0 |
15.529 |
3.2 Morphological analysis
The surface morphology of the as-synthesized samples was examined at an accelerating voltage of 15 kV using SEM at both low and high magnifications, with a working scale bar of 100 nm, and the panoramic view is illustrated in Fig. 2(c–h). The low magnification (10000×) image of CCO (Fig. 2(c)) shows a heterogeneous morphology, indicating the coexistence of structures with different geometries. High-magnification (70000×) imaging was employed to better resolve these features, demonstrating the presence of nanorods and nanoparticles in semi-spherical shape as shown in Fig. 2(d and e). The spherical shape of nanoparticles provides high volumetric Ed, which is beneficial for making lightweight SCs.16 In contrast, the nanorods provide several supplementary advantages. Due to their anisotropic geometry, ions and electrons can move more efficiently throughout the electrode surface thanks to shorter diffusion paths. By exposing more active sites, this arrangement enhances ion transport dynamics and stimulates redox reactions. Furthermore, the rod-like shape promotes structural cohesiveness, essential for maintaining mechanical stability over time amid repeated CD cycles.35,36Fig. 2(f–h) presents the SEM images of CCO-III. At low magnification (150×), the surface appears more porous than CCO due to CNTs. This increase in porosity enhances ion accessibility and rate performance by facilitating electrolyte penetration. Additionally, a high-magnification (50000×) image reveals that the CNTs are successfully woven throughout the nanorods and nanoparticles. By providing continuous conductive pathways, this network increases electrical conductivity and reinforces the structure. Overall, the hierarchical morphology positions the composite as the best candidate for advanced SC systems. The spatial distribution of the individual elements forming the nanocomposite material was investigated using elemental mapping. A multicolor composite map, as shown in Fig. 2(i), shows a consistent distribution of elements across the structural matrix, indicating a well-integrated composition. The individual elemental maps in Fig. 2(j–m), where each element is highlighted with a unique color code, offer even more clarity. These images demonstrate that the elements such as Cu, Co, O, and C are stoichiometrically present in the sample. In mapping images, areas with high concentrations of elements appear brighter, while the darker zones show the absence of a particular element.
3.3 Brunauer–Emmett–Teller investigation
The EC behavior of the synthesized materials is significantly influenced by their specific surface area. The BET analysis, which involves the physical adsorption of the N2 gas, was employed to evaluate the textural properties of pristine CCO and CCO-II, including surface area, pore volume, and pore size distribution. These parameters were obtained from the analysis of the N2 adsorption–desorption isotherms, as illustrated in Fig. 2(n and o). The pristine and optimized samples exhibit typical N2 adsorption/desorption profiles along with their corresponding pore size distribution. Based on the isotherm analysis, the specific surface areas of CCO and CCO-II were determined to be 56.92 and 75.01 m2 g−1, respectively. The comparatively high surface area of CCO-II indicates its enhanced EC performance capability.
At lower relative pressure (P/Po = 0.0–0.1), a linear increase in N2 adsorption reflects the formation of the monolayer along the internal pore surfaces. The subsequent plateau region, followed by a linear portion, signifies the coexistence of the mesoporous and nonporous structures.20 The steep uptake in adsorption across the wider pressure range (p/po = 0.0–1.0) confirms interlayer gas adsorption within the porous framework. The pore size distribution was further evaluated using the Barrett–Joyner–Halenda (BJH). The integrated pore volumes (within the mesoporous range) were calculated to be 42 cm3 g−1 for CCO and 0.27 cm3 g−1 for CCO-II, demonstrating their effectiveness in facilitating ion transport and diffusion. The appearance of type IV adsorption isotherms accompanied by well-defined hysteresis loops confirms the mesoporous nature of both samples. Such structural features make these materials highly suitable for electrode applications, enabling rapid faradaic reactions and efficient charge transport processes.
3.4 Electrochemical analysis
3.4.1 Redox reversibility and kinetic study.
CV was employed to elucidate redox behaviour and charge storage mechanisms of CCO, CCO-I, CCO-II, and CCO-III. An EC workstation operating in potentiostatic mode was used to record CV loops under varying scan rates (SR), specifically 2.5, 5, 7.5, 10, 20, 50, and 100 mV s−1, within an optimal potential window ranging from 0 to 0.5 V. The CV profiles for CCO are shown in Fig. 3(a). The voltammograms exhibit conspicuous redox peaks, indicating faradaic redox processes that lead to pseudocapacitive behaviour.32 The reactions occurring during oxidation and reduction are given in eqn (1)–(3).| | | Cu2+Co23+O4 + 2H2O + e− ↔ 2Co3+OOH + Cu+OH + OH− | (1) |
| | | Co3+OOH + OH− ↔ Co4+O2 + H2O + e− | (2) |
| | | Cu+OH + OH− ↔ Cu2+(OH)2 + e− | (3) |
 |
| | Fig. 3 CV profiles at different scan rates for (a) pristine CCO, (b) CCO-I, (c) CCO-II, and (d) CCO-III, (e) comparison of CV profiles of all samples at 2.5 mV s−1, (f) specific capacity of all samples at different scan rates, (g) current vs. scan rate plot for capacitive contribution, and (h) current vs. (scan rate)1/2 plot for diffusive contribution. | |
These successive reactions show the multistep redox behaviour of both Cu and Co species within the spinel framework and correlate with the anodic peaks, spanning the potential range between 0.36–0.45 V as observed in the CV curves. The reduction peaks, which fell between 0.23–0.18 V in the CV profiles, show these processes and validate the reversibility of the redox transitions involving Co4+/Co3+ and Cu2+/Cu+.23,31,37 The Qs values have been derived from the CV data using eqn (4), with CCO exhibiting a value of 1630.74 C g−1.
here,
m is the active mass,
A is the area under the curve, and
v is the SR. As the SR increases, the empirically noted alteration in peak potentials indicates kinetic constraints and polarization effects at higher SRs.
16Fig. 3(b and c) displays the voltammograms of CCO-I and CCO-II, respectively. Both samples exhibit redox peaks that are consistent with faradaic behaviour. CCO-II showed higher
Qs (2050.59 C g
−1), followed by CCO-I (1990.35 C g
−1). This enhancement is attributed to the rising CNT concentration in the nanocomposites. CNTs facilitate conductive pathways, improve electron transport, and reduce total electrode resistance, contributing to greater electrical conductivity. Furthermore, the composite's porous structure, enabled by CNTs, provides effective channels for the transport of electrolyte ions, thereby accelerating redox processes. The increased SA resulting from CNTs also creates more active sites for charge storage.
37 The presence of redox peaks, even at high SRs, suggests exceptional rate capability. Additionally, the voltammograms reveal symmetric redox peaks, indicating strong EC reversibility.
16,38 In contrast, CCO-III displays a
Qs of 1815.02 C g
−1, as evidenced by the CV curves in
Fig. 3(d). This decline in
Qs may be due to the uneven distribution of CNTs in the composite material. CNTs may form aggregates due to uneven dispersion, reducing their effective SA and impairing their ability to facilitate efficient charge transfer across the electrode.
39Fig. 3(e) superimposes the CV profiles of all the samples at 2.5 mV s
−1 to further clarify the optimum CNTs content. It is clear that the area under the CV curve first rises and reaches a maximum for CCO-II as the CNT concentration increases, before declining for CCO-III. This finding demonstrates that CCO-II has an optimal concentration of CNTs, which improves the EC response.
Fig. 3(f) plots the
Qs modulation relative to the SR for all samples. It is evident that as the SR increases, the
Qs noticeably decrease because the reduced diffusion time restricts ion access primarily to the electrode surface. Yet, the electrolyte ions have more time to enter the electrode material's interior pores at lower SRs, the active sites can be fully utilized, leading to larger
Qs values.
16 The Randles–Sevcik relation given in
eqn (5) was used to evaluate the dominant charge storage mechanism which explains a diffusion-limited response in which the
Ip varies according to the
v1/2.
40| | | Ip = 0.436 × A × n × Co × F(Do × v × F × n/R × T)0.5 | (5) |
here,
Ip is the peak current (
A) from the CV, and
A is the area of the working electrode's surface (cm
2).
Co is the concentration of the electroactive species in bulk (mol cm
−1), and
n is the number of electrons that are involved in the redox process.
Do is the diffusion coefficient of the electroactive species (cm
2 s
−1), and F (96
485 C mol
−1) is the Faraday constant.
R is the universal gas constant (8.314 J mol
−1 K
−1),
v is the scan rate (mV s
−1), and
T is the temperature in kelvin (K). These traits are very important for figuring out how the redox process works and how the system as a whole behaves in an electrochemical way. The formula above shows how the peak current in a CV curve changes when the scan rate and the diffusion of electroactive species change.
Linear fits were produced for both Ipvs. v and Ipvs. v1/2 to identify the dominant charge storage mechanism, and are shown in Fig. 3(g and h). The determination coefficients (R2) of these plots were then compared. The Ipvs. v1/2 plot showed a somewhat larger R2, indicating that diffusive effects were more prevalent, despite both mechanisms being active. Nonetheless, the high R2 values in the Ipvs. v plot also indicate significant capacitive contributions, which show that the material exhibits a hybrid charge storage behaviour. To further validate this, a theoretical model based on the power law given in eqn (6) was used to verify the hybrid nature of the charge storage mechanism.
In this expression, b is the variable that provides important details about the EC process. If the b-value is around 1.0, it shows capacitive-controlled contribution (like EDL capacitance or surface redox reactions), and if it is near 0.5, it indicates diffusion-limited contribution (like faradaic intercalation reactions). The logarithmic form of the power law, as given in eqn (7), was utilized to compute the b-value.23,29
| | | Log(Ip) = log(a) + blog(v) | (7) |
The b-value can be found by linearly fitting log(Ip) against log(v) and calculating the slope of the line. The slope in this situation represents the predominant charge storage mechanism. A greater capacitive contribution is indicated by a slope that is closer to 1, whereas diffusion-controlled behaviour is more prominent when the slope is closer to 0.5. The calculated b-values for CCO, CCO-I, CCO-II, and CCO-III were about 0.59, 0.65, 0.77, and 0.55, respectively, and their graphs are shown in Fig. 4(a–d). These intermediate values, which fall between 0.5 and 1.0, imply that both diffusion-controlled intercalation and capacitive surface reactions are present in the energy storage process. This result supported the existence of hybrid charge storage behaviour in the system and was in good agreement with the R2 values. The Dunn's model was used to further quantify the relative contributions of these processes. This approach is particularly useful for differentiating capacitive and diffusive current responses at different SRs. The formula given in eqn (8) is used to deconvolute the total current at a fixed potential:31,41
here, the first term (
k1v) represents the capacitive contribution, and the second term (
k2v1/2) denotes the diffusion-controlled contribution. Using this relation, these contributions were quantitatively separated at 2.5 mV s
−1 and are graphically shown in
Fig. 4(e–h). Furthermore, the contributions were also evaluated at various SRs, as shown in
Fig. 4(i–l). The diffusion contribution percentages for CCO, CCO-I, CCO-II, and CCO-III were 84, 90, 92, and 87%, whereas the capacitive contributions were determined to be 16, 10, 8, and 13%, respectively. These outcomes highlight the materials' hybrid charge storage properties and support the previous conclusions drawn from the CV analysis. The diffusive component is due to faradaic redox processes involving intercalation, in which ions permeate into the bulk of the electrode material. However, surface ion adsorption at the interface of the WE and electrolyte is the main source of the capacitive component.
28 Furthermore, it was found that the diffusive contribution dominates in all samples at lower SRs. Nonetheless, a discernible increase in the capacitive contribution is observed as the SR increases. A common reason for this phenomenon is the limited time available for ions to diffuse into the electrode bulk at higher SRs. Consequently, charge storage tends to minimize the role of slower intercalation processes by favouring quick surface–level reactions.
25,28,31 This change in dominance from diffusion-controlled to capacitive behaviour as the SR increases demonstrates the electrode materials' exceptional rate flexibility. Taken together, the CV responses, characterized by discrete and well-defined redox peaks, illustrate the hybrid charge storage mechanism and excellent EC reversibility, supporting the electrodes' promise in high-performance energy storage systems.
 |
| | Fig. 4 (a–d) Linear fit curve of log of peak current and log of scan rate for CCO, CCO-I, CCO-II, and CCO-III, respectively, (e–h) percentage contribution of capacitive & diffusive limited kinetics at 2.5 mV s−1, and (i–l) percentage contribution of capacitive & diffusive limited kinetics at all scan rates. | |
3.4.2 Galvanostatic charge–discharge analysis.
GCD testing was conducted under controlled conditions using a 1 M KOH aqueous electrolyte to gain insights into Qs, Ed, and the rate capabilities of the synthesized electrode materials, with the workstation operating in galvanostatic mode. The experimental setup and a visual depiction of the GCD mechanism are shown in Fig. 5 and are explained in the SI. Comprehensive GCD curves of CCO, CCO-I, CCO-II, and CCO-III in Fig. 6(a–d) display characteristic nonlinear plateaus, contrasting with linear capacitive systems, indicating that pseudocapacitive faradaic processes mainly govern charge storage.23 This aligns with the EC properties demonstrated by CV. Various current densities (Im) (7.0, 9.4, 11.7, 14.1, and 16.4 A g−1) were applied to thoroughly evaluate ion diffusion kinetics and rate performance. Besides the plateau behaviour, an abrupt voltage drop, known as the IR drop, occurs at the start of the discharge curve. This decline reflects the internal resistance of the electrode and electrolyte system and is calculated by measuring the voltage difference between the end of charging and the beginning of discharging on the GCD curve.42 The GCD curves clearly show that adding CNTs gradually decreases the IR drop, indicating enhanced conductivity. CCO-II had the lowest IR drop value (0.048 V), which is beneficial because a lower IR drop correlates with improved charge transport and reduced internal resistance. Using the IR drop values for each sample, the internal resistance was also calculated via Ohm's law, given in eqn (9).
 |
| | Fig. 5 Schematic illustration of experimental setup and charging–discharging cycles in GCD working mechanism. | |
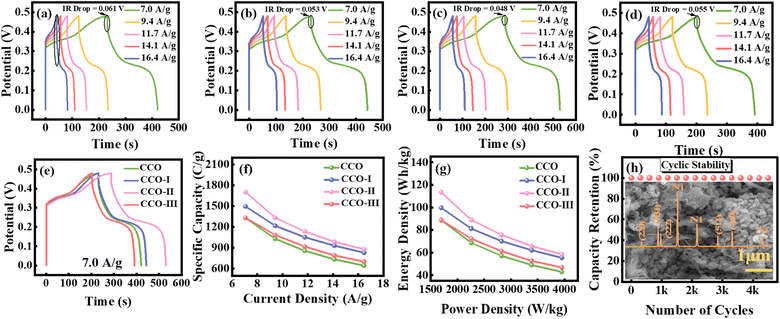 |
| | Fig. 6 (a–d) GCD curves of CCO, CCO-I, CCO-II, and CCO-III, respectively, at different current densities, (e) comparison of GCD curves at 7.0 A g−1, (f) specific capacity of all samples at different current densities, (g) Ragone plot, and (h) cyclic stability, post-cycling XRD, and SEM image of CCO-II electrode. | |
The calculated values of resistance for CCO, CCO-I, CCO-II, and CCO-III are 4.07, 3.53, 3.25, and 3.67 Ω, respectively. As the Im increases, the IR drop also increases due to higher resistive losses. Furthermore, the CD behaviour of the composite electrodes changed notably with the addition of CNTs to the CCO matrix. These variations in duration, CD symmetry, and plateau shapes provide critical evidence of how nanostructural changes influence the materials' energy storage capacity. The values of Qs, Ed, and Pd were calculated with the help of discharge time (Δt), potential window (ΔV), and the applied current using eqn (10)–(12):5,43
| | | Ed = Qs × ΔV/(2 × 3.6) | (11) |
CCO had the lowest Qs (1330.40 C g−1) and Ed (88.69 Wh kg−1) values, as well as the quickest discharge time. The comparatively low electrical conductivity and small active SA of CCO may be the causes of its poor performance, which leads to ineffective ion transport during redox cycling. Incorporating CNTs into CCO-I increased its EC response, as evidenced by a longer discharge period and more distinct redox plateaus, resulting in a higher Qs of 1495.05 C g−1 and Ed of 99.67 Wh kg−1. CCO-II had the best EC performance, with the longest discharge period and the most pronounced redox characteristics, resulting in an impressive Qs of 1702.01 C g−1 and an Ed of 113.46 Wh kg−1. This improvement can be ascribed to the CNTs' optimal dispersion, which improved ion diffusion and charge transfer throughout the electrode matrix. Nevertheless, performance declined when the CNT contents in CCO-III were increased further; Qs dropped to 1331.77 C g−1 and Ed to 88.78 Wh kg−1, most likely due to CNTs' aggregation that blocked active sites and decreased ion accessibility. In all cases, increasing Im resulted in a shorter discharge time because higher rates reduced electrolyte ion penetration into the active material's inner pores, limiting charge storage to the outside surfaces.17 The patterns shown in the samples highlight how crucial it is to maximize the use of electroactive materials by balancing structural integrity with the conductivity enhancement through CNTs content optimization. In Fig. 6(e), all samples' GCD profiles are plotted at 7.0 A g−1 for comparison, and Table 2 lists the calculated values of Qs, Ed, and Pd at the same Im. Next, for all electrodes, the change in Qs with Im was studied, as shown in Fig. 6(f). By increasing the Im, there is a progressive decline in Qs values for all the samples. This behaviour is explained by the shorter ion diffusion time at higher Im, which restricts electrolyte ions' full access to the inner active sites and reduces their capacity to store charge overall. On the other hand, larger Qs values are achieved at lower Im because there is enough time for complete ion intercalation across the electrode matrix.17,44,45Table 3 provides a thorough list of exact Qs values for each electrode at different Im. A Ragone plot was used to systematically assess the Ed and Pd of the as-synthesized samples, as shown in Fig. 6(g). There is a clear trade-off behaviour that shows as Pd rises, Ed gradually decreases. This phenomenon occurs because the full active material capacity cannot be used due to the restricted time available for ion diffusion and charge storage at higher discharge rates.43 CCO-II exhibited exceptional performance, achieving the highest Ed (113.46 Wh kg−1) at a Pd of 1694.11 W kg−1. CCO-II retained significant energy storage capacity at high Pd, demonstrating its robust rate capability. Table 3 displays the comprehensive comparative Ed and Pd values for the remaining samples. Continuous CD experiments at Im of 0.4 A g−1 were used to assess the CCO/CNTs electrodes' long-term cyclic capability. The CCO-II hybrid showed exceptional EC durability, retaining 99.94% of its initial Qs after 4500 cycles, as shown in Fig. 6(h). In essence, the GCD profiles validate the material's exceptional rate capability and long-lasting charge storage behaviour, enhancing its promise for high-performance SC devices. Table S1 provides a comparative analysis of the EC performance of CCO-based electrodes.
Table 2 Specific capacity, energy density, and power density at the current density of 7.0 A g−1 for CCO, CCO-I, CCO-II, and CCO-III composites
| Sample |
Current density (A g−1) |
Discharge time (s) |
Specific capacity (C g−1) |
Energy density (Wh kg−1) |
Power density (W kg−1) |
| CCO |
7.0 |
188.47 |
1330.40 |
88.69 |
1694.11 |
| CCO- I |
7.0 |
211.79 |
1495.05 |
99.67 |
1694.11 |
| CCO-II |
7.0 |
241.11 |
1702.01 |
113.46 |
1694.11 |
| CCO-III |
7.0 |
188.66 |
1331.77 |
88.78 |
1694.11 |
Table 3 Specific capacity, energy density, and power density of CCO, CCO-I, CCO-II, and CCO-III from GCD analysis
| Sample |
Current density (A g−1) |
Discharge time (s) |
Specific capacity (C g−1) |
Energy density (Wh kg−1) |
Power density (W kg−1) |
| CCO |
7.0 |
188.47 |
1330.40 |
88.69 |
1694.11 |
| 9.4 |
109.34 |
1029.15 |
68.61 |
2258.82 |
| 11.7 |
72.85 |
857.13 |
57.14 |
2823.52 |
| 14.1 |
52.04 |
734.69 |
48.97 |
3388.23 |
| 16.4 |
39.12 |
644.40 |
42.96 |
3952.94 |
| CCO-I |
7.0 |
211.79 |
1495.05 |
99.67 |
1694.11 |
| 9.4 |
129.28 |
1216.81 |
81.12 |
2258.82 |
| 11.7 |
89.40 |
1051.87 |
70.12 |
2823.52 |
| 14.1 |
65.95 |
931.19 |
62.07 |
3388.23 |
| 16.4 |
50.41 |
830.28 |
55.35 |
3952.94 |
| CCO-II |
7.0 |
241.11 |
1702.01 |
113.46 |
1694.11 |
| 9.4 |
141.52 |
1332.04 |
88.80 |
2258.82 |
| 11.7 |
96.47 |
1135.04 |
75.66 |
2823.52 |
| 14.1 |
69.80 |
985.43 |
65.69 |
3388.23 |
| 16.4 |
53.35 |
878.73 |
58.58 |
3952.94 |
| CCO-III |
7.0 |
188.66 |
1331.77 |
88.78 |
1694.11 |
| 9.4 |
115.25 |
1084.73 |
72.31 |
2258.82 |
| 11.7 |
78.08 |
918.69 |
61.24 |
2823.52 |
| 14.1 |
55.97 |
790.21 |
52.68 |
3388.23 |
| 16.4 |
42.63 |
702.23 |
46.81 |
3952.94 |
Additionally, the phase purity, structural stability, and morphological integrity of the optimized sample (CCO-II) were evaluated through post-cycling XRD and SEM analysis. The XRD pattern in the revised manuscript, presented in Fig. 6(h), show excellent agreement with the pre-cycling data, with no additional peaks, peak broadening, or peak shifts, confirming the material's phase purity, with no observable degradation and consistent crystallinity. The characteristic diffraction peaks at 2θ = 44.58°, 51.91°, and. 76.74°, corresponding to the (111), (200), and (220) planes, respectively, match well with JCPDS card no. 00-04-08850, confirming the presence of the Ni foam substrate used during electrode fabrication. The post-cycling SEM analysis of CCO-II, shown in Fig. 6(h), demonstrates the retention of its nanorods and semi-spherical nanoplates-like morphology without noticeable structural collapse or surface degradation, indicating excellent morphological stability after the prolonged cycling. These results collectively confirm that the optimized electrode maintains its structural and morphological integrity, supporting its outstanding EC performances.
3.4.3 Electrochemical impedance spectroscopy analysis.
EIS was performed to examine the interfacial charge transport, ion movement behaviour, and the impedance response of CCO, CCO-I, CCO-II, and CCO-III. Fig. 7 shows the experimental setup and a schematic illustration of the EIS mechanism. It is shown that at first, a tiny sinusoidal AC input signal is supplied between the WE and RE, and the resulting current response is recorded. The impedance is then determined by the ratio of these two values. After this, a graph of the real vs. imaginary parts of this impedance (Nyquist plot) is subsequently created, providing insights into impedance behaviour. The Randles circuit was utilized to simulate the EC process. The measurements spanned a broad range of frequency (10−2 to 105 Hz) at 10 mV, and BioLogic EC-Lab software (v11.60) was used for data fitting with a Randles circuit model. Table 4 compiles the extracted fitting parameters. The selected equivalent (Randles) circuit included a charge transfer resistance (R4), a double-layer capacitor (C2), a Warburg diffusion element (Ma6), a solution resistance (R1), and a constant phase element (Q4) to represent non-ideal capacitive behaviour. This circuit's schematic is shown in Fig. 8(a). Each element corresponds to specific EC processes at the electrode–electrolyte interface. Fig. 8(b) shows the combined Nyquist plot of all samples, while Fig. 8(c–f) displays the individual Nyquist plots of each sample, respectively. The charge transfer kinetics are illustrated by the high-to-mid frequency semicircle in the Nyquist plots, while the ion diffusion limitations within the porous electrode are represented by the low-frequency linear tail. R1 corresponds to the intercept with the abscissa, while the semicircle's width indicates R4, which can be calculated using eqn (13).| | | R4 = (R × T)/(n × F × io) | (13) |
here, R4 is the charge-transfer resistance (Ω), which shows how hard it is to transfer electrons at the interface between the electrode and the electrolyte. The exchanging current density (A cm−1), which is shown by the symbols io, represents how fast the redox reactions are happening at equilibrium.40 We have already established that n stands for the number of electrons, and R stands for the universal gas constant. The slope of the inclined line at lower frequencies, related to the ion transport efficiency via the electrode matrix, can be utilized to estimate the contribution of the Warburg element, which is given in eqn (14).| | | Zw = (Aw/ω1/2) + (Aw/iω1/2) | (14) |
herein, Zw, Aw, and ω indicate the Warburg impedance, Warburg coefficient, and angular frequency. When ions pass between electrodes and electrolytes, the Warburg impedance (Ω) occurs, and it is represented by Zw. The amount of resistance to ion movement through the electrochemical system is indicated by the Warburg coefficient (Ω s−1/2). The complex impedance is measured in imaginary units, and the angular frequency is denoted as ω (rad s−1). These features highlight the diffusion behavior of ions at the electrode–electrolyte interface, as well as impedance diffusion. A frequency-dependent impedance is produced by ions in motion via the electrolyte and electrodes. Because it reveals the rate of connection between surface area, capacitive processes, and slower diffusion-controlled faradaic processes, the Warburg term is significant for hybrid supercapacitors. The angle formed by the horizontal axis and the low-frequency tail is a critical parameter for assessing ion mobility; larger angles predict more effective diffusion pathways.25,28,46 However, when examining the total impedance response, CCO-II performed the best as it had a favourable Ma6 (0.18 Ω), a decreased R1 (1.02 Ω), and a minimized R4 (4.65 Ω). Furthermore, as seen in Table 4, CCO-II also had the highest Q4 value (0.08 Fs(a−1)), representing deviation from ideal capacitive behaviour. The superior EC performance of CCO-II is further supported by a higher Q4 value, indicating a larger effective SA and an enhanced capacitive response.28 The Bode phase plots (Fig. 8(g)), which illustrate how the phase angle changes with frequency, provide additional insight into the behaviour of the system. It can be computed by using eqn (15).40
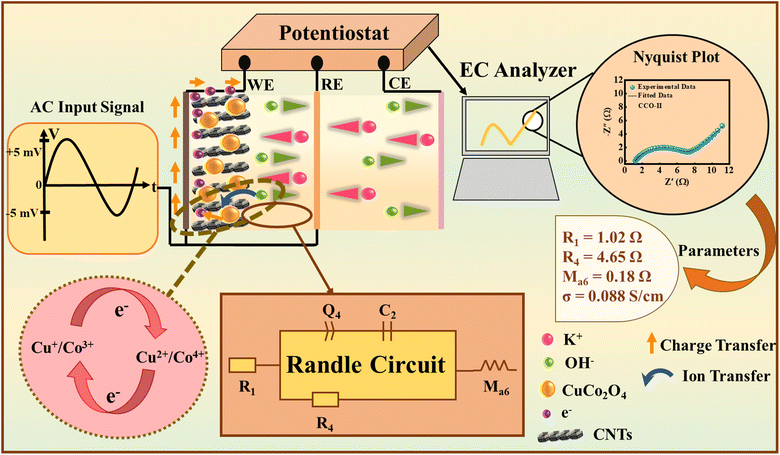 |
| | Fig. 7 Schematic illustration of experimental setup, EIS mechanism, resultant Randles circuit, Nyquist plot, and performance parameters. | |
Table 4 Values of elements for the corresponding fitted circuit, R1 = Rs, R4 = Rct, Q4 = constant phase elements, and Ma6 = restricted diffusion element
| Samples |
R
1 (Ω) |
R
4 (Ω) |
Q
4 (F s(a−1)) |
M
a6 (Ω) |
| CCO |
1.37 |
5.07 |
0.01 |
0.27 |
| CCO-I |
1.04 |
5.59 |
0.04 |
0.22 |
| CCO-II |
1.02 |
4.65 |
0.08 |
0.18 |
| CCO-III |
1.30 |
6.36 |
0.03 |
0.44 |
 |
| | Fig. 8 (a) Resultant Randle circuit, (b) combined Nyquist plot of all samples, (c–f) Nyquist plots of CCO, CCO-I, CCO-II, and CCO-III, respectively, (g) Bode phase plot, and (h) samples vs. ionic conductivity plot. | |
Within this equation, Z′ (real) and Zʺ (imaginary) impedance are functions of frequency. These plots help distinguish between resistive and capacitive traits. A phase angle of −90° typically corresponds to a purely capacitive system, signifying minimal resistive losses. The τ, representing the shortest time needed to release more than 50% of the stored energy, was computed using the relation τ = 1/(2πf), where f is the frequency at which the phase angle is 45°. This characteristic frequency indicates the point of equilibrium where the capacitive and resistive components of the impedance are equal; above this point, the behaviour of the device becomes more resistive. A shorter τ indicates faster ion/electron movement, usually linked to improved rate capability.43,48Table 5 reports the τ values obtained for all samples. Another crucial factor that directly affects SCs' EC efficiency is σ, which governs the movement of ions between electrodes during CD cycles. Effective ion transport, promoted by strong σ, ensures faster kinetics and enhanced rate capability. The following eqn (16) can be used to compute it using the R1 derived from EIS:
Table 5 Calculated values of relaxation time, conductivity, and diffusion coefficients for CCO, CCO-I, CCO-II, and CCO-III composites
| Sample |
Frequency (Hz) |
Relaxation time (s) |
Conductivity (S cm−1) |
Diffusion coefficients (cm2 s−1) |
| CCO |
1.48 |
10.6 × 10⁻² |
6.5 × 10⁻² |
3.3 × 10⁻¹¹ |
| CCO- I |
1.03 |
15.3 × 10⁻² |
8.5 × 10⁻² |
3.6 × 10⁻¹¹ |
| CCO-II |
1.27 |
12.4 × 10⁻² |
8.8 × 10⁻² |
3.9 × 10⁻¹¹ |
| CCO-III |
1.07 |
14.8 × 10⁻² |
6.9 × 10⁻² |
3.1 × 10⁻¹¹ |
In this equation, L and A represent the electrode thickness and SA, respectively.47Fig. 8(h) shows the σ plot of all samples, where CCO-II can be seen exhibiting the highest value (0.088 S cm−1), indicating superior ion transport characteristics. Table 5 lists the corresponding σ values for each sample. In summary, the EIS results unequivocally show the electrodes' exceptional interfacial stability and electrical conductivity, supporting their potential for EC applications.
3.4.4 Galvanostatic intermittent titration technique analysis.
The ion diffusion behaviour of the as-synthesized electrode materials was evaluated using GITT, which calculates Do by analysing a material's voltage response to controlled current pulses. This technique involves applying a small, steady current for a short period to induce ion intercalation into the active material. The system then relaxes under open-circuit conditions, allowing it to approach near-equilibrium.49,50 GITT measurements were conducted in 1 and 3 M KOH and NaOH electrolytes, respectively, within a potential window ranging from 0.4–1 V by subjecting the cell to a 10 min constant current pulse of 1.0 mA. During this period, ions move into and out of active sites, and polarization builds up, causing a characteristic change in potential. After each pulse, the τ of 10 min was employed, which enables the voltage to decrease toward its open-circuit value by stopping the current and allowing the ions within the electrode to redistribute. Each sample underwent four measurement cycles. These conditions provided sufficient time for ion movement and equilibrium, resulting in a more accurate assessment of diffusion properties. The following eqn (17) is used to calculate Do.| | | Do = (4/(3.142 × τ))(m × Vm/M × A)2(ΔEs/ΔEt)2 | (17) |
In this equation, m and Vm indicate the mass and volume of the active material, τ shows the current pulse duration, M indicates the molar mass, A denotes the effective SA of the electrode immersed in the electrolyte, ΔEt shows the voltage shift during the pulse excluding IR drop and ΔEs is the voltage change observed after the system stabilizes following the pulse.51–54Fig. 9(a–d) displays the corresponding GITT voltage profiles for each sample in 1 M KOH electrolyte. Each profile exhibits the characteristic GITT pattern, which includes a steady potential increase caused by ionic movement and charge storage, followed by a rapid spike in potential at the start of each current pulse due to the IR drop. When the current stops, the IR component is removed, leading to a sudden potential drop. This is followed by a gradual decay as the system relaxes toward the open-circuit potential (OCP) through ionic redistribution. These responses provide insights into diffusion kinetics. To determine Do, the values of ΔEt and ΔEs were extracted from the GITT graphs. The potential difference (E1–E2), measured just before and after the relaxation phase, yields ΔEs. This process was repeated for each cycle, and the average value was used for accuracy. The change in voltage (E3–E4) under a galvanostatic pulse, excluding IR drop, represents ΔEt, where E3 is the potential at the start and E4 is the potential at the end of the pulse. The calculated Do for all the samples in 1 M KOH were (3.3 × 10⁻¹¹ cm2 s−1, CCO), (3.6 × 10⁻¹¹ cm2 s−1, CCO-I), (3.9 × 10⁻¹¹ cm2 s−1, CCO-II), and (3.1 × 10⁻¹¹ cm2 s−1, CCO-III). CCO-II exhibited the highest Do (3.9 × 10⁻¹¹ cm2 s−1), based on the GITT curves and the calculated values, owing to its optimized porosity and balanced composition as shown in Fig. 9(e). The subsequent samples confirmed that adding CNTs improves ion transport and reduces resistance, following the trend CCO-III > CCO-I > CCO. Fig. 9(f) shows the GITT plot of CCO-II in 3 M NaOH electrolyte, and it exhibited a Do of 4.1 × 10⁻¹¹ cm2 s−1. Fig. 9(g) shows the Do of CCO-II in both 1 M KOH and 3 M NaOH electrolytes. Table 5 contains the values of Do for all synthesized samples in 1 M KOH electrolyte. In conclusion, GITT analysis demonstrates that incorporating CNTs into the electrode structure decreases internal resistance, stabilizes the EC interface, and significantly enhances ionic transport. Fig. 9(h) presents a radar plot that offers an integrated view of key EC metrics such as Qs, Ed, Do, R1, R4, and σ for the optimized (CCO-II) electrode, underscoring its potential for use in next-generation SCs.
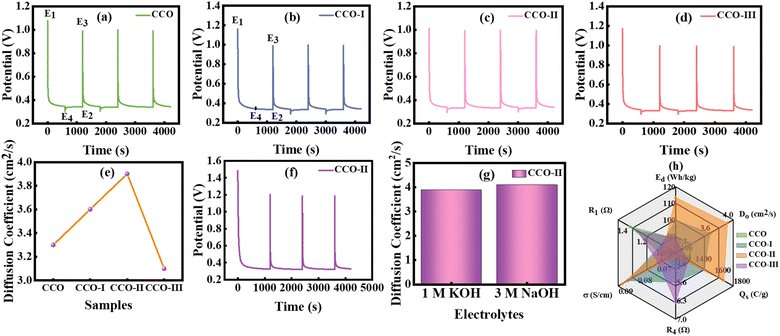 |
| | Fig. 9 (a–d) GITT plots of CCO, CCO-I, CCO-II, and CCO-III in 1 M KOH electrolyte, (e) samples vs. diffusion coefficient plot, (f) GITT plot of CCO-II in 3 M NaOH electrolyte, (g) diffusion coefficient of CCO-II in 1 M KOH and 3 M NaOH electrolyte, and (h) radar plot. | |
4 Conclusion
In conclusion, we synthesized CuCo2O4/CNT nanocomposites with varying CNT contents (5, 10, and 15%) to study their diffusion dynamics through GITT and evaluate their potential for energy storage devices. A two-step synthesis process, initial hydrothermal synthesis of CuCo2O4 followed by solvothermal incorporation of CNTs, was employed to prepare the nanocomposites with targeted morphologies, comprising nanorods and spherical particles. The combined impact of these structural features enabled excellent charge storage and ion transport, as evidenced by thorough EC experiments. A hybrid (capacitive-faradaic) charge storage mechanism was confirmed by CV in tandem with theoretical analysis (Dunn's model) and R2 values. EC analysis revealed that the CCO-II electrode exhibited a remarkable Ed (113.46 Wh kg−1), Qs (1702.01 C g−1), and Pd (1694.11 W kg−1), demonstrating outstanding charge storage capacity and excellent rate performance. Additionally, it achieved a fast EC response and efficient ion diffusion, as indicated by a high σ (8.8 × 10⁻² S cm−1), a short τ (12.4 × 10⁻² s), and a lower R1 (1.02 Ω) and R4 (4.65 Ω). The optimized sample displayed a Do of 3.9 × 10⁻¹¹ cm2 s−1 in 1 M KOH and 4.1 × 10⁻¹¹ cm2 s−1 in 3 M NaOH electrolyte. These metrics highlight the effective integration of conductive carbon and redox-active oxide components, resulting in a highly efficient electrode architecture. Overall, the EC behaviour suggests that this optimized hybrid material is suitable for applications that require high capacity, fast kinetics, and good stability. Collectively, these results indicate that the CuCo2O4/CNTs composite is a promising and versatile candidate for next-generation high-performance energy storage systems.
Conflicts of interest
The authors declare that there are no financial or any other types of conflicts of interest to declare for this submission.
Abbreviations
| CCO | CuCo2O4 |
| CCO-I | CuCo2O4 with 5% CNTs |
| CCO-II | CuCo2O4 with 10% CNTs |
| CCO-III | CuCo2O4 with 15% CNTs |
| ESDs | Energy storage devices |
| SCs | Supercapacitors |
| EC | Electrochemical |
|
P
d
| Power density |
| CD | Charge–discharge |
|
E
d
| Energy density |
| SA | Surface area |
| EDLCsElectric double-layer capacitorsPCs | Electric double-layer capacitorsPCsPseudocapacitors |
| TMOs | Transition metal oxides |
| HCs | Hybrid capacitors |
|
C
sp
| Specific capacitance |
| CNTs | Carbon nanotubes |
|
Q
s
| Specific capacity |
|
C
R
| Capacitance retention |
| NF | Nickel foam |
|
σ
| Ionic conductivity |
|
τ
| Relaxation time |
|
D
o
| Diffusion coefficient |
| GITT | Galvanostatic intermittent titration technique |
| DI | Deionized |
| AF | Ammonium fluoride |
| RT | Room temperature |
| WE | Working electrode |
| PVDF | Polyvinylidene fluoride |
| AC | Activated carbon |
| XRD | X-ray diffraction |
| FESEM | Field emission scanning electron microscopy |
| EIS | Electrochemical impedance spectroscopy |
| GCD | Galvanostatic charge/discharge |
| CV | Cyclic voltammetry |
| SR | Scan rate |
| CE | Counter electrode |
|
I
m
| Current density |
|
R
4
| Charge transfer resistance |
|
C
2
| Double-layer capacitor |
|
M
a6
| Warburg diffusion element |
|
R
1
| Solution resistance |
|
Q
4
| Constant phase element |
| OCP | Open-circuit potential |
Data availability
Data will be made available on request.
Supplementary information (SI): detailed materials information, XRD patterns with refinement, electrochemical setup description and GCD mechanism, and literature review table (DOC). Electronic copy of CuCo2O4 structural data (.cif extension). Original XRD data of all samples (.txt extension). See DOI: https://doi.org/10.1039/d5na00916b.
Acknowledgements
The authors would like to acknowledge Ongoing Research Funding Program, (ORF-2026-71), King Saud University, Riyadh, Saudi Arabia.
References
- A. G. Olabi, Q. Abbas, A. Al Makky and M. A. Abdelkareem, Supercapacitors as next generation energy storage devices: Properties and applications, Energy, 2022, 248, 123617 CrossRef CAS.
- S. Biswas and A. Chowdhury, Organic supercapacitors as the next generation energy storage device: emergence, opportunity, and challenges, ChemPhysChem, 2023, 24, e202200567 CrossRef CAS.
- Y. Ejaz, B. M. Alotaibi, A. W. Alrowaily, H. A. Alyousef, H. H. Somaily and S. Aman, Development of cost-efficient BaMnO3/rGO nanocomposite as electrode for energy storage applications in supercapacitor, Ceram. Int., 2024, 50, 27508–27519 CrossRef CAS.
- J. Sun, C. Xu and H. Chen, A review on the synthesis of CuCo2O4-based electrode materials and their applications in supercapacitors, J. Materiomics, 2021, 7, 98–126 CrossRef.
- M. M. Mudassar, M. Arshad, M. U. Salman, A. Mahmood, W. Al-Masry, M. Asim and S. Atiq, Significance of the direct relation between the fill factor and hole transport layer thickness in perovskite-based solar cells for green energies, RSC Adv., 2025, 15, 33830–33843 RSC.
- A. Ghosh, S. Kaur, G. Verma, C. Dolle, R. Azmi, S. Heissler and M. Islam, Enhanced performance of laser-induced graphene supercapacitors via integration with candle-soot nanoparticles, ACS Appl. Mater. Interfaces, 2024, 16, 40313–40325 CrossRef CAS.
- A. Dutta, J. Mahanta and T. Banerjee, Supercapacitors in the light of solid waste and energy management: a review, Adv. Sustain. Syst., 2020, 4, 2000182 CrossRef CAS.
- V. L. Trinh and C. K. Chung, Renewable energy for SDG-7 and sustainable electrical production, integration, industrial application, and globalization, Clean Eng. Technol., 2023, 15, 100657 CrossRef.
- M. Luqman, M. Mehak, M. U. Salman, S. M. Ramay, M. Younis and S. Atiq, Strategically optimized diffusion dynamics in Ni9S8 nanoflower architectures for high-performance asymmetric supercapacitors, Appl. Phys. Lett., 2025, 127, 083901 CrossRef CAS.
- A. Dutta, S. Mitra, M. Basak and T. Banerjee, A comprehensive review on batteries and supercapacitors: Development and challenges since their inception, J. Energy Storage, 2023, 5, e339 CrossRef CAS.
- X. Du, X. Ren, C. Xu and H. Chen, Recent advances on the manganese cobalt oxides as electrode materials for supercapacitor applications: A comprehensive review, J. Energy Storage, 2023, 68, 107672 CrossRef.
- R. Wu, J. Sun, C. Xu and H. Chen, MgCo2O4-based electrode materials for electrochemical energy storage and conversion: A comprehensive review, Sustain. Energy Fuels, 2021, 5, 4807–4829 RSC.
- J. Gao, Z. Zhuang, X. Zhou, H. Xu, X. Xu and W. Li, Reversible Mn2+/Mn4+ and Mn4+/Mn6+ double-electron redoxes in heterostructure MnS2/MnSe2@HCMs boost high energy storage for hybrid supercapacitors, Chem. Eng. J., 2024, 485, 149520 CrossRef CAS.
- A. Hussain, A. Tufail, A. Shakoor, M. Mehak, M. S. Akhtar, S. M. Ramay and S. Atiq, Synergistically tailored ionic conduction and transport in ZnO/CNTs-based electrodes with enhanced electrochemical efficiency in supercapacitors, Electrochim. Acta, 2025, 146736 CrossRef CAS.
- C. Li, Q. Yue, Y. Gao, Z. Li, J. Zhang, M. Zhang and H. Pan, Toward rational design of carbon-based electrodes for high-performance supercapacitors, ACS Appl. Mater. Interfaces, 2025, 17, 24675–24700 CrossRef CAS.
- D. Liu, Y. Liu, E. Bao, X. Ren, X. Liu, Y. Xiang, C. Xu, Y. Li and H. Chen, Porous CuCo2O4/CuO microspheres and nanosheets as cathode materials for advanced hybrid supercapacitors, J. Energy Storage, 2023, 68, 107875 CrossRef.
- A. Tariq, G. Ali, U. Waqas, K. J. Ahmad, S. M. Ramay, F. Afzal and S. Atiq, Synergistic integration of rGO into cobalt oxide matrix for efficient electrochemical performance mediated by structural stability, J. Energy Storage, 2024, 80, 110346 CrossRef.
- R. Wang, W. Y. Jang, W. Zhang, C. V. Reddy, R. R. Kakarla, C. Li and T. M. Aminabhavi, Emerging two-dimensional (2D) MXene-based nanostructured materials: Synthesis strategies, properties, and applications as efficient pseudo-supercapacitors, Chem. Eng. J., 2023, 472, 144913 CrossRef CAS.
- Y. Li, T. Liu, Y. Liu, F. Meng and Z. Cao, Dual storage mechanism of charge adsorption, desorption, and faraday redox reaction enables aqueous symmetric supercapacitor with 1.4 V output voltage, Chem. Eng. J., 2024, 479, 147906 CrossRef CAS.
- G. Khan, M. Luqman, M. Mehak, M. U. Salman, A. Mahmood, W. Al-Masry, M. Nawaz and S. Atiq, Integration of carbon nanotubes/MXene into Co-doped Ni9S8 nanostructures for enhanced energy storage mediated via efficient diffusion dynamics in hybrid supercapacitors, J. Power Sources, 2025, 660, 238568 CrossRef CAS.
- S. V. Sadavar, S. Y. Lee and S. J. Park, Advancements in asymmetric supercapacitors: from historical milestones to challenges and future directions, Adv.d Sci., 2024, 11, 2403172 CrossRef CAS PubMed.
- F. Semerci and H. Eşgin, Step-wise synthesis of mesoporous CuCo2O4@reduced graphene oxide composites for supercapacitor applications, J. Electroanal. Chem., 2024, 970, 118550 CrossRef CAS.
- W. Li, H. Yin, X. Shi, Y. Mo, Y. Zhao, K. Zhang and S. Chen, Morphology-controlled CuCo2O4 nanomaterials for high-performance supercapacitor electrode, ACS Appl. Nano Mater., 2025, 8, 7596–7607 CrossRef CAS.
- X. Chen, M. Zhou and Y. Min, Construction of CuCo2O4 hollow microspheres/Ti3C2Tx MXene composite for electrode material of hybrid supercapacitors, Colloids Surf., A, 2024, 695, 134315 CrossRef CAS.
- C. Zhang, F. Cui, Q. Ma and T. Cui, Porous NiO/CuCo2O4 nanocrystalline heterojunction composites derived from polymetallic coordination polymers for advanced supercapacitor, J. Energy Storage, 2024, 102, 114150 CrossRef.
- K. Jiang and R. A. Gerhardt, Fabrication and supercapacitor applications of multiwall carbon nanotube thin films, Carbon, 2021, 7, 70 CAS.
- A. Baby, J. Vigneswaran, S. P. Jose, D. Davis and P. B. Sreeja, Hybrid architecture of multiwalled carbon nanotubes/nickel sulphide/polypyrrole electrodes for supercapacitor, Mater. Today Sustain., 2024, 26, 100727 Search PubMed.
- S. V. Desarada, M. A. Yewale, S. Vallabhapurapu, V. S. Vallabhapurapu, S. D. Dhas, A. A. Al-Kahtani and D. K. Shin, Multiwalled carbon nanotube-cobalt vanadium oxide composite for high-performance supercapacitor electrodes with enhanced power density and cycling stability, Diamond Relat. Mater., 2024, 149, 111557 CrossRef CAS.
- S. Zhang, L. Li, Y. Liu and Q. Li, Nanocellulose/carbon nanotube/manganese dioxide composite electrodes with high mass loadings for flexible supercapacitors, Carbohydr. Polym., 2024, 326, 121661 CrossRef CAS.
- R. BoopathiRaja, M. Parthibavarman and A. N. Begum, Hydrothermal induced novel CuCo2O4 electrode for high-performance supercapacitor applications, Vacuum, 2019, 165, 96–104 CrossRef CAS.
- J. Bhagwan and J. I. Han, CuCo2O4 nanoplates anchored to multiwall carbon nanotubes as an enhanced supercapacitive performance, J. Energy Storage, 2023, 62, 106923 CrossRef.
- C. Arulkumar, R. Gandhi, R. A. Alshgari and S. Vadivel, Improved electrochemical performances of CuCo2O4/CuO-based asymmetric device with ultrahigh capacitance and attractive cycling performance, J. Energy Storage, 2024, 92, 112202 CrossRef.
- Y. Liu, X. Chang, M. Wang, H. Guo, W. Li and Y. Wang, Hierarchical CuCo2O4/CuO nanoflowers crosslinked with carbon nanotubes as an advanced electrode for supercapacitors, J. Alloys Compd., 2021, 871, 159555 CrossRef CAS.
- B. D. Cullity and R. J. P. T. Smoluchowski, Elements of X-ray diffraction, Phys. Today, 1957, 10, 50 CrossRef.
- G. Xiao, H. Chen, S. Zhu, W. Zhao, S. Chen, Y. Wen and G. Wen, Rational design of cobalt phosphide nanorods via hydrothermal-phosphorization for high-performance asymmetric supercapacitors, J. Alloys Compd., 2025, 1029, 180758 CrossRef CAS.
- D. Liu, Y. Liu, X. Liu, C. Xu, J. Zhu and H. Chen, Growth of uniform CuCo2O4 porous nanosheets and nanowires for high-performance hybrid supercapacitors, J. Energy Storage, 2022, 52, 105048 CrossRef.
- J. Sun, X. Tian, C. Xu and H. Chen, Porous CuCo2O4 microtubes as a promising battery-type electrode material for high-performance hybrid supercapacitors, J. Materiomics, 2021, 7, 1358–1368 CrossRef.
- G. R. Reddy, B. Sravani, N. Jung, G. R. Dillip and S. W. Joo, Engineering rich-cation vacancies in CuCo2O4 hollow spheres with a large surface area derived from a template-free approach for ultrahigh capacity and high-energy density supercapacitors, ACS Appl. Mater. Interfaces, 2023, 15, 36500–36511 CrossRef CAS PubMed.
- C. Choi, T. G. Yun and B. Hwang, Dispersion stability of carbon nanotubes and their impact on energy storage devices, Inorganics, 2023, 11, 383 CrossRef CAS.
- W. Pholauyphon, P. Charoen-amornkitt, T. Suzuki and S. Tsushima, Guidelines for supercapacitor electrochemical analysis: A comprehensive review of methodologies for finding charge storage mechanisms, J. Energy Storage, 2024, 98, 112833 CrossRef.
- J. Yuan, Y. Li, G. Lu, Z. Gao, F. Wei, J. Qi and S. Wang, Controlled synthesis of flower-like hierarchical NiCo-layered double hydroxide integrated with metal–organic framework-derived Co@C for supercapacitors, ACS Appl. Mater. Interfaces, 2023, 15, 36143–36153 CrossRef CAS.
- R. Vicentini, L. M. Da Silva, E. P. Cecilio Junior, T. A. Alves, W. G. Nunes and H. Zanin, How to measure and calculate equivalent series resistance of electric double-layer capacitors, Molecules, 2019, 24, 1452 CrossRef CAS.
- M. Mehak, M. Luqman, M. U. Salman, A. Ahmad, S. M. Ramay, M. Younis and S. Atiq, Strategic integration of MXene into FeMnO3 matrix for superior energy density in hybrid supercapacitors elucidated via Dunn's model, J. Mater. Chem. C, 2025, 13, 19369–19382 RSC.
- A. Pal, S. Ghosh, D. Singha and M. Nandi, Morphology-controlled synthesis of heteroatom-doped spherical porous carbon particles retaining high specific capacitance at high current density, ACS Appl. Energy Mater., 2021, 4, 10810–10825 CrossRef CAS.
- M. Luqman, M. Mehak, M. U. Salman, A. Raza, S. M. Ramay, M. Younis and S. Atiq, Strategically tailored CrCo2O4/MXene hybrid nano-architectures: Synergizing Dunn model's insights with superior ionic conductivity for high-performance battery-type sustainable energy storage, J. Power Sources, 2025, 655, 237943 CrossRef CAS.
- K. A. Abbas, A. Abdelwahab, H. S. Abdel-Samad, S. S. Abd-El Rehim and H. H. Hassan, Novel preparation of metal-free carbon xerogels under acidic conditions and their performance as high-energy density supercapacitor electrodes, Nanoscale Adv., 2023, 5, 5499–5512 RSC.
- D. M. Babiker, Z. R. Usha, C. Wan, M. M. E. Hassaan, X. Chen and L. Li, Recent progress of composite polyethylene separators for lithium/sodium batteries, J. Power Sources, 2023, 564, 232853 CrossRef CAS.
- N. Kumar, M. Singh, A. Kumar, T. Y. Tseng and Y. Sharma, Facile and one-step in situ synthesis of pure phase mesoporous Li2MnSiO4/CNTs nanocomposite for hybrid supercapacitors, ACS Appl. Energy Mater., 2020, 3, 2450–2464 CrossRef CAS.
- S. D. Kang and W. C. Chueh, Galvanostatic intermittent titration technique reinvented: Part I. A critical review, J. Electrochem. Soc., 2021, 168, 120504 CrossRef.
- M. Nadeem, M. Mehak, M. Luqman, I. Khalil, A. Mahmood, W. Al-Masry, M. Nawaz and S. Atiq, Rationally engineered NiCo2O4/CNTs nanostructures with controlled morphology for optimized capacity and galvanostatic intermittent titration technique–mediated ion diffusion kinetics in hybrid supercapacitors, Electrochim. Acta, 2025, 543, 147636 CrossRef CAS.
- E. Deiss, Spurious chemical diffusion coefficients of Li+ in electrode materials evaluated with GITT, Electrochim. Acta, 2005, 50, 2927–2932 CrossRef CAS.
- K. M. Shaju, G. S. Rao and B. V. R. Chowdari, Influence of Li-ion kinetics in the cathodic performance of layered Li (Ni1/3Co1/3Mn1/3)O2, J. Electrochem. Soc., 2004, 151, A1324 CrossRef CAS.
- D. W. Dees, S. Kawauchi, D. P. Abraham and J. Prakash, Analysis of the Galvanostatic Intermittent Titration Technique (GITT) as applied to a lithium-ion porous electrode, J. Power Sources, 2009, 189, 263–268 CrossRef CAS.
- K. Liu, Y. Gao, Z. Fang, X. Zhou, Y. Ma, H. Wu and B. Wang, Determination of diffusion coefficients of uranium in liquid gallium by GITT, J. Electroanal. Chem., 2020, 879, 114711 CrossRef CAS.
|
| This journal is © The Royal Society of Chemistry 2026 |
Click here to see how this site uses Cookies. View our privacy policy here. 
 Open Access Article
 This Open Access Article is licensed under a Creative Commons Attribution-Non Commercial 3.0 Unported Licence
 a,
Maira
Nadeem
a,
Shahid M.
Ramay
b,
Toheed
Akhter
a,
Maira
Nadeem
a,
Shahid M.
Ramay
b,
Toheed
Akhter


