DOI:
10.1039/D5CE00830A
(Paper)
CrystEngComm, 2026,
28, 224-246
Structural insights into the multi-component solid forms of aminocaproic acid and aminomethyl benzoic acid: mechanochemical approach for the preparation of salt forms
Received
26th August 2025
, Accepted 17th November 2025
First published on 3rd December 2025
Abstract
Mechanochemical preparation of multi-component systems, such as cocrystals and salts, is at the forefront of crystal engineering, driven by its dual benefits of environmental friendliness and efficient material exploration. The intrinsic relationship between mechanochemical milling and supramolecular chemistry arises from the solvent-free nature of the milling process. This study reports the new salts of antifibrinolytic agents, aminocaproic acid (ACA) and aminomethylbenzoic acid (AMA), with various coformers, namely oxalic acid (OXA), tartaric acid (TAT), caffeic acid (CAF), 2-chloro-4-nitrobenzoic acid (CNB), saccharin (SAC), and orotic acid (ORA). Additionally, the crystal structure of the anhydrous AMA compound was determined and reported in this work. The crystal structures of the developed salts were elucidated using single-crystal X-ray diffraction analysis and further analysed by spectroscopic (FT-IR) and thermal methods (DSC and TGA). The salts of ACA with OXA resulted in two solid forms with varying stoichiometry of water molecules (ACA–OXA–H2O (1![[thin space (1/6-em)]](https://www.rsc.org/images/entities/char_2009.gif) :1:2); ACA–OXA–H2O (1:1:1.5)), while ACA–CAF–H2O was obtained in a 3:2:2.6 stoichiometric ratio of ACA, CAF, and H2O in the asymmetric unit. AMA–TAT and AMA–CNB were obtained as hydrates, while AMA–OXA, AMA–SAC, and AMA–ORA were obtained as anhydrous salts. Bulk quantities of ACA and AMA salts were synthesised using both solution-based and mechanochemical ball milling techniques. Unlike conventional solution-based approaches, which typically consume significant amounts of solvents and energy, this study highlights the influence of various ball milling parameters, such as milling media, ball size, frequency, and duration, under both solvent-assisted and neat grinding conditions for the preparation of multicomponent solids of ACA and AMA. A linear correlation was observed between the percentage completion and milling frequency of the ball mill, as well as the time required for completion of the salification process. Interestingly, the different hydrate forms of ACA–OXA (ACA–OXA–H2O (1:1:2) and ACA–OXA–H2O (1:1:1.5)) were prepared in bulk quantities by ball milling, by fine-tuning the milling parameters, whereas the solvent-based slurry method resulted in only the ACA–OXA–H2O (1:1:2) form.
:1:2); ACA–OXA–H2O (1:1:1.5)), while ACA–CAF–H2O was obtained in a 3:2:2.6 stoichiometric ratio of ACA, CAF, and H2O in the asymmetric unit. AMA–TAT and AMA–CNB were obtained as hydrates, while AMA–OXA, AMA–SAC, and AMA–ORA were obtained as anhydrous salts. Bulk quantities of ACA and AMA salts were synthesised using both solution-based and mechanochemical ball milling techniques. Unlike conventional solution-based approaches, which typically consume significant amounts of solvents and energy, this study highlights the influence of various ball milling parameters, such as milling media, ball size, frequency, and duration, under both solvent-assisted and neat grinding conditions for the preparation of multicomponent solids of ACA and AMA. A linear correlation was observed between the percentage completion and milling frequency of the ball mill, as well as the time required for completion of the salification process. Interestingly, the different hydrate forms of ACA–OXA (ACA–OXA–H2O (1:1:2) and ACA–OXA–H2O (1:1:1.5)) were prepared in bulk quantities by ball milling, by fine-tuning the milling parameters, whereas the solvent-based slurry method resulted in only the ACA–OXA–H2O (1:1:2) form.
1. Introduction
Mechanochemical methods are increasingly favoured due to their efficient and selective chemical synthesis.1,2 The ability to conduct reactions solvent-free or with nominal amounts of solvent makes mechanochemical activation highly valuable. Mechanochemical grinding is a green and adaptable method for generating diverse solid forms of pharmaceuticals, including polymorphs, salts, and cocrystals.3–6 Mechanochemical reactions are influenced by equipment choices, including the ball mill type, milling component materials, and ball quantity, in addition to the standard reaction time and milling frequency.7,8 Mechanochemistry, utilising solid-state milling, offers a convincing alternative for supramolecular assembly, ease of execution, efficiency, and environmental sustainability compared to solution chemistry.9–12 Furthermore, mechanochemical methods allow for control over the polymorphic forms, which can be difficult or impossible to achieve through traditional solution-based techniques.13 Despite common crystallisation techniques like solvent evaporation, cooling, or anti-solvent addition being used for cocrystal formation, variations in component solubility and high usage of organic solvents make these methods difficult in both lab and industrial settings.
Aminocaproic acid (ACA) and p-aminomethylbenzoic acid (AMA) were chosen as the model drugs in the current work for the multi-component solid form screening, and the mechanochemical approach was utilized to prepare the bulk forms. Anti-fibrinolytic drugs are commonly used to reduce blood loss in these situations and can act by blocking plasminogen's lysine-binding sites, preventing its conversion to plasmin and subsequent fibrin breakdown.14–16 ACA was the first medication discovered in 1959 that could safely slow down the body's clot-dissolving system (fibrinolysis) in humans, with its potential medical benefits.17 Later, other drugs with similar clot-preserving abilities were developed, including tranexamic acid and AMA.18 ACA is marketed under the brand name ‘Amicar’ and is available in both oral and injectable forms.19
A CSD search for multi-component structures containing the drug ACA revealed the dihydrogen phosphate salt (CSD ref code: JIZHEF) and a few complexes with lead and borate.20 Rademeyer et al. have published inorganic acid salts of ACA, such as chloride (CSD ref code: ZEMCAY), bromide (ref code: ZEMCEC), iodide (CSD ref code: ZEMCIG), and nitrate (CSD ref code: ZEMCOM).21 Recently, a drug–drug salt of ACA–ibuprofen (CSD ref code: FUBBIR) was reported by Frösler et al. with a solubility study.47 Similarly, one hydrate structure (CSD ref code: PONTAP),22 two inorganic salts such as nitrate (CSD ref code: CURKUX) and perchlorate (CSD ref code: CURLAE),23 and Cu and U complexes24,25 have been reported with the drug AMA.
In the present work, we have conducted multi-component screening using selected coformers, namely caffeic acid (CAF), 2-chloro-4-nitrobenzoic acid (CNB), oxalic acid dihydrate (OXA), D, L and L-tartaric acid (TAT), orotic acid monohydrate (ORA) and saccharin (SAC), which leads to the formation of five new salts of ACA and AMA. Further, the anhydrous crystal structure of parent AMA is reported in this work. All the prepared salt crystal structures were determined by single-crystal X-ray diffraction analysis. The chemical structures of ACA, AMA, and the coformers are shown in Fig. 1. We aim to develop the preparation of ACA and AMA salts on a bulk scale by the mechanochemical method. The optimisation study of the mechanochemical synthesis of ACA/AMA salts was conducted and the influence of different ball-milling parameters in the grinding process, such as the milling speed, time, number and different sizes of balls, and solvent-assisted and solvent-free conditions, on the formation of the prepared salts was studied. The prepared salts were further characterized using powder X-ray diffraction (PXRD), thermal, and Fourier-transform infrared spectroscopy (FT-IR) analyses.
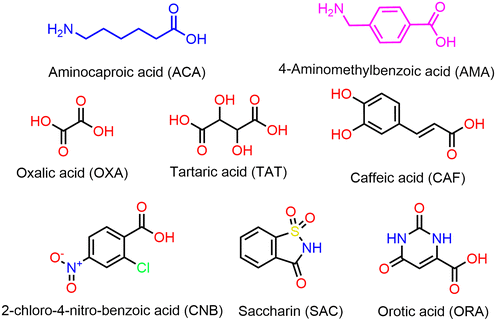 |
| | Fig. 1 Molecular diagram of the drugs and the coformers used in the present study. | |
2. Experimental section
ACA and AMA were procured from TCI chemicals and used as such. All the coformers were purchased from various chemical vendors (TCI/Sigma) and used as such for the preparation of multi-component systems. HPLC-grade solvents (methanol, ethanol, chloroform, methyl tertiary butyl ether, acetonitrile, and purified water) were used for single-crystal development and bulk-scale preparation processes.
2.1 Preparation of single crystals of ACA and AMA salts
The solvent evaporation method was employed for the preparation of single crystals of the multi-component ACA and AMA.
2.1.1 ACA–OXA–H2O (1![[thin space (1/6-em)]](https://www.rsc.org/images/entities/b_char_2009.gif) :1:2).
The single crystals were developed from the powder material obtained through the slurry method of ACA–OXA–H2O (1:1:2) using methyl tertiary butyl ether as a solvent. The powdered material obtained from the slurry was dissolved in 3 mL of methanol at 65–70 °C to produce a clear solution, which was allowed to evaporate at room temperature. Colourless, block-shaped crystals were obtained after two days.
:1:2).
The single crystals were developed from the powder material obtained through the slurry method of ACA–OXA–H2O (1:1:2) using methyl tertiary butyl ether as a solvent. The powdered material obtained from the slurry was dissolved in 3 mL of methanol at 65–70 °C to produce a clear solution, which was allowed to evaporate at room temperature. Colourless, block-shaped crystals were obtained after two days.
2.1.2 ACA–OXA–H2O (1:1:1.5).
Equimolar amounts of ACA (50 mg, 0.38 mmol) and oxalic acid dihydrate (48.05 mg, 0.38 mmol) were dissolved in 5 ml of methanol at 65–70 °C. The clear solution was kept at room temperature for solvent evaporation. After one day, colourless needle-shaped crystals were obtained.
2.1.3 ACA–TAT (1:1).
ACA (50 mg, 0.38 mmol) and D, L-tartaric acid (57.03 mg, 0.379 mmol) were taken in a 1:1 molar ratio, and dissolved in 5 ml of methanol at 65–70 °C. The clear solution was kept at room temperature for solvent evaporation. After one day, colourless plate-shaped crystals were obtained.
2.1.4 ACA–CAF–H2O (3:2:2.6).
ACA (50 mg, 0.38 mmol) and caffeic acid (68.46 mg, 0.379 mmol) were taken in a 1:1 molar ratio, and dissolved in 5 ml of purified water at 100 °C. The clear solution was kept at room temperature for solvent evaporation. Yellowish-brown coloured needle-shaped crystals were obtained after two days.
2.1.5 ACA–ORA (1:1).
ACA (50 mg, 0.38 mmol) and orotic acid monohydrate (66.16 mg, 0.379 mmol) were taken in a 1:1 molar ratio, and dissolved in 5 ml of methanol at 65–70 °C. The clear solution was kept at room temperature for solvent evaporation. After one day, colourless plate-shaped crystals were obtained.
2.1.6 AMA.
50 mg of AMA was dissolved in 6 mL of chloroform at 70 to 80 °C to produce a clear solution. This solution was then allowed to evaporate at room temperature. After two days, colourless plate-shaped crystals were obtained.
2.1.7 AMA–OXA (1:0.5).
AMA (50 mg, 0.33 mmol) and oxalic acid dihydrate (20.8 mg, 0.33 mmol) were taken in a 1:1 molar ratio, and dissolved in 5 ml of ethanol and purified water (1:1) at 100 °C. The clear solution was kept at room temperature for solvent evaporation. After one day, colourless needle-shaped crystals were obtained.
2.1.8 AMA–TAT–H2O (2:1:1).
AMA (50 mg, 0.33 mmol) and L-tartaric acid (24.8 mg, 0.33 mmol) were taken in a 1:1 molar ratio, and dissolved in 5 ml of ethanol and purified water (1:1) at 100 °C. The clear solution was kept at room temperature for solvent evaporation. After one day, colourless needle-shaped crystals were obtained.
2.1.9 AMA–SAC (1:1).
AMA (50 mg, 0.33 mmol) and saccharin (60.6 mg, 0.33 mmol) were taken in a 1:1 molar ratio, and dissolved in 5–6 mL of purified water at 100 °C. The clear solution was kept at room temperature for solvent evaporation. After three days, colourless block-shaped crystals were obtained.
2.1.10 AMA–ORA (1:1).
AMA (50 mg, 0.33 mmol) and orotic acid monohydrate (57.6 mg, 0.33 mmol) were taken in a 1:1 molar ratio, and dissolved in 5 mL of purified water at 100 °C. The clear solution was kept at room temperature for solvent evaporation. After one day, colourless plate-shaped crystals were obtained.
2.1.11 AMA–CNB–H2O (1:1:1).
AMA (50 mg, 0.33 mmol) and 2-chloro 4-nitrobenzoic acid (66.7 mg, 0.33 mmol) were taken in a 1:1 molar ratio, and dissolved in 5–6 mL of purified water at 100 °C. The clear solution was kept at room temperature for solvent evaporation. After one day, colourless block-shaped crystals were obtained.
2.2 Bulk-scale preparation
The phase-pure form of ACA and AMA salts was prepared in a bulk quantity by utilising different techniques, such as slurry and mechanochemical grinding methods. The salts ACA–OXA–H2O (1:1:1.5) and ACA–CAF–H2O (3:2:2.6) were produced on a bulk scale by ball-milling, whereas ACA–OXA–H2O (1:1:2), ACA–TAT (1:1), ACA–ORA (1:1) and all the AMA salts (AMA–OXA (1:0.5), AMA–TAT–H2O (2:1:1), AMA–SAC (1:1), AMA–ORA (1:1), and AMA–CNB–H2O (1:1:1)) in the phase pure form were achieved in both slurry and ball-milling techniques under various experimental conditions.
2.3 Preparation by the solvent slurry method
Equimolar amounts of ACA (100 mg, 0.7623 mmol) and ORA (132.73 mg, 0.7623 mmol) were taken in a 25 ml round-bottom flask containing 2 ml of purified water. The suspension was stirred for 24 h at room temperature. The material was filtered, washed with water, and dried at 40 °C in a hot-air oven to obtain the phase-pure form of the ACA–ORA salt. Similarly, ACA–OXA–H2O (1:1:2), AMA–OXA (1:0.5), AMA–TAT–H2O (2:1:1), AMA–SAC (1:1), AMA–ORA (1:1), and AMA–CNB–H2O (1:1:1) were taken in a stoichiometry ratio obtained in the asymmetric unit, by using various solvents (for ACA–OXA–H2O (1:1:2), methyl tertiary butyl ether; for AMA–OXA (1:0.5), ethanol/purified water; for AMA–TAT–H2O (2:1:1), ethanol/purified water; for AMA–SAC (1:1), acetonitrile; for AMA–ORA (1:1), purified water; for AMA–CNB–H2O (1:1:1), purified water).
2.4 Mechanochemical grinding studies
Milling experiments were performed in a micro-ball mill (LABINDIA) using a 10 ml agate milling jar. Each experiment was carried out with a fresh 100 mg sample. ACA and AMA were ground together with coformers, maintaining the molar ratio found in their asymmetric unit. The grinding process was systematically varied by adjusting the grinding ball configuration (uniform-sized seven 5 mm agate balls/combination of one 10 mm and three 5 mm agate balls), the grinding speed (300, 500, 700, and 1000 rpm), and the grinding duration (30 and 60 minutes). To prevent overheating, a 3 minute pause was implemented after every 15 minutes of milling. The resulting milled powder samples were analysed by powder X-ray diffraction (PXRD).
2.5 Preparation of ACA/AMA salts by the ball-milling method
Equimolar amounts of ACA and oxalic acid dihydrate were placed in a 10 mL agate milling jar containing one 7 mm and three 5 mm agate balls. 20 μL of purified water was added to the material, which was milled for 60 min at 1000 rpm to obtain ACA–OXA–H2O (1:1:2) in the pure form. The phase-pure form of ACA–OXA–H2O (1:1:1.5) was prepared by applying similar conditions (10 mL agate jar/one 7 mm and three 5 mm agate balls/60 min/500 rpm and 700 rpm) to ACA–OXA–H2O (1:1:2), except for rpm. Similarly, the phase-pure form of ACA–CAF was prepared by taking ACA and CAF in a 3:2 molar ratio in a 10 mL agate milling jar and milled for 60 min at 1000 rpm.
2.6 Single-crystal X-ray diffraction
A Bruker D8 QUEST instrument with an IμS Mo micro source (λ = 0.7107 Å) and a PHOTON-III detector was used to collect data at room temperature (294(2) K). The raw data frames were processed, and absorption corrections were done using the Bruker Apex 3 software programs.26 The structure was determined by the intrinsic phasing method, and refinement was carried out using the SHELXL program.27 ‘H’ atoms on ‘C’ atoms were located in difference-density maps; however, they were positioned geometrically and included as riding atoms, with C–H = 0.93–0.98 Å, and Uiso(H) = 1.5Ueq(C) for methyl H atoms and 1.2Ueq(C) for all other H atoms. The H atoms attached to ‘O’ and ‘N’ of ACA, AMA, and coformers were located from the Fourier density map and refined isotropically. The crystal structure details and the refinement parameters of the ACA and AMA salts are shown in Tables 1 and 2. The hydrogen bond geometries of the interactions involved in the salts are shown in Table S1. In ACA–OXA–H2O (1:1:1.5), one water molecule (O1W) occupies a special position with an occupancy of 0.5. In ACA–TAT (1:1), one of the ACA molecules (ACA B) exhibits disorder at the carboxylic acid group, and its major and minor coordinates are refined to 0.819(7) and 0.181(7), respectively. Further, one of the carboxylic acid groups of TAT is disordered, and the coordinates are refined to 0.78(2) and 0.22(2). In ACA–CAF–H2O (3:2:2.6), one of the ACA molecules is disordered at the carbon and nitrogen atoms (C1B–N1B), and the coordinates are refined to 0.683(6) and 0.317(6), respectively. Further, one of the hydroxyl groups (O4–H4O) of CAF is disordered over two positions, and their major and minor coordinates are refined to 0.812(3) and 0.188(3), respectively. Furthermore, the oxygen atom (O5) of CAF is disordered, and it is refined to 0.55(3) and 0.45(3), respectively. The hydrogen atoms attached to O1A and O1B of ACA molecules show only partially occupied (0.5), whereas the hydrogen atom attached to O2C shows full occupancy. SIMU instructions were used for treating the disordered structures, and DFIX instructions were used to fix the O–H/N–H bond distances to stabilise the refinement.
Table 1 Crystallographic and refinement parameters of ACA salts
|
|
ACA–OXA–H2O (1:1:2) |
ACA–OXA–H2O (1:1:1.5) |
ACA–TAT (1:1) |
ACA–CAF–H2O (3:2:2.6) |
ACA–ORA (1:1) |
| CCDC no. |
2463047 |
2463048 |
2463049 |
2463050 |
2463051 |
| Chemical formula |
C6H14NO2·C2HO4·2(H2O) |
2(C6H14NO2)·2(C2HO4)·3(H2O) |
2(C6H14NO2)·C4H6O6·C4H4O6 |
2(C9H7O4)·2(C6H13.50NO2)·C6H14NO2·2.597(H2O) |
C5H3N2O4·C6H14NO2 |
|
M
r
|
257.24 |
496.47 |
562.52 |
800.61 |
287.27 |
| Crystal system, space group |
Monoclinic, P21/c |
Monoclinic, C2/c |
Triclinic, P![[1 with combining macron]](https://www.rsc.org/images/entities/char_0031_0304.gif) |
Triclinic, P |
Triclinic, P |
| Temperature (K) |
294(2) |
294(2) |
294(2) |
294(2) |
294(2) |
|
a, b, c (Å) |
17.7514(3), 5.68736(12), 13.0019(4) |
30.203(4), 5.6916(8), 14.254(2) |
8.6376(3), 9.5114(4), 15.9873(6) |
7.5263(19), 12.781(4), 21.505(6) |
5.5781(5), 9.1736(8), 25.930(2) |
|
α, β, γ (°) |
90, 110.8233(9), 90 |
90, 99.433(6), 90 |
79.9178(12), 80.8899(12), 88.4671(13) |
77.876(7), 88.418(7), 79.491(7) |
91.052(3), 92.193(3), 90.552(3) |
|
V (Å3) |
1226.91(5) |
2417.1(6) |
1276.85(8) |
1988.4(10) |
1325.6(2) |
|
Z
|
4 |
4 |
2 |
2 |
4 |
|
μ (mm−1) |
0.13 |
0.12 |
0.13 |
0.11 |
0.12 |
| No. of measured, independent and observed [I > 2σ(I)] reflections |
22791, 3063, 2252 |
14805, 3660, 2951 |
38215, 7796, 5417 |
38806, 9819, 6151 |
14117, 5253, 4550 |
|
R
int
|
0.093 |
0.031 |
0.035 |
0.052 |
0.032 |
|
R[F2 > 2σ(F2)], wR(F2), S |
0.036, 0.112, 1.03 |
0.042, 0.119, 1.04 |
0.043, 0.124, 1.03 |
0.050, 0.155, 1.05 |
0.062, 0.183, 1.08 |
| No. of reflections |
3063 |
3660 |
7796 |
9819 |
5253 |
| No. of parameters |
190 |
182 |
456 |
577 |
409 |
| No. of restraints |
0 |
5 |
111 |
61 |
8 |
| Δρmax, Δρmin (e Å−3) |
0.27, −0.15 |
0.35, −0.21 |
0.36, −0.24 |
0.37, −0.19 |
0.47, −0.27 |
Table 2 Crystallographic and refinement parameters of AMA and the prepared salts
|
|
AMA |
AMA–OXA (1:0.5) |
AMA–TAT–H2O (2:1:1) |
AMA–SAC (1:1) |
AMA–ORA (1:1) |
AMA–CNB–H2O (1:1:1) |
| CCDC no. |
2463052 |
2463053 |
2463054 |
2463055 |
2463056 |
2463057 |
| Chemical formula |
C8H9NO2 |
C8H10NO2·0.5(C2O4) |
2(C8H10NO2)·C4H4O6·H2O |
C7H4NO3S·C8H10NO2 |
C8H10NO2·C5H3N2O4 |
C7H3ClNO4·C8H10NO2·H2O |
|
M
r
|
151.16 |
196.18 |
470.43 |
334.34 |
307.26 |
370.74 |
| Crystal system, space group |
Orthorhombic, Pna21 |
Triclinic, P |
Monoclinic, P21/c |
Orthorhombic, Pca21 |
Triclinic, P |
Triclinic, P |
| Temperature (K) |
294(2) |
294(2) |
294(2) |
294(2) |
294(2) |
294(2) |
|
a, b, c (Å) |
13.6402(3), 8.6125(3), 6.3343(5) |
6.6096(4), 7.0278(4), 11.2902(8) |
12.3917(2), 11.7324(2), 14.9593(2) |
14.340(5), 13.802(13), 14.671(5) |
5.8889(6), 10.2677(10), 11.2466(10) |
8.3098(3), 9.6361(4), 10.8666(4) |
|
α, β, γ (°) |
90, 90, 90 |
72.9234(19), 74.834(2), 69.8700(17) |
90, 100.5494(7), 90 |
90, 90, 90 |
102.250(3), 93.673(3), 91.141(4) |
96.5031(13), 106.9551(13), 101.1189(13) |
|
V (Å3) |
744.13(7) |
463.10(5) |
2138.09(6) |
2904(3) |
662.79(11) |
803.26(5) |
|
Z
|
4 |
2 |
4 |
8 |
2 |
2 |
|
μ (mm−1) |
0.10 |
0.11 |
0.12 |
0.25 |
0.12 |
0.28 |
| No. of measured, independent and observed [I > 2σ(I)] reflections |
9260, 2176, 1880 |
11773, 2801, 2310 |
24392, 6435, 5246 |
30905, 7174, 5755 |
12857, 4021, 2849 |
22156, 4899, 3771 |
|
R
int
|
0.032 |
0.023 |
0.022 |
0.035 |
0.041 |
0.029 |
|
R[F2 > 2σ(F2)], wR(F2), S |
0.037, 0.097, 1.06 |
0.044, 0.141, 1.04 |
0.045, 0.131, 1.04 |
0.038, 0.101, 1.04 |
0.053, 0.166, 1.08 |
0.044, 0.134, 1.04 |
| No. of reflections |
2176 |
2801 |
6435 |
7174 |
4021 |
4899 |
| No. of parameters |
112 |
143 |
346 |
447 |
223 |
248 |
| No. of restraints |
1 |
1 |
1 |
2 |
0 |
0 |
| Δρmax, Δρmin (e Å−3) |
0.15, −0.18 |
0.41, −0.20 |
0.38, −0.27 |
0.29, −0.24 |
0.44, −0.33 |
0.81, −0.37 |
2.7 Powder X-ray diffraction (PXRD)
PXRD measurement was performed in the Bragg–Brentano (reflection) geometry on a Bruker D8 Advance Davinci instrument in the θ–θ reflection geometry with primary optics, using a Cu source (λ = 1.54060 Å) and a LYNXEYE XE-T detector. The instrument was operated at 40 kV voltage and 30 mA current. Before conducting the experiments, the instrument was calibrated with the corundum standard provided by Bruker (Germany) for the reflection geometry and verified against the standard 2θ values of NIST SRM 1976b.28 The samples were scanned over a 2θ range of 2–50° with a step size of 0.02° and a step time of 0.3 s. The powder samples were initially ground into a fine powder, which was then placed in the cavity of the PMMA holders.
2.8 Rietveld analysis
To quantify the percentage of salt conversion from the individual compounds (drug and coformers) in the ball-mill studies, a least-squares fit technique was performed using the Bruker TOPAS software version 6.29–31 A simulated diffraction pattern, derived from the CIF of the individual phases, was refined by adjusting the unit cell and structural parameters to fit the experimental diffraction pattern obtained from the ball-mill studies. The peak profiles and instrumental effects (Cu Kα5_berger.lam, goniometer radius, receiving slit width, and fixed divergence slit dimensions) were described using the fundamental parameters approach.28 The background was suitably fitted with Chebyshev polynomials, followed by refinement of the unit cell parameters and zero-point corrections. Peak broadening effects from crystallite size and micro strain were refined, while the preferred orientation was corrected using spherical harmonics order between 2 and 8.
2.9 Fourier transform infra-red spectroscopy (FT-IR)
The FT-IR analysis of the prepared salts was performed on a Jasco FT/IR-4600 instrument equipped with an attenuated total reflectance (ATR) accessory using a diamond crystal. The fine powder sample was placed directly on the diamond surface, ensuring good contact to obtain optimal signal intensity. Spectra were recorded over the range of 4000 to 600 cm−1 with a resolution of 4 cm−1 in triplicate and the average value was taken for the discussion. The standard deviation was found to be ±1 cm−1 for the recorded samples.
2.10 Thermal analysis
DSC analysis was performed on a TA DSC-250 instrument calibrated with an indium standard material which was found to be within the limit of standard deviation (temperature 0.7 °C, enthalpy 0.01 J g−1). About 2–3 mg of each sample was placed in a Tzero aluminium pan, covered with a lid, and crimped. The samples were analysed over a temperature range of 30–300 °C at a heating rate of 10 °C per minute under a continuously purged nitrogen atmosphere at 50 mL min−1.
Thermogravimetric analysis (TGA) was carried out using a TA SDT Q-600 instrument calibrated with standard calcium oxalate monohydrate. The standard deviation of the weight loss percentage was determined to be 0.05%. For the analysis, 4–8 mg of sample was placed in an open ceramic crucible and heated from 30 to 350 °C at a heating rate of 10 °C per minute under a continuous N2 purge.
3. Results and discussion
3.1 Single-crystal XRD description
3.1.1 ACA–OXA–H2O (1:1:2).
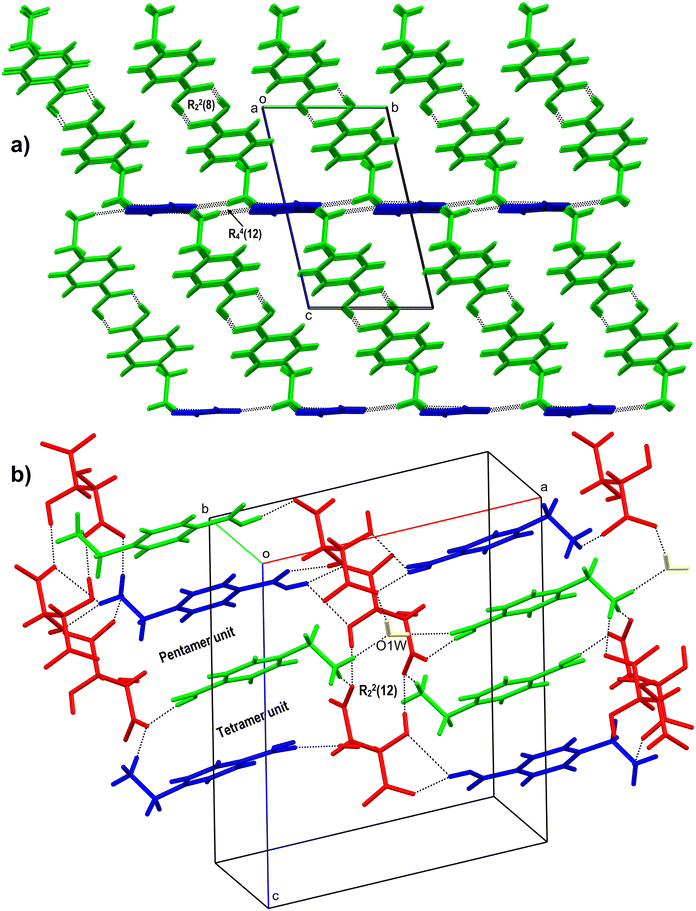
The salt crystallizes as a dihydrate in the centrosymmetric P21/c space group (Fig. 2a). The asymmetric unit consists of a 1:1:2 molar ratio of ACA, OXA and H2O, respectively. The carboxylic acid group of ACA is involved in hydrogen bonding with water molecules O1W & O2W, which in turn connect to the carboxylate oxygen of OXA forming a cyclic tetramer unit of the R34(10) ring motif. The water molecules further link with the ACA molecule of –+NH3via N–H⋯O hydrogen bonds. Further, the water molecule O1W links with O2W via an O–H⋯O hydrogen bond. The –+NH3 also forms a hydrogen bond with the carboxylate of ACA. The acid group of OXA forms a bifurcated O–H⋯O hydrogen bond with adjacent OXA, which continues along the b-axis to form an infinite chain of OXA. In the crystal packing, O2W forms a cyclic tetramer unit of R44(22) with ACA, while two O1W and one O2W molecules form a pentamer unit of R45(24) with ACA. Furthermore, O1W and O2W form a tetramer unit with OXA molecules of the R34(11) ring motif. These interactions continue to form a three-dimensional (3D) hydrogen-bonded network of ACA–OXA1 (Fig. 3a).
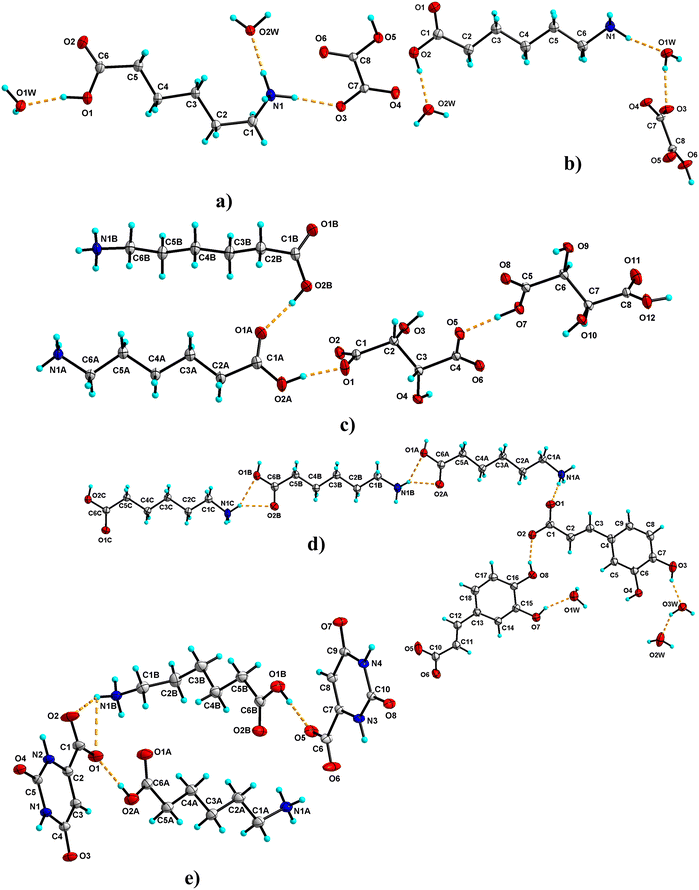 |
| | Fig. 2 The ORTEP diagram of the asymmetric unit of ACA salts drawn with 30% probability (a: ACA–OXA–H2O (1:1:2); b: ACA–OXA–H2O (1:1:1.5); c: ACA–TAT (1:1); d: ACA–CAF–H2O (3:2:2.6); e: ACA–ORA (1:1)). The hydrogen atoms are shown as small spheres; the dashed line indicates the hydrogen bond interactions (the minor component of the disordered atoms in ACA–CAF–H2O (3:2:2.6) and ACA–TAT (1:1) is omitted from the plot for clarity). | |
 |
| | Fig. 3 a) 3D crystal packing of ACA–OXA–2H2O showing a tetramer unit and R34(10) ring motifs involving ACA (green), OXA (blue), and H2O (red and yellow); b) 2D ladder-like structure of ACA–OXA–1.5H2O showing a pentamer unit and ring motifs R45(13) and R56(17) involving ACA, OXA and H2O molecules. | |
3.1.2 ACA–OXA–H2O (1:1:1.5).
The salt crystallises as a sesquihydrate. The asymmetric unit consists of a 1:1:1.5 molar ratio of ACA, OXA and H2O, respectively (one water molecule (O1W) is sitting in the special position with an occupancy of 0.5). The acid group of ACA forms an O–H⋯O hydrogen bond with water molecule O2W, while O2W forms a bifurcated O–H⋯O hydrogen bond with carboxylate ‘O’ of ACA with the R21(4) ring motif and an O–H⋯O hydrogen bond with carboxylate oxygen of OXA. The amine –N–H forms an N–H⋯O hydrogen bond with O1W and carboxyl oxygen atoms of OXA. O1W further forms an O–H⋯O hydrogen bond with OXA (Fig. 2b). The inversion symmetry generates the other half of O1W. In the crystal packing, these interactions continue to form a 3D ladder-like structure of this salt hydrate. The crystal structure features cyclic ring motifs of tetramer (R44(13)), pentamer (R45(13) & R45(24)) and hexamer (R36(12) & R56(17)) units with O1W, O2W, OXA and ACA molecules (Fig. 3b).
3.1.3 ACA–TAT (1:1).
The salt crystallises as anhydrous with two molecules each of ACA (labelled with suffixes A & B) and TAT in the asymmetric unit. It is interesting to note that, although the crystal structure shows a 2:2 ratio of ACA and TAT in the asymmetric unit, only one TAT molecule is ionised, while the second one exists as a neutral molecule. The two ACA molecules are connected to each other via an O–H⋯O hydrogen bond between the carboxylic acid groups of ACA. The ACA and TAT molecules interact via O–H⋯O and N–H⋯O hydrogen bonds involving the acid group and ammonium groups of ACA (Fig. 2b). The TAT molecules interact with each other via O–H⋯O hydrogen bonds involving the acid group and hydroxyl groups. The N–H of ACA ‘A’ & ‘B’ forms single-point and two-point N–H⋯O hydrogen bonds with the carboxyl and hydroxyl oxygen of TAT. The crystal structure features cyclic ring motifs of R22(10) (dimer unit) & R44(8) (tetramer unit) between two TAT molecules and R21(5) (dimer unit), R23(8) (trimer unit), R33(10) (trimer unit), R33(13) (trimer unit), R23(20) (trimer unit), R44(22) (tetramer unit), and R24(8) (tetramer unit) between ACA and TAT molecules (Fig. 4a).
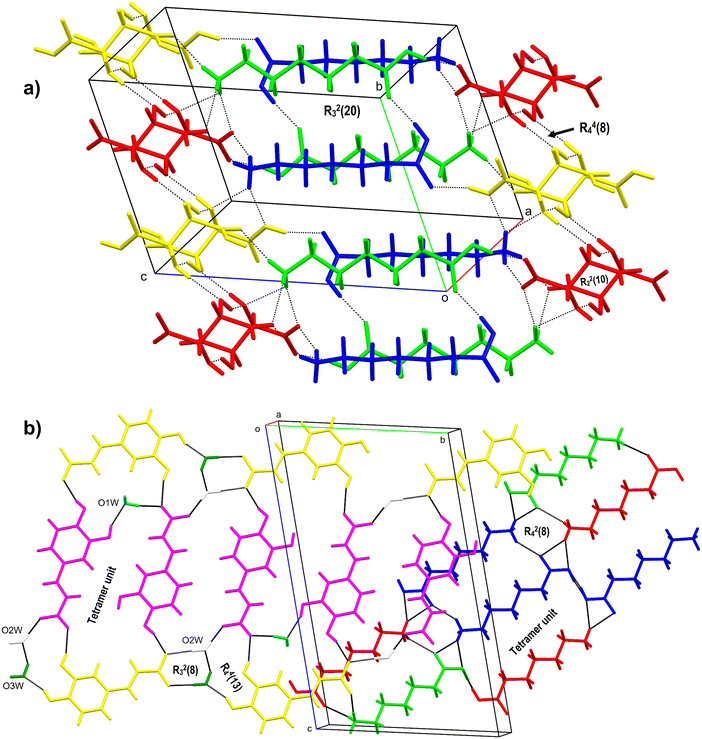 |
| | Fig. 4 a) 3D packing figure of ACA–TAT (1:1), showing dimer and tetramer units with the ring motifs R44(8) and R22(10) between two TAT molecules and a trimer unit between ACA and TAT molecules labelled R23(20). b) 2D sheet-like structure of ACA–CAF–H2O (3:2:2.6) showing the tetramer units between CAF (yellow and pink) and H2O (dark green, blue, and white) molecules and ACA molecules (red, blue, and green). | |
3.1.4 ACA–CAF–H2O (3:2:2.6).
The salt crystallizes as hydrates. The asymmetric unit consists of ACA, CAF and H2O in a molar ratio of 3:2:2.6. One of the water molecules (O3W) is partially occupied in the crystal structure. Two hydrogen atoms attached to the acid group of ACA are partially occupied (labelled with suffixes A & B) (Fig. 2d). The ACA molecules are interconnected to each other via a bifurcated N–H⋯O hydrogen bond between the ammonium –+N–H and carboxyl group of ACA, which further connects to the adjacent ACA molecules, resulting in a cyclic tetramer unit of the R24(8) ring motif. These interactions continue to form a 2D sheet-like structure. This connects to the CAF molecules via an N–H⋯O hydrogen bond with the carboxyl group of CAF and an O–H⋯O hydrogen bond with water molecules (O1W & O2W). One of the hydroxyl groups of CAF forms a hydrogen bond with the carboxylate of the adjacent CAF, while the second hydroxyl group forms a hydrogen bond with water molecules (O1W & O3W), which in turn connect to the adjacent CAF molecules. The water molecule O2W connects to two CAF and O3W via O–H⋯O hydrogen bonds. The water molecules O2W and O3W form a cyclic trimer unit (R23(8) ring motif) with one of the CAF molecules, while it forms a tetramer unit (R44(13) ring motif) with two CAF molecules. O1W and O2W form a cyclic tetramer unit with CAF molecules. CAF and water molecules propagate to form another 2D sheet-like structure. These 2D sheets of ACA and CAF–H2O link via N–H⋯O and O–H⋯O hydrogen bonds to form a 3D hydrogen-bonded network of ACA–CAF (Fig. 4b).
3.1.5 ACA–ORA (1:1).
The salt crystallises in an anhydrous form with two molecules each of ACA (labelled with suffixes A & B) and ORA in the asymmetric unit (Fig. 2e). The carboxylic acid group of ACA ‘A’ forms a hydrogen bond with the carboxylate group of ORA and ammonium –+N–H of ACA ‘B’, while the ammonium –+N–H of ACA ‘A’ forms a bifurcated N–H⋯O hydrogen bond with the carboxyl group of ORA, an N–H⋯O hydrogen bond with the carbonyl group of ORA, and an N–H⋯O hydrogen bond with ACA ‘B’. The carboxylic acid group of ACA ‘B’ forms a hydrogen bond with the carboxylate group of ORA and the ammonium –+N–H of ACA ‘A’, while the ammonium –+N–H of ACA ‘B’ is involved in an N–H⋯O hydrogen bond with ORA and ACA ‘A’. The ORA molecules in the crystal structure form a complementary amide dimer with R22(8) ring motifs, while the N–H and carboxyl oxygen of ORA form R22(10) ring motifs with adjacent ORA molecules. In the crystal packing, three ORA molecules and one ACA molecule (A & B) form cyclic tetramer units of R44(12) ring motifs. These interactions continue to form a 3D hydrogen-bonded network of the ACA–ORA salt (Fig. 5a).
 |
| | Fig. 5 a) 3D hydrogen-bonded network of the ACA–ORA (1:1) salt showing a tetramer unit with the ring motif R44(12) and an amide–amide homosynthon between two AMA molecules with the R22(10) ring motif (blue, green: AMA; red, yellow: ORA). b) 3D representation of AMA showing the tetramer unit along with the ring motif R44(24) involving nearby AMA molecules. | |
3.1.6 AMA.
It crystallises in the orthorhombic crystal system in the Pna21 space group. The molecule exists as a zwitterion in the asymmetric unit (Fig. 6a). The –+N–H3 links with the adjacent AMA through an N–H⋯O hydrogen bond with the carboxylate and carbonyl ‘O’, resulting in a 3D hydrogen-bonded network. The carboxylate oxygen is involved in a bifurcated hydrogen bond with the neighboring AMA, while the carbonyl oxygen forms a single-point hydrogen bond. The four AMA molecules form cyclic tetramer units of R34(10) and R44(24) ring motifs in the overall crystal packing (Fig. 5b).
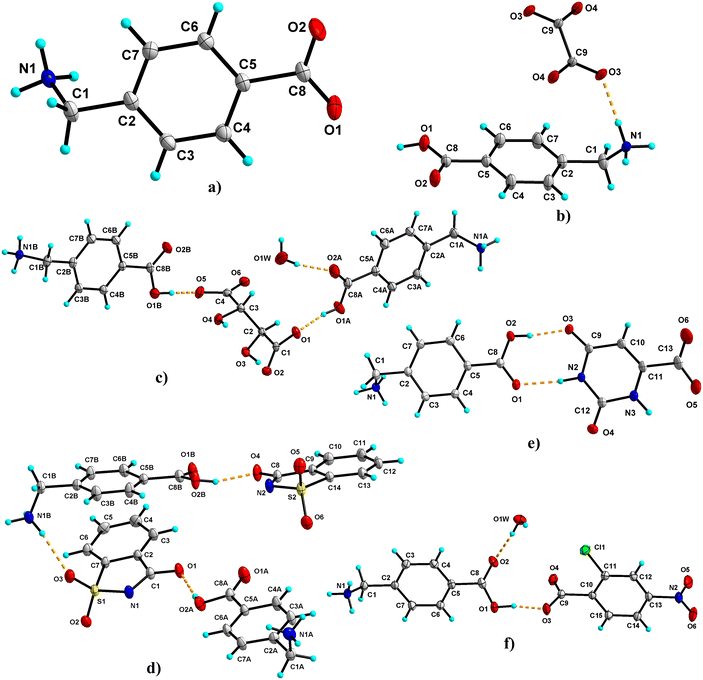 |
| | Fig. 6 The ORTEP diagram of the asymmetric unit of AMA salts drawn with 30% probability (a: AMA; b: AMA–OXA; c: AMA–TAT–H2O (2:1:1); d: AMA–SAC (1:1); e: AMA–ORA (1:1); f: AMA–CNB–H2O (1:1:1)). The hydrogen atoms are shown as small spheres; the dashed line indicates the hydrogen bond interactions. | |
3.1.7 AMA–OXA (1:0.5).
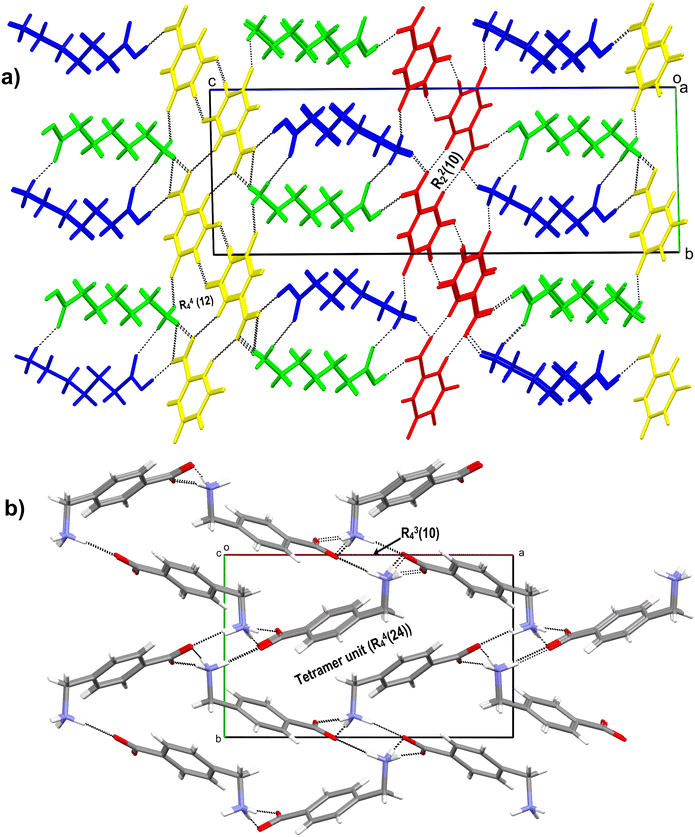
The salt crystallises as a hemi salt with one molecule of AMA and half a molecule of OXA in the asymmetric unit; the inversion symmetry generates the other half of OXA (Fig. 6b). AMA and OXA interact via N–H⋯O hydrogen bonds (single point and bifurcated hydrogen bonds). The acid group of AMA is involved in a supramolecular acid–acid homosynthon with the R22(8) ring motif. In the crystal packing, the AMA and OXA molecules form cyclic tetramer units of R24(8) and R44(12) ring motifs, and these interactions continue to form a 3D hydrogen-bonded network of AMA–OXA (Fig. 7a).
 |
| | Fig. 7 a) 3D hydrogen bonded network of AMA–OXA (1:0.5), where molecules of AMA and OXA stack one after the other, the acid dimer and tetramer unit (R44(12)) are labelled. b) 2D representation of the AMA–TAT–H2O (2:1:1) salt hydrate showing the tetramer and pentamer units along with the ring motif involving the TAT molecule. | |
3.1.8 AMA–TAT–H2O (2:1:1).
The salt hydrate crystallises in a 2:1:1 ratio of AMA (labelled with suffixes A & B), TAT, and H2O molecules in the asymmetric unit (Fig. 6c). One of the AMA acid groups forms a bifurcated O–H⋯O hydrogen bond with TAT, while the second AMA forms a single point O–H⋯O hydrogen bond with the carboxylate of TAT. The carbonyl group of AMA A & B involves hydrogen bonds with water molecules and the hydroxyl group of TAT, respectively. The –+NH3 group of AMA A is involved in the N–H⋯O hydrogen bond with two TAT molecules and one water molecule, whereas AMA B forms an N–H⋯O hydrogen bond with three TAT molecules. The TAT molecules in the crystal structure form a dimer via an O–H⋯O hydrogen bond between hydroxyl and carboxyl groups (R22(12)). These interactions continue to form a 3D hydrogen-bonded network of AMA–TAT. In the crystal packing, TAT, H2O and AMA A & B form cyclic hexamer (R56(28)) & pentamer (R55(18)) units, while AMA and TAT form cyclic tetramer (R34(25)) and pentamer (R45(29)) units (Fig. 7b).
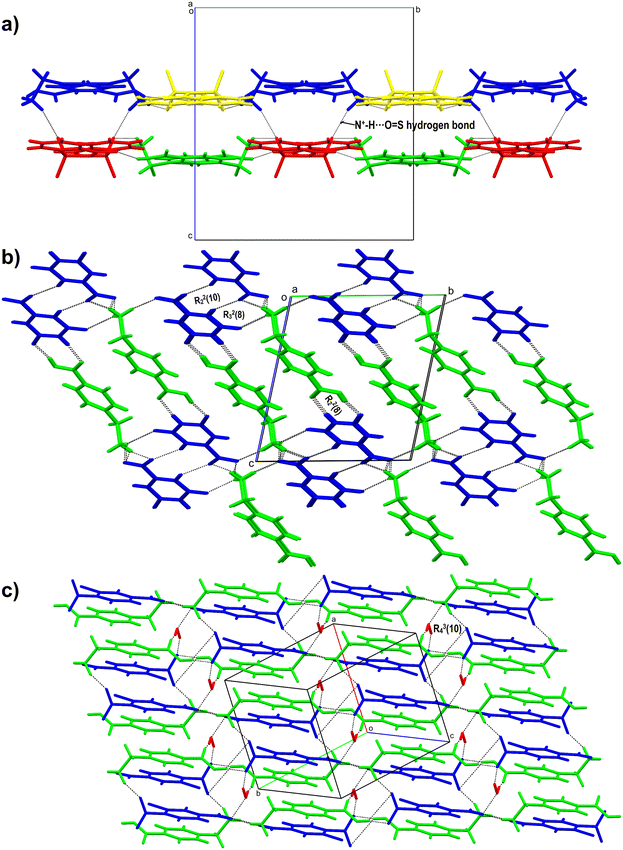
3.1.9 AMA–SAC (1:1).
The salt crystallises as anhydrous, and the asymmetric unit contains two molecules of AMA (labelled with suffixes A & B) and SAC (Fig. 6d). The acid group of AMA A & B forms an O–H⋯O hydrogen bond with the carbonyl group of SAC. Further, the –C![[double bond, length as m-dash]](https://www.rsc.org/images/entities/char_e001.gif) O of SAC forms an N–H⋯O hydrogen bond with adjacent AMA molecules. One of the SAC molecule's –SO groups is involved in a bifurcated N–H⋯O hydrogen bond with AMA A & B, while the second –SO group of SAC is involved in an N–H⋯O hydrogen bond with AMA B. In the crystal packing, AMA and SAC form a cyclic hexamer unit which continues along 2D and forms a cyclic chain-like structure of AMA–SAC (1:1) (Fig. 8a).
O of SAC forms an N–H⋯O hydrogen bond with adjacent AMA molecules. One of the SAC molecule's –SO groups is involved in a bifurcated N–H⋯O hydrogen bond with AMA A & B, while the second –SO group of SAC is involved in an N–H⋯O hydrogen bond with AMA B. In the crystal packing, AMA and SAC form a cyclic hexamer unit which continues along 2D and forms a cyclic chain-like structure of AMA–SAC (1:1) (Fig. 8a).
 |
| | Fig. 8 a) 2D hydrogen bonded network of ACA–SAC (1:1) showing the N+–H⋯O hydrogen bond involving SAC and AMA (blue, green: AMA; red, yellow: SAC), b) 3D crystal packing of AMA–ORA (1:1) showing an acid–amide heterosynthon (R22(8)) and ring motifs involving AMA and ORA, and c) 2D ladder-like structure of AMA–CNB–H2O (1:1:1) showing a ring motif involving AMA, CNB and H2O molecules. | |
3.1.10 AMA–ORA (1:1).
The salt crystallises as anhydrous with a 1:1 stoichiometric ratio of AMA and ORA in the asymmetric unit (Fig. 6e). The molecules interact through an acid–amide heterosynthon between AMA and ORA with an R22(8) ring motif. The ammonium –+N–H of AMA is involved in a bifurcated N–H⋯O hydrogen bond with the carboxyl group of ORA, a bifurcated N–H⋯O hydrogen bond with the carbonyl and carboxylate groups of ORA and a single point N–H⋯O hydrogen bond with the carboxylate of ORA. The second amide group of ORA is involved in an N–H⋯O hydrogen bond with adjacent AMA and ORA molecules, respectively. In the crystal packing, these hydrogen bond interactions extend to form a 3D hydrogen-bonded sheet-like structure of AMA–ORA (Fig. 8b). The crystal structure exhibits cyclic ring motifs of R44(26) (tetramer unit of AMA and ORA), R23(8) (trimer unit of AMA and ORA), R22(10) (dimer unit between ORA), and R24(8) (tetramer unit between AMA & ORA molecules).
3.1.11 AMA–CNB–H2O (1:1:1).
The salt crystallises as a monohydrate with one molecule each of AMA, CNB and H2O in the asymmetric unit (Fig. 6f). The molecules link via the acid group of AMA, forming a bifurcated O–H⋯O hydrogen bond with the carboxyl group of CNB. The carbonyl group of AMA connects to the water molecule (O1W) via an O–H⋯O hydrogen bond, which in turn connects to adjacent carboxylate ‘O’ of CNB and ammonium –+N–H of AMA. The –+N–H of AMA further links with the nitro group of CNB via a bifurcated N–H⋯O hydrogen bond and the carboxyl group of CNB (single point N–H⋯O hydrogen bond). In the crystal packing, these interactions continue to form a 2D hydrogen-bonded network of AMA–CNB. The crystal structure features cyclic ring motifs of R34(10) (tetramer unit), R56(40) (hexamer unit), R46(16) (hexamer unit), and R46(26) (hexamer unit) between AMA, CNB and H2O molecules (Fig. 8c).
3.2 PXRD analysis
Powder X-ray diffraction (PXRD) provides a reliable way to confirm the purity and uniformity of a crystalline material by analysing its specific diffraction pattern, allowing for quick differentiation from the starting material. The powder pattern overlay of ACA and AMA salts, along with the parent and coformers, is shown in Fig. S1–S11. The experimental PXRD patterns closely align with the simulated data, confirming the phase purity of the ACA and AMA salts.
3.3 Discussion on the mechanochemical preparation by the ball-milling method
The growing interest in mechanochemical methods arises from their numerous advantages over traditional solution-based reactions. Moreover, mechanochemical processes can offer control over the polymorphic form of a product, which is sometimes unattainable in solution-based methods. Recently, Friščić et al. demonstrated the formation of a cocrystal polymorph (form II) in the nicotinamide–adipic acid system. The cocrystal exists in two stoichiometries, 1:1 and 2:1. When milling nicotinamide and adipic acid in a 1:1 ratio using acetonitrile in a poly(methyl methacrylate) (PMMA) jar with two stainless steel balls (7 mm), form I was obtained. However, replacing the PMMA jar with a stainless steel one resulted in the formation of form II. Further experiments under neat grinding and liquid-assisted grinding conditions with different solvents at the same liquid-to-solid ratio showed that form I preferentially formed in PMMA jars, while form II dominated in stainless steel jars.13 These findings clearly demonstrate that the jar material significantly influences the polymorphic outcome. Kulla et al. milled pyrazinamide with pimelic acid and found that cocrystal forms I and II could be obtained directly under different milling conditions, without any intermediates.32 Jones et al. investigated the polymorphic diversity of caffeine–anthranilic acid cocrystals by varying the amount of solvents in liquid-assisted grinding.33 Stolar et al. reported that during the mechanochemical synthesis of ascorbic acid–nicotinamide cocrystals (forms I and II) using ethanol or methanol, the formation of an intermediate phase was unavoidable, although its crystal structure remained unidentified.34 Literature reports suggest that several milling parameters can influence the rate of product formation, including milling frequency and time32,35,36 milling ball size, jar size37,38 and the material of the milling jar.39
To find the optimal parameters for the bulk-scale preparation of ACA and AMA salts using the ball-milling technique, various experimental conditions were explored, including milling media, ball size and count, milling speed, and time. These conditions served as a model to investigate the mechanochemical reactions through solvent-assisted (LAG) and neat milling/grinding (NG) to assess their effects on forming solid forms. Optimising mechanochemical reactions imposes controlling various parameters to achieve the desired yields and selectivities.38,40,41 A clear understanding of how factors such as milling time, frequency, and milling media influence reaction outcomes is crucial for developing new mechanochemical processes and ensuring their consistent reproducibility.7,42
In relation to the various types of milling media (stainless steel, agate, and zirconia), agate jars and agate balls were used in all our experiments. Other relevant factors for the milling media include the size of the jars, alongside the number and size of the milling balls. Thus, the optimal number and size of milling balls typically vary depending on the specific mechanochemical reaction, and identifying the most effective combination involves optimising the experimental conditions.43,44 For our experiments, we utilised 10 mL of agate jars and employed two distinct ball sizes—5 mm and 10 mm. One set of trials was conducted using uniform-sized balls (seven 5 mm balls), while another set involved a mix of sizes (three 5 mm balls and one 10 mm ball). The first parameter investigated in the preparation of ACA/AMA salts is milling frequency. The milling frequency represents a pivotal parameter in the design of practices for mechanochemical reactions.39 We investigated four different milling frequencies for ACA salts, ranging from lower to higher speeds: 300, 500, 700, and 1000 rpm. Our milling experiments were conducted at each of these frequencies for both 30 and 60 minutes. All these experimental parameters were investigated under solvent-assisted and neat grinding conditions.45 20 μl of purified water was used as the solvent for all the solvent-assisted milling experiments. The powder samples from the ball-milling experiments were analysed using powder X-ray diffraction (PXRD). The Topas software was then utilised to confirm and quantify the percentage conversion of the drug and coformers to salt.
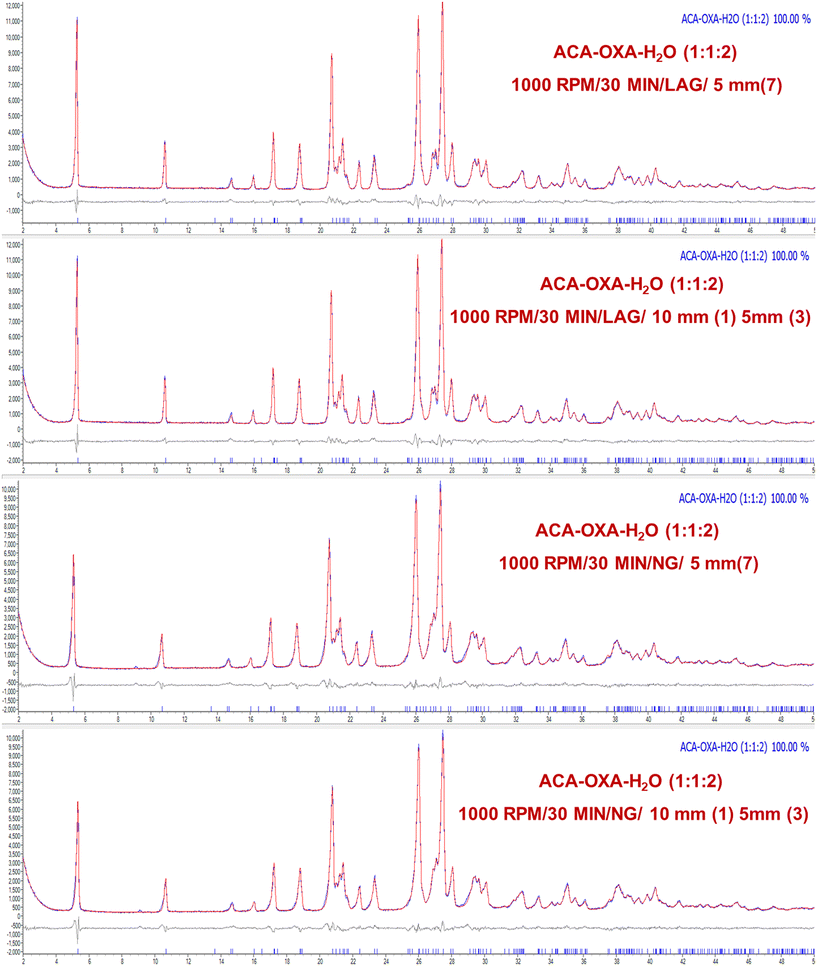
In the ACA–CAF–H2O (3:2:2.6) system, complete salt formation was achieved at the highest milling frequency of 1000 rpm after 60 minutes under solvent-assisted conditions and a phase-pure form of ACA–CAF–H2O (3:2:2.6) was not obtained under neat grinding conditions within 60 minutes (Fig. 9 and S12). For the ACA–TAT (1:1) system, salt formation was achieved using both uniform (5 mm × 7) and mixed ball sizes (10 mm × 1 and 5 mm × 3) under both solvent-assisted and neat grinding conditions. As shown in Fig. 10 and S14, solvent-assisted grinding led to complete salt conversion within 30 minutes at 700 and 1000 rpm, while neat grinding required 30 minutes at 1000 rpm or 60 minutes at 700 rpm. At lower and intermediate frequencies (300, 500, and 700 rpm), the product consisted of a mixture of drug (ACA), coformers, and the salts in all the systems. Fig. S13 (ACA–CAF–H2O) shows that at a lower frequency (300 rpm), both the drug and coformers coexist with the salt, suggesting that the energy input is insufficient for complete salt formation. The phase pure form of ACA–OXA–H2O (1:1:2) was obtained under both solvent-assisted and neat grinding conditions at 1000 rpm for 30 minutes, using both uniform-sized and mixed-sized balls (Fig. 11 and 12). Interestingly, the pure form of ACA–OXA–H2O (1:1:1.5) was formed at intermediate frequencies (500 and 700 rpm) under solvent-assisted grinding at 60 minutes of milling, specifically when a mixed ball combination (one 10 mm and three 5 mm balls) was used (Fig. 13). In contrast, neat grinding at a lower frequency (300 rpm) yielded a mixture of ACA–OXA–H2O (1:1:2) & ACA–OXA–H2O (1:1:1.5) (Fig. 13). Remarkably, the ACA–ORA (1:1) salt was successfully formed at all four milling frequencies within 30 minutes, under both solvent-assisted and neat grinding conditions (Fig. S15).
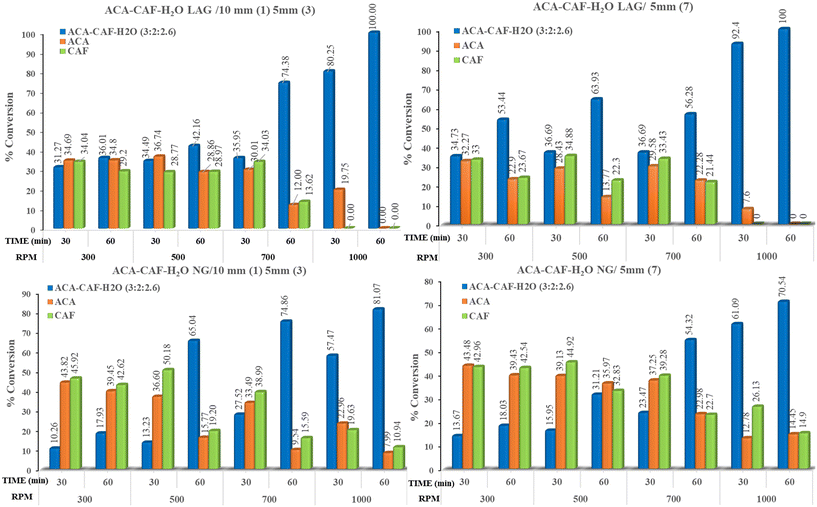 |
| | Fig. 9 Bar charts illustrating the percentage of salt conversion for the ACA–CAF–H2O (3:2:2.6) system under various ball-milling conditions. Only under higher milling frequency and LAG conditions that complete conversion of ACA–CAF–H2O (3:2:2.6) was observed. | |
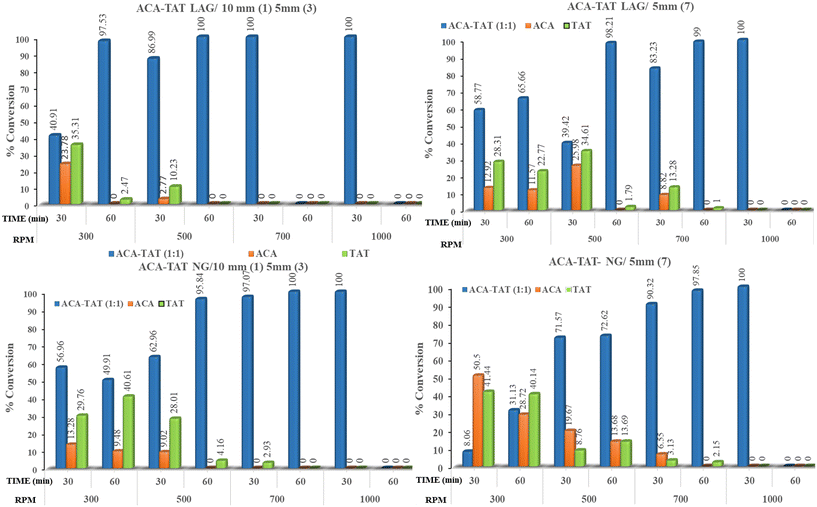 |
| | Fig. 10 Bar diagrams depicting the salt formation efficiency of ACA–TAT (1:1) under multiple different conditions in the presence and absence of a solvent. | |
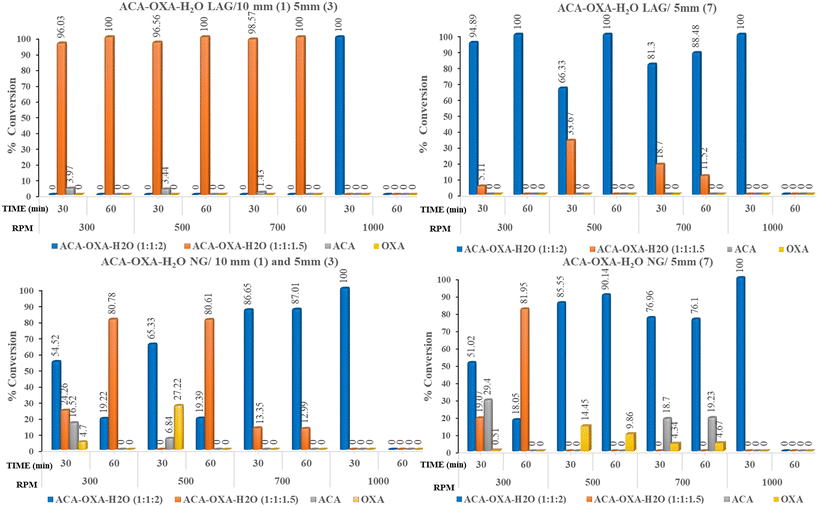 |
| | Fig. 11 Bar diagrams of ACA–OXA–H2O (1:1:2/1.5) showing the percentage salt conversion concerning various ball-milling conditions under solvent-assisted and neat grinding conditions. | |
 |
| | Fig. 12 ACA–OXA–H2O (1:1:2) ball-milling at 1000 rpm under LAG and NG conditions. ACA–OXA–H2O (1:1:2) was obtained predominantly at lower rpm, while at higher rpm, ACA–OXA–H2O (1:1:1.5) was obtained. | |
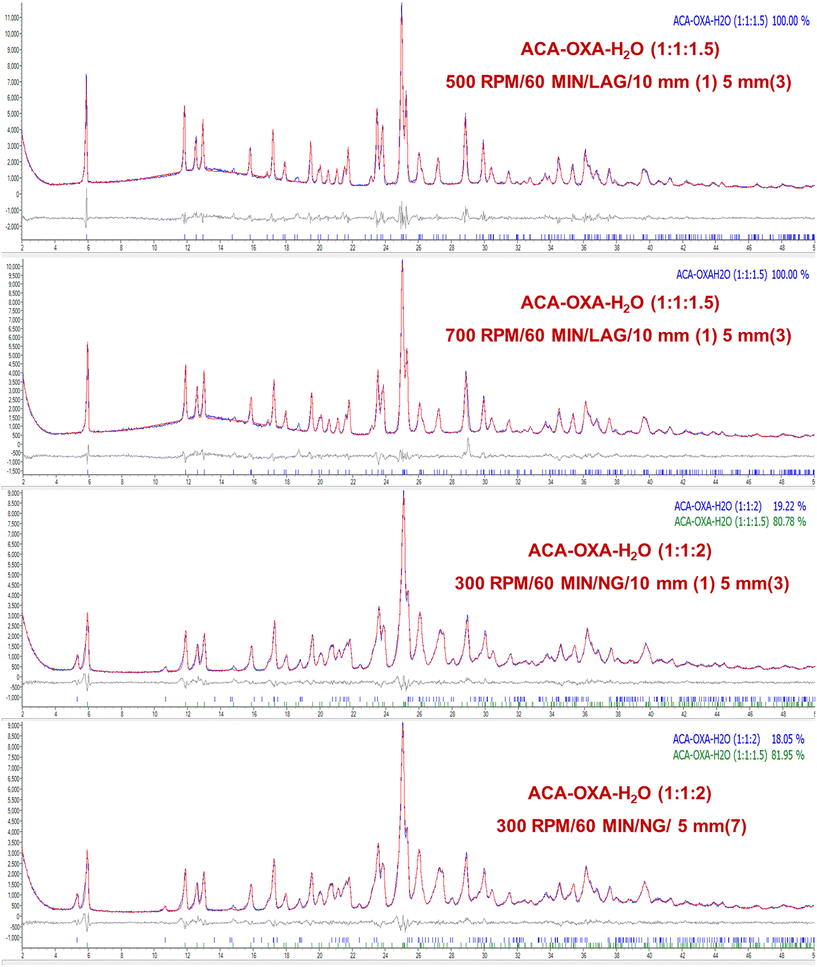 |
| | Fig. 13 Rietveld refinement plots of ACA–OXA–H2O (1:1:1.5) ball-milling at 300, 500, and 700 rpm with varying ball size under LAG and NG conditions. | |
A similar approach was used to prepare AMA salts, where higher milling frequencies led to complete salt conversion, consistent with the ACA salt systems. Minimal changes were observed at intermediate milling frequencies (500–700 rpm); therefore, the study focused on 300 and 1000 rpm for 30 and 60 minutes (Fig. S16–S20). The AMA–ORA (1:1) and AMA–OXA (1:0.5) systems achieved complete conversion under both conditions at 1000 rpm for 30 minutes (Fig. S21 and S22), whereas 300 rpm/60 minutes of milling led to incomplete mixing and unaccountable peaks were observed for AMA–OXA (1:0.5) (Fig. S23). For the AMA–CNB–H2O (1:1:1) and AMA–TAT–H2O (2:1:1) systems, full conversion occurred at 1000 rpm for 30 minutes under solvent-assisted conditions (Fig. S24 and S25), while both high and low frequencies under neat grinding produced only physical mixtures of the drug and coformers. In contrast, AMA–SAC (1:1) salts were formed under neat grinding at 1000 rpm and a duration of 60 minutes (Fig. S26). Under solvent-assisted conditions, a distinctly different powder pattern which emerged after 30 minutes of milling may be attributed to the new solid phase. Fig. S27 shows the powder pattern overlay of AMA–SAC under solvent-assisted grinding at 1000 and 300 rpm and 30 minutes of milling with the AMA–SAC simulated powder pattern.
Our study demonstrates that milling frequency and solvent assistance are the most critical parameters influencing salt formation in both ACA and AMA systems. A high milling frequency of 1000 rpm combined with a 30 minute milling duration consistently yielded phase-pure ACA and AMA salts across all systems irrespective of the ball size/ball count, whereas lower or intermediate frequencies (300–700 rpm) produced incomplete conversions or physical mixtures of the reactants. The use of solvent-assisted grinding significantly enhanced reaction kinetics, enabling complete conversion at shorter times compared to neat grinding. Variations in ball size and count had a minimal influence on conversion efficiency, except in the ACA–OXA system, where a mixed ball configuration at intermediate frequencies facilitated the selective formation of the ACA–OXA–H2O (1:1:1.5) sesquihydrate, a form previously unattainable by slurry methods. These findings confirm that optimizing the milling energy input and solvent conditions is essential for achieving reproducible, phase-pure mechanochemical salt formation.
3.4 Thermal analysis
DSC analysis was performed to examine the thermal behaviour of the prepared ACA and AMA salts. The distinct melting point observed as compared to the parent compounds for the ACA and AMA salts indicates the formation of a new solid phase. The DSC thermograms of the ACA and AMA salts are shown in Fig. 14 and 15. It is observed that the pure ACA and AMA showed a sharp single endothermic peak at 210.0 °C and 314.91 °C, respectively. The melting temperatures of the ACA and AMA salts were found to be lower than those of the drug and coformers, except for ACA–OXA–H2O (1:1:2), AMA–OXA (1:0.5), AMA–TAT–H2O (2:1:1) and AMA–CNB–H2O (1:1:1), which showed melting temperatures intermediate between the starting compounds. The lower melting point is probably due to the interactions involved in the crystal packing and the charge-assisted +N–H⋯O− hydrogen bonding, along with other C–H⋯O interactions in the salts being weaker than those in the pure ACA and AMA crystal structures. The onset and peak melting temperatures of the parent drugs (ACA and AMA), coformers and the prepared salts are shown in Table 3. The single endothermic peak for the crystalline materials of ACA–TAT (1:1), ACA–ORA (1:1), AMA–OXA (1:0.5), AMA–SAC (1:1), and AMA–ORA (1:1) shows the homogeneity and the thermal stability of the prepared salts. In ACA–OXA–H2O (1:1:2), ACA–OXA–H2O (1:1:1.5), ACA–CAF–H2O (3:2:2.6), AMA–TAT–H2O (2:1:1), and AMA–CNB–H2O (1:1:1) salts, the first endothermic peak is attributed to the release of water molecules from the crystal lattice, and the second endothermic peak corresponds to the melting point of the salts.
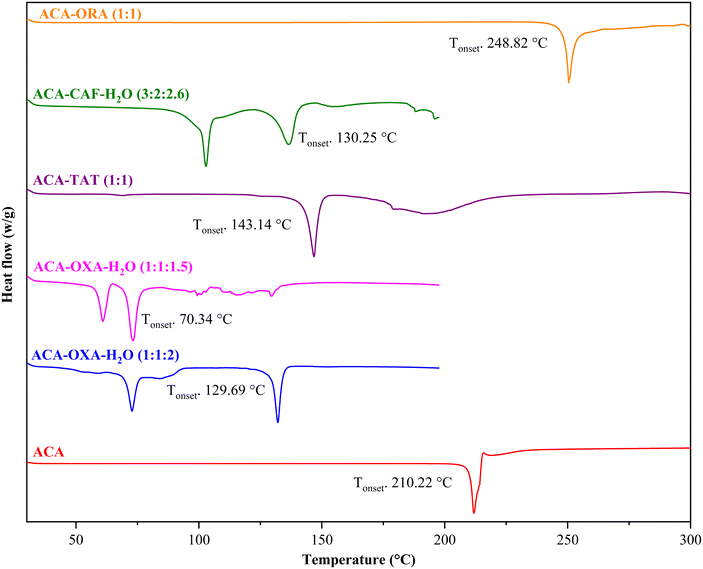 |
| | Fig. 14 DSC plots of ACA and the prepared salts. | |
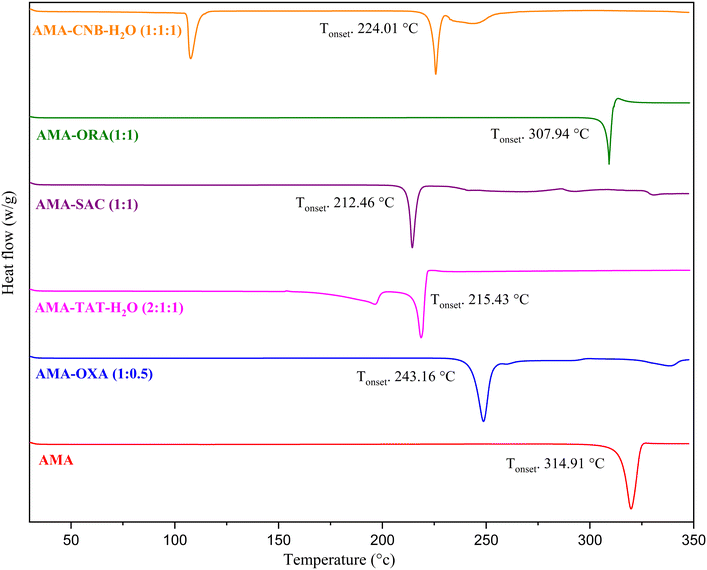 |
| | Fig. 15 DSC plots of AMA and the prepared salts. | |
Table 3 Onset and peak melting temperatures of ACA and AMA salts, along with the percentage weight loss observed in the hydrated salts
| Solid forms |
Onset melting temperature (°C ± 0.7 °C) |
Peak melting temperature (°C ± 0.7 °C) |
Coformers' melting temperature (°C ± 0.7 °C) |
Theoretical weight loss of H2O (% ± 0.05%) |
Observed weight loss of H2O (% ± 0.05%) |
| ACA |
210.22 |
211.88 |
— |
— |
— |
| ACA–OXA–H2O (1:1:2) |
129.69 |
132.12 |
— |
13.9 |
13.6 |
| ACA–OXA–H2O (1:1:1.5) |
70.34 |
73.16 |
— |
10.9 |
11.8 |
| ACA–TAT (1:1) |
143.14 |
146.81 |
— |
— |
— |
| ACA–CAF–H2O (3:2:2.6) |
130.25 |
136.68 |
— |
5.8 |
5.7 |
| ACA–ORA (1:1) |
248.82 |
250.44 |
— |
— |
— |
| AMA |
314.91 |
319.82 |
— |
— |
— |
| AMA–OXA (1:0.5) |
243.16 |
248.67 |
— |
— |
— |
| AMA–TAT–H2O (2:1:1) |
215.43 |
218.80 |
— |
3.8 |
4.5 |
| AMA–SAC (1:1) |
212.46 |
214.41 |
— |
— |
— |
| AMA–ORA (1:1) |
307.94 |
309.22 |
— |
— |
— |
| AMA–CNB–H2O (1:1:1) |
224.01 |
225.71 |
— |
4.9 |
5.3 |
| OXA |
— |
— |
101–102 |
— |
— |
| TAT |
— |
— |
170–172 |
— |
— |
| CAF |
— |
— |
211–213 |
— |
— |
| SAC |
— |
— |
228.8 |
— |
— |
| ORA |
— |
— |
345.5 |
— |
— |
| CNB |
— |
— |
138 |
— |
— |
TGA analysis was conducted on the parent drugs and the salts containing water molecules to assess their thermal stability and quantify the incorporated water molecules. The weight loss occurring between 50 and 150 °C was quantified and then correlated with the theoretical water loss. Table 3 shows the calculated and theoretical weight loss of the ACA and AMA salts. The TGA curve of ACA–OXA–H2O (1:1:2) showed a 13.9% weight loss, which is due to the release of two water molecules. Similarly, ACA–OXA–H2O (1:1:1.5) showed a 10.9% weight loss, which corresponds to the release of one and a half water molecules from the asymmetric unit. The TGA plot is shown in Fig. S28.
3.5 FT-IR spectroscopy
FT-IR spectroscopy was used to analyse the prepared salts of ACA and AMA, and the resulting spectra were compared against the spectra of the parent drug molecules. The observed shift in the vibrational frequency of the developed salts compared to the starting materials is attributed to the formation of distinct hydrogen bonds in the crystal structures. Owing to their zwitterionic nature, ACA and AMA show a carboxylate –CO stretching frequency at 1561 and 1586 cm−1, respectively. The –+NH3 bending frequency of ACA and AMA was observed at 1624 and 1636 cm−1. Due to the proton transfer from the acid group of the coformers to the amine/acid group of ACA and AMA, the carboxylate of ACA and AMA exists as carboxylic acid in all the prepared salts. In all the prepared salts of ACA and AMA, two carbonyl stretching frequencies were observed, which correspond to the acid carbonyl of ACA and carboxylate carbonyl of the respective coformers. A detailed list of stretching frequencies is given in Table 4 (average of three readings). Observing a new carbonyl stretching frequency for ACA and AMA at around 1700 cm−1 in all the prepared salts is significant, as it suggests the formation of a novel crystalline material. The O–H/N–H stretching frequencies of the salts were observed in the range between 3545 and 3089 cm−1. The comparison spectra of the ACA/AMA salts with their starting materials are given in Fig. S29–S37.
Table 4 FT-IR stretching frequencies of ACA and AMA salts
| Solid forms |
Acid/carboxylate –CO stretching (cm−1) |
Amide –CO stretching (cm−1) |
–C–O/–C–N stretching (cm−1) |
–O–H/N–H stretching (cm−1) |
| ACA |
1561 |
— |
1388 |
— |
| ACA–OXA–H2O (1:1:2) |
1720, 1613 |
— |
1393 |
3087 |
| ACA–OXA–H2O (1:1:1.5) |
1693, 1623 |
— |
1394 |
3417, 3077 |
| ACA–TAT (1:1) |
1734, 1650 |
— |
1368 |
3427, 3228 |
| ACA–CAF–H2O (3:2:2.6) |
1680,1634 |
— |
1374 |
3088 |
| ACA–ORA (1:1) |
1706, 1646 |
1685 |
1381 |
3520, 3140 |
| AMA |
1586 |
— |
1328 |
— |
| AMA–OXA (1:0.5) |
1684, 1632 |
— |
1320 |
— |
| AMA–TAT–H2O (2:1:1) |
1685, 1558 |
— |
1315 |
3384 |
| AMA–SAC (1:1) |
1701 |
1606 |
1312 |
3053 |
| AMA–ORA (1:1) |
1734, 1633 |
1683 |
1320 |
3061 |
| AMA–CNB–H2O (1:1:1) |
1684, 1613 |
— |
1343 |
3222 |
4. Conclusions
In summary, we reported salt forms of antifibrinolytic agents, ACA and AMA, with different coformers along with the crystal structure of anhydrous AMA using the solvent evaporation method. The developed salts were well-characterised by single-crystal X-ray diffraction, powder X-ray diffraction, spectroscopic and thermal analysis techniques. The mechanochemical method was employed to investigate the effect of various parameters (such as milling frequency, milling time, and milling media) on the formation and completion of salts. Our findings revealed that a higher milling frequency (1000 rpm) facilitates complete salt formation within 30 to 60 minutes, while lower and intermediate frequencies (300, 500, and 700 rpm) led to poor mixing and incomplete conversion across all ACA and AMA salt systems. Notably, the ACA–OXA–H2O (1:1:2) salt was successfully prepared under both liquid-assisted and neat grinding conditions at 1000 rpm. Interestingly, ACA–OXA–H2O (1:1:1.5) (sesquihydrate) formed only under liquid-assisted ball milling at intermediate frequencies (500 and 700 rpm) with 60 minutes of milling. These results highlight that the mechanochemical method can significantly influence the desired multicomponent formation based on the milling frequency and time, underscoring the importance of mechanochemical methods in the preparation of pharmaceutical solid forms.
Conflicts of interest
There are no conflicts to declare.
Data availability
All relevant data are included in the article and its supplementary information (SI).
Supplementary information: the SI contains the hydrogen bond geometry of salts, PXRD overlay, FT-IR spectrum overlay, TGA plots, Rietveld refinement plots, and bar diagram depicting the percentage conversion of salts. See DOI: https://doi.org/10.1039/d5ce00830a.
CCDC 2463047–2463057 contain the supplementary crystallographic data for this paper.46a–k
Acknowledgements
The authors are thankful to D. Srinivasa Reddy, Director, CSIR-IICT, for his encouragement, research infrastructure, and in-house seed grant (MLP 0101). The authors thank CSIR-IICT for providing the manuscript communication number (IICT/Pubs/2025/210). MK acknowledges Mr. Sivanarayanan Palani and Dr. Balasubramanian Sridhar for the timely help in Rietveld refinement and crystal structure refinement of salts.
References
- J. F. Reynes, F. Leon and F. García, ACS Org. Inorg. Au, 2024, 4, 432–470 CrossRef CAS PubMed.
- J. L. Howard, Q. Cao and D. L. Browne, Chem. Sci., 2018, 9, 3080–3094 RSC.
- M. Solares-Briones, G. Coyote-Dotor, J. C. Páez-Franco, M. R. Zermeño-Ortega, C. M. De La O Contreras, D. Canseco-González, A. Avila-Sorrosa, D. Morales-Morales and J. M. Germán-Acacio, Pharmaceutics, 2021, 13, 790 CrossRef CAS PubMed.
- D. Braga, L. Maini and F. Grepioni, Chem. Soc. Rev., 2013, 42, 7638 RSC.
- M. Bhatia and S. Devi, CrystEngComm, 2024, 26, 293–311 RSC.
- R.-A. Mitran, S. Ioniţă, D. Lincu, E. M. Soare, I. Atkinson, A. Rusu, J. Pandele-Cuşu, C. Iordache, I. Pongratz, M. M. Pop and V. Fruth, Materials, 2024, 17, 3145 CrossRef CAS PubMed.
- O. F. Jafter, S. Lee, J. Park, C. Cabanetos and D. Lungerich, Angew. Chem., Int. Ed., 2024, 63, e202409731 CrossRef CAS PubMed.
- E. S. Go, E. J. Hong, J. Y. Lee, T. Stolar, G. I. Peterson, F. L. Emmerling, K. Kim and J. G. Kim, JACS Au, 2025, 5, 2720–2727 CrossRef CAS PubMed.
- J.-L. Do and T. Friščić, ACS Cent. Sci., 2017, 3, 13–19 CrossRef CAS PubMed.
- T. Friščić, Chem. Soc. Rev., 2012, 41, 3493 RSC.
- B. Saikia, D. Pathak and B. Sarma, CrystEngComm, 2021, 23, 4583–4606 RSC.
- D. R. Weyna, T. Shattock, P. Vishweshwar and M. J. Zaworotko, Cryst. Growth Des., 2009, 9, 1106–1123 CrossRef CAS.
- L. S. Germann, M. Arhangelskis, M. Etter, R. E. Dinnebier and T. Friščić, Chem. Sci., 2020, 11, 10092–10100 RSC.
-
A. N. Primm, in Essentials of Blood Product Management in Anesthesia Practice, ed. C. S. Scher, A. D. Kaye, H. Liu, S. Perelman and S. Leavitt, Springer International Publishing, Cham, 2021, pp. 37–49 Search PubMed.
- E. Ortmann, M. W. Besser and A. A. Klein, Br. J. Anaesth., 2013, 111, 549–563 CrossRef CAS PubMed.
- N. S. Gerstein, J. K. Brierley, J. Windsor, P. V. Panikkath, H. Ram, K. M. Gelfenbeyn, L. J. Jinkins, L. C. Nguyen and W. H. Gerstein, J. Cardiothorac. Vasc. Anesth., 2017, 31, 2183–2205 CrossRef PubMed.
- A. M. Gordon, G. P. McNicol, A. H. C. Dubber, G. A. McDonald and A. S. Douglas, Br. Med. J., 1965, 1, 1632–1635 CrossRef CAS PubMed.
- J. Griffin and L. Ellman, Semin. Thromb. Hemostasis, 2008, 5, 27–40 CrossRef PubMed.
- M. Verstraete, Drugs, 1985, 29, 236–261 CrossRef CAS PubMed.
- J. Macíček and T. Vladkova, Acta Crystallogr., Sect. C: Cryst. Struct. Commun., 1991, 47, 2709–2711 CrossRef.
- M. Rademeyer and B. Van Der Westhuizen, CrystEngComm, 2017, 19, 6821–6836 RSC.
- A. M. Atria, M. T. Garland and R. Baggio, Acta Crystallogr., Sect. E: Struct. Rep. Online, 2014, 70, 385–388 CrossRef CAS PubMed.
- A. Direm, A. Altomare, A. Moliterni and N. Benali-Cherif, Acta Crystallogr., Sect. B: Struct. Sci., Cryst. Eng. Mater., 2015, 71, 427–436 CrossRef CAS PubMed.
- Y. Atoini, J. Harrowfield and P. Thuéry, CrystEngComm, 2024, 26, 3714–3725 RSC.
- M. M. Khodaei, A. Alizadeh and M. Haghipour, Res. Chem. Intermed., 2019, 45, 2727–2747 CrossRef CAS.
-
APEX3, Bruker AXS, Madison, WI, USA, 2015 Search PubMed.
-
G. M. Sheldrick, SHELXL-2018 Software Package, University ofGottingen, Germany, 2018 Search PubMed.
- S. Palani, N. Ilaveni, K. D. Sanagari, S. K. Nechipadappu, S. Balasubramanian and J. B. Nanubolu, Anal. Methods, 2025, 17, 9101–9117 RSC.
- H. M. Rietveld, J. Appl. Crystallogr., 1969, 2, 65–71 CrossRef CAS.
- V. Uvarov, J. Appl. Crystallogr., 2019, 52, 252–261 CrossRef CAS.
- T. Runčevski and C. M. Brown, Cryst. Growth Des., 2021, 21, 4821–4822 CrossRef.
- H. Kulla, C. Becker, A. A. L. Michalchuk, K. Linberg, B. Paulus and F. Emmerling, Cryst. Growth Des., 2019, 19, 7271–7279 CrossRef CAS.
- D. Hasa, E. Miniussi and W. Jones, Cryst. Growth Des., 2016, 16, 4582–4588 CrossRef CAS.
- T. Stolar, S. Lukin, M. Tireli, I. Sović, B. Karadeniz, I. Kereković, G. Matijašić, M. Gretić, Z. Katančić, I. Dejanović, M. D. Michiel, I. Halasz and K. Užarević, ACS Sustainable Chem. Eng., 2019, 7, 7102–7110 CrossRef CAS.
- P. A. Julien, I. Malvestiti and T. Friščić, Beilstein J. Org. Chem., 2017, 13, 2160–2168 CrossRef CAS PubMed.
- X. Ma, W. Yuan, S. E. J. Bell and S. L. James, Chem. Commun., 2014, 50, 1585 RSC.
- A. Stolle, R. Schmidt and K. Jacob, Faraday Discuss., 2014, 170, 267–286 RSC.
- R. Schmidt, C. F. Burmeister, M. Baláž, A. Kwade and A. Stolle, Org. Process Res. Dev., 2015, 19, 427–436 CrossRef CAS.
- A. A. L. Michalchuk, I. A. Tumanov and E. V. Boldyreva, CrystEngComm, 2019, 21, 2174–2179 RSC.
- J. G. Hernández and C. Bolm, J. Org. Chem., 2017, 82, 4007–4019 CrossRef PubMed.
- S. Garrido Nuñez, D. L. Schott and J. T. Padding, Int. J. Hydrogen Energy, 2025, 97, 640–648 CrossRef.
- I. R. Speight, K. J. Ardila-Fierro, J. G. Hernández, F. Emmerling, A. A. L. Michalchuk, F. García, E. Colacino and J. Mack, Nat. Rev. Methods Primers, 2025, 5, 29 CrossRef CAS.
- A. H. Hergesell, C. L. Seitzinger, J. Burg, R. J. Baarslag and I. Vollmer, RSC Mechanochem., 2025, 2, 263–272 RSC.
- K. S. McKissic, J. T. Caruso, R. G. Blair and J. Mack, Green Chem., 2014, 16, 1628 RSC.
- T. Friščić, S. L. Childs, S. A. A. Rizvi and W. Jones, CrystEngComm, 2009, 11, 418–426 RSC.
-
(a)
CCDC 2463047: Experimental Crystal Structure Determination, 2025, DOI:10.5517/ccdc.csd.cc2np04j;
(b)
CCDC 2463048: Experimental Crystal
Structure Determination, 2025, DOI:10.5517/ccdc.csd.cc2np05k;
(c)
CCDC 2463049: Experimental Crystal Structure Determination, 2025, DOI:10.5517/ccdc.csd.cc2np06l;
(d)
CCDC 2463050: Experimental Crystal Structure Determination, 2025, DOI:10.5517/ccdc.csd.cc2np07m;
(e)
CCDC 2463051: Experimental Crystal Structure Determination, 2025, DOI:10.5517/ccdc.csd.cc2np08n;
(f)
CCDC 2463052: Experimental Crystal Structure Determination, 2025, DOI:10.5517/ccdc.csd.cc2np09p;
(g)
CCDC 2463053: Experimental Crystal Structure Determination, 2025, DOI:10.5517/ccdc.csd.cc2np0bq;
(h)
CCDC 2463054: Experimental Crystal Structure Determination, 2025, DOI:10.5517/ccdc.csd.cc2np0cr;
(i)
CCDC 2463055: Experimental Crystal Structure Determination, 2025, DOI:10.5517/ccdc.csd.cc2np0ds;
(j)
CCDC 2463056: Experimental Crystal Structure Determination, 2025, DOI:10.5517/ccdc.csd.cc2np0ft;
(k)
CCDC 2463057: Experimental Crystal Structure Determination, 2025, DOI:10.5517/ccdc.csd.cc2np0gv.
- H. M. Frösler, H. S. Ramulumo, C. Edmonds-Smith and M. R. Caira, Crystals, 2023, 13, 1222 CrossRef.
|
| This journal is © The Royal Society of Chemistry 2026 |
Click here to see how this site uses Cookies. View our privacy policy here. 
 *ab
*ab


