
 Open Access Article
 This Open Access Article is licensed under a Creative Commons Attribution-Non Commercial 3.0 Unported Licence
Highly-sensitive detection of methanol via metal–phenolic film-coated quartz crystal microbalances possessing distinct physicochemical surface profile†
Karekin D.
Esmeryan
 * and
Yuliyan
Lazarov
* and
Yuliyan
Lazarov
Acoustoelectronics Laboratory, Georgi Nadjakov Institute of Solid State Physics, Bulgarian Academy of Sciences, 72, Tzarigradsko Chaussee Blvd., 1784 Sofia, Bulgaria. E-mail: karekin_esmerian@abv.bg; Tel: +359 2 979 5811
First published on 9th May 2025
Abstract
Alcohol is one of the most widespread mind-affecting substances increasing the internal feeling of happiness, euphoria, conviviality and pleasance, but the improperly distilled (adulterated) beverages containing methanol pose risk to the human health. Measures for preventing the intoxication with counterfeit alcohol comprise point-of-use analysis of the alcohol via portable metal-oxide devices, liquid crystal-based detectors and spectrometric sensors with limited effectiveness due to periodic clogging of the separation column, uncertainties induced by the color of emitted light or unstable signal caused by the different optical transparencies of alcohol containers. Contemporary electronics may provide sustainable solutions to these problems by launching miniature metal–phenolic film-coated quartz crystal microbalances (MPF-QCMs) for selective detection of methanol in spirits; however, the effect of surface profile of the sorptive layer on the sensor response of these devices is unknown. We eliminate this knowledge gap by spin coating metal–phenolic films with different morphology, chemistry, wettability and thickness on the surface of six 5 MHz QCMs and subjecting them to the saturated vapor of methanol, ethanol, isopropanol, water, petroleum ether and ammonium hydroxide. The execution of over hundred experiments shows that the MPF-QCMs discriminate the chemical analytes in a repeatable and reproducible manner depending on their molecular size and acidity, and the morphochemical peculiarities of the solid surface, facilitating the registration of methanol fractions up to three orders of magnitude below the admissible concentrations in spirits. Our results provide scientific advance that has potential to address the global challenge related to the consumption of denatured alcohol.
1. Introduction
A major challenge in alcohol production is the continuous monitoring of methanol fraction, whose inadvertent inhalation, ingestion or skin penetration can lead to fatal injuries.1 This necessitates the need to limit the maximum quantity of methanol residues in food products to 10 mg kg−1 but not to more than 1.5 mg kg−1 in foods comprising extracts from aromatic plants, serving as flavorings.2 In spirits, the maximum permissible methanol concentration is within 0.8 mg per 80 mg of ethanol, according to EU regulations.3Despite the significant practical relevance of alcohol, its improper industrial and/or domestic distillation for recreational purposes contributes to the occurrence of numerous accidents caused by the excessive methanol content in the beverage.1 To date, the authentication of alcohols is performed using gas or liquid chromatography, nuclear magnetic resonance spectroscopy or ionization spectrometry that require transportation of the samples to licensed laboratories.4 In this way, receiving timely information (point-of-use) about the quality of alcoholic drinks is impeded, purely due to logistical reasons. Since the initial manifestations of methanol intoxication are nonspecific,1 the lack of reliable data about the chemical content of the beverage can delay the diagnosis and the provision of specialized medical assistance. In regions with ban on the alcohol consumption, the fear of punishment stimulates the prosperity of “black market” and increases the risk of poisoning due to the absence of effective control measures.5 Therefore, improving the quality of life, one of the societal challenges described in the Horizon Europe programme and the National Strategy for the Development of Scientific Research in Republic of Bulgaria 2017–2030, goes through the invention of new technologies enabling the out-of-lab analysis of various alcohol-containing products.
A convenient method to identify methanol in spirits without sending the sample to a laboratory is to soak a slice of potato in the alcohol, whose pink coloration will be a clear indication for the presence of methyl groups, since they interact with the pink pigmented facultative methylotrophs intrinsic to the terrestrial plants.6 This approach is facile, but provides qualitative information and knowing that any properly distilled spirit contains methanol in safe concentrations, depending on the raw fermenting material,7 the user might be misled by the outcome.
The recent scientific achievements in engineering enable the development of several cutting-edge portable sensors for alcohol analysis based on chemoresistive detectors with a separation column8–10 or nematic liquid crystals with a textile grid attached to a plexiglass wafer.11 The different retention times of individual alcohol fractions and the changes in the color and intensity of the emitted light ensure the required high sensitivity and resolution of these devices. Their industrial applicability is not proven yet, probably due to the slow recovery of the signal (∼27 min for ethanol9), the possible clogging of the separation column or the subjectiveness of readings due to the light's color. The portable Raman spectrometers are reliable alternative for analyzing the beverages by juxtaposing the spectra of reference and counterfeit alcohols.4,12 However, the darker alcohol storage containers attenuate the signal and lower the signal-to-noise ratio,12 which along with the relatively high price, questions the practicality of spectrometers. Other options for methanol detection rely on the electrical, immune, optical or microwave response of the sensor elements,13–16 but the high working temperature (75 °C (ref. 13)), the intricacy of optical equipment15 and the involvement of biomarkers and data processing/calibration algorithms14,16 imply the necessity of research facilities – a major obstacle for future commercialization.
The aforementioned shortcomings are potentially surmountable using miniature piezoelectric resonators, known as quartz crystal microbalances (QCMs), because their oscillation frequency decreases linearly with the amount of adsorbed/absorbed alcohol vapor17–21 if it does not exceed 2% of the crystal's mass.22,23 This feature makes the QCMs a highly-desirable tool for rapid (within seconds) and selective discrimination of low methanol concentrations in alcoholic drinks, especially if the active electrode area is coated with a metal–phenolic film eliminating the cross-sensitivity to humidity and chemical compounds such as ammonium hydroxide and petroleum ether.24 Additional advantage is the operation of this piezoresonance sensor under equilibrium vapor pressure conditions, avoiding the stochastic alterations of vapor concentration and the use of flow meters, valves and connecting pipes. This, along with the excellent long-term stability of the QCM, is a prerequisite for incorporating the measuring device in a stand-alone instrument for point-of-use analysis in family homes, nightclubs and/or drinking establishments.24 The results so far represent an early phase in solving a substantial global problem related to the complete prevention of counterfeit alcohol poisoning and the success of this endeavor demands further clarification of all parameters influencing the gas sensitivity of metal–phenolic film-coated QCM (MPF-QCM).
This research aims to disseminate pioneering findings on the effect of morphology, chemistry, wettability and thickness of the sorptive coating on the resonance response of MPF-QCMs upon methanol detection – a knowledge that is still missing in the scientific literature, but being pivotal for the optimization of the sensor's sensitivity and resolution, while suppressing the undesired impact of ambient gases, humidity and temperature.25–27
2. Materials and methods
2.1. Materials
Ethanol (96 wt%), methanol (99.5 wt%), isopropyl alcohol (99.8 wt%), ammonium hydroxide (25 wt%), petroleum ether (CAS number 8032-32-4), iron(III) chloride hexahydrate (FeCl3·6H2O) and phenol (99 wt% C6H5OH) were delivered by Valerus Ltd. (Sofia, Bulgaria). AT-cut unpolished quartz resonators with 25.4 mm diameter, circular gold electrode structure and 5 MHz fundamental frequency were purchased from Piezoquartz Ltd. (Sofia, Bulgaria).2.2. Fabrication of metal–phenolic coatings with distinct physicochemical features
Metal–phenolic films with different physicochemical profile were spin coated on six unpolished 5 MHz QCMs, divided into three groups of two resonators, by modifying the technical protocol described in ref. 24. Initially, 8.3 g phenol and 91.2 g FeCl3·6H2O were dissolved in two beakers containing 100 mL distilled water and 10 mL from each saturated solution were placed in a 50 mL reagent bottle with screw cap (i.e., FeCl3·6H2O × C6H5OH = 9.12 × 0.83 g). In two additional reagent bottles were inserted mixtures of 5 mL FeCl3·6H2O/15 mL C6H5OH and 15 mL FeCl3·6H2O/5 mL C6H5OH (i.e., FeCl3·6H2O × C6H5OH = 4.56 × 1.25 g and FeCl3·6H2O × C6H5OH = 27.36 × 0.415 g). After 5 min sonication of the three suspensions in an ultrasonic bath, ∼0.3 mL from each suspension (i.e., FeCl3·6H2O × C6H5OH = 9.12 × 0.83 g; 4.56 × 1.25 g and 27.36 × 0.415 g) were evenly distributed on the upper electrode of single 5 MHz QCMs from the three groups, followed by spinning at gradual acceleration from 0–1000 rpm for 3–4 s, 1000–2000 rpm for 3–4 s and ending at 2000 rpm for 480 s. The same procedure was applied to the remaining three QCMs, but after one month in order to verify the reproducibility of fabrication process (i.e., whether an established set of procedures, but used at different times, will generate a pair of QCMs with equal surface profile and close detection efficiency). All samples were dried at room temperature (Tair ∼ 21 ± 2 °C; RHair ∼ 45 ± 10%) for 72 hours, finishing with six piezoresonance sensors, labelled as QCM 1![[thin space (1/6-em)]](https://www.rsc.org/images/entities/char_2009.gif) :1, QCM 1:1_R, QCM 1:3, QCM 1:3_R, QCM 3:1 and QCM 3:1_R, where the numbers denote the ferric chloride–phenol volume ratio in the stock solution, while the letter R means “reproduced”.
:1, QCM 1:1_R, QCM 1:3, QCM 1:3_R, QCM 3:1 and QCM 3:1_R, where the numbers denote the ferric chloride–phenol volume ratio in the stock solution, while the letter R means “reproduced”.
Unpolished resonators were used, because in our previous research the coating was deposited nearly as a monolayer due to the polished quartz surface,24 but the objective herein was to increase the film thickness by embedding iron phenolate molecules in the surface pits. The distinct iron(III) chloride hexahydrate and phenol ratios were selected based on the hypothesis that the percentage of F–O and F–OH groups governs the sensor response.24
2.3. Surface characterization
The morphology, surface chemistry and wettability of the metal–phenolic films were examined via scanning electron microscopy (SEM), energy dispersive spectroscopy (EDS), X-ray photoelectron spectroscopy (XPS) and contact angle measurements. Top-view SEM images were recorded through a LYRA3 GM field emission scanning electron microscope (TESCAN, Brno Czech Republic) at 10–25k× magnifications. Elemental analysis was performed with an energy dispersive spectrometer Bruker at 126 keV with an EDAX detector having 1.3 mm2 active area. X-ray photoelectron lines were recorded using an ESCALAB MK2 spectrometer using achromatic AlKα radiation at 1486.6 eV. The photoelectron core levels were corrected by subtracting a Shirley-type background and quantified by the peak area and Scofield's photoionization cross-sections. The chemical states were defined by deconvoluting the high-resolution spectra via XPSPEAK41 software. The wetting state of metal–phenolic films was determined by measuring the static contact angles of 10 μL distilled water droplets via an optical system OCA 15EC (DataPhysics, Germany).2.4. Proof-of-concept assays
The measurement platform for methanol detection matches the one introduced elsewhere (see Fig. 1 in ref. 24), but briefly, one of the 5 MHz MPF-QCMs was mounted in the crystal holder of a QCM200 analytical instrument (SRS, USA) and when the resonance response in air was stabilized (Δf ∼ ±1 Hz and ΔR ∼ ±1 Ω), the holder was firmly fixed in the center of a sheet-iron lid and the active electrode surface (i.e., the upper part) was exposed to the saturated vapor of 100 mL methanol occupying a sterilized glass jar. The registered sensor signal was recorded continuously on a personal computer via a LabView Stand Alone Application (SRS, USA) until the values of resonance frequency and dynamic resistance overlapped with the short-term stability of the QCM. This procedure was repeated in three experimental cycles for methanol and other compounds such as ethanol, isopropanol, water, ammonium hydroxide and petroleum ether by means of all six 5 MHz MPF-QCMs at constant ambient conditions (Tair = Tliquid ∼ 21 ± 2 °C; RHair ∼ 45 ± 10%). The concentrations of saturated vapor were calculated in ppm using the ideal gas law.24 | ||
| Fig. 1 Structure and morphology of three groups of two metal–phenolic films formed at the FeCl3·6H2O:C6H5OH volume ratios of (a–d) 1:1, (b–e) 1:3 and (c–f) 3:1. The inset images indicate the water contact angle on each surface. | ||
The selection of aforementioned chemicals was tailored to some real-life scenarios concerning the exploitation of sensor devices in practice, namely, assessing the quality of boozes in humid atmosphere or in air containing toxic ammonia gases (e.g., near country houses, where the presence of rotting agricultural slurry emitting ammonia is quite common) or traces of gasoline fumes (petroleum ether is a byproduct of the gasoline refining). Perhaps, the developed metal–phenolic films would have sorptive properties towards other compounds too, but this topic is out of the scope of the current study.
2.5. Statistical analysis
The reproducibility of sensor performance of the three pairs 5 MHz MPF-QCMs (e.g., to what extent two QCMs coated with the same adsorbent will yield equal response to fixed concentrations of a certain chemical analyte) was evaluated by calculating the coefficient of variation (CV) – a dimensionless parameter determining the dispersion of data around the mean value. To do that, the frequency and resistance shifts of all pairs QCMs (e.g., QCM_1-1 and QCM_1-1_R), induced by each target gas molecules, were collected in Microsoft Excel sheets, the particular means μ and standard deviations σ were calculated via the computer software and the CV was expressed as CV = σ/μ.3. Results
3.1. Physicochemical profile and electrical characteristics of the 5 MHz MPF-QCMs
The morphology and surface wettability of the single-step assembled (i.e., simultaneous mixing of aqueous solutions of FeCl3·6H2O and C6H5OH) metal–phenolic films are shown in Fig. 1.The rapid one-step process promotes the incipiency of stable iron phenolate complexes and the spreading of uniform cross-linked coatings with placoid structure, identical to those obtained with tannic acid as a phenolic ligand.28 When the mixing occurs at the abundance of iron(III) chloride hexahydrate (Fig. 1c–f), the phenol molecules seem to chelate the metal ions in a way affecting their coordination geometry, leading to the formation of large micron-size cavities likely due to the depletion of adjacent hydroxyl groups of the phenol, acting as cross-linking sites for the FeIII ions.29 The similarity of morphological features in Fig. 1 is attributed to the physical appearance of unpolished sensor surfaces and the lack of alkali component in the mixture (i.e., NaOH). During the synthesis, the latter increases the pH and the hydroxyl groups of phenol remain unprotonated and negatively charged, generating electrostatic repulsive forces and aiding to the formation of solid aggregates with diverse shapes and dimensions.28
In terms of the wetting state, all coatings fall into the threshold range of equalized solid–liquid and solid–air interfacial tensions, yielding a water contact angle of θ ∼ 90 °.30 Increasing the phenol content in the stock solution slightly lowers the contact angle to θ ∼ 86° due to the availability of oxygen functional groups for hydrogen bonding to the water molecules. It should be noted that although hydrophobic or close to hydrophobic, these metal–phenolic films are more wettable than the one deposited on a polished resonator (θ – 102° (ref. 24)). This is due to the roughness of unpolished quartz crystals (Rrms ∼ 3 μm), since according to Wenzel's equation, the roughening of surfaces with θ ≤ 90° enhances their intrinsic tendency to wetting (the cosine term increases).30 This is not something negative, though, since the high roughness factor improves the gas sensitivity of QCMs due to the availability of a larger number of sorption sites, increasing the active sensing area and facilitating the “immobilization” of much more gas molecules than on a polished resonator.31
Quantitative evaluation of the elemental composition and chemical state of the metal–phenolic films is accomplished via EDS and XPS, the results of which are presented in Table 1 and Fig. 2–4. Carbon, oxygen, silicon chlorine, iron, chromium and gold are the chemical elements identified by the EDS analysis, where the chromium and gold are associated with the electrode configuration, while the iron, chlorine, carbon and oxygen indicate the formation of metal–organic frameworks. It can be noted that the atomic percentage of oxygen, chlorine and iron increases progressively from the films with FeCl3·6H2O:C6H5OH volume ratio 1:1 to those with 3:1 and this observation is also confirmed by the XPS scan survey (see Table 1 and Fig. 2). The recorded photoelectron spectra divulge the presence of iron phosphide at 711 eV, with a 2p peak splitting of ∼13 eV, and Cl2p peak due to chlorine.28,29,32,33
| Type of QCM | Chemical element (at%) | ||||||
|---|---|---|---|---|---|---|---|
| C | O | Si | Cl | Fe | Cr | Au | |
| QCM_1-1 | 13.2 | 51.1 | 27 | 0.2 | 0.6 | 1.4 | 6.5 |
| QCM_1-1_R | 16.6 | 49.1 | 24.4 | 0.4 | 1 | 1.2 | 6.8 |
| QCM_1-3 | 7.2 | 57.6 | 27.4 | 0.2 | 0.7 | 1.3 | 5.6 |
| QCM_1-3_R | 9.3 | 58.3 | 25.7 | 0.4 | 0.9 | 0.9 | 4.5 |
| QCM_3-1 | 3 | 66.7 | 20.7 | 1.4 | 3.2 | 0.8 | 4.2 |
| QCM_3-1_R | 3 | 61.8 | 28.5 | 0.7 | 1.8 | 0.8 | 3.4 |
 | ||
| Fig. 2 Photoelectron scan survey lines of three groups of two metal–phenolic film, formed at the FeCl3·6H2O:C6H5OH volume ratios of (a–d) 1:1, (b–e) 1:3 and (c–f) 3:1. | ||
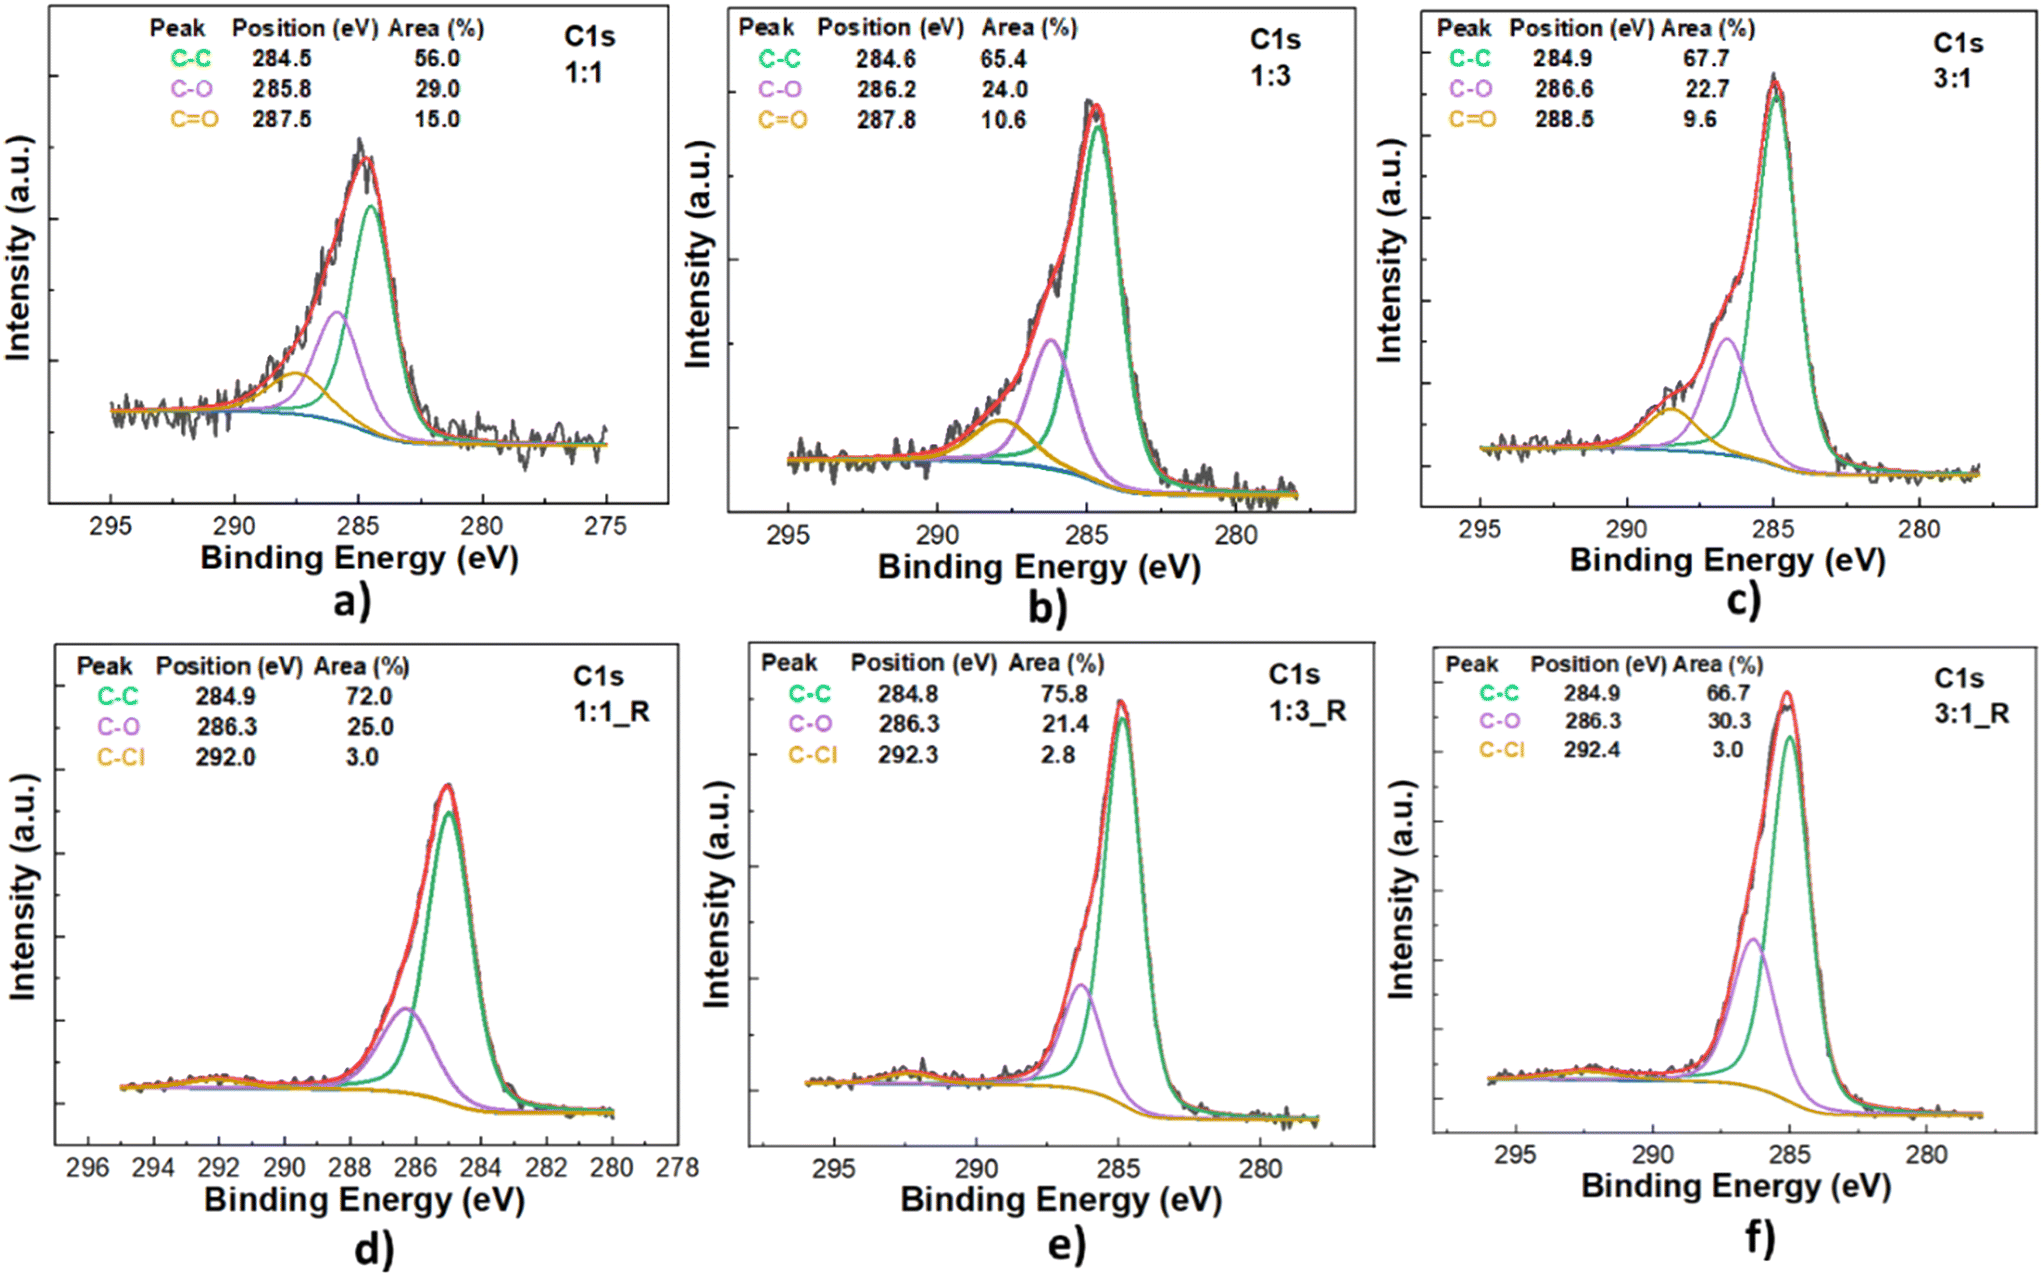 | ||
| Fig. 3 C1s photoelectron core level of three groups of two metal–phenolic films formed at the FeCl3·6H2O:C6H5OH volume ratios of (a–d) 1:1, (b–e) 1:3 and (c–f) 3:1. | ||
 | ||
| Fig. 4 O1s photoelectron core level of three groups of two metal–phenolic films formed at the FeCl3·6H2O:C6H5OH volume ratios of (a–d) 1:1, (b–e) 1:3 and (c–f) 3:1. | ||
From the deconvoluted C1s and O1s core levels, the binding energy of ∼285 eV is ascribed to the hydrocarbon benzene rings of the phenyl groups, while the peaks arising at ∼529–530 eV and ∼533 eV denote the formation of iron oxide and iron hydroxide complexes.28,33 In the C1s region, the peak at ∼292 eV shows the presence of carbon tetrachloride molecules, while the binding energies at ∼531.5–532 eV in the O1s spectrum suggest coordination between the carbonyl oxygen groups and FeII (ref. 34) or emergence of quinone species derived from reactive aromatic compounds with electron-donating substituents such as phenols.35
There are minor, but visible discrepancies in the C1s and O1s lines for the QCM pairs obtained at specific FeCl3·6H2O:C6H5OH volume ratios (juxtapose Fig. 3a–d, b–e and c–f and 4a–d, b–e and c–f). The carbonyl groups are missing in the C1s of reproduced films, while in O1s appear at slightly different binding energies, which is unexpectable, but can be explained by the deviations in relative humidity within the film deposition period (see section 2.2), increasing or decreasing the oxidation of quinones, the intensity of C![[double bond, length as m-dash]](https://www.rsc.org/images/entities/char_e001.gif) O peak and its position.35
O peak and its position.35
The metal–phenolic films retain the electrical behavior of QCMs in air, as shown in Table 2.
| Type of QCM | Status | f (MHz) | R (Ω) | Δf (Hz) | ΔR (Ω) | d (nm) |
|---|---|---|---|---|---|---|
| QCM_1-1 | Before | 5.083471 | 45 | 1354 | 1 | 80 |
| After film deposition | 5.082117 | 44 | ||||
| QCM_1-1_R | Before | 5.082353 | 41 | 1129 | 0 | 67 |
| After film deposition | 5.081224 | 41 | ||||
| QCM_1-3 | Before | 5.111441 | 48 | 1194 | 5 | 70 |
| After film deposition | 5.110247 | 53 | ||||
| QCM_1-3_R | Before | 5.110001 | 38 | 818 | 1 | 48 |
| After film deposition | 5.109183 | 37 | ||||
| QCM_3-1 | Before | 5.083721 | 50 | 328 | 0 | 19 |
| After film deposition | 5.083393 | 50 | ||||
| QCM_3-1_R | Before | 5.095900 | 47 | 2733 | 1 | 161 |
| After film deposition | 5.093167 | 48 |
The coatings' deposition downshifts the resonance frequency with 328–2733 Hz, which according to the Sauerbrey equation corresponds to film thicknesses d = 19–161 nm.22 These values are higher than those at full immersion of the solid substrates in metal–phenolic suspensions (e.g., ∼10 nm),29 a result attributed to the roughened quartz surfaces. Despite that, the dynamic resistance remains unaltered, meaning that the films are “acoustically rigid” and the wave energy dissipation and the mass loading associated with the ferric chloride–phenol compounds are negligible.23
3.2. Sensor response of the as-prepared 5 MHz MPF-QCMs
The outcome from the experiments concerning the sensor performance of 5 MHz MPF-QCMs with distinct surface profile towards methanol and other interfering chemical analytes is illustrated in Fig. 5–7.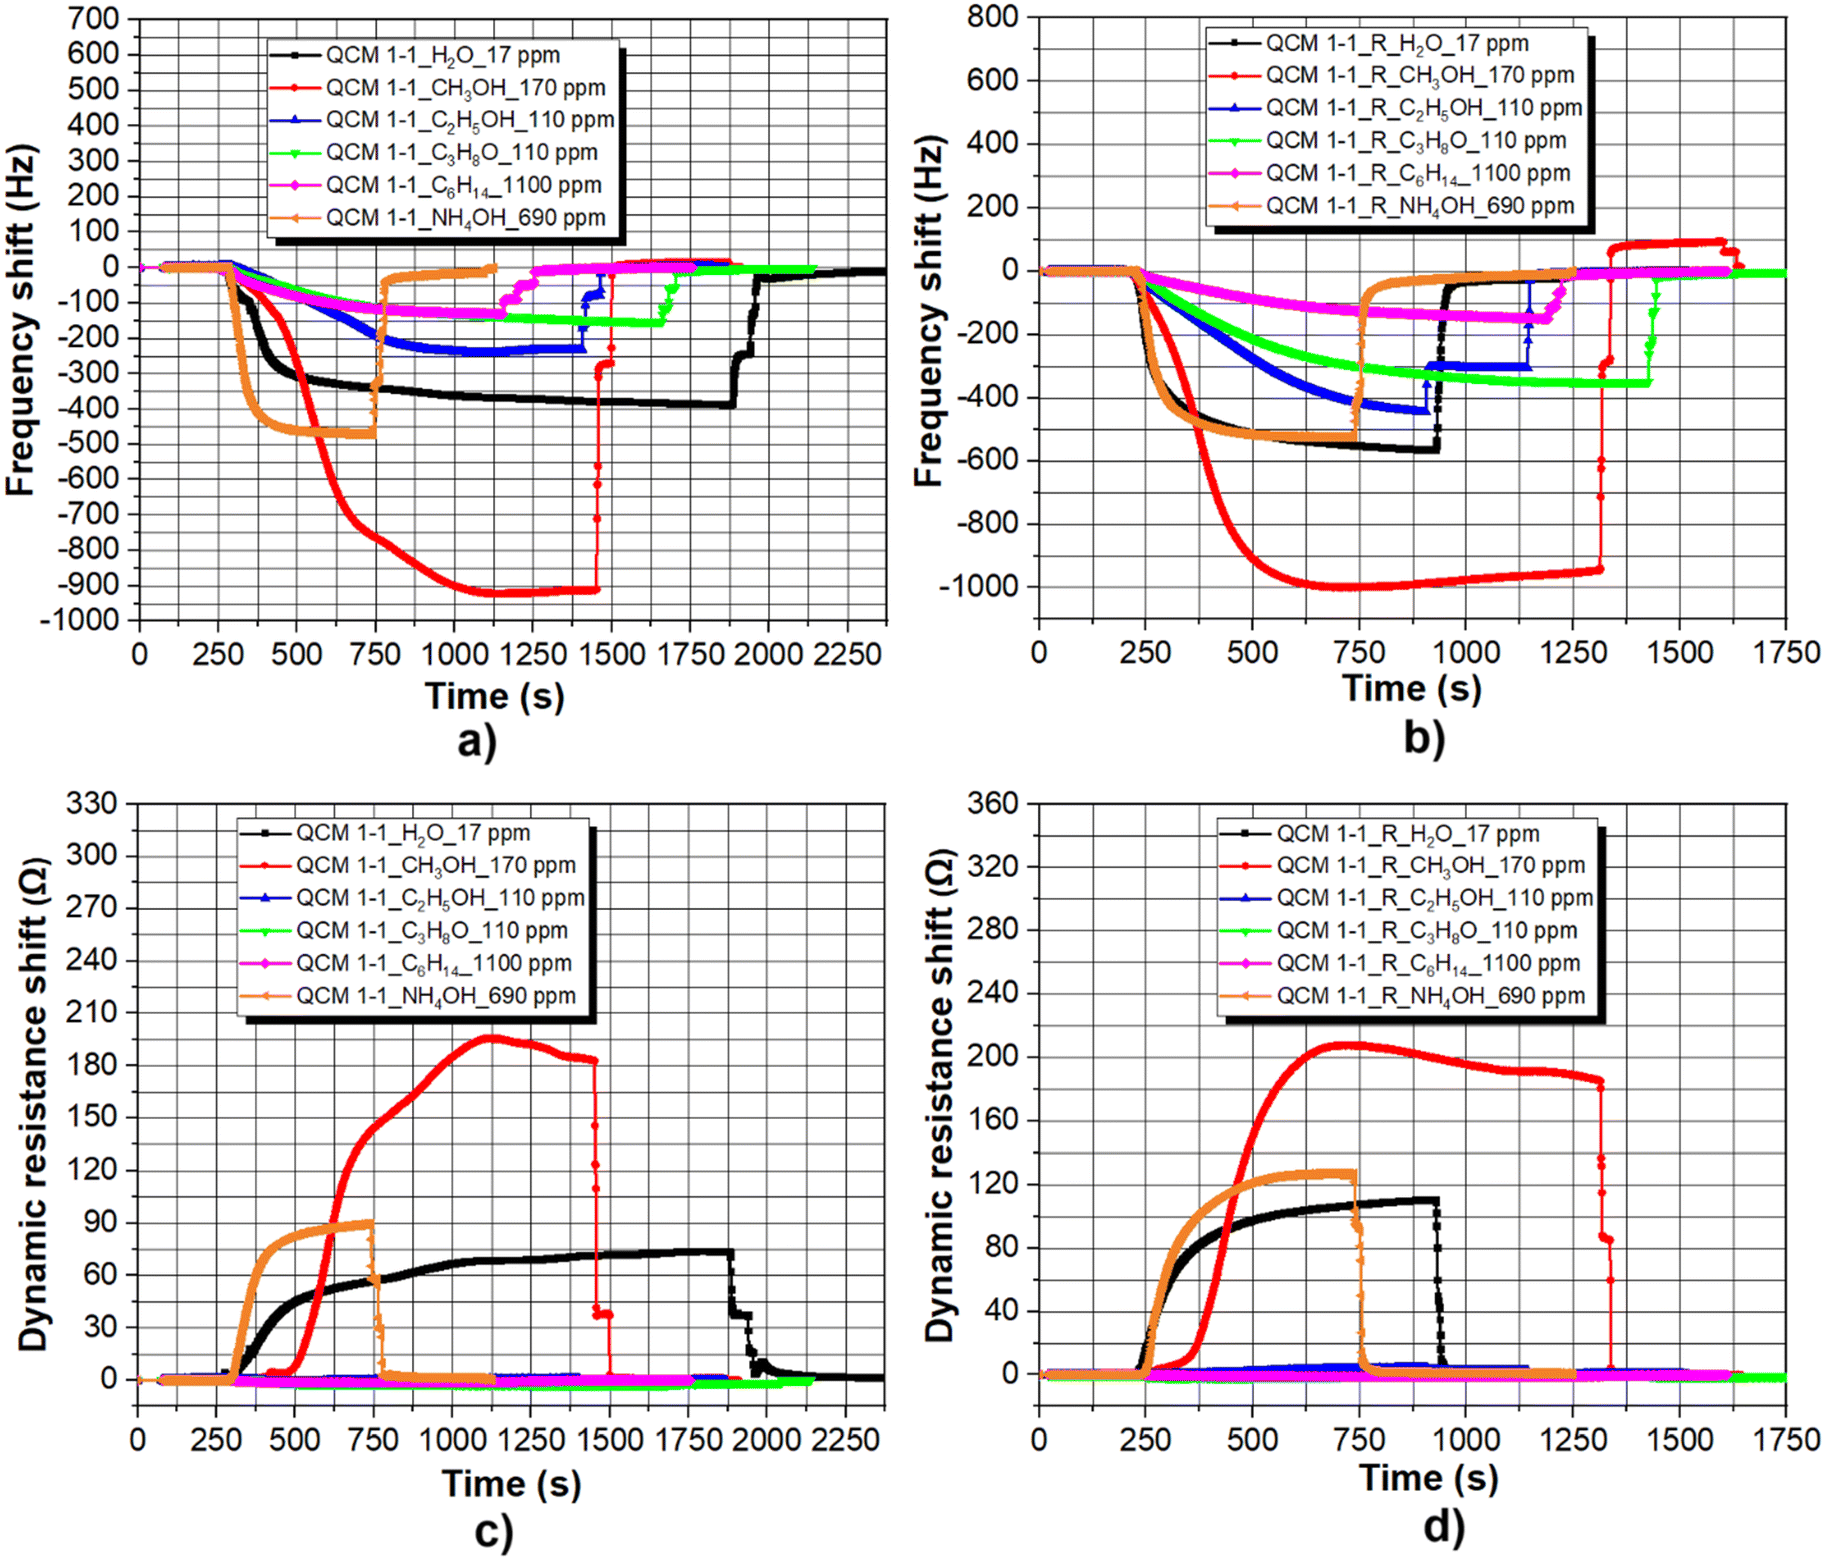 | ||
| Fig. 5 Real-time resonance frequency and dynamic resistance shifts of (a–c) 5 MHz MPF-QCM_1-1 and (b–d) 5 MHz MPF-QCM_1-1_R. The term “1-1” represents the volume ratio of FeCl3·6H2O and C6H5OH in the stock solution, while the letter “R” means reproduced. All graphs are built upon three independent measurements, which are incorporated as Fig. S4–S15 in the ESI.† | ||
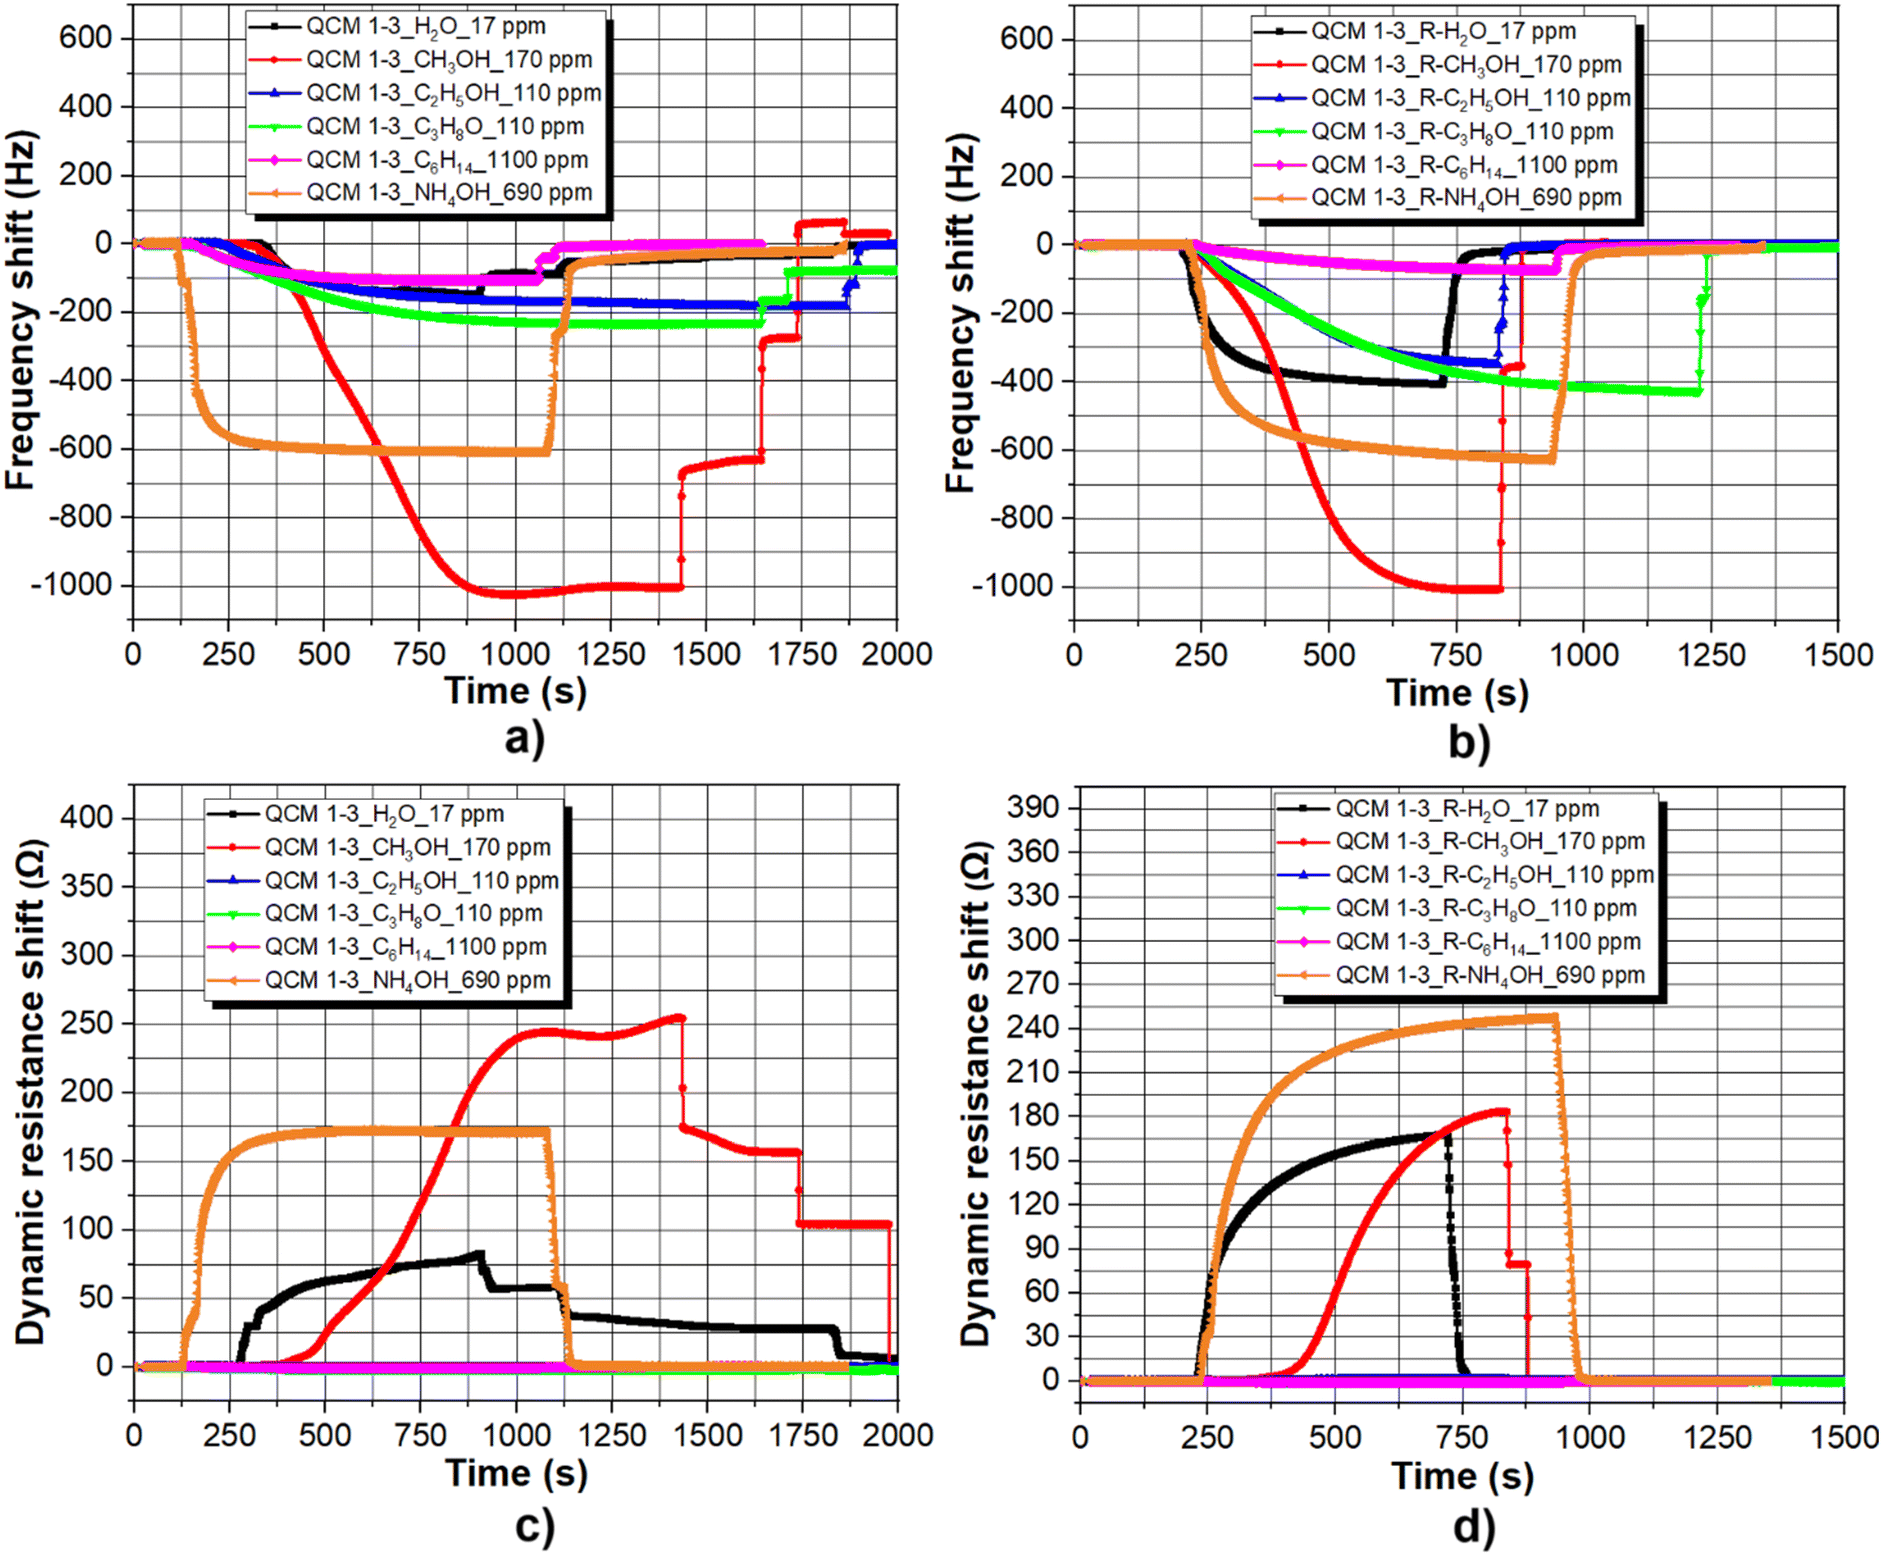 | ||
| Fig. 6 Real-time resonance frequency and dynamic resistance shifts of (a–c) 5 MHz MPF-QCM_1-3 and (b–d) 5 MHz MPF-QCM_1-3_R. The term “1-3” represents the volume ratio of FeCl3·6H2O and C6H5OH in the stock solution, while the letter “R” means reproduced. All graphs are built upon three independent measurements, which are incorporated as Fig. S16–S27 in the ESI.† | ||
 | ||
| Fig. 7 Real-time resonance frequency and dynamic resistance shifts of (a–c) 5 MHz MPF-QCM_3-1 and (b–d) 5 MHz MPF-QCM_3-1_R. The term “3-1” represents the volume ratio of FeCl3·6H2O and C6H5OH in the stock solution, while the letter “R” means reproduced. All graphs are built upon three independent measurements, which are incorporated as Fig. S28–S39 in the ESI.† | ||
Attentively examining the evolution of sensor signal in time, upon sorption–desorption of the particular compound, reveals several clear tendencies. First, regardless of the surface chemistry of metal–phenolic films, the six QCMs detect the methanol vapor preferentially by inducing frequency response within 917–1035 Hz, which is between 15–40 times higher sensitivity compared to that of the polyvinyl acetate nanofiber- and MIL-101 (Cr)-coated counterparts.18,19 Second, the resonance frequency shifts of QCMs coated with metal–phenolic films from stock solutions with FeCl3·6H2O:C6H5OH volume ratio of 1:1 and 3:1 are inversely proportional to the gas-phase acidity and molecular weight of the tested alcohols (i.e., gas-phase acidity and molecular weight order is methanol < ethanol < isopropanol36), in contrast to the resonators coated with films obtained from a solution with volume ratio of 1:3 or such deposited as a monolayer (see Fig. 5a and b, 6a and b and 7a and b in this work, as well as Fig. 4 in ref. 24). Third, two nominally identical piezoresonance devices (e.g., QCM_1-3/QCM_1-3_R) trigger almost the same signal to methanol, demonstrating sufficient reproducibility in terms of gas sensitivity. Fourth, the values of dynamic resistance remain unaltered during the sorption of ethanol, isopropanol and petroleum ether, but increase substantially (up to 350 Ω) upon detection of water, methanol and ammonium hydroxide, suggesting two types of sorption mechanisms – i.e., surface attachment or bulk penetration of the gas molecules. The execution of 108 independent experiments (i.e., six QCMs detect six analytes in three repetitions) shows that the individual sensors repeatedly yield similar responses to a given analyte under fixed concentrations and operating conditions, with maximum error below 5% in many of the cases (see Fig. S4–S39 in the ESI†). Although some of the results seem to have poor reproducibility with significant variations among the repeated measurements (e.g., see Fig. S4, S5, S11b, S15b, S16, S17b and S21 in the ESI†), in 13 out of 36 compared datasets the CV is low (∼0–0.2), in another 14 is moderate (CV ∼0.2–0.5) and only in 9 datasets CV >0.5, indicating excellent to fair consistency of the readings (the full statistical analysis is available as a supporting Microsoft Excel file).
A closer overview of the graphs in Fig. 5–7 hints at variations in the response-recovery time and cross-sensitivity of the 5 MHz MPF-QCMs, so for more comprehensive analysis, these data are summarized as column charts in Fig. 8–10. It can be concluded that the surface profile of piezoresonance sensors determines their selectivity and those coated with a metal–phenolic film from a stock solution with volume ratio 1:3 suppress most efficiently the sorption of interfering compounds at the expense of methanol (see Fig. 8). The response time seems to be governed by the type of analyte and for the tested alcohols, it increases proportionally to the alkyl chain length (see Fig. 9). There is no unambiguous correlation between the vapor concentration and the time for baseline recovery, but for methanol, the latter happens within ∼120–220 s (see Fig. 10), i.e., ∼1.4–2.5 times faster than the hand-held alcohol detector.9
 | ||
| Fig. 8 Average frequency shifts induced by six 5 MHz MPF-QCMs upon sorption of saturated vapor of water, petroleum ether, ammonium hydroxide, methanol, ethanol and isopropanol. The column charts are based on three independent measurements. | ||
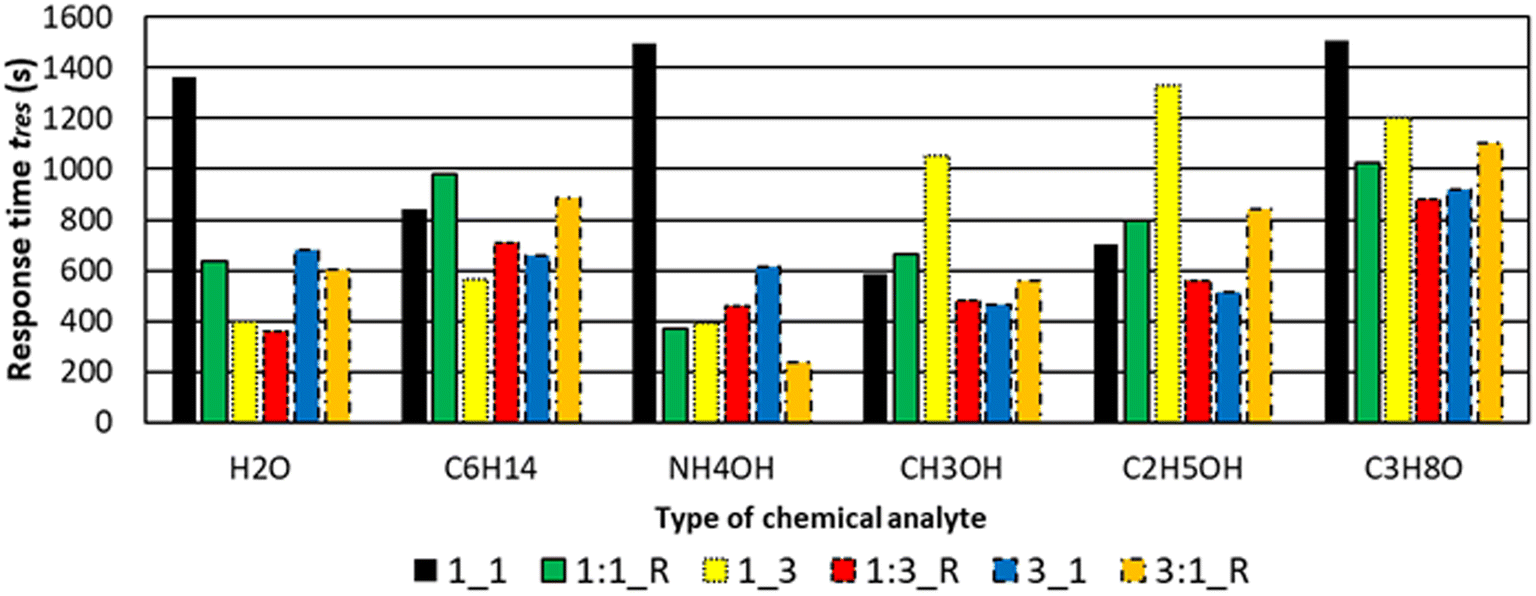 | ||
| Fig. 9 Average response times of six 5 MHz MPF-QCMs upon sorption of saturated vapor of water, petroleum ether, ammonium hydroxide, methanol, ethanol and isopropanol. The column charts are based on three independent measurements. | ||
 | ||
| Fig. 10 Average recovery times of six 5 MHz MPF-QCMs upon desorption of saturated vapor of water, petroleum ether, ammonium hydroxide, methanol, ethanol and isopropanol. The column charts are based on three independent measurements. | ||
4. Discussion
To interpret the differences in sensor performance and selectivity of 5 MHz MPF-QCMs, one has to consider as a starting point the chemical nature of metal–phenolic complexes and alcohols. Phenol consists of one hydroxyl group bonded to an aromatic phenyl ring with a hexagonal planar structure and delocalized π-electrons, associated with the sp2 hybridization of carbon atoms.37 Two orbitals of the oxygen atom from the hydroxyl group have two unbonded electron pairs conjugated to the aromatic system, leading to partial transfer of negative charge to the ring, delocalization of the charge and increased acidity.37 The inclusion of halogens (e.g., chlorine substituents) enhances the hydrophobicity of aromatic ring, alters its electron density and decreases the water solubility of phenol, which is the main reason why most 5 MHz MPF-QCMs have water contact angles θ ∼ 90° (see Fig. 1).On the other hand, the alcohols are a class of organic compounds characterized by a hydroxyl group attached to a carbon atom of a hydrocarbon (alkyl) chain. The latter is generally considered as a substituent donating electrons via a positive inductive effect (local increase in the electron density of neighboring atoms forming an electric dipole in the bond) or hyperconjugation, but the newest discoveries in organic chemistry demonstrate electron-withdrawing ability of alkyl groups with respect to hydrogen.38 The extent of electron release or acceptance by the alkyl chain depends on the magnitude of electronegativity difference between the substituent and the site to which it is bonded,39 and in alcohols, the larger the non-polar tail, the weaker the electron-donating affinity.36
Referring to this knowledge, the largest frequency shifts and the shortest response times of all sensors to methanol, compared to ethanol and isopropanol (see Fig. 8 and 9), originate from the easier electron release by the hydroxyl group of methanol and the effective stabilization of the negatively charged iron oxide, enhancing the sorption. Such an explanation is in perfect agreement with the reported inverse proportionality among the alkyl chain length and alcohol sorption40 (the longer the hydrophobic tail, the weaker the adsorption), but it is unclear how at equal concentrations of 110 ppm, the heavier isopropanol triggers weaker or commensurable sensor signal compared to ethanol (see Fig. 8).
The rationale of this intriguing result is related to the chemistry and size of the adsorbate, since the rate of mass transfer is determined by the diffusion of organic molecules in the adsorbent, where the smaller ones occupy all pores of the solid substrate, while the bigger molecules are unable to penetrate the small cavities and interact weakly with the surface due to steric hindrance (declined speed of the chemical reactions caused by the size of substituents in a molecule).37 From that point-of-view, the molecular size of analytes involved in our research is as follows: methanol – 0.38 nm, ethanol – 0.44 nm, isopropanol – 0.49 nm, ammonium hydroxide – 0.33 nm, petroleum ether – 0.25 nm and water – 0.27 nm (the data are taken from Google). Since the wave energy losses in QCMs are determined by the dynamic resistance shifts,23 the increased values of this parameter upon detection of methanol, ammonium hydroxide and water vapor serve as evidence for the occurrence of bulk sorption and profound changes in the mass of metal–phenolic films.22 For the larger ethanol and isopropanol molecules, dominating is the surface sorption and that is why the resistance remains unaltered (see Fig. 5–7, as well as Fig. S4–S39 in the ESI†). This argument can be criticized, because petroleum ether has the smallest size, but meanwhile does not affect the electrical characteristics of QCMs that much (Δf ∼ 65–200 Hz; ΔR ∼ 1–4 Ω), which however, can be assigned to its non-polarity determining only hydrophobic and van der Waals attraction forces with the adsorbent.24
It is of practical interest to elucidate why the six 5 MHz MPF-QCMs provide different sensitivity to methanol and why one of the sensors (i.e., QCM 3-1_R) is almost not selective towards the target analytes (see Fig. 8). Besides the morphology and chemistry of the sensing interface, the role of film thickness is decisive, because there is an optimal thickness range providing maximum frequency response to fractional changes in the absorbed mass.41 When the metal–phenolic layer is moderately thick (e.g., 50–70 nm) and contains large amount of ferric functional groups (see Fig. 4b–e), the methanol detection is enhanced and the sorption of other compounds is hindered (see Fig. 8). If the surface chemistry is preserved, but the coating is too thin/thick and porous (as in the case of QCM 3-1_R), the sensitivity to methanol is slightly higher, but the selectivity is lost.
To summarize the discussion, the sensor capabilities of 5 MHz MPF-QCMs are controlled by the morphochemical nature of the adsorbent. If the coating is hydrophobic, moderately thick, chemically active towards the desired analyte and has custom porosity, it will become a “molecular sieve” interacting preferentially with gaseous species possessing appropriate chemistry and size, while the others will be repelled (e.g., the water vapor and petroleum ether) or weakly adsorbed. The film, herein, acts also as a waveguide confining or dissipating the oscillations based on its thickness (very thin films do not confine enough energy, while very thick ones dissipate it41). Potential improvements in the methanol detection are accomplished by adjusting the morphology of metal–phenolic complexes by altering the sequence of iron(III) chloride hexahydrate and phenol mixing, via the addition of sodium hydroxide28 or using QCMs with different surface roughness. Besides, it would be wise to control the residential time of stock solution on the quartz crystal before spinning, because this may extend or shorten the duration of chemical processes occurring on the gold electrode, which could affect the film thickness.
Finally, in most experiments, the sensor signal induced by 690 ppm concentration of ammonium hydroxide is ∼62% of that caused by 170 ppm methanol (i.e., average ΔfNH4OH/ΔfCH3OH ∼ 602/976 Hz), which might be a shortcoming. Even if the 5 MHz MPF-QCMs operate in such an environment (highly unlikely scenario), the distinguishable useful signal will be 374 Hz/170 ppm = 2.2 Hz ppm−1. Hence, a short-term stability of ±1 Hz s−1 and a signal-to-noise ratio 3:1 (ref. 24) yield a sensor resolution of ∼1.4 ppm s−1, which is ∼0.12 μg CH3OH per second or discrimination of hazardous alcohol fractions up to three orders of magnitude below the tolerable concentrations in spirits (0.8 mg/80 mg).3
5. Future work
Defining correctly the methanol content in a variety of alcoholic drinks (e.g., beer, wine, liquors) would be difficult without studying the effect of ambient humidity on the gas sensitivity of 5 MHz MPF-QCMs. At the moment, it is proven that these devices distinguish the methanol fraction in composite mixtures (e.g., in whiskey containing water, ethanol, esters, aldehydes, ketones, etc.),24 but how the inclusion of a few denaturants (e.g., isopropanol, trans-anethole, denatonium benzoate and sucrose) will affect the sensor signal is still unknown. Relevant experiments on the detection of ethanol/methanol, ethanol/isopropanol or ethanol/methanol/isopropanol mixtures with different volume proportions must be carried out with the aim of validating or rejecting the molecular size-dependent mechanism of alcohol sorption. These tasks are planned as a future work delivering the objectives of research project KP-06-H77/3, funded by the Bulgarian National Science Fund.6. Conclusions
The preparation of three stock solutions of FeCl3·6H2O:C6H5OH, with a volume ratio 1:1, 1:3 and 3:1, enabled the deposition of nm-thick hydrophobic metal–phenolic films with flaky structure on the upper electrodes of six unpolished 5 MHz QCMs without degrading their electrical characteristics in air. The exposure of these piezoresonance devices to the saturated vapor of short alkyl chain alcohols, water, ammonium hydroxide and petroleum ether revealed selective sorption of methanol over the other chemical analytes. It was found that the moderately thick sorptive layers (i.e., 50–70 nm) accommodating large amounts of iron phenolate complexes endow the QCMs with ∼15–40 times higher sensitivity compared to similar sensors coated with MIL-101 (Cr) or polyvinyl acetate nanofibers.18,19 Even when the frequency response induced by the interfering gases (e.g. 690 ppm NH4OH) reached ∼60% of the useful signal, the quartz resonators demonstrated potential to discriminate methanol vapor with a resolution of ∼1.4 ppm s−1. The outcome of this research opens real possibilities for future integration of the MPF-QCMs in streamlined and economically expedient sensor systems for in situ assessment of the quality of distilled beverages.
Data availability
All data needed to evaluate the conclusions in this paper are presented duly. Additional data related to this research may be requested from the authors.Author contributions
Dr. Esmeryan conceived the idea to study how the physicochemical profile of metal–phenolic film affects the QCM's sensor response towards short alkyl chain alcohols and interfering chemical compounds. He organized and supervised the research, processed some of the raw data, contrived the scientific concept of the article and wrote its first and final versions. Dr. Lazarov performed the experiments and created the sensor response graphs. Both authors approved the scientific content of the manuscript prior to submission.Conflicts of interest
The authors declare that they have not known competing financial interests or personal relationships that could have appeared to influence the work reported in this paper.Acknowledgements
This research was performed thanks to the financial support of Bulgarian National Science Fund under grant No. KP-06-H77/3/28.11.2023.References
- Z. Nekoukar, Z. Zakariaei, F. Taghizadeh, F. Musavi, E. S. Banimostafavi, A. Sharifpour, N. E. Ghuchi, M. Fakhar, R. Tabaripour and S. Safanavaei, Methanol poisoning as a new world challenge: A review, Ann. Med. Surg., 2021, 66, 102445 CrossRef PubMed.
- A. Plaskova and J. Mlcek, New insights of the application of water or ethanol-water plant extract rich in active compounds in food, Front. Nutr., 2023, 10, 1118761 CrossRef PubMed.
- A. Paine and A. D. Davan, Defining a tolerable concentration of methanol in alcoholic drinks, Hum. Exp. Toxicol., 2001, 20, 563–568 CrossRef CAS PubMed.
- D. I. Ellis, H. Muhamadali, Y. Xu, R. Eccles, I. Goodall and R. Goodacre, Rapid through-container detection of fake spirits and methanol quantification with handheld Raman spectroscopy, Analyst, 2019, 144, 324–330 RSC.
- N. Zamani, A. Rafizadeh, H. Hassanian-Moghaddam, A. Akhavan-Tavakoli, M. Ghorbani-Samin, M. Akhgari and S. Shariati, Evaluation of methanol content of illegal beverages using GC and an easier modified chromotropic acid method; a cross sectional study, Subst. Abuse Treat. Prev. Policy, 2019, 14, 56 CrossRef PubMed.
- P. Mondal, D. Ghosh, M. Seth and S. K. Mukhopadhyay, Bioprospects of pink pigmented facultative methylotrophs (PPFMs), Arab Gulf J. Sci. Res., 2024, 42, 1849–1863 Search PubMed.
- T. Muhollari, S. Szucs, R. Adany, J. Sandor, M. McKee and L. Pal, Methanol in unrecorded fruit spirits. Does it pose a health risk to consumers in the European Union? A probabilistic toxicological approach, Toxicol. Lett., 2022, 357, 43–56 CrossRef CAS PubMed.
- A. T. Güntner, L. Magro, J. van den Broek and S. E. Pratsinis, Detecting methanol in hand sanitizers, iScience, 2021, 24, 102050 CrossRef PubMed.
- J. van den Broek, S. Abegg, S. E. Pratsinis and A. T. Günter, Highly selective detection of methanol over ethanol by a handheld gas sensor, Nat. Commun., 2019, 10, 4220 CrossRef CAS PubMed.
- N. J. Pineau, L. Magro, J. van den Broek, A. T. Günter and S. E. Pratsinis, Spirit distillation: Monitoring methanol formation with a hand-held device, ACS Food Sci. Technol., 2021, 1, 839–844 CrossRef CAS.
- M. G. Shemirani, F. Habibimoghaddam, M. Mohammadimasoudi, M. Esmailpour and A. Goudarzi, Rapid and label-free methanol identification in alcoholic beverages utilizing a textile grid impregnated with chiral nematic liquid crystals, ACS Omega, 2022, 7, 37546–37554 CrossRef CAS PubMed.
- D. I. Ellis, R. Eccles, Y. Xu, J. Griffen and H. Muhamadali, et al., Through-container, extremely low concentration detection of multiple chemical markers of counterfeit alcohol using a handheld SORS device, Sci. Rep., 2017, 7, 12082 CrossRef PubMed.
- B. Bhowmik and P. Bhattacharyya, Highly stable low temperature alcohol sensor based on hydrothermally grown tetragonal titania nanorods, RSC Adv., 2015, 5, 82159–82168 RSC.
- F. Alam, A. Jalal and N. Pala, Selective detection of alcohol through ethyl-glucuronide immunosensor based on 2D zinc oxide nanostructures, IEEE Sens. J., 2019, 19, 3984–3992 CAS.
- S. F. Memon, R. Wang, B. Strunz, B. S. Chowdhry, J. T. Pembroke and E. Lewis, A review of optical fiber ethanol sensors: Current state and future prospects, Sensors, 2022, 22, 950 CrossRef CAS PubMed.
- I. Piekarz, K. Wincza, S. Gruszczynski and J. Sorocki, Detection of methanol contamination in ethyl alcohol employing a purpose-designed high-sensitivity microwave sensor, Measurement, 2021, 174, 108993 CrossRef.
- J. Xie, H. Wang and M. Duan, QCM chemical sensor based on ZnO colloid spheres for the alcohols, Sens. Actuators, B, 2014, 203, 239–244 CrossRef CAS.
- A. Rianjanu, K. Triyana, D. Nugroho, A. Kusumaatmaja and R. Roto, Electrospun polyvinyl acetate nanofiber modified quartz crystal microbalance for detection of primary alcohol vapor, Sens. Actuators, A, 2019, 301, 111742 CrossRef.
- E. Haghighi and S. Zeinali, Nanoporous MIL-101(Cr) as a sensing layer coated on a quartz crystal microbalance (QCM) nanosensor to detect volatile organic compounds (VOCs), RSC Adv., 2019, 9, 24460–24470 RSC.
- S. Jayawardena, H. Siriwardena, R. Rajapakse, A. Kubono and M. Shimomura, Fabrication of a quartz crystal microbalance sensor based on graphene oxide/TiO2 composite for the detection of chemical vapors at room temperature, Appl. Surf. Sci., 2019, 493, 250–260 CrossRef CAS.
- M. F. Adak, P. Lieberzeit, P. Jarujamrus and N. Yumusak, Classification of alcohols obtained by QCM sensors with different characteristics using ABC based neural network, Eng. Sci. Technol. Int. J., 2020, 23, 463–469 Search PubMed.
- G. Sauerbrey, Verwendung von schwingquarzen zur wägung dünnerschichten und zur mikrowägung, Z. Phys., 1959, 155, 206–222 CrossRef CAS.
- D. A. Buttry and M. D. Ward, Measurement of interfacial processes at electrode surfaces with the electrochemical quartz crystal microbalance, Chem. Rev., 1992, 92, 1355–1379 CrossRef CAS.
- K. D. Esmeryan, Y. Lazarov, T. Grakov, Y. I. Fedchenko, L. G. Vergov and S. Staykov, Metal-phenolic film coated quartz crystal microbalance as a selective sensor for methanol detection in fermented beverages, Micromachines, 2023, 14, 1274 CrossRef PubMed.
- K. D. Esmeryan, I. D. Avramov and E. I. Radeva, Temperature behavior of solid polymer film coated quartz crystal microbalance for sensor applications, Sens. Actuators, B, 2015, 216, 240–246 CrossRef CAS.
- K. D. Esmeryan, T. A. Yordanov, L. G. Vergov, Z. G. Raicheva and E. I. Radeva, Humidity tolerant organic vapor detection using a superhydrophobic quartz crystal microbalance, IEEE Sens. J., 2015, 15, 6318–6325 CAS.
- R. Bhradwaj and A. Hazra, Pd functionalized SrTiO3 hollow spheres for humidity-tolerant ethanol sensing, Sens. Actuators, B, 2022, 372, 132615 CrossRef.
- L. Yang, L. Han, J. Ren, H. Wei and L. Jia, Coating process and stability of metal-polyphenol film, Colloids Surf., A, 2015, 484, 197–205 CrossRef CAS.
- H. Ejima, J. J. Richardson and F. Caruso, Metal-phenolic networks as a versatile platform to engineer nanomaterials and biointerfaces, Nano Today, 2017, 12, 136–148 CrossRef CAS.
- N. J. Shirtcliffe, G. McHale, S. Atherton and M. I. Newton, An introduction to superhydrophobicity, Adv. Colloid Interface Sci., 2010, 161, 124–138 CrossRef CAS PubMed.
- Z. Raicheva, V. Georgieva, T. Angelov, V. Gadjanova, L. Vergov, Y. Lazarov and M. Atanassov, Improvement of sensor sensitivity of quartz crystal microbalance by roughening of the piezoelectric plate, Optoelectron. Adv. Mater., Rapid Commun., 2012, 6, 1160–1163 CAS.
- G. Yun, W. Youn, H. Lee, S. Y. Han, M. B. Oliveira, H. Cho, F. Caruso, J. F. Mano and I. S. Choi, Dynamic electrophoretic assembly of metal-phenolic films: Accelerated formation and cytocompatible detachment, Chem. Mater., 2020, 32, 7746–7753 CrossRef CAS.
- M. A. Rahim, H. Ejima, K. L. Cho, K. Kempe, M. Müllner, J. P. Best and F. Caruso, Coordination-driven multistep assembly of metal-polyphenol films and capsules, Chem. Mater., 2014, 26, 1645–1653 CrossRef CAS.
- W. Xu, S. Pan, B. B. Noble, J. Chen, Z. Lin, Y. Han, J. Zhou, J. J. Richardson, I. Yarovsky and F. Caruso, Site-selective-coordination assembly of dynamic metal-phenolic networks, Angew. Chem., 2022, 134, e202208037 CrossRef.
- W. Liao, B. Cheng, C. Wang, J. J. Richardson, M. Naito, K. Miyata and H. Ejima, Surface-initiated synergistic disassembly of metal-phenolic networks by redox and hydrolytic reactions, Chem. Mater., 2024, 36, 9646–9657 CrossRef CAS.
- J. I. Brauman and L. K. Blair, Gas-phase acidities of alcohols. Effects of alkyl groups, J. Am. Chem. Soc., 1968, 90, 6561–6562 CrossRef CAS.
- M. Sobiesiak, Chemical structure of phenols and its consequence for sorption processes, in Phenolic Compounds, ed. M. Soto-Hernandez, M. Palma-Tenango and M. del Rosario, Intech Open, 2017 Search PubMed.
- M. C. Elliott, C. E. Hughes, P. J. Knowles and B. D. Ward, Alkyl groups in organic molecules are NOT inductively electron-releasing, Org. Biomol. Chem., 2025, 23, 352–359 RSC.
- W. M. Schubert, R. B. Murphy and J. Robins, Electron donor and acceptor properties of alkyl substituents, Tetrahedron, 1962, 17, 199–214 CrossRef CAS.
- I. E. Salama, R. I. Slavchov, S. V. Filip and S. M. Clarke, Chemisorption and physisorption of alcohols on iron (III) oxide-terminated surfaces from nonpolar solvents, J. Colloid Interface Sci., 2025, 685, 15–28 CrossRef CAS PubMed.
- I. D. Avramov, M. Rapp, S. Kurosawa, P. Krawczak and E. I. Radeva, Gas sensitivity comparison of polymer coated SAW and STW resonators operating at the same acoustic wave length, IEEE Sens. J., 2002, 2, 150–159 CrossRef CAS.
Footnote |
| † Electronic supplementary information (ESI) available. See DOI: https://doi.org/10.1039/d5sd00041f |
| This journal is © The Royal Society of Chemistry 2025 |