
 Open Access Article
 This Open Access Article is licensed under a Creative Commons Attribution-Non Commercial 3.0 Unported Licence
Operando evidence on the chirality-enhanced oxygen evolution reaction in intrinsically chiral electrocatalysts†
Felipe A.
Garcés-Pineda‡
 *a,
Jiahao
Yu‡
a,
Camilo A.
Mesa§
b,
Sergi
Plana-Ruiz
c,
Daniel
Ruano
c,
Yunchang
Liang
d,
Magalí
Lingenfelder
de,
Sixto
Giménez
b and
J. R.
Galán-Mascarós
*af
*a,
Jiahao
Yu‡
a,
Camilo A.
Mesa§
b,
Sergi
Plana-Ruiz
c,
Daniel
Ruano
c,
Yunchang
Liang
d,
Magalí
Lingenfelder
de,
Sixto
Giménez
b and
J. R.
Galán-Mascarós
*af
aInstitute of Chemical Research of Catalonia (ICIQ-CERCA, ), The Barcelona Institute of Science and Technology (BIST), Av. Països Catalans 16, Tarragona, 43007, Spain. E-mail: fgarces@iciq.es; jrgalan@iciq.es
bInstitute of Advanced Materials (INAM), Universitat Jaume I, Av. de Vicente Sos Baynat, Castelló 12006, Spain
cSRCIT-Universitat Rovira i Virgili, Avinguda Països Catalans 26, Tarragona, 43007, Spain
dMax Planck-EPFL Laboratory for Molecular Nanoscience and Technology, École Polytechnique Fédérale de Lausanne (EPFL), Lausanne, 1015, Switzerland
eHelvetia Institute for Science and Innovation, Wollerau, 8832, Switzerland
fICREA, Passeig Lluis Companys, 23, Barcelona, 08010, Spain
First published on 18th February 2025
Abstract
Electrolytic hydrogen is identified as a crucial component in the desired decarbonisation of the chemical industry, utilizing renewable energy to split water into hydrogen and oxygen. Water electrolysis still requires important scientific advances to improve its performance and lower its costs. One of the bottlenecks in this direction is related to the sluggish anodic oxygen evolution reaction (OER). Producing anodes with competitive performance remains challenging due to the high energy losses and the harsh working conditions typically required by this complex oxidation process. Recent advancements point to spin polarization as an opportunity to enhance the kinetics of this spin-restricted reaction, yielding the paramagnetic O2 molecule. One powerful strategy deals with the generation of chiral catalytic surfaces, typically by surface functionalisation with chiral organic molecules, to promote the chiral-induced spin selectivity (CISS) effect during electron transfer. However, the relationship between optical activity and enhanced electrocatalysis has been established only from indirect experimental evidence. In this work, we have exploited operando electrochemical and spectroscopic tools to confirm the direct relationship between the faster OER kinetics and the optical activity of enantiopure Fe–Ni metal oxides when compared with that of achiral catalysts in alkaline conditions. Our results show the participation of chiral species as reactive intermediates during the electrocatalytic reaction, supporting the appearance of a mechanistic CISS enhancement. Furthermore, these intrinsically chiral transition-metal oxides maintain their enhanced activity in full cell electrolyser architectures at industrially relevant current densities.
Electrochemical water splitting powered by renewable energy source-generated electricity is generally regarded as the most environment-friendly and sustainable pathway for green hydrogen production.1 Currently, water electrolysis still has a marginal contribution of <4% to global hydrogen production compared to mature carbon-intense technologies, such as steam methane reforming.2,3 The difficult adoption of electrolysis technologies depends on several factors, including their high cost and less-than-optimum efficiency. Despite promising recent advances,4–6 state-of-the-art proton exchange membrane (PEM) water electrolysers unavoidably depend on the usage of expensive Ti bipolar plates, perfluorinated membrane separators, Ir-based anode catalysts and Pt based cathodes, which further increase the capital costs.7,8 Alternatively, emerging anion exchange membrane (AEM) water electrolysers avoid the use of noble metals, since they operate in alkaline media. However, their performance is still far from that of their PEM counterparts.9,10 This performance is mostly limited by the anodic process, where the sluggish oxygen evolution reaction (OER) takes place, based on the oxidation of two hydroxyl anions (in alkaline conditions) through a 4e− transfer to form an O–O bond into paramagnetic O2.11,12 Theoretical studies indicate that the high overpotentials needed are partly due to the generation of a O2 molecule with the ground triplet state from open shell radicals.12,13 To facilitate parallel spin alignment, spin polarization upon the catalytic entities has been proposed to improve the efficiency of the process. One successful strategy towards this aim has been realized through the chiral-induced spin selectivity (CISS) effect.14–16 When the catalytic surface is decorated with chiral organic molecules, improved OER kinetics is promoted. This has been assigned to the spin-filtering power of the enantiopure molecules17 as mediators in the charge transfer processes.18,19 For example, Liang et al. used organic chiral molecule-functionalised electrodes to boost the oxygen evolution reaction (OER) by up to ca. 130% (at a potential of 1.65 V vs. RHE) at state-of-the-art 2D Ni- and NiFe-based catalysts via spin-polarization, compared to the achiral analogs.20 Chiral Co(Fe)Ox OER electrocatalysts were also developed by decoration with L-cysteine and achieved a high mass activity of 1730 A g−1, beyond that found for their achiral (decorated with rac-cysteine) counterparts.21 Although CuO is neither magnetic nor a particularly active OER catalyst, enhanced electrochemical performance was engineered into colloidal chiral nanoparticles.22 Interestingly, although most examples of the CISS effects in electrocatalysis are related to enhanced OER,23 the CISS-effect has also been reported to play a role in other catalysed reactions24 including oxygen reduction,25,26 asymmetric organic synthesis,27,28 and photocatalysis.29
The mechanistic origin of the CISS effect is still far from being understood. Regarding the OER, the most studied reaction, theoretical modeling is pointing towards different plausible effects. Some studies highlight the spin-polarization charge transfer restrictions.30–32 Others point towards the spin orientation at the active sites.33 Others have pointed to key differences in reaction intermediates, yielding a M–O˙ in chiral catalysts but a M![[double bond, length as m-dash]](https://www.rsc.org/images/entities/char_e001.gif) O in achiral catalysts.21 The lack of experimental evidence on the direct relationship between chirality and electrocatalysis leaves too many questions open. Until now, only indirect relationships have been found between chirality and electrochemical performance, such as the appearance of enhanced electrocatalytic activity in chiral vs. achiral analogs, or by-product analysis: the hydrogen peroxide by-product is precluded during water oxidation under magnetic fields.
O in achiral catalysts.21 The lack of experimental evidence on the direct relationship between chirality and electrocatalysis leaves too many questions open. Until now, only indirect relationships have been found between chirality and electrochemical performance, such as the appearance of enhanced electrocatalytic activity in chiral vs. achiral analogs, or by-product analysis: the hydrogen peroxide by-product is precluded during water oxidation under magnetic fields.
Herein, we report the successful processing of intrinsically chiral transition metal oxides exhibiting superior OER electrocatalytic performance to their achiral counterparts, investigated by complementary techniques including operando spectro-electrochemistry (SEC). Our results confirm the appearance of spin-polarized transport through these oxides, but also the participation of chiral species as shown by SEC data. This spectroscopy has allowed us to identify the appearance of chiral active species under OER conditions, confirming the key role of chirality in the reaction pathway. Furthermore, these Fe–Ni oxides were implemented into anion exchange membrane electrolysers (AEMELs), exhibiting their superior catalytic activity and improving the energy efficiency of these devices at industrially relevant current densities (>200 mA cm−2).
Results and discussion
Synthesis and structural characterisation
Fe-doped NiOx films were synthesised on fluorine tin oxide supports (FTO) with the addition of chiral amino acids as templating agents under hydrothermal conditions. Following previous reports,34,35 we used chiral-proline (either D or L forms) to induce a chiral growth of the Fe-doped NiOx particles (D-NiFe and L-NiFe, respectively).36 The product of this first synthesis consists of nanoparticles decorated with organic templates. In the second step, the materials were calcined by direct combustion in air (>500 °C) to eliminate the organic component. After this treatment, no remnants of organic matter were detected in the metal oxides (Fig. S1†). Analogous achiral catalysts were prepared under the same synthetic conditions without amino acid additives (a-NiFe).All three oxides, D-NiFe, L-NiFe and a-NiFe exhibit analogous morphology (and chemical composition distribution). Their crystalline structure, as determined by FESEM and X-ray diffraction powder patterns, respectively, confirmed their isostructural nature (Fig. S2–S7†). Regarding their optical properties, D/L-NiFe samples showed the appearance of the Cotton effect of opposite sign in the circular dichroism data (Fig. 1). This dichroic activity, in the absence of the templating ligands, appears in the absorption bands corresponding to the band gap in these NiFe semiconductors (below 500 nm), confirming the chiral nature of the crystalline structure in these samples. As expected, no optical activity was found in a-NiFe.
 | ||
| Fig. 1 Optical properties of a-NiFe, L-NiFe and D-NiFe. (a) UV-vis absorption spectra, and (b) circular dichroism spectra. Absorption measurements were performed using catalyst/FTO glass electrodes. | ||
Electrocatalytic oxygen evolution reaction
To investigate their activity for the oxygen evolution reaction (OER) under alkaline conditions, we processed these catalysts onto Ni foil substrates. All three electrodes exhibit classic polarization curves, displaying a redox event within the 1.30–1.45 V vs. RHE range, followed by an OER onset potential at around 1.5 V vs. RHE (Fig. 2). Such a redox event, exhibiting two peaks, has been previously assigned to the transition NiII/NiIII of both α- and β-Ni(OH)2 transitioning into the γ-NiOOH and β-NiOOH phases, respectively.37,38 Interestingly, the accumulative charge corresponding to this redox event is larger for the chiral L/D-NiFe anodes, suggesting a larger accumulation of active species for the OER as reported before.39 Notably, the curves show higher current densities in the L/D-NiFe anodes when compared to the a-NiFe variant, suggesting enhanced activity.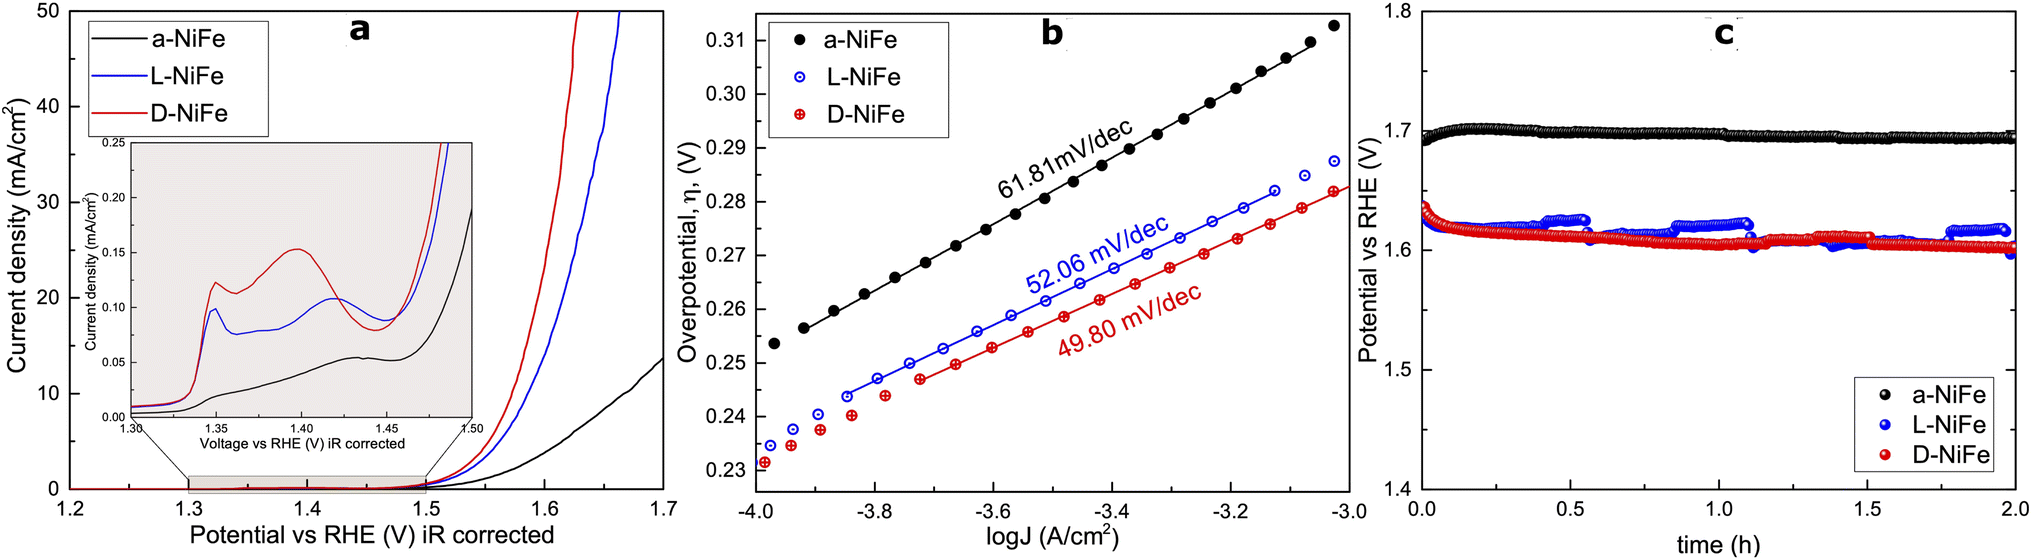 | ||
| Fig. 2 (a) Linear sweep voltammetry data for the a-NiFe (0.40 mg cm−2), D-NiFe (0.25 mg cm−2) and L-NiFe (0.5 mg cm−2) samples on Ni foil; in the inset a detailed image of the redox waves for the different oxides is provided. (b) Tafel plot for the different chiral oxides (a-NiFe, D-NiFe and L-NiFe samples). (c) Stability test for 2 hours at 10 mA cm−2. | ||
To understand the origin of this overall improved performance we investigated its different possible origins. We estimated the electrochemical surface area (ECSA) to investigate if this enhanced activity could be due to a larger ECSA. Surprisingly, the experimental data indicate quite the contrary (Fig. S8†). The ECSA values point to a clear decrease in the chiral oxides, indicating that the electrochemical surface area is not a key parameter to explain the observed enhanced electrocatalytic performance.
The Tafel plots extracted from the linear sweep curves (Fig. 2b) show slightly lower slopes for the chiral oxides, but in the same range.
Chronopotentiometry (CP) studies (Fig. 2c) for 2 h at 10 mA cm−2 confirmed the stability and robustness of the chiral catalysts, which is consistently maintained throughout all the experiments. The catalyst surface and crystal structure do not show any significant modification throughout and after the electrocatalytic process (Fig. 3 and S9†). Energy dispersive spectroscopy (EDS) maps show that all as-prepared samples contain well dispersed Fe (green), Ni (blue) and O (red). During the OER, the number and size of Fe-rich areas increase, as result of the dynamic Fe leaching/uptake processes that are well documented in these materials.41 Beyond this, we could not identify any additional signs pointing towards a major reconstruction event on the film, as confirmed by atomic force microscopy and high-resolution transmission electron microscopy (HRTEM) performed on different spots of the samples at different scales from microns down to few nanometers (Fig. S10–S12†). Both the phase contrast and morphology remain stable during chronopotentiometry (Fig. S9†), with RMS = 104 ± 8 nm (before the OER) and 108 ± 12 nm (after the OER). The electron diffraction patterns acquired from these areas result in poly-crystalline (ring-like) patterns where several agglomerated crystals are observed, and monocrystalline (spot-like) ones where one or more nanoflakes are illuminated. This confirms the single-crystalline nature of the flakes, and simulated patterns prove that these correspond to a nickel oxide phase.
 | ||
| Fig. 3 HRTEM characterisation before (a) and after a 2 h chronopotentiometry test (b). Images on the left side correspond to the overlap of single EDS maps of O (red), Fe (green) and Ni (blue). The image located in the middle is the related TEM image and right-side frame displays the electron diffraction pattern from the same area, which were indexed by means of simulated patterns from the ReciPro software package.40 | ||
Comparative XPS data were also collected ex situ (Fig. S13, Table S1†). Some changes were observed after CP experiments. The main metallic peaks (Ni 2p3/2 and Fe 2p3/2) remain consistent, except for the appearance of a weak, new peak corresponding to Ni 2p3/2 (Ni3+), as result of the oxidation process. Detailed analysis reveals some additional changes in the three distinct oxygen-related peaks, predominantly representing lattice oxygen species (83%), with smaller contributions from organic O (CO) and/or oxygen defects (13%) and –OH groups or organic contamination (3%). The post-CP samples show an increase in the presence of oxygen defects, more significant in the more active catalysts (D- and L-), suggesting that these vacancies may be related to the faster reaction mechanism.
On the other hand, Raman spectroscopy did not show any information related to the oxygen vacancies in the region of about 300–600 cm−1; this is attributed to the low change ratio between fresh and post-catalytic situations. On the other hand, Raman spectroscopy and PXRD (Fig. S14†) confirm the stability of the studied specimens before and after electrochemical tests, again confirming the robustness of these chiral oxides.
Besides, operando circular dichroism data (reported herein for the first time) are also consistent (Fig. S15 and S16†), with the opposite signals found for both L/D-NiFe remaining active.
All these characterisation data, collectively, support the robustness of the structural, morphological, chemical and optical features of these chiral oxides during electrocatalysis. We completed our studies with additional operando characterisation to better understand the mechanistic differences imposed by the CISS effect.
An impedance spectroscopy analysis was carried out on the achiral and chiral oxides, deposited on FTO substrates to avoid Ni metal background artefacts. The results are included in Fig. S17–S20.† In all cases, the EIS plots showed two well-defined semicircles which could be modelled to an equivalent circuit (Fig. S17†).42 The high frequency semicircle is assigned to solid state phenomena within the bulk of the electrocatalyst and to the interface with the FTO substrate, while the low frequency semicircle is assigned to the charge transfer step to the electrolyte. In general, the charge transfer resistance controls the total resistance of the electrode, and follows the expected exponential behaviour, consistent with the J–V curves for oxygen evolution shown in Fig. 2a The plateau of Rct at the highest anodic potentials applied is consistent with the linear behaviour of the J–V curves (constant resistance) within this potential range. These results validate the enhanced charge transfer kinetics promoted by the CISS effect in the chiral analogs. On the other hand, the surface capacitance of the achiral and chiral electrocatalysts (Fig. S20†) is practically identical, within experimental error, suggesting that the CISS effect does not translate into a higher density of surface states (or catalytic sites), and that the promoted enhancement is due to the kinetics of the catalytic process.
Operando spectro-electrochemistry
Spectro-electrochemical (SEC) data have been very useful for the investigation of the reaction dynamics allowing intermediates to be monitored during OER electrocatalysis.43,44 We carried out SEC measurements in transmission mode (FTO supports) to study the evolution of the catalytic sites during the rate determining step of the reaction. The optical signals of the OER active species, i.e., differential absorption of the catalyst during the OER vs. the optical absorption at the onset potential (Fig. S21 and S22†) reveal a rather similar behaviour for all catalysts. A broad absorption in the 400–600 nm range occurs between 1.125 and 1.325 V vs. RHE (around the NiOOH formation), indicating a similar accumulation of catalytic sites on these electrodes. This is consistent with the surface capacitance observed by EIS and discussed previously. Interestingly, the kinetic analysis (Fig. S23†) shows the same slope corresponding to a 1st order kinetics with respect to the density of catalytic sites, suggesting again that the water oxidation reaction goes through the same mechanism despite the chiral or a-chiral nature of the oxides. Although the mechanistic nature of the OER on the a-chiral surface is the same compared with that of its chiral analogs, the reaction kinetics observed in Fig S23b† is slower for the a-chiral catalyst. This indicates that CISS is the dominant mechanism responsible for the improved kinetics of the reaction on the chiral surfaces.In order to gain additional insights into the participation of the chiral nature of these catalysts during electrocatalysis, we carried out CD-SEC experiments following the CD signals operando (Fig. S16†) instead of the classic UV-vis spectra. The CD data show the appearance of a new, broad Cotton-effect above the OER onset potentials. This new signal may be assigned to the new absorption bands identified in SEC, corresponding to the charge accumulation in the transition state. This indicates that the transition state during the OER is optically active. The differential CD data (Fig. 4) display a sharp increase in the slope after a threshold of ≈1.2 V vs. RHE, which corresponds to the potential where the NiOOH formation process starts taking place for electrodes on FTO. Although a complete explanation of this phenomenon is out of the scope of this paper, such an increase suggests that the OER active sites formed in the chiral catalysts are spin polarised centers leading to an increased CISS effect. Interestingly, this effect appears to reach to an equilibrium and plateaus at around 5 mA cm−2 for L-NiFe and 8 mA cm−2 for D-NiFe. A kinetic analysis of the CD data shows a slope of approximately 0.9–1.0 for the evolution of the dichroic signals. Thus, the CD data yield the same 1st order kinetics akin to optical data (in Fig. S24†), also confirming the participation of optically active species in the reaction mechanism. This could indicate that the OER transition state might indeed involve M–O˙ species that are formed by a 1 electron transfer process giving rise to the 1st order reaction observed in the UV-vis and CD rate laws (Fig. S12 and S22†). A similar 1st order mechanism, involving radical species, has been proposed for hematite photoanodes during OER at low irradiation fluxes.45
 | ||
| Fig. 4 Spectroelectrochemical analysis of chiral oxides (L-NiFe and D-NiFe) at an applied potential in the 0.9–1.8 V vs. RHE range. (a and b) Chiral activity extracted from the CD signal for both oxides. (c and d) CD difference correlated with the applied potential during the OER in a KOH (1 M) electrolyte. | ||
Spin-polarized transport and magnetism
To support the role of spin polarization phenomena through these intrinsically chiral oxides, we investigated spin restricted transport in thin layers of these materials (1.0 ± 0.1 μm, Fig. S25†) with magnetic conductive Atomic Force Microscopy (mc-AFM-tip) at room temperature.46Initially, the mc-AFM-tip was used on a-NiFe, with the results evidencing no major carrier conductivity as a function of the applied voltage despite the magnetic configuration (magnetised up: M↑ and magnetised down: M↓ (Fig. 5)). Fig. 5a shows that for L-NiFe the current increases with bias voltage when the tip is M↓, while it remains constant when M↑ as shown in Fig. 5b. This indicates higher resistance in the M↑ configuration, suggesting that tunnelling transport depends on the tip's spin polarization and the sample's chirality. So, current will flow easily in the M↓ for L-NiFe generating low resistance to the carrier transport between the film and the AFM-tip.
 | ||
| Fig. 5 mc-AFM-tip measurements with magnet down (a) and magnet up (b) for L-NiFe, D-NiFe, and a-NiFe catalysts. The current flow is indicated with arrows according to the magnetic field direction on the AFM tip. | ||
On the other hand D-NiFe in Fig. 5b shows the opposite behaviour, confirming that this effect is related to the spin filtering effect in the opposite direction when the M↑ configuration was used. It is worth mentioning that we carried out fifty scans at different points at each surface, and we calculated the average of all measurements (shown in Fig. S26†).
To compare the appearance of spin restrictions in L/D configurations, spin polarization was calculated using the equation (IM↑ − IM↓)/(IM↑ + IM↓) where IM↑ and IM↓ correspond to the currents between the ↑ and ↓ magnetized tip. Normally, a value close to 1 indicates a complete polarization of the spin by the chiral structure. In our case, the spin polarisation was found to be close to 0.9 for D-NiFe and 0.7 for L-NiFe.
We also investigated the magnetic properties of these catalysts, measuring the M vs. H response at room temperature (Fig. S27†). We found different magnetic behaviors for the chiral compounds, that show a very fast increase at low fields, suggesting the presence of a ferromagnetic component. This initial jump in the magnetization is absent in the achiral Ni oxide that shows a progressive increment of M with the field. We consider this distinct behavior additional experimental proof for the presence of the CISS effect.
Full cell architecture
Given the superior electrochemical performance of these intrinsically chiral NiFe oxides when compared with the centro-symmetric analogs, we decided to investigate how this enhanced activity may work in a full-cell anionic exchange membrane electrolyser (AEMEL). Fig. 6 shows the comparative performance of these oxides in an electrolyser configuration for the same catalyst loadings in weight. Both chiral oxides show better performance, reaching 200 mA cm−2 at 1.9 V, with slightly better performance found for the D-NiFe variant (Fig. 6). We correlate this difference with the higher spin-polarization found for the D-NiFe analogue, which also exhibited stronger CD signals (ex situ and operando). These results point again to the appearance of an effective CISS effect in the optically active counterparts.20,47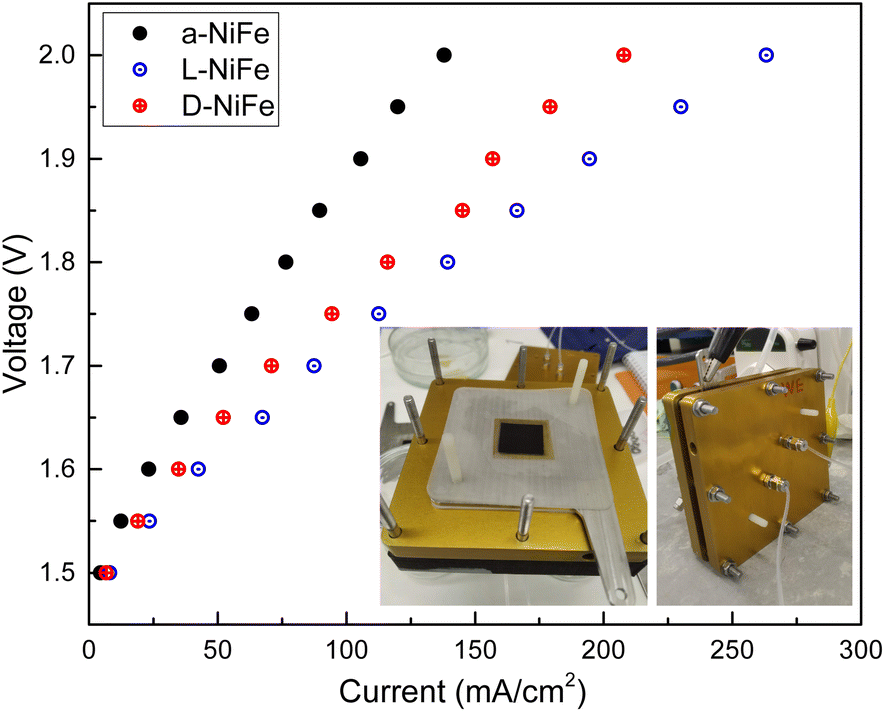 | ||
| Fig. 6 Polarization plot (J–V curves) for achiral and chiral oxides in an AEMEL (inset). | ||
Conclusions
The CISS effect has been unmistakably observed in intrinsically chiral inorganic metal oxides during OER electrocatalysis. This has been achieved by the realisation of the CISS effect in the absence of organic decoration (Table S3†), given the uncertain stability of organic molecules during electrochemical reactions in a real electrolysis full cell.48 Our approach demonstrates a stable, enhanced performance when running at >200 mA cm−2 current density in a full cell AEM electrolyser.More importantly, our comprehensive characterisation data of these optically active Fe-doped Ni oxides, including operando spectroscopy, have confirmed the participation of chiral active sites in the reaction transition state. The circular dichroism spectro-electrochemical data have shown the appearance of distinct features in the optical signals during electrocatalysis, which have been directly correlated with the kinetics of the hole accumulation in these systems. In good agreement with additional electrochemical (EIS) and spin-polarized transport, we have demonstrated the appearance of direct mechanistic effects of CISS, which are also robust and reliable for exploitation in an electrolyzer flow cell architecture.
Experimental
Synthesis and processing
Commercial substrates such as fluorine-doped tin oxide (FTO) and Ni foil/foam substrates were employed as electrode supports. These substrates underwent a meticulous cleaning process that involved an initial 5 min sonication in soapy water, followed by rinsing and a subsequent treatment with acetone and sonication. Finally, a stream of nitrogen was used to ensure the complete drying of the substrate.Chiral NiOx films were obtained using D- or L-proline (1.3 mmol) as a chiral template. This amino acid was dissolved in 40 mL of deionized water while stirring at room temperature. After 5 minutes, NiCl2·6H2O (2.0 mmol) was added with continuous stirring (intense green color was observed). The reaction mixture was stirred for 30 minutes at room temperature. Then, 2.0 mL of 25% NH3·H2O was added dropwise under constant stirring until the solution became blue and homogeneous. Two pieces of previously cleaned FTO glass (3 × 1 cm2) were placed in a Teflon vessel with the conducting side facing down. The mixture (approx. 10 mL per reactor) was then sealed in Teflon-lined autoclaves (15 mL) and heated at 140 °C and maintained for 6 hours. Finally, the substrates were washed with mQ-water and dried with nitrogen flow. Before calcination, the films were dipped in a Fe(NO3)3·9H2O solution and dried at 80 °C. Finally, the organics remaining on the NiOx surface were removed from the films by calcination at 550 °C (was confirmed by infrared spectroscopy, Fig. S1†) for 6 hours, resulting in chiral NiOx films, denoted as L-NiFe, D-NiFe, or a-NiFe; the last one was obtained using the same protocol previously described, but without the presence of any amino acids.
AEMEL assemblies
Ni foam gas diffusion electrodes (GDEs) (600 μm thick, 95% porosity, from Goodfellow) were cut into 2 × 2 cm pieces and weighed before decoration. The decoration was carried out using the protocol described previously for the NiFe catalyst on FTO and Ni-foil, obtaining a final mass loading between 0.4 and 0.7 mg cm−2. For assembling the electrolysis cell (4 cm2, home made cell), an anodic GDE was placed in the center of the serpentine flow field with the catalyst facing inward and held in place by a silicon spacer (0.3 of thickness) mm with a 2 × 2 cm window. A Sustainion membrane (X37-50 Grade T, activated overnight in 1 M KOH) cut to 3.5 × 3.5 cm was added. The final layer consisted of a silicon spacer (0.3 mm) with a 2 × 2 cm window and a cathodic GDE (2 × 2 cm with commercial carbon cloth-MPL Pt–C 60%, from Dioxide Materials) with the catalyst layer facing the membrane. The cell was assembled by placing the cathodic side on top and tightening the screws to a final torque of 2.4 N m. Room temperature 1 M KOH was pumped into the cell through the bottom inlets at 5 mL min−1 on both sides using a dual-channel peristaltic pump. The cell was heated to 60 °C with heating pads, connected to a PID temperature controller and thermocouple.Electrochemical characterisation of AEMELs based on achiral and chiral oxides was carried out. Recirculating 1 M KOH and the cell at 60 °C, EIS was conducted at the open circuit potential to determine the cell resistance. Then a polarization curve was obtained at constant voltage steps from 1.5 V to 2 V where the voltage was held for 15 minutes at each step and the voltage reported was the average during the last 5 minutes. EIS was conducted at the open circuit potential and an applied potential of 1.8 V.
Materials characterization
Powder X-ray diffraction (PXRD) data were recorded with a Bruker D8 Advance Series equipped with a VANTEC-1 PSD3 detector. A JEOL F200 TEM ColdFEG operated at 200 kV was used for transmission electron microscopy characterisation. TEM images were acquired with a Gatan OneView camera, and a CMOS-based and optical fiber-coupled detector of 4096 × 4096 pixels. The Gatan Digital Micrograph program was used to process the TEM images. STEM images (1024 × 1024 pixels) were recorded using JEOL bright-field (BF) and high-angle annular dark-field (HAADF) detectors using a Gatan DigiScan 3 scanning unit with a camera length of 200 mm. The samples were inserted into a JEOL beryllium double-tilt holder for energy dispersive X-ray spectroscopy (EDS). STEM-EDS mapping was recorded using an EDS Centurio detector (silicon drift) with an effective area of 100 mm2 and 133 eV energy resolution. STEM-EDS maps (512 × 512 pixels) were processed with the JEOL Analysis software. Simulated electron diffraction patterns were obtained from the ReciPro software.40 The surface morphologies of the films were investigated by high resolution field emission scanning electron microscopy with a focused Ga ion beam (FESEM-FIB, Zeiss Supra), and the chemical analysis was performed using an FESEM Inspect F50 with an EDS detector (EDAX). The vibrations modes on the different NiFe layers and amino acids were characterised by using an FTIR-ATR Cary 630.The chemical surface analysis was performed at SRCiT (URV) using a ProvenX-NAP (Specs Surface Nano Analysis GmbH, Berlin, Germany) spectrometer with a monochromated AlKα source (μFocus 600 NAP) at a power of 60 W, and a hemispherical analyzer operating in the main fixed analyzer transmission mode, with an entrance slit of 7 × 20 mm and open exit slit with mesh. The beam spot size at the sample position was around 300 microns in diameter. The data were recorded with a PHOIBOS 150 NAP 1D-DLD and the total pressure in the main vacuum chamber during analysis was typically around 1 × 10⁻⁹ mbar. To obtain more detailed information about the chemical structure, oxidation states, etc., high-resolution spectra were recorded from individual peaks at 30 eV pass energy and 0.3 eV step size. The binding energy of the original spectra was corrected to C 1s 284.8 eV. Each specimen was analyzed at an emission angle of 0° as measured from the surface normal. Assuming typical values for the electron attenuation length of relevant photoelectrons, the XPS analysis depth ranges between 5 and 10 nm for a flat surface.
Raman spectra were measured with a WITec Apyron confocal microscope using a 532 nm laser wita 1 mW power, a grating of 1800 g mm−1, BLZ = 500 nm and an optical objective Zeiss EC Epiplan-Neofluar DIC 50×/0.55.
A Bruker Dimension FastScan AFM equipped with NCHR tips (NanoWorld) was used for the AFM measurements in tapping mode. WSxM v5.0 Develop 9.1 software was used for image analysis.49
Current vs. voltage measurements were performed using a Multimode AFM Agilent 5500. I–V spectroscopy measurements were recorded by using a voltage bias of −4 to +4 V at the tip in the contact mode. For each spectroscopy measurement, the tip was placed in a new position. A magnetic Pt-coated Cr tip (Multi75E-G) with a nominal spring constant of 3 N m−1 was used to acquire I–V curves. The tips are pre-magnetized using a permanent magnet.
Electrochemistry
All electrochemical experiments were conducted under ambient conditions using a Bio-Logic VMP3 multichannel potentiostat, employing a three-electrode configuration. For all electrochemical experiments, the electrolyte solution consisted of 1 M KOH (pH 13.9), a Pt mesh counter electrode, and an Hg/HgO (1 M KOH) reference electrode. The working FTO/NiOx electrode was prepared as described earlier, with a geometric surface area of 1 cm2. All recorded potentials were referenced against the Hg/HgO electrode and converted to the RHE reference scale using the calibration data in the ESI (Fig. S28†). The current densities were calculated based on the geometrical surface area of the electrodes. The onset potential was estimated as the potential where the current density becomes non-zero (≈0.1 mA cm−2). Electrochemical impedance spectroscopy (EIS) was conducted using a standard three-electrode cell, encompassing a frequency range from 100 kHz to 0.1 Hz, with 10 data points per decade under different voltage conditions, following the same 0.025 V steps. The EIS data were also used to estimate the ohmic drop (iR drop) for all electrochemical data, within the Bio-Logic interface for its compensation. Spectroelectrochemical (SEC) experiments were carried out during chronoamperometry (CA) tests. CA tests were conducted at intervals of 10 min (scan duration in circular dichroism) with voltage steps of 0.025 V, spanning the range from 0.925 V vs. RHE to 1.825 V vs. RHE.Spectroscopy
SEC experiments, which involve measuring optical absorption and circular dichroism as a function of applied potential, were conducted using an Applied Photophysics Chirascan spectrometer. The obtained data were typically presented in the form of spectro-electrochemical difference spectra (δOD or δOCD). These spectra are generated by subtracting a reference spectrum, often taken at the open circuit potential (OCP) or the onset of water oxidation, from the absorption data acquired under specific conditions of interest.Data availability
Data for this article are available at ZENODO at [https://doi.org/10.5281/zenodo.14198577].Author contributions
F. A. G. P. and J. R. G. M. proposed the concept. C. A. M., S. G., M. L., F. A. G. P. and J. R. G. M. designed the experiments. J. Y. and F. A. G. P. synthesised, characterised and processed the materials. J. Y., F. A. G. P. and S. G. performed the electrochemical experiments and analyses. J. Y., F. A. G. P. and C. A. M. performed the spectroelectrochemical experiments and analysis. D. R. performed the XPS characterisation and corresponding analysis. S. P. R. performed the HRTEM characterisation and analysis. J. Y., F. A. G. P., Y. L. and M. L. performed AFM, mc-AFM experiments and analysis. J. Y., F. A. G. P. and J. R. G. M. wrote the manuscript with contributions from all authors.Conflicts of interest
There are no conflicts to declare.Acknowledgements
The authors acknowledge the financial support from MCIN/AEI through projects PID2021-124796OB-I00, PID2020-116093RB-C41, PID2023-152771OB-I00 and PDC2022-133214-I00; and from the Generalitat de Catalunya (2021SGR1154). ICIQ is supported by the Ministerio de Ciencia e Innovación through the Severo Ochoa Excellence Accreditation CEX2021-001214-S; and by the CERCA Programme/Generalitat de Catalunya. DM and URV thank the Ministerio de Ciencia e Innovación and European Union “Next Generation” (project EQC2021-007785-P) for funding the acquisition of the ProvenX-NAP spectrometer.Notes and references
- Z. W. Seh, J. Kibsgaard, C. F. Dickens, I. Chorkendorff, J. K. Nörskov and T. F. Jaramillo, Science, 2017, 355, eaad4998 Search PubMed.
- E. S. Hanley, J. Deane and B. Gallachóir, Renewable Sustainable Energy Rev., 2018, 82, 3027–3045 Search PubMed.
- A. M. Oliveira, R. R. Beswick and Y. Yan, Curr. Opin. Chem. Eng., 2021, 33, 100701 Search PubMed.
- Y. Chen, C. Shang, X. Xiao, W. Guo and Q. Xu, Coord. Chem. Rev., 2024, 508, 215758 CAS.
- S. Kong, A. Li, J. Long, K. Adachi, D. Hashizume, Q. Jiang, K. Fushimi, H. Ooka, J. Xiao and R. Nakamura, Nat. Catal., 2024, 7, 252–261 CAS.
- R. Ram, L. Xia, H. Benzidi, A. Guha, V. Golovanova, A. G. Manjón, D. L. Rauret, P. S. Berman, M. Dimitropoulos, B. Mundet, E. Pastor, V. Celorrio, C. A. Mesa, A. M. Das, A. Pinilla-Sánchez, S. Giménez, J. Arbiol, N. López and F. P. G. de Arquer, Science, 2024, 384, 1373–1380 CAS.
- C. Spori, J. T. H. Kwan, A. Bonakdarpour, D. P. Wilkinson and P. Strasser, Angew. Chem., Int. Ed., 2017, 56, 5994–6021 CrossRef PubMed.
- IRENA, Renewable Energy Statistics 2020, The International Renewable Energy Agency, Abu Dhabi, 2020 Search PubMed.
- C. C. L. McCrory, S. Jung, I. M. Ferrer, S. M. Chatman, J. C. Peters and T. F. Jaramillo, J. Am. Chem. Soc., 2015, 137, 4347–4357 CrossRef CAS PubMed.
- J. Yu, G. Cheng and W. Luo, J. Mater. Chem. A, 2017, 5, 15838–15844 RSC.
- C. Wei, R. R. Rao, J. Peng, B. Huang, I. E. L. Stephens, M. Risch, Z. J. Xu and Y. Shao-Horn, Adv. Mater., 2019, 31, 1806296 CrossRef PubMed.
- E. Torun, C. M. Fang, G. A. de Wijs and R. A. de Groot, J. Phys. Chem. C, 2013, 117, 6353–6357 CAS.
- J. Gracia, Phys. Chem. Chem. Phys., 2017, 19, 20451–20456 RSC.
- R. Naaman and D. H. Waldeck, J. Phys. Chem. Lett., 2012, 3, 2178–2187 CAS.
- P. C. Mondal, C. Fontanesi, D. H. Waldeck and R. Naaman, Acc. Chem. Res., 2016, 49, 2560–2568 CAS.
- H. J. Eckvahl, N. A. Tcyrulnikov, A. Chiesa, J. M. Bradley, R. M. Young, S. Carretta, M. D. Krzyaniak and M. R. Wasielewski, Science, 2023, 382, 197–201 CrossRef CAS PubMed.
- X. Wang, C. Yi and C. Felser, Adv. Mater., 2024, 36, 2308746 CAS.
- R. Naaman and D. H. Waldeck, Annu. Rev. Phys. Chem., 2015, 66, 263–281 CAS.
- W. Zhang, K. Banerjee-Ghosh, F. Tassinari and R. Naaman, ACS Energy Lett., 2018, 3, 2308–2313 CAS.
- Y. Liang, K. Banjac, K. Martin, N. Zigon, S. Lee, N. Vanthuyne, F. A. Garcés-Pineda, J. Galán-Mascarós, X. Hu, N. Avarvari and M. Lingenfelder, Nat. Commun., 2022, 13, 3356 CAS.
- A. Vadakkayil, C. Clever, K. N. Kunzler, S. Tan, B. P. Bloom and D. H. Waldeck, Nat. Commun., 2023, 14, 1067 CAS.
- Y. Jin, W. Fu, Z. Wen, L. Tan, Z. Chen, H. Wu and P.-p. Wang, J. Am. Chem. Soc., 2024, 2798–2804 CAS.
- Z. Bian, K. Kato, T. Ogoshi, Z. Cui, B. Sa, Y. Tsutsui, S. Seki and M. Suda, Adv. Sci., 2022, 9, 2201063 CAS.
- R. Naaman, Y. Paltiel and D. H. Waldeck, Acc. Chem. Res., 2020, 53, 2659–2667 CAS.
- Y. Sand, F. Tassinari, K. Santra, W. Zhang, C. Fontanesi, B. P. Bloom, D. H. Waldeck, J. Franson and R. Naaman, Proc. Natl. Acad. Sci. U. S. A., 2022, 119, e2202650119 CrossRef PubMed.
- L. Scarpetta-Pizo, R. Venegas, P. Barrías, K. Muñoz Becerra, N. Vilches-Labbé, F. Mura, A. M. Méndez-Torres, R. Ramírez-Tagle, A. Toro-Labbé, S. Hevia, J. H. Zagal, R. Oñate, A. Aspée and I. Ponce, Angew. Chem., Int. Ed., 2024, 63, e202315146 CrossRef CAS PubMed.
- B. P. Bloom, Y. Lu, T. Metzger, S. Yochelis, Y. Paltiel, C. Fontanesi, S. Mishra, F. Tassinari, R. Naaman and D. H. Waldeck, Phys. Chem. Chem. Phys., 2020, 22, 21570–21582 CAS.
- F. Tassinari, D. Amsallem, B. P. Bloom, Y. Lu, A. Bedi, D. H. Waldeck, O. Gidron and R. Naaman, J. Phys. Chem. C, 2020, 124, 20974–20980 CAS.
- M. Ai, L. Pan, C. Shi, Z.-F. Huang, X. Zhang, W. Mi and J.-J. Zou, Nat. Commun., 2023, 14, 4562 CrossRef CAS PubMed.
- B. P. Bloom, Y. Paltiel, R. Naaman and D. H. Waldeck, Chem. Rev., 2024, 124, 1950–1991 CrossRef CAS PubMed.
- S. Ma, H. Lee and J. Moon, Adv. Mater., 2024, 2405685 CAS.
- Y. Sun, S. Sun, H. Yang, S. Xi, J. Gracia and Z. J. Xu, Adv. Mater., 2020, 32, 2003297 CAS.
- F. A. Garcés-Pineda, M. Blasco-Ahicart, D. Nieto-Castro, N. López and J. Galán-Mascarós, Nat. Energy, 2019, 4, 519–525 Search PubMed.
- H. Im, S. Ma, H. Lee, J. Park, Y. S. Park, J. Yun, J. Lee, S. Moon and J. Moon, Energy Environ. Sci., 2023, 16, 1187–1199 CAS.
- M. Ai, L. Pan, C. Shi, Z.-F. Huang, X. Zhang, W. Mi and J.-J. Zou, Nat. Commun., 2023, 14, 4562 CAS.
- T. Bai, J. Ai, L. Liao, J. Luo, C. Song, Y. Duan, L. Han and S. Che, Angew. Chem., Int. Ed., 2021, 60, 9421–9426 CAS.
- R. L. Doyle, I. J. Godwin, M. P. Brandon and M. E. G. Lyons, Phys. Chem. Chem. Phys., 2013, 15, 13737–13783 CAS.
- Q. Zhang, C. Zhang, J. Liang, P. Yin and Y. Tian, ACS Sustain. Chem. Eng., 2017, 5, 3808–3818 CAS.
- C. A. Mesa, F. A. Garcés-Pineda, M. García-Tecedor, J. Yu, B. Khezri, S. Plana-Ruiz, B. López, R. Iturbe, N. López, S. Gimenez and J. R. Galan-Mascaros, APL Energy, 2024, 2, 016106 CAS.
- Y. Seto and M. Ohtsuka, J. Appl. Crystallogr., 2022, 55, 397–410 CAS.
- M. B. Stevens, C. D. M. Trang, L. J. Enman, J. Deng and S. W. Boettcher, J. Am. Chem. Soc., 2017, 139, 11361–11364 CAS.
- L. Han, J. González-Cobos, I. Sánchez-Molina, S. Giancola, S. J. Folkman, P. Tang, M. Heggen, R. E. Dunin-Borkowski, J. Arbiol, S. Giménez and J. R. Galan-Mascaros, ACS Appl. Energy Mater., 2020, 3, 9198–9207 CrossRef CAS.
- R. R. Rao, S. Corby, A. Bucci, M. García-Tecedor, C. A. Mesa, J. Rossmeisl, S. Giménez, J. Lloret-Fillol, I. E. L. Stephens and J. R. Durrant, J. Am. Chem. Soc., 2022, 144, 7622–7633 CrossRef CAS PubMed.
- L. Francàs, S. Corby, S. Selim, D. Lee, C. A. Mesa, R. Godin, E. Pastor, I. E. L. Stephens, K.-S. Choi and J. R. Durrant, Nat. Commun., 2019, 10, 5208 CrossRef.
- C. A. Mesa, L. Francàs, K. R. Yang, P. Garrido-Barros, E. Pastor, Y. Ma, A. Kafizas, T. E. Rosser, M. T. Mayer, E. Reisner, M. Grätzel, V. S. Batista and J. R. Durrant, Nat. Chem., 2020, 82–89 CrossRef CAS PubMed.
- Z. Xie, T. Z. Markus, S. R. Cohen, Z. Vager, R. Gutierrez and R. Naaman, Nano Lett., 2011, 11, 4652–4655 CAS.
- Y. Liang, M. Lihter and M. Lingenfelder, Isr. J. Chem., 2022, 62, e202200052 CAS.
- S. Ghosh, B. P. Bloom, Y. Lu, D. Lamont and D. H. Waldeck, J. Phys. Chem. C, 2020, 124, 22610–22618 CrossRef CAS.
- I. Horcas, R. Fernández, J. M. Gómez-Rodríguez, J. Colchero, J. Gómez-Herrero and A. M. Baro, Rev. Sci. Instrum., 2007, 78, 013705 CrossRef CAS.
Footnotes |
| † Electronic supplementary information (ESI) available: Additional spectroscopy, XRD, and microscopy characterisation; additional electrochemical and SEC data with analysis. See DOI: https://doi.org/10.1039/d4sc07927b |
| ‡ These authors contributed equally to this work. |
| § Current address: Catalan Institute of Nanoscience and Nanotechnology (ICN2), CSIC, Barcelona Institute of Science and Technology, UAB Campus, 08193, Bellaterra, Barcelona, Spain. |
| This journal is © The Royal Society of Chemistry 2025 |