
 Open Access Article
 This Open Access Article is licensed under a
 Creative Commons Attribution 3.0 Unported Licence
Formation of polysulfides as a smart strategy to selectively detect H2S in a Bi(III)-based MOF material†
Valeria B.
López-Cervantes‡
 a,
Juan L.
Obeso‡
ab,
J. Gabriel
Flores‡
cd,
Aída
Gutiérrez-Alejandre
e,
Raul A.
Marquez
f,
José Antonio
de los Reyes
d,
Catalina V.
Flores
ab,
N. S.
Portillo-Vélez
g,
Pablo
Marín-Rosas
g,
Christian A.
Celaya
h,
Eduardo
González-Zamora
g,
Diego
Solis-Ibarra
*a,
Ricardo A.
Peralta
*g and
Ilich A.
Ibarra
*ai
a,
Juan L.
Obeso‡
ab,
J. Gabriel
Flores‡
cd,
Aída
Gutiérrez-Alejandre
e,
Raul A.
Marquez
f,
José Antonio
de los Reyes
d,
Catalina V.
Flores
ab,
N. S.
Portillo-Vélez
g,
Pablo
Marín-Rosas
g,
Christian A.
Celaya
h,
Eduardo
González-Zamora
g,
Diego
Solis-Ibarra
*a,
Ricardo A.
Peralta
*g and
Ilich A.
Ibarra
*ai
aLaboratorio de Fisicoquímica y Reactividad de Superficies (LaFReS), Instituto de Investigaciones en Materiales, Universidad Nacional Autónoma de México, Circuito Exterior s/n, CU, Coyoacán, 04510, Ciudad de México, Mexico. E-mail: argel@unam.mx
bInstituto Politécnico Nacional, CICATA U. Legaria, Laboratorio Nacional de Ciencia, Tecnología y Gestión Integrada del Agua (LNAgua), Legaria 694, Irrigación, 11500, CDMX, Mexico
cÁrea de Química Aplicada, Departamento de Ciencias Básicas, Universidad Autónoma Metropolitana-Azcapotzalco, 02200, Ciudad de México, Mexico
dDepartamento de Ingeniería de Procesos e Hidráulica, División de Ciencias Básicas e Ingeniería, Universidad Autónoma Metropolitana-Iztapalapa, 09340, Ciudad de México, Mexico
eUNICAT, Departamento de Ingeniería Química, Facultad de Química, Universidad Nacional Autónoma de México, 04510 Ciudad de México, Mexico
fDepartment of Chemistry, The University of Texas at Austin, Austin, Texas 78712, USA
gDepartamento de Química, División de Ciencias Básicas e Ingeniería. Universidad Autónoma Metropolitana (UAM-I), 09340, Mexico. E-mail: rperalta@izt.uam.mx
hCentro de Nanociencias y Nanotecnología, Universidad Nacional Autónoma de México, Km 107 Carretera Tijuana-Ensenada, Ensenada, B.C., C.P. 22800, Mexico
iDepartamento de Química, Universidad Autónoma Metropolitana-Iztapalapa, Avenida San Rafael Atlixco 186, Leyes de Reforma 1ra Sección, Iztapalapa, Ciudad de México 09310, Mexico
First published on 19th February 2025
Abstract
SU-101 was demonstrated to be an effective and efficient detector for H2S, due to the facile generation of polysulfides, with a remarkable H2S selectivity. Raman and XPS analyses confirmed the formation of Sn2− and S42− polysulfide species after the H2S adsorption (at 0.05 bar, 0.1 bar and 1 bar), without compromising the structural integrity of SU-101. The detection mechanism involves rigidification of the structure by the formation of the polysulfides and blockage of the ligand–metal charge transfer (LMCT) process, which increased the radiative emission. Additionally, theoretical simulations were carried out in order to demonstrate that the interaction of the polysulfide molecules inside the pores of SU-101 is energetically stable. Remarkably, the limit of H2S detection (LOD) was calculated to be as low as approximately 22 ppm. Finally, SU-101 is nominated as a promising candidate for implementing toxic waste valorisation (i.e., capture of toxic H2S) toward relevant applications in accurate molecular sensing.
Introduction
Hydrogen sulphide (H2S) is a toxic chemical in natural gas and biogas commonly emitted by different chemical industries. The desulphurization process of diverse gas streams (e.g., oil refineries) is the primary source of H2S emissions.1 H2S is a colourless gas that is extremely corrosive, flammable, and lethal to humans.2 H2S is classified as a dangerous and major air pollutant, mostly associated with acid rain and severe nervous system illnesses.3Thus, the efficient detection of H2S is desired for a cleaner environment and for human health protection. The development of methodologies for selective monitoring of H2S is necessary. Different technologies have been reported for H2S detection, such as colorimetry,4 electrochemical,5 and gas chromatography.6 However, implementing these methodologies requires a high measurement time and high complexity devices, which leads to a decrease in the possibility of practical applications.7 However, fluorescence techniques are much simpler alternatives for promising and potential H2S detection since the measurement method is reliable, user-friendly, convenient, and fast.8
Furthermore, different materials and strategies have been implemented for fluorescence detection of H2S. Carbon-based materials have been used to detect H2S in aqueous conditions and live cells.9 Silver nanoparticles were applied for H2S sensing in water.10 An alumina–graphene oxide nanocomposite was used for H2S detection in lake water.11 However, most of these materials are classified as free organic–inorganic molecules, which could exhibit fluorescence issues due to their molecular motion.12 Also, H2S detection is based on small molecules as fluorescent probes, such as inorganic sulphide salts (NaHS and Na2S). The detection is based on a chemical reaction between the material and the molecular probe via a nucleophilic attack, reduction, and precipitation to generate a fluorescence change.13 The implementation of robust materials for the detection of H2S molecules, by relatively strong interactions between H2S and the pore walls of the materials is highly desirable.
In this context, a comparatively novel class of highly crystalline and porous materials known as metal–organic frameworks (MOFs) has been recently explored for molecule detection.14 Based on some recent research in H2S adsorption,15 the high chemical stability, and the apparent advantages by only using small quantities,16 MOF materials are promising candidates for H2S detection. For example, fluorescence detection using MOF materials has been studied for detecting water pollutants,17 explosives18 and aromatic compounds.19 Specifically, MOF materials are also applied to detect H2S in the gas phase, for example, a Zr-MOF was used as a fluorescence turn-on detector for H2S.20 However, the fluoresce detection in the gas phase or the H2S quantification is poorly studied using MOF materials.
Thus, a chemically stable Bi(III)-based MOF material denoted as SU-101 (ref. 21) (microporous bismuth ellagate framework (Bi2O(H2O)2(C14H2O8)·nH2O), C14H2O8 = ellagate) was selected to investigate qualitative H2S detection in the gas phase and quantitative sensing using a solution of H2S in dry THF. SU-101 shows each Bi(III) metal centre is six coordinated, establishing three bonds with coordinating phenolates, two μ4-oxygens, and a terminally coordinated water molecule (Fig. 1), which can be removed after an activation process.21 Previously, SU-101 was reported for H2S adsorption, where it was demonstrated that the H2S adsorption generates spontaneous conversion into polysulfides.21,22 Then, taking advantage of such specific chemical transformation, the detection of H2S with SU-101 was investigated.
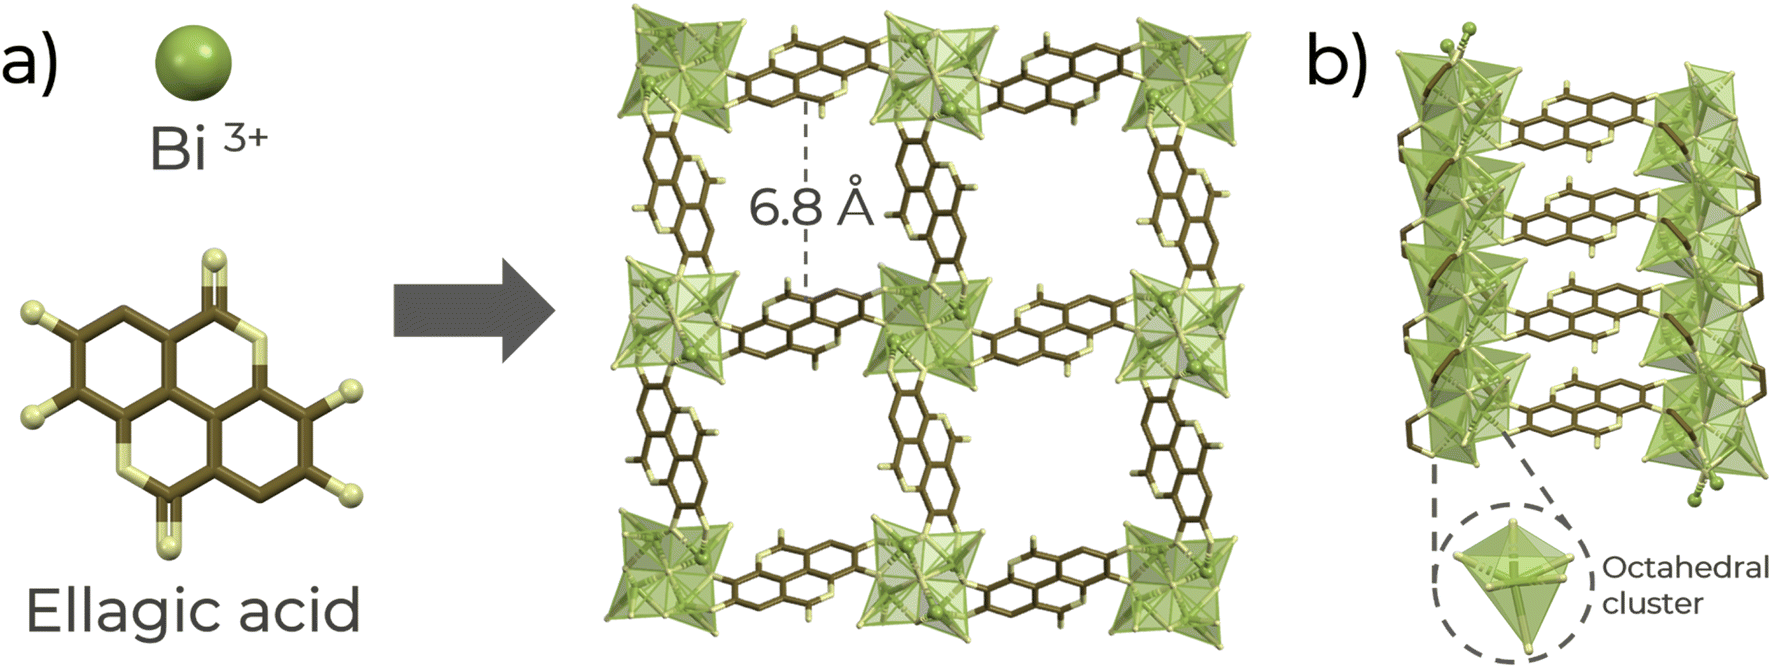 | ||
| Fig. 1 (a) Schematic of the formation of the SU-101 structure along the channel a-axis and (b) metal cluster and linker arrangement along the a-axis. Atoms label: green: Bi3+ octahedra, brown: carbon, and yellow: oxygen. | ||
Experimental section
Synthesis of SU-101
SU-101 was synthesised following a previously reported procedure.21 0.015 g of ellagic acid and 0.038 g of bismuth(III) acetate were dissolved in 30 mL of a water and acetic acid mixture (6 vol% acetic acid). First, the solution was stirred vigorously at room temperature for 48 h. Later, the recovered powder was washed three times with water and ethanol. After that, the powder was dried overnight at 60 °C. Subsequently, the material was activated at 150 °C and under vacuum to evacuate any molecule trapped within the pores of SU-101.Instruments
Detailed information on the instrumental techniques is available in Section S1.Fluorescence experiments
Emission spectra were taken in an Edinburgh Instrument FS5 fluorimeter using a continuous wave 150 W ozone-free xenon arc lamp at room temperature, coupled with an SC-10 solid-state sample holder. Measurements were carried out using an excitation wavelength of 370 nm, with a 395 nm long-pass filter on the detector side to remove any remaining light from the excitation source. The measurements were collected with a step size of 1 nm and a dwell time of 0.2 s. The excitation bandwidth was set at 5 nm, and the emission bandwidth for the detector was set at 1 nm. Decay time spectra were measured by exciting the sample with a picosecond pulsed light emitting diode EPL-375 with an excitation wavelength of 374.2 nm and a pulse width of 52.9 ps at an emission wavelength of 460 nm. The samples were packed into quartz sample holders and positioned into the instrument for solid-state measurements. Both the activated and saturated samples were packed right after being taken out of the activation and saturation processes. A suspension of SU-101 in THF (1 mg mL−1) was prepared for the solution measurements. Also, solutions of H2S in THF at different concentrations (10–100 mM) were prepared. In this case, 2.5 mL of the SU-101 suspension and 0.5 mL of the various concentrations of H2S were mixed and measured.Computational methods
Results and discussion
Characterization of SU-101
Powder X-ray diffraction (PXRD) confirmed the phase purity of SU-101 (Fig. S1†). At 2θ, peaks at 6.7, 9.6, 13.4, and 26.7° can be observed, which are in good agreement with the pure crystal structure.21 Fourier transform infrared (FT-IR) spectroscopy shows specific bands for the functional groups of SU-101 (Fig. S2†). The bands at 1703 and 1056 cm−1 are related to C![[double bond, length as m-dash]](https://www.rsc.org/images/entities/char_e001.gif) O stretching and O–H in-plane deformation from the organic linker.21 The band at 1367 cm−1 confirms the chemical coordination between the ellagic acid and the Bi3+ sites. The characteristic band of phenolate stretching vibration in the ellagate anion at 3411 cm−1 is observed. The band at 1465 cm−1 is related to the aromatic ring vibrations.21 The TGA profile of SU-101 (Fig. S3†) shows moderate thermal stability up to 280 °C and indicates that the guest solvent molecules can be removed at 150 °C after activation. SEM images (Fig. S4†) show the morphology characteristics of SU-101, displaying a homogeneous columnar crystal.
O stretching and O–H in-plane deformation from the organic linker.21 The band at 1367 cm−1 confirms the chemical coordination between the ellagic acid and the Bi3+ sites. The characteristic band of phenolate stretching vibration in the ellagate anion at 3411 cm−1 is observed. The band at 1465 cm−1 is related to the aromatic ring vibrations.21 The TGA profile of SU-101 (Fig. S3†) shows moderate thermal stability up to 280 °C and indicates that the guest solvent molecules can be removed at 150 °C after activation. SEM images (Fig. S4†) show the morphology characteristics of SU-101, displaying a homogeneous columnar crystal.
H2S adsorption performance
Prior to the detection performance for SU-101, an activated sample was evaluated for H2S uptake. A breakthrough H2S experiment (4.3 vol% H2S with 95.7 vol% of N2) led to a gas uptake of 15.64 mmol g−1, i.e., 531 mg g−1 (Fig. S6†). This H2S capture value is in good correlation with the previous value reported (15.95 mmol g−1, i.e., 542 mg g−1),21 and on a second H2S adsorption cycle, the initial capacity was lost (0.1 mmol g−1, Fig. S7†), which confirms the formation of polysulfides inside the pores of SU-101, as we previously observed.21 The chemical stability was confirmed by PXRD (Fig. S8†); moreover, the effectiveness of SU-101 in detecting H2S due to the chemical transformation of H2S into polysulfides was evaluated. As a proof of concept, the conversion of H2S (to polysulfides) as a function of time was analysed using gas chromatography (Table S1†). The conversion of H2S was observed from 0.06 mmol g−1 at 120 s to 0.73 mmol g−1 at 670 s. It is worth mentioning that once SU-101 is exposed to H2S, due to the chemical transformation to polysulfides, the sample cannot be re-used (re-activated).Fluorescence H2S detection
Furthermore, the fluorescence detection of H2S using SU-101 was performed. First, the UV-Vis spectra of SU-101 were recorded (Fig. 3d). It was identified that at 390 nm, the material can be excited. The photoluminescence (PL) emission was measured at different excitation wavelengths (Fig. S9†). It shows a broad PL peak centred at 461 nm. The higher intensity was at the excitation wavelength of 370 nm. Subsequently, the PL emission spectra of the organic linker and SU-101 were recorded (Fig. 2a). The linker shows an emission maximum at 465 nm, whereas that of SU-101 is at 461 nm. The intense emission from the organic ligand could be related to a π* → π electronic transition, typical in conjugated bonded systems.27 It is observed that after the formation of SU-101, the emission from the linker is quenched, which is associated with a ligand–metal charge transfer.28 The LMCT process occurs when, upon excitation of the system, an electron in a π* orbital of the ligand is transferred to an empty d orbital of the metal. In the case of SU-101, Bi(III) accepts charge from the linker (ellagic acid). After coordination, the interaction between the ligand and metal orbitals can result in a slight increase in the energy difference between the excited and fundamental states,29 which causes the emission maximum to slightly blueshift (toward 461 nm, shorter wavelengths).30 This charge transfer also decreases the intrinsic fluorescence of the ligand at the competition between two processes: the fluorescence emission from the excited state of the ligand and the non-radiative transfer of energy to the metal.31 As a result, the observed emission from SU-101 is not only from the ligand but is a combined phenomenon in which the charge is redistributed between the ligand and the metal.32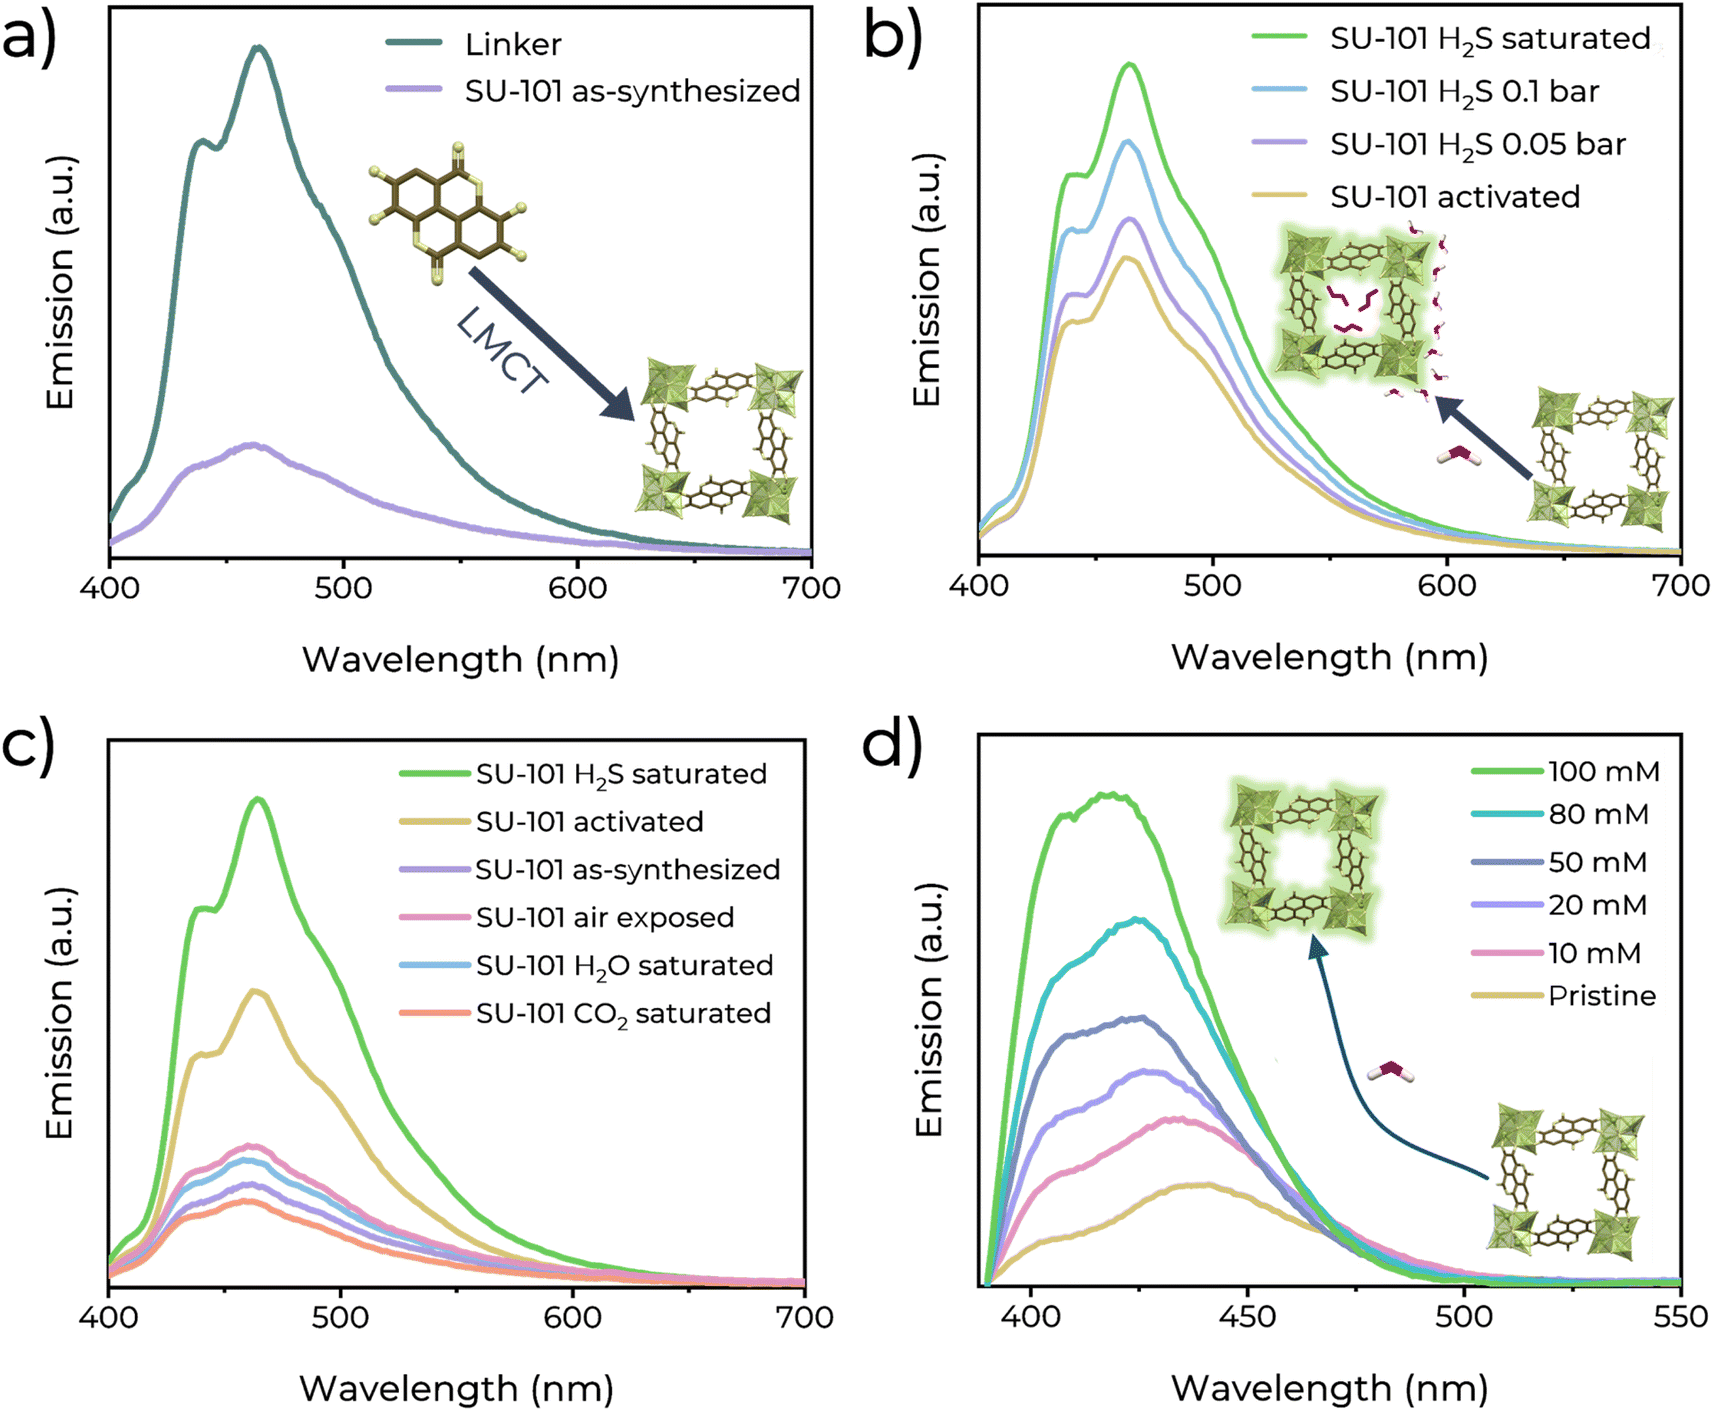 | ||
| Fig. 2 (a) Solid-state emission spectra of the ellagic acid linker (brown) and as-synthesized SU-101 (yellow). (b) Comparison of the solid-state emission spectra of activated SU-101 and SU-101 exposed to different H2S gas pressures. (c) Comparison of the solid-state emission spectra of SU-101 exposed to air, water vapour and different gases. (d) Fluorescence emission spectra of dispersed SU-101 in H2S solutions in THF. | ||
It is worth mentioning that, after the activation process, host molecules such as water, solvents or other adsorbates that may be occupying the pores of the MOF are removed. These molecules may be attenuating the fluorescence of SU-101 in its pristine state by facilitating certain non-radiative energy dissipation mechanisms, and upon removal the MOF framework is freer to emit light, resulting in higher emission efficiency. Moreover, to determine the change in the fluorescent behaviour, SU-101 was exposed to different gases (H2S, H2O, CO2, and air) in an in-house designed ex situ adsorption system (Fig. S5†). From H2O, CO2, and air exposed SU-101 samples, the PL emission spectra are similar to those of the as-synthesized SU-101 (Fig. 2c), and slight minor changes are observed after exposure to these gases. However, after the exposure to H2S, the PL emission spectra increased by 62.45% concerning the emission of activated SU-101 (and 289% concerning the as-synthesized emission), indicating the high selectivity for H2S (Fig. 2b). This PL change in intensity could be accredited to a turn-on effect due to the electronic outcome that H2S applies to the SU-101 framework.33 Then, a reproducibility test was conducted (Fig. S10†). Five independent samples of SU-101 were saturated with H2S, and consistently, the same turn-on performances were found.
Then, the detection properties of SU-101 under non-saturated H2S conditions: low H2S pressure. H2S pressure can be correlated with H2S detection at low H2S concentrations, and therefore, we needed to investigate any photoluminescence response at low H2S pressures (0.05 and 0.1 bar, Fig. 2b). First, an activated sample of SU-101 was exposed to 0.05 bar H2S, and the emission spectrum was measured. Interestingly, the broad photoluminescence peak remained centred at 461 nm, and an increase in emission intensity of approximately 13.74% with respect to the pristine sample (and 168.07% with respect to the as-synthesized emission) was observed. Later, an independent activated sample of SU-101 was exposed to 0.1 bar H2S, and an increase in emission intensity of approximately 37.93% with respect to the activated sample (and 225.11% concerning the as-synthesized emission) was recorded.
Furthermore, the quantitative response (sensing) of SU-101 for H2S was measured using a solution of H2S in dry THF (Fig. 2d). It is observed that an enhancement in the PL emission is a function of the increased H2S concentration (10–100 mM). The limit of detection (LOD) value was calculated with the following formula: LOD = 3σ/m (signal-to-noise ratio, S/N = 3), where σ represents the standard deviation of the initial intensity of SU-101 in dry THF and m is the slope of the linear fit from the experimental data (Fig. S11†). The plot of fluorescence intensity vs. H2S concentration exhibited an excellent linear correlation (R2 = 0.9628), and the LOD was calculated to be as low as 0.65 mM (∼22.16 ppm) H2S.
Fluorescence mechanism
Finally, to investigate the plausible mechanism of H2S detection by SU-101, X-ray photoelectron spectroscopy (XPS), Raman spectroscopy, UV-vis spectroscopy, and time-resolved photoluminescence (TRPL) experiments were conducted. XPS analysis confirmed the formation of polysulphide in SU-101; a 225 eV signal appears in the survey spectra after saturation with H2S (Fig. 3a), which is associated with the appearance of S 2s.34 The Bi 4f region was inspected in detail (Fig. 3b) and shows two unequal peaks at 159.3 and 164.6 eV associated with Bi 4f7/2 and 4f5/2, displaying a separation of 5.3 eV, which is in line with the Bi3+ oxidation state.35 In addition, a small peak is observed at around 161.7 eV, and is assigned to terminal sulphur atoms (n-ST−1) in polysulfide compounds, indicating that a short-chain polysulfide is present after the H2S saturation.36 For the S 2s region it is observed that the spectrum of pristine SU-101 shows a flat signal (Fig. 3c), but in contrast, for the H2S saturated material a signal corresponding to the different sulphur states present in the polysulfides formed is observed. Two main contributions are obtained, one located at 225.8 eV and the other at 227.8 eV. The first signal at 225.8 eV has been assigned to the sulphide species (S2−).37,38 For the second peak, located at 227.8 eV, we propose that this corresponds to the polysulfide species (Sn) in central positions,39 which could be slightly more oxidised. In addition, it has been reported that, in general terms, the lower energy signal is assigned to the more sulphur reduced form,40 in good agreement with our hypothesis. | ||
| Fig. 3 (a) XPS survey spectra of activated SU-101 (yellow) and SU-101 saturated with H2S (green). (b) Bi 4f/S 2p regions for XPS spectra of H2S-saturated SU-101. (c) Comparison of S 2s regions for XPS spectra of SU-101 saturated with H2S and pristine SU-101. (d) Raman spectra of activated SU-101 (yellow) and SU-101 saturated with H2S (green). (e) UV-vis spectra of activated SU-101 (yellow) and SU-101 saturated with H2S (green). (f) TRPL spectra of activated SU-101 (yellow) and SU-101 saturated with H2S (green). | ||
Using a saturated SU-101 sample with H2S, a Raman spectrum (Fig. 3d) was collected. Characteristic peaks appeared at 243 cm−1 corresponding to different Sn2− species41 and another at 445 cm−1 corresponding to S42−,42 confirming the chemical transformation of H2S to polysulfides as we previously reported,21 without decomposing the crystalline structure of SU-101 as confirmed by PXRD (Fig. S12†). Additionally, it is observed that the signal related to the CO bond43 is shifted from 1604 to 1619 cm−1 after the exposure to H2S. This shift can be attributed to the change in the chemical environment of these groups after the interaction of H2S with the metal centres of Bi3+. Upon formation of the polysulfides, the structural rigidity of the system is modified, which alters the interactions between the metal and the linker and changes the electron density distribution in the CO groups, resulting in the increase of the vibrational energy of the bonds, which translates into a shift towards higher frequencies.
Furthermore, changes due to the formation of polysulfides are also observed in the UV-vis spectra (Fig. 3e). The spectrum of activated SU-101 shows a weaker absorption that predominates in the range from 200 to 420 nm, while the spectrum of the H2S saturated material shows a more intense and extended absorption towards longer wavelengths, up to approximately 620 nm. This extension of absorbance is related to the formation of short-chain polysulfides, and it is widely reported that Sn2− species and polysulfide radicals have absorbances ranging from 270 to 610 nm.39,44 Some examples are: [S4]2− (420 nm), [S3]2− (340, 270 nm), [S2]˙− (426 nm), [S3]˙− (617 nm), and [S4]˙− (490 nm). This corroborates that the formation of polysulfide species directly impacts the optical properties of SU-101.
Raman and XPS results indicate that, after H2S adsorption, polysulfides (Sn2− and S42−), more rigid structure species than H2S, are formed within the pores of SU-101 which clearly impacts the light absorption properties and the fluorescence emission intensity of the system. Thus, the formation of polysulfides rigidifies the MOF structure, decreasing molecular motions and internal vibrations, which reduces the non-radiative energy dissipation pathways, allowing a greater proportion of the excited energy to be released in the form of fluorescence emission.30 Likewise, the polysulfides would be blocking the LMCT process that generated the fluorescence of SU-101.32 This process is interrupted by the interaction of the polysulfides formed, which can act as electron donors, with the Bi(III) centre, and this interaction would prevent the metal centre from accepting the charge coming from the π* orbitals of the ligand. In this way, the LMCT becomes less efficient, which favours a greater amount of excited energy being released as light instead of dissipating through the LMCT, thus resulting in the turn-on effect of fluorescence after H2S adsorption.
Additionally, calculations of the energy gap between the HOMO–LUMO orbitals were performed using the Tauc method considering both direct and indirect transitions.45 For the activated material, the energy values were 2.32 eV (direct) and 2.20 eV (indirect) (Fig. S13a and S13b†), while for the material saturated with H2S, the values decreased to 1.83 eV (direct) and 1.73 eV (indirect) (Fig. S13c and S13d†). It is important to mention that, in molecular-type systems, the Tauc method usually underestimates or overestimates the band gap with respect to theoretical values.46,47 However, in this work, the Tauc method is used for comparative purposes. The reduction in the HOMO–LUMO energy suggests that the interaction between SU-101 and H2S causes an electronic restructuring of the material, in which the formation of new energy levels could be occurring.48 Actually, it has been reported that the transition energy between the HOMO and LUMO levels is related to light absorption and the smaller the HOMO–LUMO separation, the longer the absorption wavelength,49 which is observed in the spectrum of SU-101 exposed to H2S. Likewise, the decrease in the energy gap observed in the H2S-saturated material could be facilitating electronic transitions, which could explain the increase in absorption and the possible activation of new sensing mechanisms, such as the blocking of the LMCT mechanism.
It should be noted that the energy gap between the calculated HOMO–LUMO orbitals can only approximate the fundamental gap between the ground (S0) and excited (S1) states, as it is strongly dependent on the method used to calculate it. The separation between the S0 and S1 states is not only determined by the HOMO–LUMO gap, but is also influenced by the excitonic binding energy,50 which represents the interaction between the electron and the hole after excitation. However, with the data obtained from UV-vis spectroscopy, we propose a general idea of what is happening at the molecular level. By reducing the HOMO–LUMO energy (Fig. 4a), it can be deduced that the separation between the energy levels (S0 and S1) of the Jablonski diagram would also be reduced (Fig. 4b), facilitating radiative transitions from the excited state (S1) to the ground state (S0) and reducing non-radiative losses (such as vibrations). This would increase the probability of efficient radiative emission, resulting in the observed “turn-on” effect.
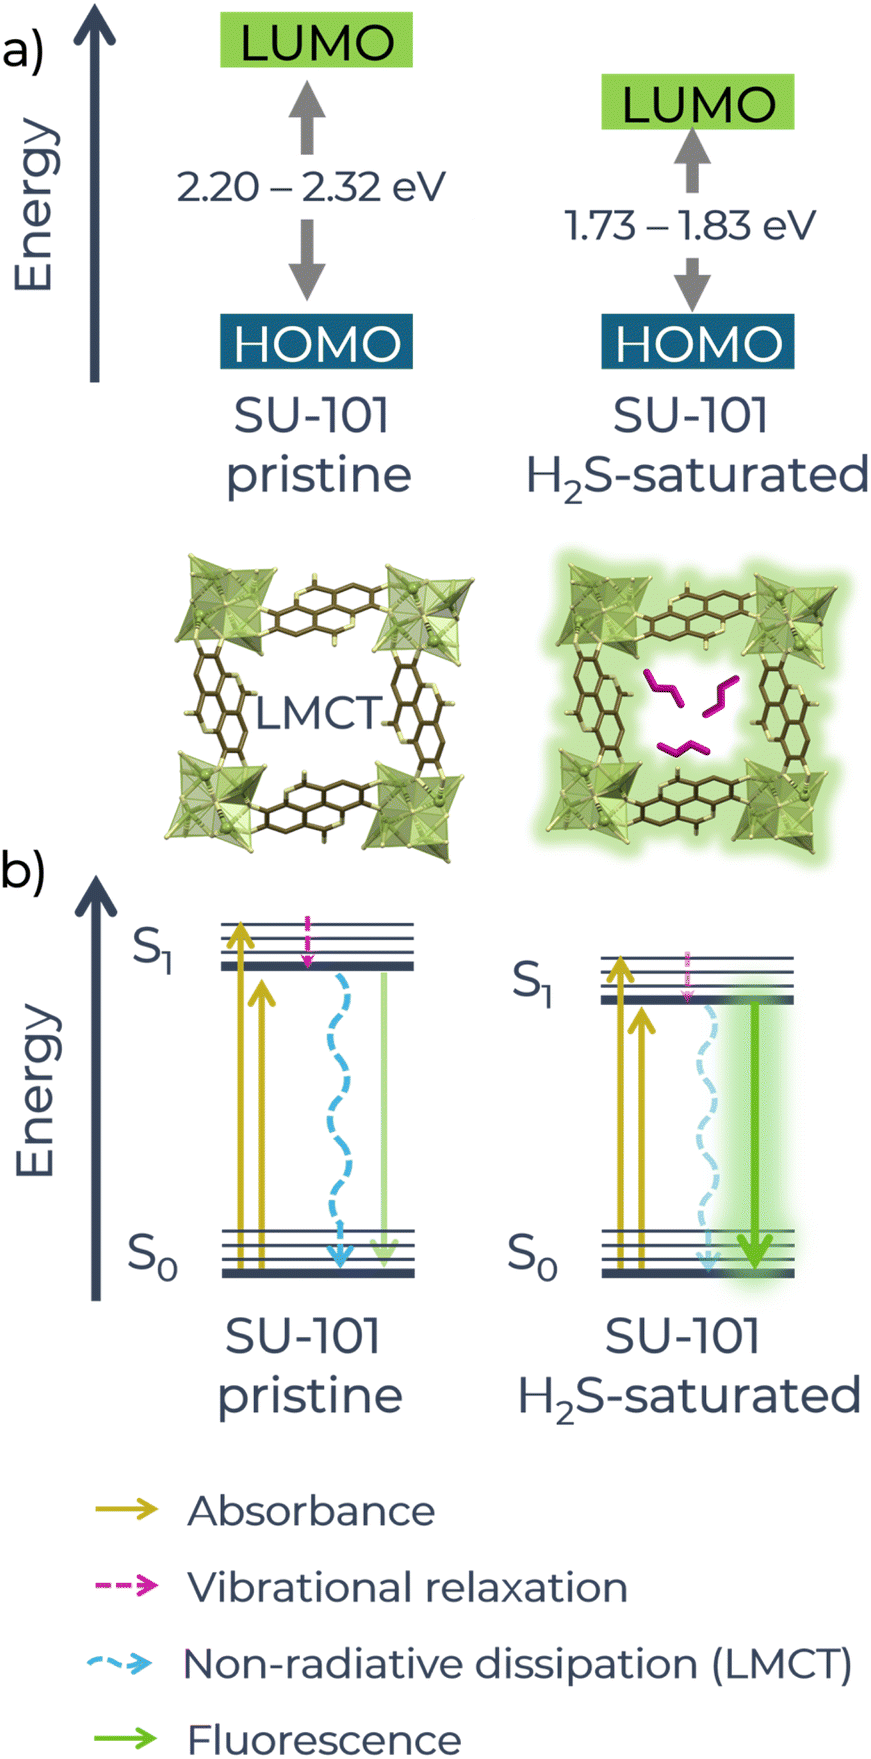 | ||
| Fig. 4 (a) Schematic of the changes in the HOMO–LUMO energy of pristine and H2S-saturated SU-101 material. (b) Schematic of the Jablonski diagram that would explain the changes in the fluorescence of the system. | ||
On the other hand, when the material is exposed to CO2 and H2O there was no significant change in the fluorescence emission, in comparison to H2S. We rationalise that this is because these molecules do not cause a significant chemical interaction within the pores of SU-101, in contrast to H2S. In other words, these molecules do not interact with the material in a way that modifies its structure or affects the LMCT process that determines the fluorescence emission in the material. As a result, the fluorescence of the MOF remains virtually unchanged when exposed to these gases, without producing the “turn-on” or increase in fluorescence that is observed with H2S.
Finally, TRPL experiments were carried out using a 370 nm picosecond-pulsed LED as the excitation source and performed on an activated sample of SU-101 and an H2S-saturated sample. The PL decay spectra was measured at 461 nm (Fig. 3f), showing that the average decay lifetimes increased upon H2S exposure (Table S3†). The average fluorescence lifetime of the activated sample was 1.92 ns, while the lifetime of the H2S saturated sample was 2.94 ns. To provide an explanation for this increase in fluorescence time, the components (τ) and their contributions to the total fluorescence time can be examined.51–53
In both cases, τ1 is the fastest component (τ1(act) = 0.09 ns and τ1(H2S) = 0.06 ns), since it has an extremely short lifetime, which suggests that it represents a fast relaxation process, probably non-radiative;54 for the activated sample its relative contribution is a1(act) = 18.96%, while for the saturated sample its contribution decreases to a1(H2S) = 5.48%, which would be manifesting that these fast non-radiative relaxation processes decreased considerably after saturation with H2S. On the other hand, τ2 is a component with an intermediate lifetime (τ2(act) = 0.87 ns and τ2(H2S) = 1.18 ns), which could represent a mixture of radiative and non-radiative processes; its contribution has a slight increase after saturating the sample (from a2(act) = 34.15% to a2(H2S) = 37.44%) which indicates that the intermediate decay processes have gained in efficiency, which may be due to the stiffening of the MOF framework after H2S adsorption, which reduces the non-radiative losses. Finally, the τ3 and τ4 components with slow times represent different radiative mechanisms, i.e., more efficient processes in light emission.38,39 In both cases their contributions increase after saturation with H2S, for τ3 from a3(act) = 36.78% to a3(H2S) = 41.38% and for τ4 from a4(act) = 10.11% to a4(H2S) = 15.70%, the increase in the value of these two components is an indication that the structural stiffening induced by the formation of polysulfides and the LMCT process block generates the reduction of internal vibrations and non-radiative mechanisms, as represented in the Jablonski diagram in Fig. 4b, introducing a higher degree of stability in the system, allowing a longer and more efficient radiative emission.
Polysulfides interaction on SU-101: electronic structure calculations
In order to examine the interaction of polysulfide species formed inside the SU-101 structure from an atomistic perspective, the spatial structure of the MOF is obtained from the CIF file previously reported by Grape et al.21 To start this geometry, we build a supercell of size 2 × 2 from the unit cell. The representative optimised geometry of the SU-101 is shown in Fig. S13(a).† The relaxed structure corresponds to a supercell with dimensions of a = b = 18.62 Å and c = 11.09 Å. This configuration was designed to create the characteristic micropore of SU-101, capable of stabilising small polysulfide species of varying sizes. The crystal structure is depicted in Fig. S13(b),† where the formation of octahedra around the Bi(III) metallic centres is evident. Additionally, the partial density of states (PDOS), shown in Fig. S13(c),† shows that the electronic contributions from C and O atoms are concentrated near the Fermi level, while Bi(III) atoms exhibit minimal contributions just above it. These findings suggest that charge transfer processes are primarily influenced by the ligand atoms, with the metal centres playing a comparatively minor role.In order to investigate the stability and potential formation of polysulfide species, we examined small clusters of H2Sx (x = 1, 2, 4, 6, 8) of different sizes. The optimised molecular structures are shown in Fig. S14,† where the average bond length between different clusters is approximately 2.09 Å (S–S). Geometry relaxed calculations were carried out for all H2Sx clusters inside the pore of SU-101. The final configurations are illustrated in Fig. S15.† For the H2S molecule that interacts with the surface of SU-101, it demonstrates an interaction with the metallic centre of Bi(III) at a distance of 3.12 Å, while simultaneously sharing its proton with a nearby oxygen atom (see Fig. S15(a)†). When analysing the interactions with polysulfide species, the configurations after geometry relaxation are shown in Fig. S15(b–e).† It can be observed that the H2Sx=2–8/SU-101 molecules do not interact directly with the metallic centres of Bi(III). In these cases, the polysulfide molecules lose their initial configuration but remain confined within the pore of SU-101. In particular, the closest S–O interaction is observed in the H2S8/SU-101 configuration, with a distance of 2.34 Å, while the H2S4/SU-101 configuration exhibits the largest S–O distance of 3.56 Å. This behaviour is attributed to variations in the attraction between the molecule and the micropore surface. For H2S2/SU-101 and H2S6/SU-101, the S–O interaction distances are relatively similar, measuring 3.00 Å and 3.06 Å, respectively. These findings reveal a correlation between the size of certain polysulfides and their interaction strength with the surface of SU-101. To further understand these interactions, we performed adsorption energy calculations (Eads), providing insight into the energetic stability of the studied configurations. Eads is obtained from the following expression: Eads = Eint − (ESU-101 + EH2Sx), where Eint corresponds to the total energy of the system adsorbate/SU-101 surface; ESU-101 is the total energy of the relaxed structured MOF, and EH2Sx is the total energy of the polysulfide species under study. The negative values are related to the exergonic interaction between the adsorbate and the surface of SU-101. The results of the Eads values are reported in Table S4.† All Eads values are exergonic, indicating a favourable interaction of the adsorbates within the pore of SU-101. Particularity, the H2S/SU-101 configuration shows Eads = −1.30 eV, which corroborates the formation of H2S-saturated SU-101. It is worth mentioning that from H2S4 (−0.87 eV), H2S6 (−1.01 eV), and H2S8 (−1.78 eV) molecules the Eads values begin to increase; this behaviour corroborates the presence of polysulfide molecules of different sizes within the micropore of SU-101. To understand the charge transfer mechanism behind the interaction between the adsorbates and the SU-101 material, the density difference isosurfaces (Δρ) were plotting according to: Δρ = ρtotal – ρadsorbate − ρsurface, where ρtotal is the electron density of the system adsorbate/SU-101 surface, ρadsorbate is the electron density of the polysulfide species under study, and ρsurface refers to the electron density of the SU-101 structure. Fig. 5 represents the Δρ for each interaction under study. In the case of the H2S/SU-101 configuration, the regions of electron density removal (Fig. 5a) between the S–Bi atoms are evident, this mechanism favours a high Eads value. The same mechanism is observed for the case of the H2S8/SU-101 interaction between the S–O atoms (Fig. 5d). The systems H2S2/SU-101 and H2S6/SU-101 show charge accumulation (red colour) on the S atoms and charge density removal between the O–H atoms (blue colour). The H2S4/SU-101 interaction presents a characteristic behaviour because charge accumulations are present between the S atom and the ligand fragment. The accumulation of charge in S2–8 small polysulfides is evident, which can be correlated with the nature of the charge species. Thus, Δρ shows evidence of how the organic fragments of the MOF material are involved in the interaction process. Finally, TD-DFT calculations were performed to simulate UV-vis absorption spectra, as shown in Fig. S16.† The results reveal that the behaviour and shape of the spectra are largely influenced by the SU-101 material. In particular, the maximum absorption peak is observed when H2S8 interacts with SU-101. This indicates that the size of the polysulfides within the SU-101 structure significantly affects its optical response.
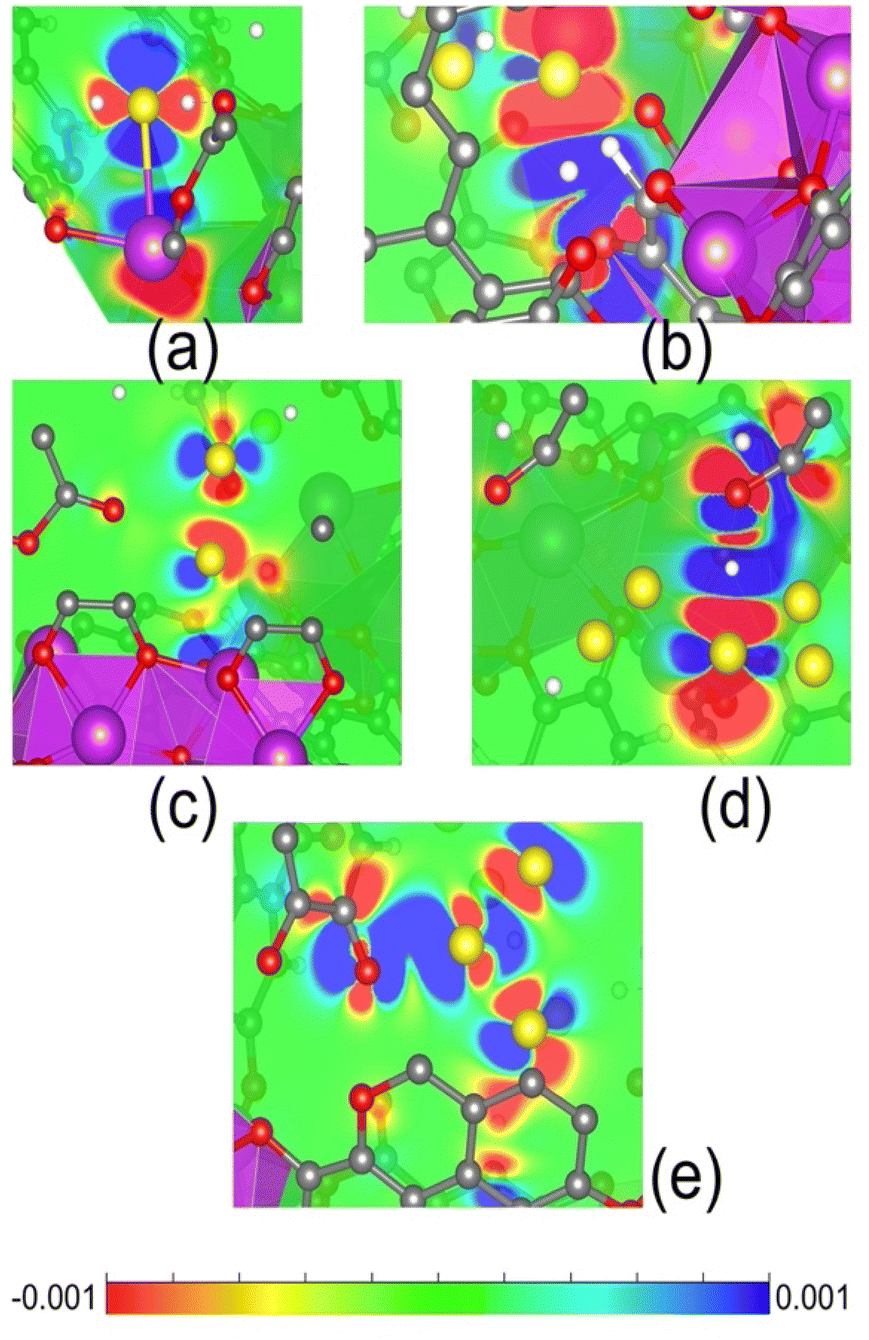 | ||
| Fig. 5 2D plot of the electron density difference of (a) H2S/SU-101, (b) H2S2/SU-101, (c) H2S4/SU-101, (d) H2S6/SU-101, and (e) H2S8/SU-101. Blue regions of 2D slices represent sites from which the electronic charge was depleted, and the red areas refer to the locations where the charge is accumulated (an isovalue of 0.001 e Å−3). | ||
Conclusions
In summary, the detection properties of a structurally stable Bi(III)-based MOF material, SU-101, were investigated by fluorescence experiments. These demonstrated a significant change in the emission spectra after H2S adsorption (chemical transformation to polysulfides), with a clear H2S detection selectivity (over H2O and CO2) and a reproducible H2S response when SU-101 was exposed to 0.05 bar H2S, 0.1 bar H2S and when this material was saturated with H2S (i.e., 1 bar H2S). Remarkably, the limit of H2S detection (LOD) was calculated to be as low as 0.65 mM (∼22.16 ppm). The fluorescence enhancement is attributed to the chemical transformation of H2S into polysulfides within the pores of the material confirmed by Raman and XPS experiments, which induced a rigidification in the structure of the system, decreasing the molecular vibrations. In addition, the electron-donor character of the polysulfides formed generates interactions with the Bi(III) metal centre, creating a blockage in the LMCT process, which decreased certain non-radiative processes, affording a “turn-on” effect in the fluorescent emission. Analysis of the UV-vis spectra of SU-101 before and after H2S adsorption reveals significant changes in the optical properties of the material. The reduction of the bandgap, determined by the Tauc method, shows that the polysulfide formation introduces new discrete energy levels within the original gap of the material, allowing electronic transitions at lower energies, which facilitates light absorption in a broader region of the spectrum. Time-resolved photoluminescence (TRPL) experiments provided further insight into the detection mechanism, confirming that the increased fluorescence lifetime observed after H2S exposure is due to the reduction of non-radiative dissipation mechanisms. DFT calculations shows that the adsorption energy increases with the size of the polysulfide chain, as observed for the interaction of H2S4, H2S6, and H2S8 molecules within the SU-101 material. Overall, this study postulates this chemically stable Bi(III)-based MOF material, SU-101, as a promising candidate for H2S detection.Data availability
All data is available in the main text and in the ESI.†Conflicts of interest
There are no conflicts to declare.Author contributions
Valeria B. López-Cervantes: methodology, formal analysis, investigation, data curation, writing – original draft. Juan L. Obeso: methodology, formal analysis, investigation, writing – original draft. J. Gabriel Flores: methodology, formal analysis, investigation, writing – original draft. Aída Gutiérrez-Alejandre: validation, supervision, resources. Raul A. Marquez: investigation, validation, formal analysis. José Antonio de los Reyes: resources, visualization. Catalina V. Flores: investigation. N. S. Portillo-Vélez: investigation. Pablo Marín-Rosas: investigation. Christian A. Celaya: computational calculations. Eduardo González-Zamora: resources, visualization. Diego Solis-Ibarra: conceptualization, resources, project administration, supervision, visualization. Ricardo A. Peralta: conceptualization, resources, supervision, writing – review & editing, visualization. Ilich A. Ibarra: conceptualization, resources, funding acquisition, project administration, supervision, writing – review & editing, visualization.Acknowledgements
V. B. L.-C. and J. L. O. thank CONAHCYT for the PhD fellowships (1005649 and 1003953). R. A. P. thanks the Autonomous University of Mexico-Iztapalapa, Mexico, for the financial support. V. B. L.-C. thanks Professor E. Sánchez-González for scientific discussions. We thank U. Winnberg (Euro Health) for scientific discussions and G. Ibarra-Winnberg for scientific encouragement. I. A. I. thanks PAPIIT UNAM (IN201123), México, for financial support. C. A. C. wants to acknowledge CONAHCYT-México for the postdoctoral fellowship.References
- S. Batterman, A. Grant-Alfieri and S.-H. Seo, Crit. Rev. Toxicol., 2023, 53, 244–295 CAS
.
- D. H. Truong, M. A. Eghbal, W. Hindmarsh, S. H. Roth and P. J. O'Brien, Drug Metab. Rev., 2006, 38, 733–744 CAS
- R. O. Beauchamp, J. S. Bus, J. A. Popp, C. J. Boreiko, D. A. Andjelkovich and P. Leber, CRC Crit. Rev. Toxicol., 1984, 13, 25–97 CAS
- J. Zeng, M. Li, A. Liu, F. Feng, T. Zeng, W. Duan, M. Li, M. Gong, C. Wen and Y. Yin, Adv. Funct. Mater., 2018, 28, 1800515 Search PubMed
- Z. Meng, R. M. Stolz and K. A. Mirica, J. Am. Chem. Soc., 2019, 141, 11929–11937 CAS
- T. Ubuka, T. Abe, R. Kajikawa and K. Morino, J. Chromatogr. B Biomed. Sci. Appl., 2001, 757, 31–37 CAS
- R. Ferro, G. Borzone, G. Cacciamani and R. Raggio, Thermochim. Acta, 2000, 347, 103–122 CrossRef CAS
- W. Xuan, C. Sheng, Y. Cao, W. He and W. Wang, Angew. Chem., Int. Ed., 2012, 51, 2282–2284 CrossRef CAS PubMed
- C. Yu, X. Li, F. Zeng, F. Zheng and S. Wu, Chem. Commun., 2013, 49, 403–405 RSC
- A. Abbasi, S. Hanif and M. Shakir, RSC Adv., 2020, 10, 3137–3144 RSC
- N. A. Samak, M. S. Selim, Z. Hao and J. Xing, Talanta, 2020, 211, 120655 CrossRef CAS PubMed
- J. Liang, B. Z. Tang and B. Liu, Chem. Soc. Rev., 2015, 44, 2798–2811 RSC
- H. Li, Y. Fang, J. Yan, X. Ren, C. Zheng, B. Wu, S. Wang, Z. Li, H. Hua, P. Wang and D. Li, TrAC, Trends Anal. Chem., 2021, 134, 116117 CrossRef CAS
- S. Khatua, S. Goswami, S. Biswas, K. Tomar, H. S. Jena and S. Konar, Chem. Mater., 2015, 27, 5349–5360 CrossRef CAS
- E. Martínez-Ahumada, A. López-Olvera, V. Jancik, J. E. Sánchez-Bautista, E. González-Zamora, V. Martis, D. R. Williams and I. A. Ibarra, Organometallics, 2020, 39, 883–915 CrossRef
- T. He, X.-J. Kong and J.-R. Li, Acc. Chem. Res., 2021, 54, 3083–3094 CAS
- E. Zhang, L. Wu, L. Jiang, K. Guo, Z. Su and P. Ju, J. Mol. Struct., 2022, 1264, 133314 CAS
- S. S. Nagarkar, B. Joarder, A. K. Chaudhari, S. Mukherjee and S. K. Ghosh, Angew. Chem., Int. Ed., 2013, 52, 2881–2885 CAS
- X. Lian and B. Yan, RSC Adv., 2016, 6, 11570–11576 CAS
- L. Guo, M. Wang and D. Cao, Small, 2018, 14, 1703822 Search PubMed
- E. S. Grape, J. G. Flores, T. Hidalgo, E. Martínez-Ahumada, A. Gutiérrez-Alejandre, A. Hautier, D. R. Williams, M. O'Keeffe, L. Öhrström, T. Willhammar, P. Horcajada, I. A. Ibarra and A. K. Inge, J. Am. Chem. Soc., 2020, 142, 16795–16804 CAS
- J. L. Obeso, D. R. Amaro, C. V. Flores, A. Gutiérrez-Alejandre, R. A. Peralta, C. Leyva and I. A. Ibarra, Coord. Chem. Rev., 2023, 485, 215135 CAS
- J. M. Soler, E. Artacho, J. D. Gale, A. García, J. Junquera, P. Ordejón and D. Sánchez-Portal, J. Phys. Condens. Matter, 2002, 14, 2745–2779 CAS
- J. P. Perdew, K. Burke and M. Ernzerhof, Phys. Rev. Lett., 1996, 77, 3865–3868 CAS
- N. Troullier and J. L. Martins, Phys. Rev. B:Condens. Matter Mater. Phys., 1991, 43, 1993–2006 CAS
- M. Gajdoš, K. Hummer, G. Kresse, J. Furthmüller and F. Bechstedt, Phys. Rev. B:Condens. Matter Mater. Phys., 2006, 73, 045112 Search PubMed
- Y. Song, Y.-Y. Chen, Q.-J. Huang, D.-L. Deng, Y.-Y. Zhao, M.-Z. Wu, S.-K. Wang and Y. Li, Polyhedron, 2023, 239, 116428 CAS
- J. Manzur, C. Poblete, J. Morales, R. C. De Santana, L. J. Queiroz Maia, A. Vega, P. Fuentealba and E. Spodine, Inorg. Chem., 2020, 59, 5447–5455 CAS
- A. M. May and J. L. Dempsey, Chem. Sci., 2024, 15, 6661–6678 CAS
- T. K. Pal, Mater. Chem. Front., 2023, 7, 405–441 RSC
- F. Juliá, ChemCatChem, 2022, 14, e202200916 CrossRef
- Y. Zhao, J. Wang, W. Zhu, L. Liu and R. Pei, Nanoscale, 2021, 13, 4505–4511 CAS
- S. S. Nagarkar, T. Saha, A. V. Desai, P. Talukdar and S. K. Ghosh, Sci. Rep., 2014, 4, 7053 CrossRef CAS PubMed
- M. Fantauzzi, B. Elsener, D. Atzei, A. Rigoldi and A. Rossi, RSC Adv., 2015, 5, 75953–75963 RSC
- J. Rodriguez-Pereira, S. A. Rincón-Ortiz and R. Ospina, Surf. Sci. Spectra, 2020, 27, 024001 CrossRef CAS
- R. A. Marquez, J. L. Obeso, R. R. Vaidyula, V. B. López-Cervantes, R. A. Peralta, P. Marín Rosas, J. A. De Los Reyes, C. B. Mullins and I. A. Ibarra, J. Mater. Chem. A, 2024, 10, 1039 Search PubMed
- V. V. Atuchin, L. I. Isaenko, V. G. Kesler and S. I. Lobanov, J. Alloys Compd., 2010, 497, 244–248 CrossRef CAS
- T. R. N. Kutty, Mater. Res. Bull., 1991, 26, 399–406 CrossRef CAS
- R. Steudel and T. Chivers, Chem. Soc. Rev., 2019, 48, 3279–3319 RSC
- E. Cato, A. Rossi, N. C. Scherrer and E. S. B. Ferreira, J. Cult. Herit., 2018, 29, 30–35 CrossRef
- O. El Jaroudi, E. Picquenard, A. Demortier, J.-P. Lelieur and J. Corset, Inorg. Chem., 2000, 39, 2593–2603 CAS
- H.-L. Wu, L. A. Huff and A. A. Gewirth, ACS Appl. Mater. Interfaces, 2015, 7, 1709–1719 CAS
- K. I. Hadjiivanov, D. A. Panayotov, M. Y. Mihaylov, E. Z. Ivanova, K. K. Chakarova, S. M. Andonova and N. L. Drenchev, Chem. Rev., 2021, 121, 1286–1424 CAS
- N. Lau and M. D. Pluth, Curr. Opin. Chem. Biol., 2019, 49, 1–8 CrossRef CAS PubMed
- P. H. M. Andrade, C. Volkringer, T. Loiseau, A. Tejeda, M. Hureau and A. Moissette, Appl. Mater. Today, 2024, 37, 102094 CrossRef
- K. Fabrizio, K. N. Le, A. B. Andreeva, C. H. Hendon and C. K. Brozek, ACS Mater. Lett., 2022, 4, 457–463 CrossRef CAS
- P. R. Jubu, F. K. Yam, V. M. Igba and K. P. Beh, J. Solid State Chem., 2020, 290, 121576 CAS
- Q. Thijssen, J. A. Carroll, F. Feist, A. Beil, H. Grützmacher, M. Wegener, S. Van Vlierberghe and C. Barner-Kowollik, Mater. Horiz., 2024, 11(24), 6184–6191 CAS
-
I. Fleming and D. Williams, in Spectroscopic Methods in Organic Chemistry, Springer International Publishing, Cham, 2019, pp. 55–83 Search PubMed
- J.-L. Bredas, Mater. Horiz., 2014, 1, 17–19 CAS
- D. J. Liput, T. A. Nguyen, S. M. Augustin, J. O. Lee and S. S. Vogel, Neuroscience, 2020, 94, e108 Search PubMed
- T. A. Smith and K. P. Ghiggino, Methods Appl. Fluoresc., 2015, 3, 022001 Search PubMed
- S. K. Panigrahi and A. K. Mishra, J. Fluoresc., 2020, 30, 1085–1094 CAS
- A. Sharma, D. Kim, J.-H. Park, S. Rakshit, J. Seong, G. H. Jeong, O.-H. Kwon and M. S. Lah, Commun. Chem., 2019, 2, 39 Search PubMed
Footnotes |
| † Electronic supplementary information (ESI) available: Instrumental techniques and characterization. See DOI: https://doi.org/10.1039/d4sc07144a |
| ‡ These authors contributed equally to this manuscript. |
| This journal is © The Royal Society of Chemistry 2025 |