 Open Access Article
Monodispersed uranium atomic site on carbonaceous materials†
Yadong Li,
Yifei Dang,
Meng Jin,
Yuan Hu* and
Kecheng Cao *
*
Shanghai Key Laboratory of High-Resolution Electron Microscopy, School of Physical Science and Technology, ShanghaiTech University, Shanghai 201210, China. E-mail: caokch@shanghaitech.edu.cn; huyuan@shanghaitech.edu.cn
First published on 16th July 2025
Abstract
The adsorption behavior of uranium on carbon substrates proves crucial for nuclear energy, catalytic and environmental technologies. This study reveals distinct uranium immobilization mechanisms across graphene, amorphous carbon, and nanodiamonds by aberration-corrected TEM. While amorphous carbon and nanodiamonds effectively anchor atomic uranium through uranyl ion adsorption, pristine graphene exhibits inherent resistance to uranyl binding. Graphene captures dissociated uranium atoms from amorphous carbon only under electron beam irradiation. This study bridges critical knowledge gaps in uranium–carbon interactions, offering a foundation for designing carbon-supported catalysts and uranyl adsorption materials.
1. Introduction
Uranium's dual functionality as nuclear fuel and catalytic agent underpins its critical role in energy and chemical technologies.1–3 The fissile U-235 isotope enables controlled nuclear chain reactions for large-scale power generation, where graphite moderators optimize neutron thermalization to enhance U-235 capture efficiency.4–8 This interaction generates complex interfacial environments involving uranyl ions (UO22+) and radiation-modified graphite structures, posing significant challenges for long-term nuclear waste management and containment.9 Concurrently, U-238 demonstrates exceptional catalytic versatility through its unsaturated 5f/6d orbitals and multivalent states, driving theoretical and emerging experimental interest in uranium-based single-atom catalysts (U-SACs) for organic synthesis, environmental remediation, and energy conversion processes.10–21 Recent studies specifically point to the potential of uranium in SAC configurations, showing exceptional catalytic activity for reactions such as electrochemical nitrogen fixation reactions, photocatalytic reduction reactions, hydrogen evolution reactions, etc.1,22–26 However, harnessing uranium's potential in both realms requires precise control over its immobilization and dispersion on suitable substrates.Carbon matrices, central to many high-performance SACs/dual-atom-site catalysts (DSACs),27–30 are particularly promising for synergistically enhancing uranium's performance through tailored physicochemical interactions. Theoretical models predict superior catalytic activity in carbon-supported uranium single-atom systems,31 with graphene substrates showing potential for atomic uranium collection and spintronic applications.32 However, fundamental mechanisms governing uranium–carbon interactions at atomic scales remain unresolved. Crucially, understanding the spatial distribution dynamics and stability of uranium species across different carbon allotropes is essential for designing efficient, durable materials for both nuclear and catalytic technologies. It can also effectively promote the rational development of advanced applications, such as highly selective catalysts leveraging uranium's unique electronic structure, robust materials for nuclear fuel cycles and waste immobilization and next-generation spintronic or quantum devices utilizing isolated uranium atoms.
This study investigates uranium immobilization mechanisms across graphene, amorphous carbon, and nanodiamonds through atomic-resolution spherical aberration-corrected TEM (AC-TEM). Uranium adsorbs on graphene as discrete single atoms, preferentially accumulating at amorphous carbon regions rather than pristine graphene lattices, which represents a direct observation of uranium single-atom stabilization on graphene amorphous carbon. Electron beam irradiation induces graphene defect formation, driving uranium migration toward edge sites, which highlights the dynamic instability of uranium on pristine graphene under irradiation. Conversely, nanodiamonds stabilize uranium via surface-bound uranyl ions (UO22+), which demonstrate remarkable stability even under prolonged irradiation. These findings directly reveal carbon allotrope structure dependent uranium adsorption mechanisms with implications for monodispersed uranium atomic site design applications, such as radiation-resistant catalysts or stable nuclear waste forms.
2. Experimental section
2.1 Preparation of graphene
Polycrystalline graphene film (Cu-P1) was purchased from Beijing Graphene Institute (BGI). The coverage and monolayer rate of graphene are 99% and 90%, respectively. The maximum grain size of graphene is around 500 μm. The graphene grown on copper foil via chemical vapor deposition (CVD) synthesis was transferred onto gold mesh substrates (Quantifoil). The graphene-coated copper foil was bonded to a gold mesh by dropwise addition of isopropanol (Sinopharm, 99.9%) to enhance adhesion. The copper foil was subsequently etched by immersing the sample in 10% ammonium persulfate solution (Sinopharm) for 8 h. After that, it is repeatedly shaken in deionized water to remove residual ammonium persulfate and copper ions.2.2 Preparation of nanodiamonds
Dispersible nanodiamonds was purchased from XFNANO. The average particle size of nanodiamonds is between 5 and 10 nm, with a purity of 98%. Commercial nanodiamonds powder was dispersed in ethanol via ultrasonication. After sedimentation, the supernatant was drop-cast onto ultrathin carbon-film TEM grids.2.3 Adsorption of uranyl nitrate
For graphene film system, uranium adsorption was achieved by immersing the graphene–gold mesh assembly in 10 mL of 10 ppm uranyl nitrate solution (Sinopharm, 99.9%) for a few seconds, followed by drying under ambient conditions. For nanodiamonds system, the ethanol suspension of nanodiamonds was mixed with 10 ppm uranyl nitrate solution (Sinopharm, 99.9%) for 5 minutes. The mixture was centrifuged to remove excess solution, then was redispersed in ethanol, and ultrasonicated. The final supernatant was then drop-cast onto a special TEM ultra-thin carbon film carrier.2.4 Characterization
Specimens were prepared by depositing ethanol or aqueous dispersions onto TEM grids, followed by solvent evaporation under ambient conditions. Aberration-corrected high-resolution TEM imaging, bright field (BF)/high-angle annular dark-field scanning transmission electron microscopy (HAADF-STEM) imaging and energy dispersive spectroscopy (EDS) mapping were carried out on double spherical aberration (Cs)-corrected JEOL GRAND ARM 300F with a cold field-emission gun operated at 300 kV and 80 kV at room temperature. XPS was conducted using Thermo Fisher Scientific ESCALAB 250XI with high sensitivity and high-resolution quantitative imaging multifunctional surface analyzer. Raman spectra were recorded on Renishaw inVia (UK) confocal Raman microscope equipped with 532 nm lasers. X-ray diffraction (XRD) patterns were recorded on a Bruker X-ray diffractometer (D8 advance). A Cu Kα radiation target was employed with a voltage of 40 kV and a current of 40 mA. BET surface area and pore size analysis was carried out by N2 adsorption–desorption isotherms at 77 K collected from BSD-660M using liquid N2 Dewar for temperature control. The samples were degassed at 300 °C under vacuum for 6 h before measurement.2.5 TEM image simulation
HRTEM image simulations were implemented using QSTEM software under experimental conditions. Accelerating voltage of 80 kV (energy spread of 0.2 eV), chromatic aberration (Cc) of 1 mm, Cs of 1.5 μm, defocus of 1–2 nm, and defocus spread of 2 nm. Parameters were rigorously matched to the experimental conditions for direct comparability.3. Results and discussion
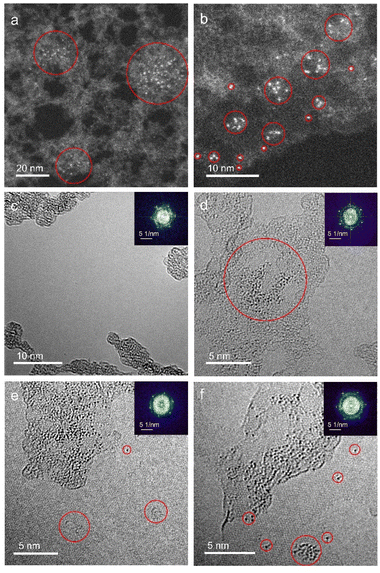
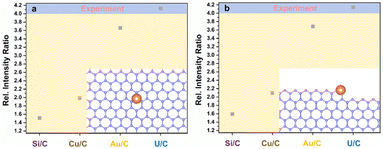
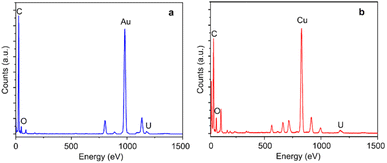
Monolayer graphene with amorphous carbon partly covered is applied to decorated with monodispersed uranium atomic sites via dip coating method. Fig. 1a and b characterizes uranium distribution on amorphous carbon covered graphene through HADDF-STEM, leveraging the atomic number contrast between carbon (Z = 6) and uranium (Z = 92). STEM and TEM imaging reveal preferential uranium cluster and atomic uranium site immobilization on amorphous carbon regions rather than pristine graphene surfaces (Fig. 1a–d and S1†). Inserted fast Fourier transform (FFT) patterns in Fig. 1c–f confirm the monolayer structure of pristine graphene.33 To further eliminate potential interference from residual copper (from the CVD substrate), gold (from the support mesh), or silicon (from the CVD reaction tube) during element identification of the bright atoms, we applied simulation of relative intensity ratio comparison for HAADF imaging, confirming the adsorption of uranyl ions (Fig. 2). EDS mapping (Fig. 3a) verified uranium identification in the uranyl ions absorbed amorphous carbon–graphene system (see Table S1†). Raman spectroscopy (Fig. S8a, ESI†) also shows the characteristic peaks corresponding to uranium (near 800 cm−1) and graphene (D and G peak near 1500 and 1700 cm−1). The stronger uranium affinity for amorphous carbon arises from its disordered structure containing abundant defects and unsaturated carbon atoms, providing enhanced chemisorption sites compared to crystalline graphene.Electron beam irradiation induces dynamic uranium atom migration from amorphous carbon to graphene surfaces, exhibiting transient residence (seconds-scale) or stochastic hopping before reverting to amorphous regions.34–36 Prolonged exposure generates graphene defects (Fig. 1e) that stabilize uranium adatoms for minutes-long retention, accompanied by complex dynamics including hopping and cyclic motions (Fig. 1f, Video S1, ESI†). Graphene edge carbon atoms with dangling bonds enhance uranium–carbon interactions through increased chemical activity and reduced system energy. This atomic mobility confirms single-atom uranium species, distinct from static uranyl ion configurations. This high mobility indicates the migrating atoms are uranium atoms instead of uranyl ions, suggesting reduction reaction happened to uranyl ions under e-beam irradiation.34–36
HRTEM imaging and QSTEM TEM simulations reveal spatial configurations of uranium atom on graphene lattices. While most uranium aggregates in amorphous regions (Fig. 4a and b), isolated atoms stabilize at graphene defects. Unexpected stability of uranium monomers on pristine graphene persists under 80 keV electron beam irradiation with 60 pA cm−2 beam current for >40 s (Fig. S2 and S3, ESI†). Mask-filtered image processing clarifies hexagonal lattice structures (Fig. 4c and d), showing uranium preferentially occupying hollow sites or carbon top positions – consistent with theoretical adsorption energy minima.20 Atomic models (Fig. 4e and f) and corresponding QSTEM simulations confirm experimental observations, validating both methodology and adsorption mechanisms.
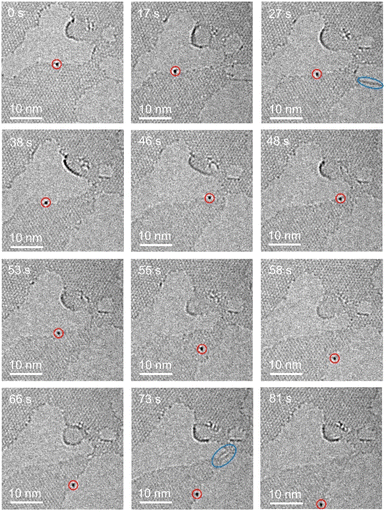
Prolonged electron irradiation generates graphene lattice defects through incident electron-atom knock-on collisions, creating edge holes with unsaturated carbon atoms that coordinate uranium species. Experimental observations reveal uranium atoms exhibiting synchronized migration with graphene edge carbons under continuous beam exposure. Fig. 5 demonstrates this dynamic process, where a uranium atom initially anchors at a graphene edge at 0 s.
 | ||
| Fig. 5 Migration of uranium atoms at the edge of graphene under electron beam irradiation over time (the red circle shows a single uranium atom, and the blue ellipse shows graphene nanowires). | ||
Progressive carbon etching drives leftward displacement (5 nm by 17 s) followed by backward migration upon right-side carbon removal (27 s), forming defect-mediated carbon chains and a graphene nanoribbon. Oscillatory uranium movement persists during sustained etching (38–53 s) before abrupt lattice relocation occurs at 55 s. After stabilizing for 3 s, the atom traverses the nanoribbon to a distal defect site (another example supported by Fig. S4, ESI†). This migration mechanism involves carbon removal-induced edge reconstruction, preferentially forming low-energy zigzag terminations over higher-energy armchair configurations.
We investigated uranyl ion adsorption on sp3-hybridized nanodiamonds to compare hybridization-dependent interactions. The XRD test (Fig S5, ESI†) corresponds well with the simulation, indicating the crystallinity of nanodiamonds. BET N2 adsorption and desorption isotherm linear plot and Barret–Joyner–Halenda (BJH) pore volume and pore size curve are shown in Fig. S6, ESI.† The specific surface area is 330.24 m2 g−1, the total pore volume is 1.43 cm3 g−1, and the average pore diameter is 17.31 nm. The morphology and polycrystalline structures of raw nanodiamonds are confirmed by low-magnification (Fig. 6a) and high-resolution TEM imaging (Fig. 6b). For the uranyl ions absorbed nanodiamonds, STEM BF imaging resolved nanodiamond lattice carbons, while HAADF imaging identified the distribution of uranium species as bright spots (Fig. 6c–h). Observed uranium distribution patterns—monodisperse, paired, and columnar arrangements (red circles)—indicate uranyl-nanodiamond ionic interactions. Monodisperse uranium atomic sites are the most common form for the absorbed uranyl ions (supported by Fig. S7, ESI†). EDS mapping (Fig. 6i–l) confirmed uranium adsorption exclusively on nanodiamonds (see Table S1†), with spatial correlation between uranium signals and nanodiamond locations (spectral data: Fig. 2b). The Raman spectroscopy image (Fig. S8b, ESI†) showing characteristic peaks corresponding to uranyl ions and nanodiamonds, confirms the adsorption of uranyl ions.
Uranium species on nanodiamonds exhibited exceptional stability under electron beam irradiation, contrasting with graphene-adsorbed systems. It suggests uranium primarily exists as +6-valent uranyl ions (UO22+), distinct from reduced states stabilized on graphene. X-ray photoelectron spectroscopy (XPS) analysis corroborated these findings (Fig. 7). The C 1s spectrum featured a dominant sp3-carbon peak (285 eV) with minor C![[double bond, length as m-dash]](https://www.rsc.org/images/entities/char_e001.gif) O contributions (291 eV), consistent with defect-rich surfaces. O1s analysis revealed a 530 eV peak deconvoluted into C–O (531 eV) and O–U (533.3 eV) components. U 4f spectra showed mixed oxidation states (+3, +4, +6) with predominant +6 characteristics (379.1 eV), indicating partial reduction during adsorption while retaining uranyl ion identity. The comparisons of binding sites, irradiation response and electric conductivity for graphene, nanodiamonds and amorphous carbon are listed in Table S2† with corresponding schematic diagram showing in Fig. S9.† Reductive adsorption of metal cation by graphene is widely discovered and reported, because the graphene is found to chemically reduce these gold ions via a redox reaction mechanism, in which graphene donated electrons to reduce metal cations to metal atoms.37 While the nanodiamond is insulator, it means there is no free electrons on the surface of nanodiamond can be applied to reduce metal cations.
O contributions (291 eV), consistent with defect-rich surfaces. O1s analysis revealed a 530 eV peak deconvoluted into C–O (531 eV) and O–U (533.3 eV) components. U 4f spectra showed mixed oxidation states (+3, +4, +6) with predominant +6 characteristics (379.1 eV), indicating partial reduction during adsorption while retaining uranyl ion identity. The comparisons of binding sites, irradiation response and electric conductivity for graphene, nanodiamonds and amorphous carbon are listed in Table S2† with corresponding schematic diagram showing in Fig. S9.† Reductive adsorption of metal cation by graphene is widely discovered and reported, because the graphene is found to chemically reduce these gold ions via a redox reaction mechanism, in which graphene donated electrons to reduce metal cations to metal atoms.37 While the nanodiamond is insulator, it means there is no free electrons on the surface of nanodiamond can be applied to reduce metal cations.
 | ||
| Fig. 7 XPS spectrum of uranyl ions adsorbed nanodiamonds. (a) General spectrum; (b) XPS spectra of C 1s, (c) XPS spectra of O 1s, (d) XPS spectra of U 4f. | ||
4. Conclusions
This study reveals fundamental differences in monodispersed uranium atomic site formation on carbonaceous materials including amorphous carbon, graphene and nanodiamond at atomic resolution. The results crucially reveal fundamental and previously unreported differences in uranium stabilization mechanisms and dynamics. On amorphous carbon-graphene, uranium adsorbs as mobile single atoms preferentially at defect-rich amorphous regions, exhibiting beam-induced migration toward edges and defects. HRTEM and QSTEM simulations confirm uranium stabilization at hollow/top lattice sites of graphene, with zigzag edges providing low-energy anchoring points. Conversely, nanodiamonds immobilize uranium as mixed-valent uranyl ions through strong coordination to oxygenated defects. HAADF-STEM and EDS analyses demonstrate superior uranium immobilization capability of nanodiamonds under electron beam irradiation, contrasting their dynamic behaviour on graphene. These distinct atomic-scale behaviours, directly visualized and characterized by AC-TEM, provide the significance of establishing the link between specific carbon structures and the resulting uranium immobilization efficacy and mechanics. These atomic-scale insights improve the understanding of uranium–carbon interactions and advance the rational design of monodispersed uranium atomic site on carbonaceous materials for catalytic systems.Data availability
The data supporting this article have been included as part of the ESI.†Author contributions
Yadong Li: material fabrication, TEM experiments, data analysis, TEM simulations and original draft writing. Yifei Dang: data analysis. Meng Jin: reviewing. Yuan Hu: reviewing, editing. Kecheng Cao: supervision, funding acquisition, project administration.Conflicts of interest
There are no conflicts to declare.Acknowledgements
This work was supported by the National Natural Science Foundation of China (22376140, 22302123).Notes and references
- T. Chen, T. Liu, B. Pang, T. Ding, W. Zhang, X. Shen, D. Wu, L. Wang, X. Liu and Q. Luo, Sci. Bull., 2022, 67, 2001–2012 CrossRef CAS PubMed.
- K. Patra, W. W. Brennessel and E. M. Matson, J. Am. Chem. Soc., 2024, 146, 20147–20157 CrossRef CAS PubMed.
- Y. Zhao, J. Qu, H. Li, P. Li, T. Liu, Z. Chen and T. Zhai, Nano Lett., 2022, 22, 4475–4481 CrossRef CAS PubMed.
- P. L. Arnold and Z. R. Turner, Nat. Rev. Chem., 2017, 1, 0002 CrossRef CAS.
- E. S. Craft, A. W. Abu-Qare, M. M. Flaherty, M. C. Garofolo, H. L. Rincavage and M. B. Abou-Donia, J. Toxicol. Environ. Health, Part B, 2004, 7, 297–317 CAS.
- M. S. El-Genk, Energy Convers. Manage., 2008, 49, 402–411 CrossRef CAS.
- S. Van Den Berghe, A. Leenaers, E. Koonen and L. Sannen, Adv. Sci. Technol., 2011, 73, 78–90 Search PubMed.
- Z. Wang, F. Liu, Z. Guo, J. Zhang, L. Wang and G. Yan, Int. J. Energy Res., 2021, 45, 11493–11509 CrossRef CAS.
- Q. Y. Zhang, L. J. Zhang, J. Q. Zhu, L. L. Gong, Z. C. Huang, F. Gao, J. Q. Wang, X. Q. Xie and F. Luo, Nat. Commun., 2024, 15, 453 CrossRef CAS PubMed.
- B. M. Gardner, P. A. Cleaves, C. E. Kefalidis, J. Fang, L. Maron, W. Lewis, A. J. Blake and S. T. Liddle, Chem. Sci., 2014, 5, 2489–2497 RSC.
- R. Guo, L. Jin, X. Zhang and Y. Zhang, Appl. Catal., B, 2025, 125113 CrossRef CAS.
- A. S. Helal, M. Hemadi, J. S. Lomas, S. Ammar, A. Abdelhafiz, S. M. El-Sheikh, S. M. Sheta, M. Galanek, M. H. Hassan and J.-K. Chang, Chem. Eng. J., 2025, 160298 CrossRef CAS.
- Z.-W. Huang, S.-W. An, K.-Q. Hu, X.-B. Li, Z.-N. Bin, Z.-H. Zhou, L. Mei, Z.-J. Guo, W.-S. Wu and Z.-F. Chai, Inorg. Chem. Front., 2023, 10, 4754–4762 RSC.
- S. T. Liddle, Angew. Chem., Int. Ed., 2015, 54, 8604–8641 CrossRef CAS PubMed.
- T. Lin, T. Chen, C. Jiao, H. Zhang, K. Hou, H. Jin, Y. Liu, W. Zhu and R. He, Nat. Commun., 2024, 15, 4149 CrossRef CAS PubMed.
- X. Liu, Y. Xie, M. Hao, Y. Li, Z. Chen, H. Yang, G. I. Waterhouse, X. Wang and S. Ma, Nat. Commun., 2024, 15, 7736 CrossRef CAS PubMed.
- J. Meng, Y. Zhou, D. Li and X. Jiang, Sci. Bull., 2023, 68, 1522–1530 CrossRef CAS PubMed.
- M. L. Neidig, D. L. Clark and R. L. Martin, Coord. Chem. Rev., 2013, 257, 394–406 CrossRef CAS.
- Q. Yan, J. Nan, R. Cao, L. Zhu, S. Liu, C. Liang and C. Zhang, Org. Lett., 2024, 27, 510–516 CrossRef PubMed.
- L. Zhang, G. Hou, G. Zi, W. Ding and M. D. Walter, J. Am. Chem. Soc., 2016, 138, 5130–5142 CrossRef CAS PubMed.
- X. Zhao, L. Bai, J. Li and X. Jiang, J. Am. Chem. Soc., 2024, 146, 11173–11180 CAS.
- W. Wang, Q. Luo, L. Li, Y. Wang, X. Huo, S. Chen, X. Du and N. Wang, Adv. Funct. Mater., 2023, 33, 2302913 CrossRef CAS.
- B. Huang, Y. Wu, Z. Zhang, R. Chen, G. Ren, N. Zhou, N. Li and Y. Qian, J. Mater. Chem. A, 2025, 13, 16970–16980 RSC.
- T. Chen, H. Dong, T. Liu, L. Zhou, D. Fu, B. Pang, J. Lian, T. Ding, W. Zhang and R. He, Inorg. Chem., 2023, 62, 8615–8625 CrossRef CAS PubMed.
- Q. Wang, T. Luo, X. Cao, Y. Gong, Y. Liu, Y. Xiao, H. Li, F. Gröbmeyer, Y.-R. Lu and T.-S. Chan, Nat. Commun., 2025, 16, 2985 CrossRef CAS PubMed.
- M. Liu, H. Chen, X. Tang, H. Liu, B. Tu, W. Guo, Y. Zheng, Y. Liu, Y. Tang and R. He, Small, 2022, 18, 2107444 CrossRef CAS PubMed.
- R. O. Saleh, E. A. M. Saleh, M. Moharam, S. Uthirapathy, S. Ballal, A. Singh, A. Nanda, S. Ray, A. K. Nasir and R. S. Kaurshead, RSC Adv., 2025, 15, 15919–15939 RSC.
- S. Chandrasekaran, R. Hu, L. Yao, L. Sui, Y. Liu, A. Abdelkader, Y. Li, X. Ren and L. Deng, Nano-Micro Lett., 2023, 15, 48 CrossRef CAS PubMed.
- Y. Bao, Z. Tang, Y. Wang and S. Li, RSC Adv., 2025, 15, 7832–7842 RSC.
- H. Yang, X. Xia, S. An, M. Huang, H. Ma, F. Ye, C. Peng and C. Xu, RSC Adv., 2025, 15, 7682–7692 RSC.
- Y.-A. Boussouga, J. Joseph, H. Stryhanyuk, H. H. Richnow and A. I. Schäfer, Water Res., 2024, 249, 120825 CrossRef CAS PubMed.
- S. Li, M. Li, M. Zhou, X. Wang, F. Zheng and P. Zhang, Mater. Express, 2018, 8, 521–530 CrossRef CAS.
- K. S. Novoselov, L. Colombo, P. Gellert, M. Schwab and K. Kim, Nature, 2012, 490, 192–200 CrossRef CAS PubMed.
- A. W. Robertson, B. Montanari, K. He, J. Kim, C. S. Allen, Y. A. Wu, J. Olivier, J. Neethling, N. Harrison and A. I. Kirkland, Nano Lett., 2013, 13, 1468–1475 CrossRef CAS PubMed.
- H. Q. Ta, L. Zhao, W. Yin, D. Pohl, B. Rellinghaus, T. Gemming, B. Trzebicka, J. Palisaitis, G. Jing and P. O. Persson, Nano Res., 2018, 11, 2405–2411 CrossRef CAS.
- H. Wang, K. Li, Y. Cheng, Q. Wang, Y. Yao, U. Schwingenschlögl, X. Zhang and W. Yang, Nanoscale, 2012, 4, 2920–2925 RSC.
- F. Fei, J. Zhu, P. Sun, M. Zhang, Z. Li, D. Xu, X. Gong, X. Zou, A. Geim, Y. Su and H. Cheng, Nat. Commun., 2022, 1, 4472 Search PubMed.
Footnote |
| † Electronic supplementary information (ESI) available. See DOI: https://doi.org/10.1039/d5ra03434e |
| This journal is © The Royal Society of Chemistry 2025 |


