
 Open Access Article
 This Open Access Article is licensed under a Creative Commons Attribution-Non Commercial 3.0 Unported Licence
Anticancer efficacy of bis-heteroleptic iridium(III) complexes with difluoro-substituted phenylpyridine ligands†
Suvasmita Beheraab,
Kahnu Charan Pradhan ab,
Sahadev Barikc,
Moloy Sarkarc,
Jagadish Kumard,
Jagneshwar Dandapate,
Jyotsnarani Pradhan*e and
Satyanarayan Pal*ab
ab,
Sahadev Barikc,
Moloy Sarkarc,
Jagadish Kumard,
Jagneshwar Dandapate,
Jyotsnarani Pradhan*e and
Satyanarayan Pal*ab
aP.G. Dept. of Chemistry, Utkal University, Bhubaneswar, Odisha 751004, India. E-mail: snpal@utkaluniversity.ac.in
bCentre of Excellence in Advanced Materials and Applications, Utkal University, Bhubaneswar, Odisha 751004, India
cSchool of Chemical Sciences, National Institute of Science Education and Research, Bhubaneswar, Odisha 752050, India
dDept. of Physics, Utkal University, Bhubaneswar, Odisha 751004, India
eDept. of Biotechnology, Utkal University, Bhubaneswar, Odisha 751004, India
First published on 4th July 2025
Abstract
A series of iridium(III) complexes (Ir1–Ir3) with the formula [Ir(F2ppy)2(L)] (F2ppy = 2-(2,4-difluoro-phenyl)pyridine, L = pyridine-2-aldoxime, 2-pyridylamidoxime and di-2-pyridylketoxime) were synthesized through the reaction of [(F2ppy)2Ir(μ-Cl)2Ir(F2ppy)2] (SM1) and the respective ancillary ligands (L). All the complexes were characterised by FT-IR, 1H & 19F-NMR analysis, electronic absorption–emission spectroscopy and cyclic voltammetric studies. Molecular structures of complexes Ir1 and Ir3 were determined by interpreting single crystal X-ray data. All the complexes were found to be luminescent with low quantum yields. Anticancer studies on cancer cell lines MDAMB, HT-29 and LN-229 revealed their effectiveness as antiproliferative agents. The cytotoxicity of the complexes was evaluated using the MTT assay and complex Ir2 showed activity similar to that of cisplatin towards the three cancer cells. The elevated level of reactive oxygen species (ROS) in the iridium complex-treated cancer cells further supported the antiproliferation efficacy of Ir1–Ir3. Further, the effectiveness of Ir1–Ir3 on cancer cells was established through a cell migration study and apoptotic induction assay on LN-229 and a colony formation assay on HT-29 cancer cells. Immunocytochemistry analysis of LN-229 cancer cells revealed apoptosis through the p53-dependent pathway.
Introduction
Iridium(III) organometallic complexes with a 2-phenylpyridine (ppy) genre backbone are found to be intrinsically luminescent.1–4 Various substitutions on the phenyl and pyridine rings of ppy have been chosen as ligands in the design of a vast family of emissive Ir(III) complexes. The ppy ligation in Ir(III) complexes brings the HOMO–LUMO levels to the desired separation for visible light emission. An array of ppy ligands with various substitutions on phenyl rings were synthesised and complexed with an Ir(III) center for the emission of light across the visible spectrum. Among many options, the difluoro-substituted phenylpyridine, i.e., 2-(2,4-difluoro-phenyl)pyridine (HF2ppy) (Fig. 1), has emerged as a highly useful ligand in the design of Ir(III) luminescent materials.5–7 A design principle of two units of phenylpyridines and a bidentate ancillary ligand (L) around the Ir(III) centre, i.e., [Ir(ppy)2L], was chosen for an easy synthetic route for the target materials. Keeping the phenylpyridine backbone intact, a range of bidentate ancillary ligands have been employed to achieve Ir(III) complexes targeted for applications in various fields, such as organic light-emitting diodes (OLEDs), photo redox catalysts,8 biological cell imaging,9 and anticancer active agents.10,11 | ||
| Fig. 1 List of ligands utilised. | ||
In recent developments, the composition [Ir(ppy)2(L)]+/0 (L = bidentate ligand) has proven to be effective in the development of anticancer active agents.12–14 To date, results obtained from different cancer cell lines with Ir(III) complexes have displayed encouraging outcomes. Anti-cancer studies have revealed that [Ir(ppy)2L]+/0 type complexes can interact with DNA, mitochondria, nucleus and other organelles of the cells for cell death activities.15,16 Complexes with the above design, [Ir(ppy)2(L)]+/0, have proved their potential as therapeutic agents for different cancer cells.17–20 It is found that the coordinated ancillary ligand ‘L’ plays an important role in identifying and targeting the cellular parts to interact with them directly.21–23 Thus, selecting appropriate bidentate ancillary ligands is essential for the design and development of cyclometallated iridium(III)-based anti-cancer drugs. This choice facilitates targeted drug delivery, minimizes unintended side effects, improves effectiveness with lower dosages and ultimately reduces the multidrug resistance observed in current cancer treatments.24 In this context, we have focused on pyridine-oxime-based ancillary ligands owing to their novel therapeutic potential25,26 and the remarkable anticancer activities displayed by pyridine-oxime containing metal complexes against various cancer cell lines.27–29 Additionally, our observation of unusual coordination by 2-pyridinealdoxime (Hpyrald) as an ancillary ligand30,31 in a cyclometallated Ir(III) complex further spurred the exploration of Ir(III) chemistry with an oxime-containing organic entity. Similarly, in our quest for unique properties, we recently reported three new cyclometallated Pt(II) complexes featuring 2-pyridinealdoxime (Hpyrald) and investigated their cancer therapeutic potential against MCF-7 and MDAMB-231 cells.32 The findings revealed that the [Pt(F2ppy)(pyrald)] complex is a proficient anticancer agent. However, the complex demonstrated lower anticancer activity than cisplatin. In contrast, our previously reported Ir(III) complexes with fluorine-substituted cyclometallating ligands33 and other F2ppy-containing Ir(III) complexes in the literature showed greater anticancer efficacy than cisplatin.34 Therefore, we believe that the anticancer potential can be effectively tuned by altering the central metal atom to Ir(III) and employing different structural arrangements of the F2ppy and pyrald ligands (Fig. 1). We designed a series of complexes with the general formula [Ir(F2ppy)2(L)] (where L = pyridine-2-aldoxime and substituted pyridine-2-aldoxime) (Fig. 2). The substitution of Hpyrald with –NH2 and a free pendant pyridine moiety was selected considering the effective anticancer activity demonstrated by cyclometallated iridium(III) complexes containing free amine and aromatic rings.24,34,35
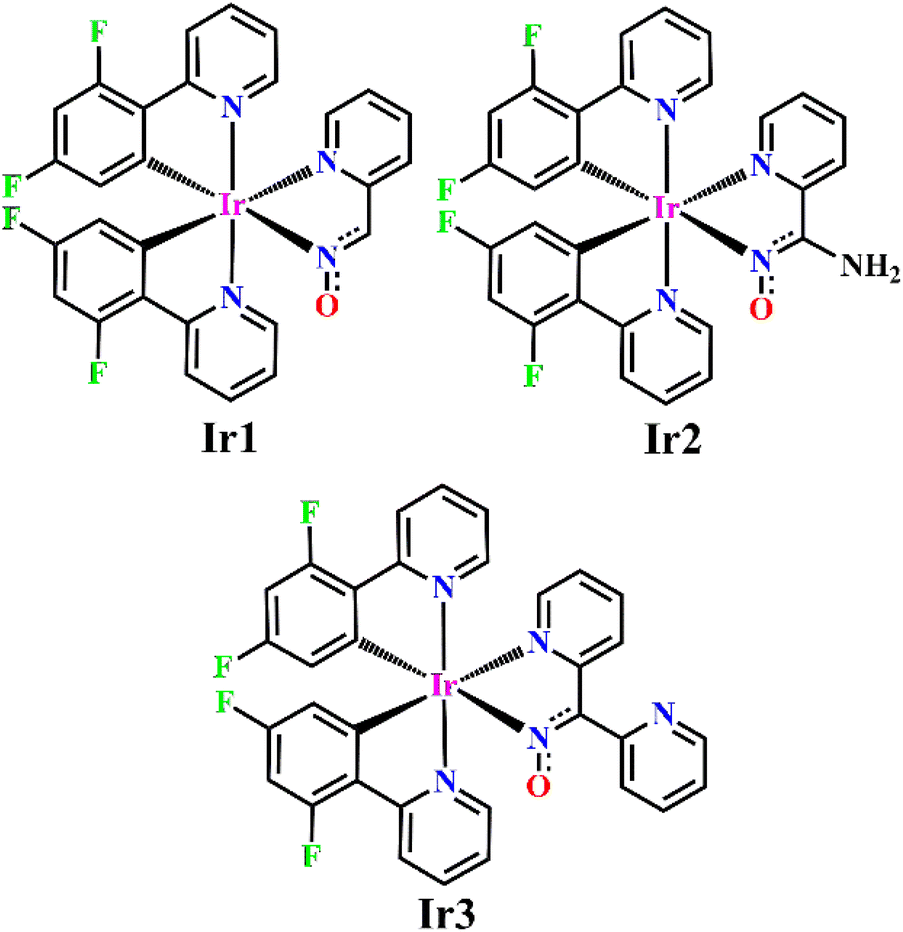 | ||
| Fig. 2 Structure of prepared iridium(III) complexes. | ||
Hence, extending our study on oxime-containing Ir(III) chemistry, herein, we report three iridium complexes and explore their luminescent behaviour, structural properties and therapeutic potentials.
Results and discussion
Synthesis and some properties
All the complexes were synthesised in moderate to high yields under mild conditions and are found to be highly air and moisture stable. In Ir1, deprotonated pyridine-2-aldoxime (pyrald) coordinated the iridium(III) metal centre through pyridine-N and aldoxime-N atoms and identical binding modes of ancillary ligands were observed in complexes Ir2 and Ir3 although ligands 2-pyridylamidoxime (NH2pyrald) and 2-dipyridylketoxime (dipyrald) have other possible coordination modes (Fig. 2). NH2pyrald can coordinate through the pyridine-N and –NH2 group, while the dipyrald can coordinate through two pyridine-N atoms.36 The ligations of ancillary ligands to the metal center were confirmed from the single crystal X-ray analysis and NMR spectra of the complexes. The appearance of a broad peak at 5.81 ppm in the proton NMR spectrum indicated the existence of the free –NH2 group in Ir2 and supported the coordination of pyridine-N and aldoxime-N for NH2pyrald. The base peaks observed in the mass spectra of complexes were found to be well-matched with the theoretical mass of the complexes. Furthermore, the observed four fluorine signals in the 19F NMR spectra of Ir1–Ir3 in the range of 107–111 ppm indicated the coordination of two F2ppy ligands. All the complexes were found to be soluble in methanol, ethanol, acetonitrile and acetone solvents. The complex [Ir(F2ppy)2(NH2pyrald)] (Ir2) was also found to be partly soluble in water owing to the presence of the free –NH2 group.Structural characterisation
The single crystal X-ray structures of [Ir(F2ppy)2(pyrald)] + CH3OH (Ir1·CH3OH) and [Ir(F2ppy)2(dipyrald)] (Ir3) are depicted in Fig. 3a and b, respectively. The crystal structure of Ir1 revealed to contain methanol as the solvent of crystallisation, and the core Ir1 and Ir3 molecular structures depicted the coordination of two F2ppy and one molecule of pyrald or dipyrald around each Ir(III) centre in a distorted octahedral geometry. This is in agreement with the bidentate nature of the coordinating ligands. | ||
| Fig. 3 (a) Thermal ellipsoid plot (40%) of [Ir(F2ppy) (pyrald)] + CH3OH (Ir1·CH3OH). Hydrogen atoms and methanol were excluded for clarity. (b) Thermal ellipsoid plot (30%) of [Ir(F2ppy) (dipyrald)] (Ir3). Hydrogen atoms were excluded for clarity. | ||
In the coordination sphere, the F2ppy ligands tethered the iridium centre through “N” and “C” and the two “N”s (N1 and N2) were found in trans positions in the coordination sphere. The carbon atoms (C11 and C22) of F2ppy ligands were in cis positions and made a square plane along with N3 and N4 of the pyrald/dipyrald ligand. The Ir–C bond distances [2.005(5) and 2.021(4)] of Ir1 were in good agreement with the reported structure of iridium(III) complexes containing F2ppy ligands.7 The bond distances of Ir–N1 and Ir–N2 [2.046(3) Å and 2.051(3) Å] of F2ppy origin in Ir1 were found to be shorter than the Ir–N3 and Ir–N4 bond distances [2.116(3) Å and 2.119(5) Å] emanated from pyrald ligand, respectively. This Ir–N bond distance disparity was due to the strong trans influence exerted by coordinating C11 and C22 situated at the trans position to N3 and N4, respectively, in the coordination sphere. A very similar coordination sphere was found in Ir3 with bond lengths and angles comparable to Ir1·CH3OH (Table 1).
| Ir1 | Ir3 | ||||||
|---|---|---|---|---|---|---|---|
| Bond lengths [Å] | Bond angles [°] | Bond lengths [Å] | Bond angles [°] | ||||
| Ir1–C11 | 2.005 (5) | N1–Ir1–N2 | 174.83 (13) | Ir1–C11 | 2.030 (3) | N1–Ir1–N2 | 175.63 (11) |
| Ir1–C22 | 2.021 (4) | C11–Ir1–N3 | 173.71 (15) | Ir1–C22 | 2.014 (3) | C11–Ir1–N3 | 99.41 (12) |
| Ir1–N1 | 2.046 (3) | C11–Ir1–C22 | 88.92 (16) | Ir1–N1 | 2.041 (3) | C11–Ir1–C22 | 85.64 (13) |
| Ir1–N2 | 2.051 (3) | C22–Ir1–N3 | 95.86 (15) | Ir1–N2 | 2.041 (3) | C22–Ir1–N3 | 174.02 (11) |
| Ir1–N3 | 2.116 (3) | N3–Ir1–N4 | 77.18 (13) | Ir1–N3 | 2.122 (3) | N3–Ir1–N4 | 76.89 (11) |
| Ir1–N4 | 2.119 (5) | C11–Ir1–N4 | 98.52 (15) | Ir1–N4 | 2.086 (3) | C11–Ir1–N4 | 174.73 (12) |
Theoretical studies
The DFT and TD-DFT methods were used to study the quantum mechanical calculation of all three iridium complexes Ir1–Ir3. The S0 → S1 transitions along with corresponding HOMO → LUMO transitions are shown in Fig. S16† and Table 2. The HOMO–LUMO electronic population with the corresponding energy gaps of Ir1–Ir3 is depicted in Fig. 4.| Complex | Nature of transitions S0 → S1 | Wavelength (nm) | Oscillator strength (f) | Contour of orbitals | |
|---|---|---|---|---|---|
| HOMO | LUMO | ||||
| a L = F2ppy, L′ = ancillary ligands (pyrald, NH2pyrald and dipyrald for Ir1–Ir3, respectively). | |||||
| Ir1 | HOMO → LUMO | 389.7 | 0.0114 |  |
 |
| π/d → π* L′LCT/MLCT/L′MCT | |||||
| Ir2 | HOMO → LUMO | 380.9 | 0.0131 |  |
 |
| π/d → π* L′LCT/MLCT/L′MCT | |||||
| Ir3 | HOMO → LUMO | 386.2 | 0.0158 |  |
 |
| π/d → π* L′LCT/MLCT/L′MCT | |||||
 | ||
| Fig. 4 HOMO and LUMO energy diagram and their compositions with respect to atomic orbitals of different fragments of the complexes (Ir1–Ir3). | ||
The HOMOs of Ir1–Ir3 mainly spread over ancillary ligands with a minimal distribution on iridium(III) centres. In contrast, the LUMOs had a dominant contribution of cyclometallating F2ppy ligands (Fig. 4 and S16†). Despite the structural difference of ancillary ligands, the highest occupied frontier molecular orbitals (HOMO) of Ir1 and Ir3 were found to have approximately the same energy values, i.e. ∼5.19 eV. Similar observations were made for the LUMO energy levels of Ir1 and Ir3, with the lowest energy levels at −1.52 eV and −1.53 eV, respectively. This could be due to the non-involvement of the pyridine substituent in the formation of HOMO and LUMO in Ir3 (Fig. S16†).
The HOMO–LUMO energy gap in Ir2 was found to be the lowest, i.e. 3.08 eV, and it was ascribed to the high-lying HOMO (−4.59 eV) of Ir2 among the three complexes. As the LUMOs of all three complexes had comparable energies (1.50–1.53 eV), the high lying HOMO caused the smallest separation of HOMO–LUMO in Ir2.
Optoelectronic studies
The UV-visible spectra of the three iridium complexes were taken in acetonitrile solution at room temperature within a concentration range of 10−5 mol per L. Complexes Ir1–Ir3 exhibited intense absorption spectra at 255, 251 and 254 nm, respectively (Fig. 5). These high energy transitions were assigned to the ligand-centered π → π* transitions. The next few weak bands were obtained at 371, 365 and 375 nm for complex Ir1–Ir3, respectively (Fig. 5). These transitions could be attributed to the combination of spin-allowed charge transfer spectra. Further, the appearance of the least intense peaks in the visible region might have originated from the spin-forbidden electronic transitions involving 3MLCT, 3LLCT or 3ILCT. | ||
| Fig. 5 UV-Vis spectra of complexes (Ir1–Ir3) in acetonitrile medium. | ||
From the TD-DFT calculation, the percentage contributions of iridium, cyclometallating ligands and ancillary ligands in HOMOs and corresponding LUMOs are presented in Table S1.† HOMOs mainly spread over ancillary ligands with minimal contribution of the iridium atom, and the corresponding LUMOs were dominantly found on cyclometallating ligands with negligible contribution of iridium d-orbitals (Fig. S16 and Table S1†).
To reveal the origin of the absorption bands, the results of TD-DFT calculations of all three iridium complexes were analysed. The experimental and theoretically calculated peaks with the highest oscillatory strengths were compared, as illustrated in Table S2 in the ESI.† It revealed that the absorption bands in the region 365–375 nm mainly originated from HOMO–LUMO transitions with a minimum share of HOMO−1 to LUMO+1 transitions. The characteristics of these transitions were found to be a mixture of singlet L′LCT, MLCT and L′MCT origin (L′ = ancillary ligand). The 1L′LCT character was found to be superior over all other possible transitions in the present three complexes, Ir1–Ir3. The absorption bands obtained in the range of 345–402 nm were mainly due to HOMO–LUMO transitions. The observed transition found around 371 nm of Ir1 was broadly suited with a theoretically calculated value of 389.7 nm.
Similarly, the observed transition peaks at 365 and 375 nm of Ir2 and Ir3 were well matched with theoretically calculated peaks at 380.9 and 386.2 nm, respectively. Therefore, the electronic spectral peaks in the region 365–375 nm resulted from the transitions of πL′/dIr → π*(F2ppy)/dIr (L′ = ancillary ligands).
Emission spectra
The photoluminescence spectra were measured at room temperature in an acetonitrile solution (Fig. S14†). Complexes Ir1 and Ir3 exhibited emissions in the blue region at 468 and 494 nm, respectively, while Ir2 showed a red-shifted band at 585 nm. The very identical spectral peak positions of Ir1 and Ir3 nullified the substitutional effects of coordinated ancillary ligands on luminescence behaviour. The observation also holds with the identical spin-allowed charge transfer bands at 371 and 375 nm for Ir1 and Ir3, respectively, as mentioned hitherto. In all three complexes, the excited electron in LUMO might have decayed through ligand-centred triplet excited states [3L′LCT (L = F2ppy, L′ = pyrald/dipyrald)] to the ground state, producing weak phosphorescence.37 This was also evident from the quantum yield values, as depicted in Table 3.| Complex | Electronic spectral dataa λ (nm) (ε × 104 M−1 cm−1) | Photoluminescence dataa | Quantum yieldb (Φ) | Electrochemical datac [E (V) vs. SCE] |
|---|---|---|---|---|
| a Measured in a degassed acetonitrile solution at room temperature.b Quantum yields were determined with respect to [Ir(ppy)3].c Acetonitrile solution (0.1 M TBAP as supporting electrolyte).d Ea values.e Ec values. | ||||
| Ir1 | 261 (20.74), 283 (17.07), 371 (4.95), 410 (2.62), 452 (0.61), 501 (0.28) | 468 and 494 nm (λex = 371 nm) | 0.026 | 1.17d, 1.71d |
| Ir2 | 251(36.82), 302 (18.29), 365 (8.44), 450 (2.53), 492 (1.06) | 585 nm (λex = 365 nm) | 0.014 | 0.40d, 1.42d, 1.87d, −1.33e |
| Ir3 | 254 (30.81), 293 (19.67), 375 (8.57), 408 (6.17), 500 (2.21) | 468 and 494 nm (λex = 375 nm) | 0.0012 | 1.10d, 1.57d, −1.25e |
| Hpyrald | 276, 243 | 1.24d, −1.00e | ||
| HNH2 pyrald | 227, 282 | 1.15d, 1.37d, −1.26e | ||
| Hdipyrald | 230, 265 | 1.34d, −1.28e | ||
However, the –NH2 group of NH2pyrald in Ir2 had a direct effect on the luminescence spectrum and affected both the spectral shape and the emission maximum. It was found that the –NH2 group lowered the HOMO–LUMO energy gap and caused a red shift in luminescence behaviour. This could be due to the positive inductive effect of the –NH2 group, causing an impact on the iridium centre in reference to HOMO–LUMO separation and subsequently resulted lower energy absorption and emission peaks.
The strong luminescence with efficient anticancer activity makes a complex a potential theragnostic agent, i.e., a therapeutic and diagnostic agent, by assessing the mechanism of action of the complexes via the cellular uptake, distribution and localisation.38 The present complexes were found to be weakly luminescent and need structural modification by replacing the pyridine moiety of F2ppy ligand in Ir1–Ir3 with imidazole and pyrazole-like aromatic heterocycles, which might improve the emissive behaviour and the theragnostic properties of new compounds.37
Electrochemical studies
The electrochemical potentials of all the complexes were studied using cyclic voltammetry in a degassed acetonitrile solution at 298 K. Ir1 and Ir3 exhibited two oxidation peaks, while Ir2 had three anodic responses, as depicted in Fig. 6 and Table 3. The oxidation responses of Ir1 at 1.17 V, Ir2 at 0.40 V, 1.42 V and Ir3 at 1.10 V were attributed to the oxidation of the corresponding coordinated ancillary ligands. The other set of oxidation potentials of three complexes appeared at 1.71 V, 1.87 V and 1.57 V for Ir1, Ir2 and Ir3, respectively (Table 3) and were attributed to the Ir(III)–Ir(IV) couples in the respective complexes. For a logical assignment of the anodic peaks of Ir1–Ir3, the cyclic voltammograms of Hpyrald, HNH2pyrald and Hdipyrald in pure form were also recorded in acetonitrile solution (Table 3). Further theoretical calculations revealed a dominant distribution of HOMO over ancillary ligands; hence, the first oxidation responses of Ir1–Ir3 were assigned to the oxidation of ancillary ligands. The assignment of Ir(III)–Ir(IV) oxidation responses of complexes was in good agreement with the literature values.31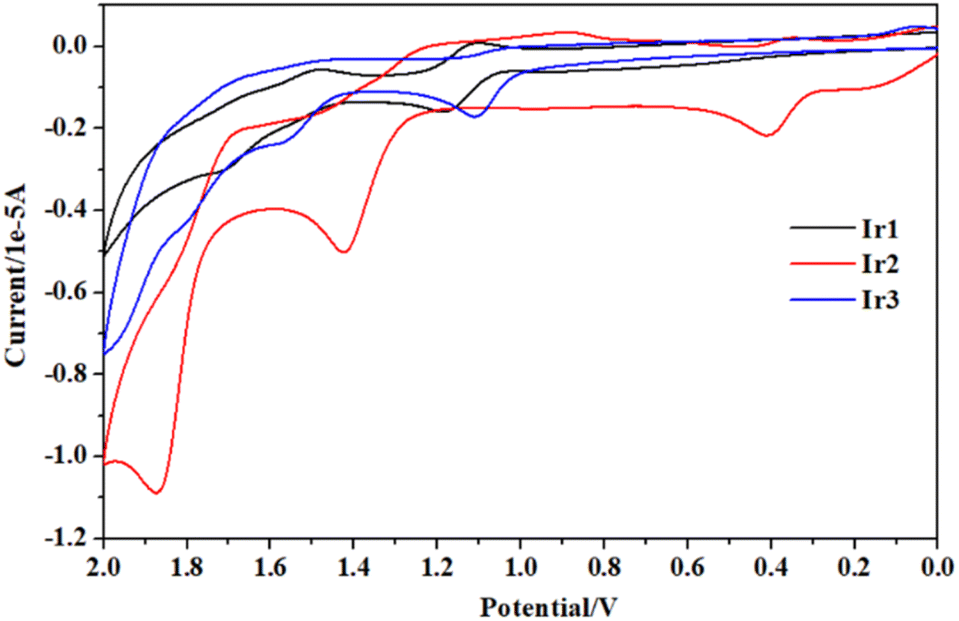 | ||
| Fig. 6 Cyclic voltammograms of complex Ir1–Ir3 in acetonitrile solution. | ||
Redox potentials obtained by cyclic voltammetry are often used to calculate the energy levels of HOMO, LUMO and their energy differences. The onset redox potentials were determined assuming the ionisation potentials (IP) of ferrocene value at −5.1 eV.39 The HOMO–LUMO energy gaps calculated from theoretical calculations, absorption spectra and cyclic voltammograms are presented in Table 4. The optical band gaps were calculated from the absorption peaks at 371 nm, 365 nm and 375 nm for Ir1–Ir3, respectively (Tables 3 and S2†) and found in the order of Ir2 > Ir1 > Ir3. This contradicted the calculated band gaps obtained from TD-DFT calculation, i.e. Ir1 > Ir3 > Ir2. Therefore, the observed trend of HOMO–LUMO energy gaps for complexes Ir1 and Ir3 using both optical and theoretical methods was found to be the same, while Ir2 stands out with a deviation. Electrochemical band gaps calculated from the onset oxidation and reduction potentials for Ir2 and Ir3 were found to have values of 2.75 eV and 2.35 eV, respectively, but the electrochemical band gap for Ir1 could not be evaluated owing to the absence of a reduction response.
| Ir1 | Ir2 | Ir3 | |
|---|---|---|---|
| a HOMO = −5.1 − Eox.b LUMO = −5.1 − Ered.c Eg(CV) = Eox(onset) – Ered(onset).d Eg(opt) = 1240/λabs. | |||
| Eox | 1.17 | 1.42 | 1.10 |
| Ered | −1.33 | −1.25 | |
| HOMOa (CV) | −6.27 | −6.52 | −6.20 |
| LUMOb (CV) | −3.77 | −3.85 | |
| HOMO(DFT) | −5.19 | −4.59 | −5.19 |
| LUMO(DFT) | −1.52 | −1.50 | −1.53 |
| Eg(CV)c [eV] | 2.75 | 2.35 | |
| Eg(opt)d [eV] | 3.34 | 3.39 | 3.30 |
| Eg(DFT) [eV] | 3.67 | 3.08 | 3.66 |
Anticancer studies
| Complex | MDA-MB 231 | HT-29 | LN 229 |
|---|---|---|---|
| Ir1 | 11.30 ± 0.95 | 14.20 ± 1.21 | 16.23 ± 1.20 |
| Ir2 | 8.60 ± 0.98 | 10.45 ± 1.71 | 12.30 ± 1.02 |
| Ir3 | 21.30 ± 1.30 | 27.30 ± 2.87 | 31.32 ± 3.31 |
| Cisplatin | 8.30 ± 0.87 | 9.50 ± 1.10 | 10.30 ± 1.45 |
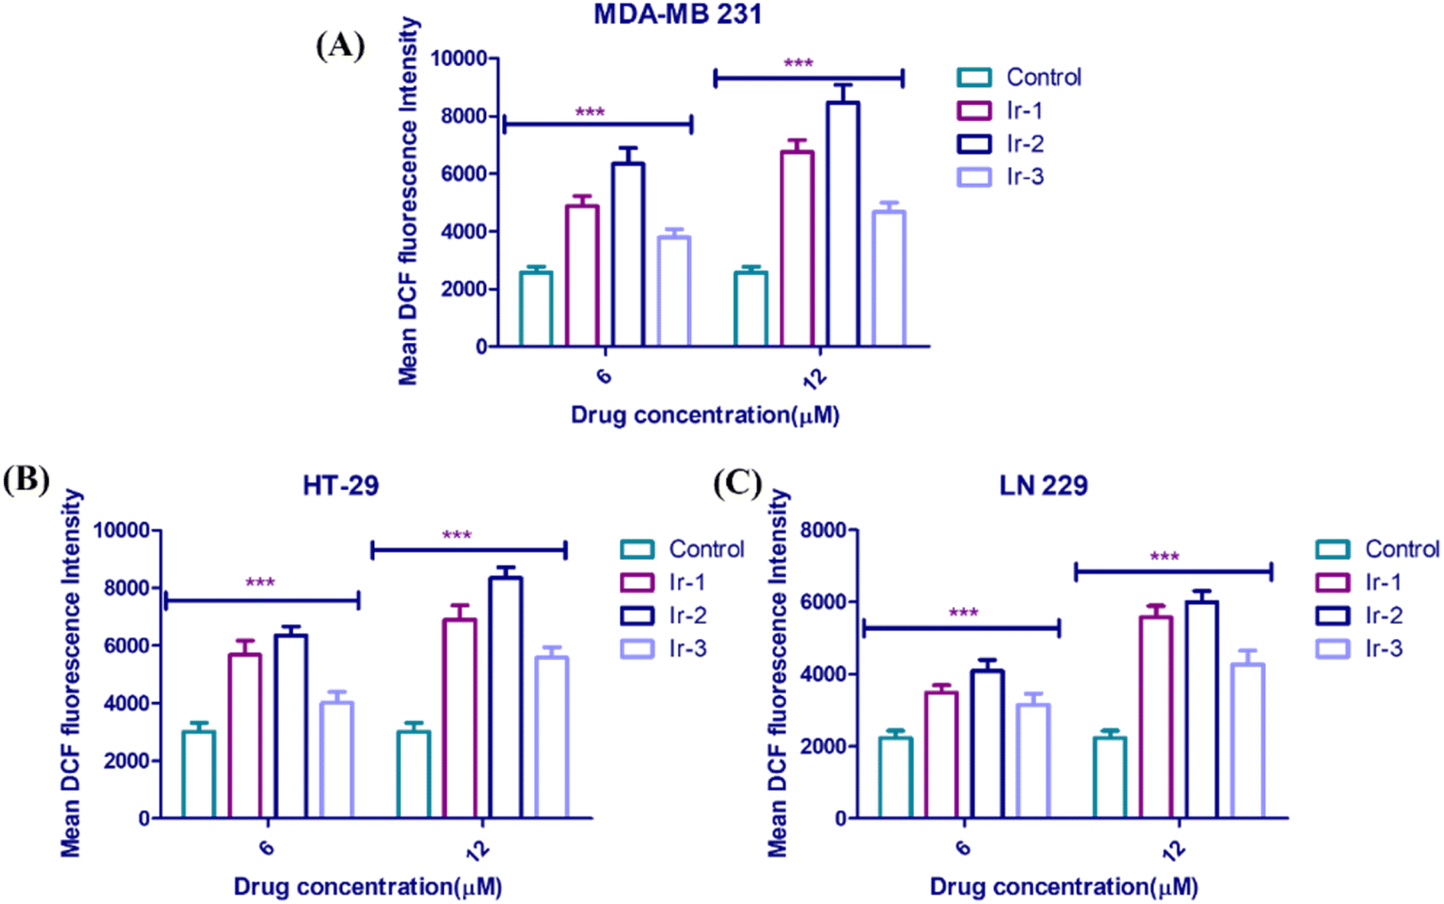 | ||
| Fig. 7 Intracellular ROS levels were assessed in (A) MDA-MB 231, (B) HT-29, and (C) LN-229 cells following treatment with Ir1–Ir3 using a DCFH-DA fluorescence assay. Cells were incubated with 6 and 12 μM of the complexes for 48 hours, and ROS levels were quantified by measuring fluorescence intensity and expressed as mean fluorescence intensity. Data were expressed as mean ± SD. (n = 3), ***P < 0.01 versus control. | ||
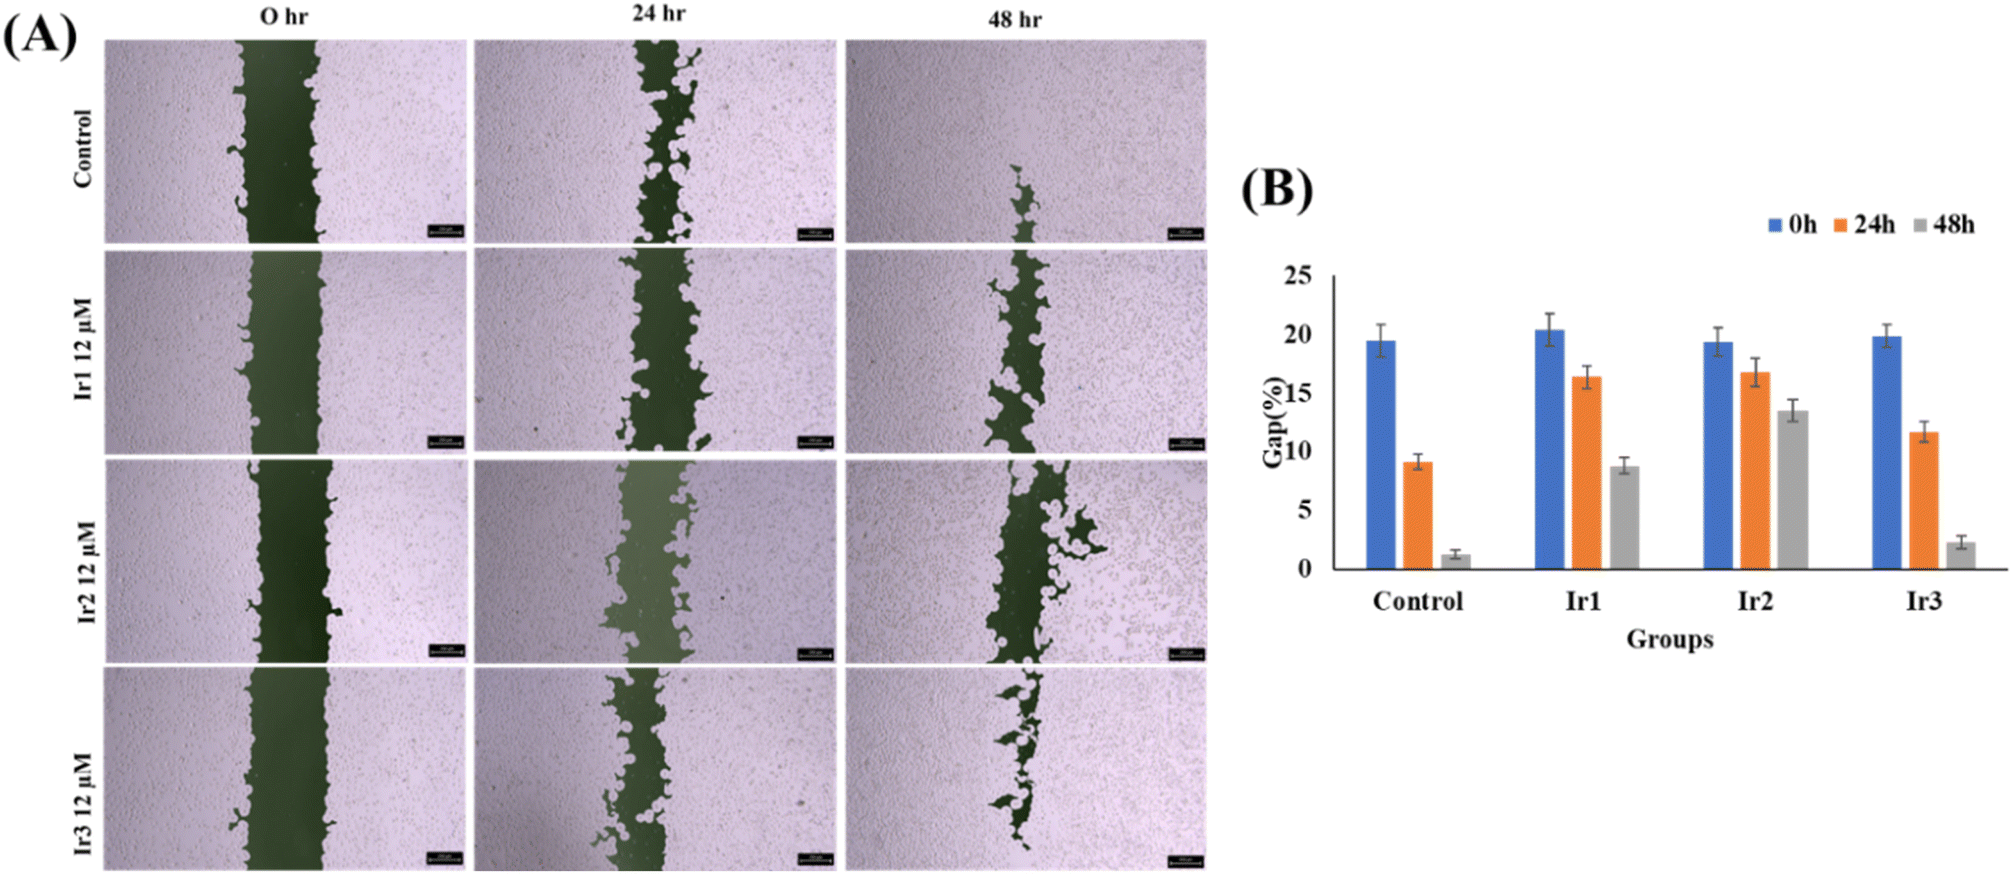 | ||
| Fig. 8 Cell migration assay of LN-229 cells treated with or without Ir1–Ir3 for 24 and 48 hours. (A) Representative images of cell migration at 0 hours, 24 hours and 48 hours post-treatment, comparing untreated control and complex Ir1–Ir3 treated cells. (B) Quantification of the migration rate, expressed as the percentage of gap closure relative to the control. Data represent mean ± SD from three independent experiments. | ||
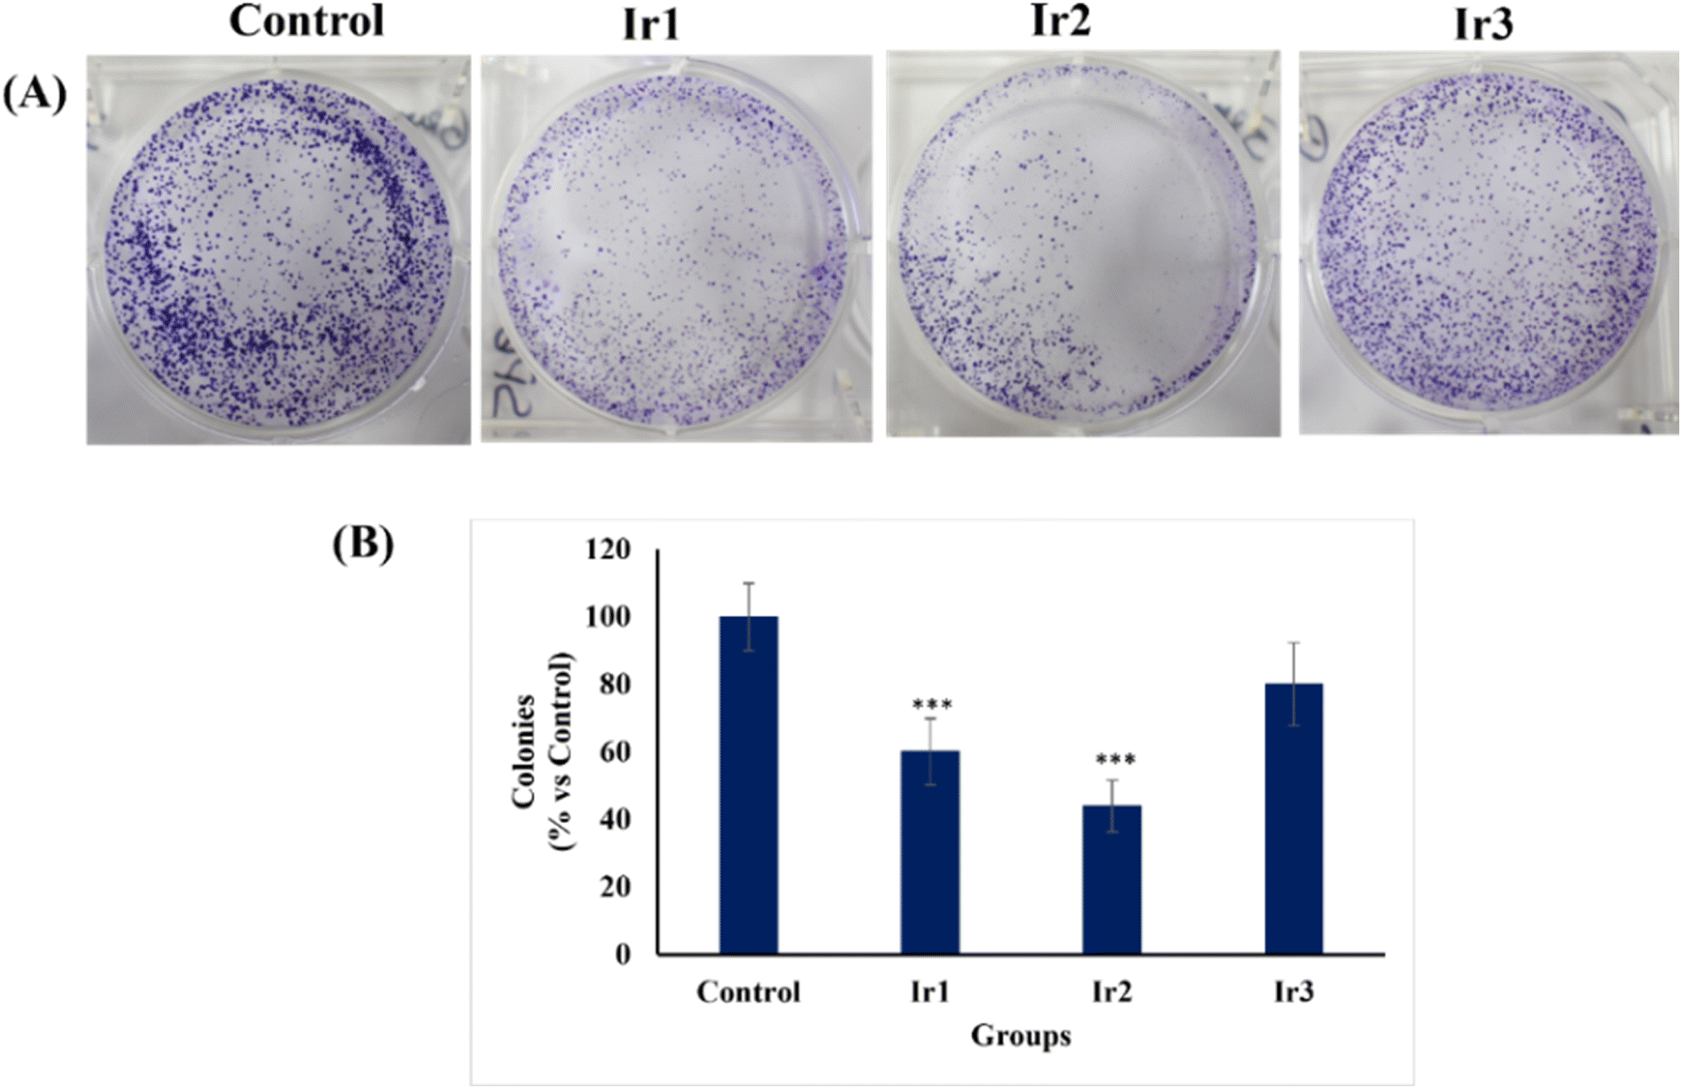 | ||
| Fig. 9 Colony formation was assessed in HT-29 cells following treatment with complex Ir1–Ir3 using a clonogenic assay. (A) Representative images of colonies formed in untreated control and Ir1–Ir3 treated groups after 14 days. (B) Quantification of colony formation, expressed as the percentage of colonies relative to the control. All values are expressed as the mean ± SD (n = 3), ***P < 0.01 versus control. | ||
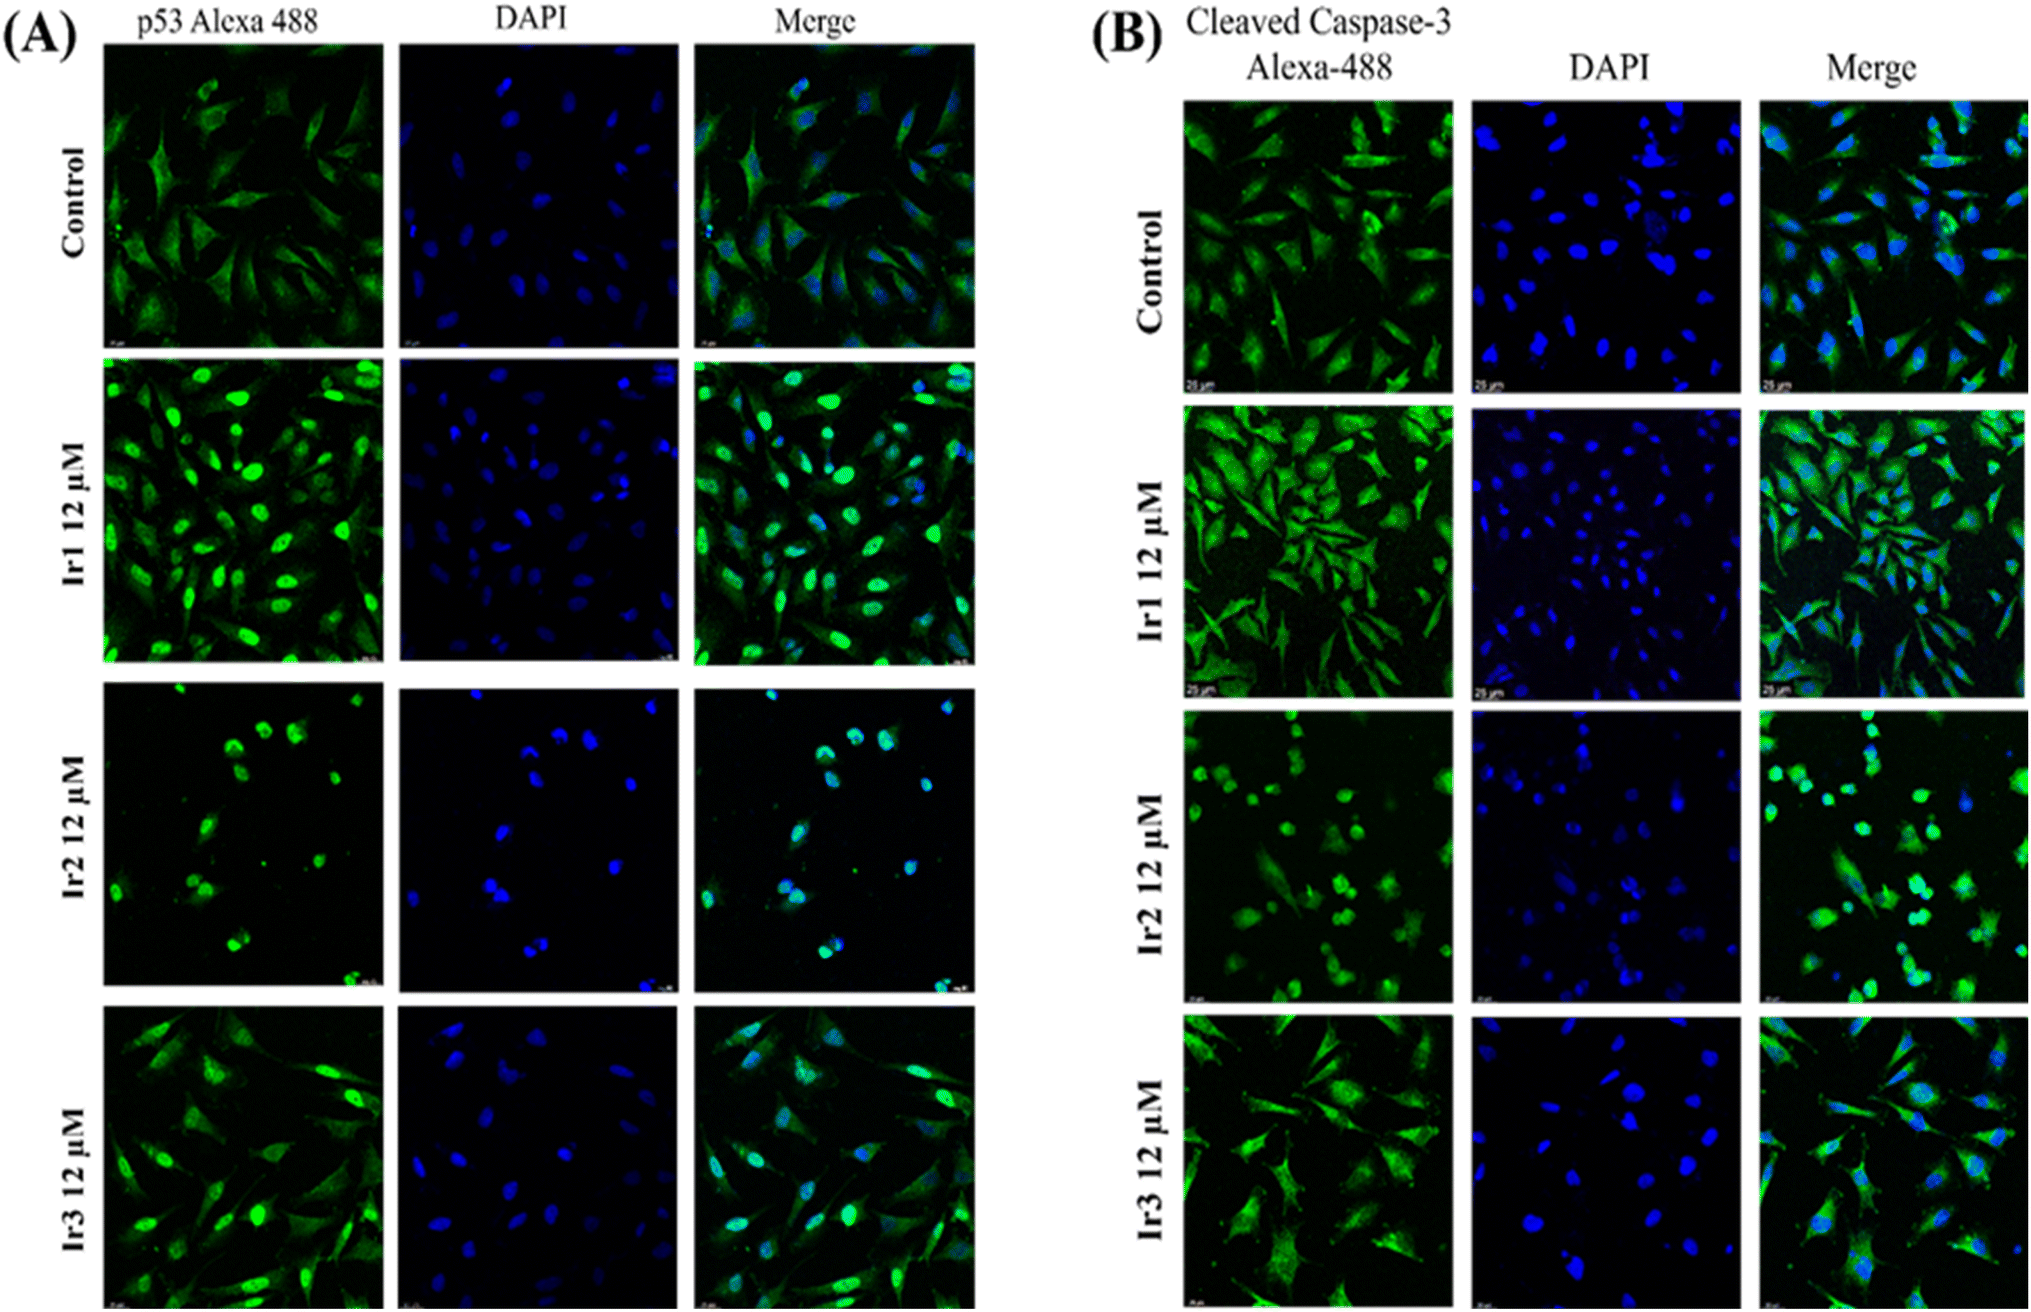 | ||
| Fig. 10 (A) Iridium complexes induce nuclear translocation of p53 and (B) activation of cleaved caspase3. Confocal microscopy images of LN 229 cells treated with 12 μM Ir1–Ir3 for 48 hours and stained with anti-p53 and cleaved caspase-3 primary antibodies, followed by incubation with the Alexa-488-conjugated secondary antibody and DAPI for nuclear staining. | ||
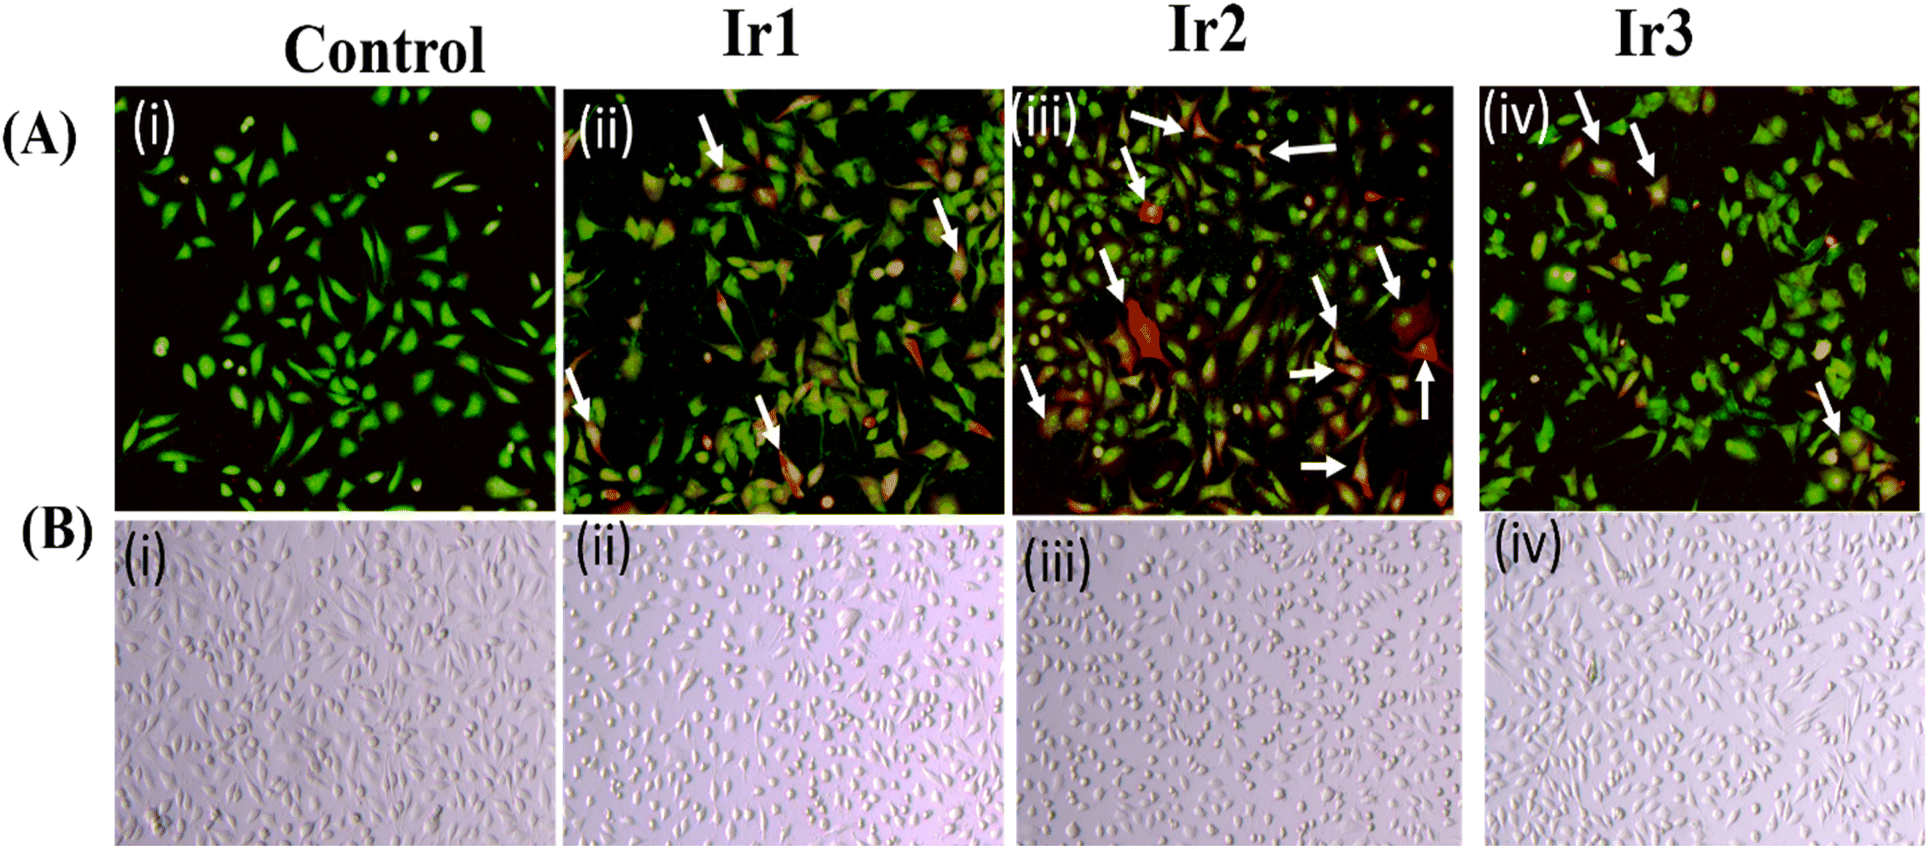 | ||
| Fig. 11 (A) Investigation of apoptosis induction in Ir1–Ir3 treated with LN 229 cells by fluorescence microscope with acridine orange and propidium iodide: (i) control, (ii) Ir1, (iii) Ir2 and (iv) Ir3. Untreated control cells emitted green fluorescence. Treated cells showed greenish-yellow with orange nuclei at the early apoptotic phase (pointed as white arrow), and the cells turned red-orange at the late apoptosis phase (pointed as white arrow). (B) Change in cell shape with Ir1–Ir3 treatment: (i) control, (ii) Ir1, (iii) Ir2, and (iv) Ir3. The LN-229 cells were treated with or without Ir1–Ir3 (12 μM) for 48 hours. Bright-field images showed the change in morphology after treatment, and cells acquired with poorly defined and irregular cell morphology with iridium complex treatment. Magnification: ×10 and ×20. | ||
Experimental
Materials and synthesis of complexes
IrCl3·xH2O, 2-pyridinealdoxime (Hpyrald), 2-(2,4-difluorophenyl)pyridine (HF2ppy), and di-2-pyridyl ketoxime (Hdipyrald) were obtained from Merck and used without further purification. Pyridine-2-amidoxime (HNH2pyrald) was purchased from BLD Pharm, India. MTT [3-(4,5-dimethylthiazol-2-yl)-2,5-diphenyltetrazoliumbromide], acridine orange and ethidiumbromide were purchased from Merck USA. The human cancer cell lines MDAMB, HT-29 and LN-229 were obtained from CSIR-National Chemical Laboratory, Pune, India. All chemicals for cell culture, such as DMEM (Dulbecco's modified Eagle's medium), fetal bovine serum (FBS) and trypsin–EDTA were purchased from Himedia Laboratories Pvt. Ltd, Mumbai, India. All the solvents were dried following reported methods44 before use. The chloro-bridged dimer [Ir(F2ppy)2(μ-Cl)2Ir(F2ppy)2] (SM1) was prepared from IrCl3·xH2O using the method described by Nonoyama.45Synthesis of [Ir(F2ppy)2(pyrald)] (Ir1), [Ir(F2ppy)2(NH2pyrald)] (Ir2) and [Ir(F2ppy)2(dipyrald)] (Ir3)
Iridium complex Ir1–Ir3 was synthesised following the synthetic procedure proposed by Nonoyama.45 In a typical preparation of Ir1, the dichloro-bridged dimer, [(F2ppy)2Ir(μ-Cl)2Ir(F2ppy)2] (SM1) (200 mg, 0.16 mmol) reacted with pyridine-2-aldoxime (Hpyrald) (49 mg, 0.40 mmol) and Et3N (0.056 ml, 0.40 mmol) in 30 ml ethanol under reflux condition under dinitrogen atmosphere for 18 hours (Scheme S1†). The resulting mixture was evaporated in a water bath. The impure mixture thus obtained was applied to a neutral aluminium oxide column and eluted with acetonitrile to isolate a yellow band. The evaporation of the column-separated solution resulted in a yellow solid with a 90% yield (205 mg).1H NMR data (400 MHz, DMSO-d6, ppm): δ 8.37 (d, J = 5.5 Hz, 1H), 8.24 (d, J = 7.7 Hz, 3H), 8.03 (t, J = 7.8 Hz, 2H), 7.77 (t, J = 6.8 Hz, 1H), 7.65 (d, J = 6.2 Hz, 1H), 7.51 (d, J = 8.8 Hz, 1H), 7.48–7.42 (m, 1H), 7.39 (d, J = 4.9 Hz, 1H), 7.36–7.29 (m, 1H), 7.09–7.01 (m, 1H), 6.89–6.79 (m, 1H), 6.79–6.67 (m, 1H), 5.66 (d, J = 8.3 Hz, 1H), 5.44 (d, J = 9.6 Hz, 1H).
19F NMR data (377 MHz, DMSO-d6, ppm): δ −107.76, −108.97, −109.51, −110.97.
ESI-MS for [Ir(F2ppy)2(pyrald)] (Ir1): theoretical mass for C28H17N4F4OIr, 694.0968; found 694.7900.
Elemental analysis: anal. calcd for C28H17N4F4OIr: C, 48.48; H, 2.47; N, 8.08. Found C, 49.69; H, 3.12; N, 8.98.
![[thin space (1/6-em)]](https://www.rsc.org/images/entities/char_2009.gif) :1, v/v). The complex was isolated as a yellow powder with a 64.7% yield.
:1, v/v). The complex was isolated as a yellow powder with a 64.7% yield.IR data (KBr, cm−1): 3063(w), 1603(s), 1571(w), 1558(w), 1474(s), 1440(m), 1400(s), 1360(m), 1288(s), 1247(s), 1162(s), 1100(s), 1043(w), 985(s), 828(s), 785(m), 755(m), 700(m), 668(m), 568(w), 526(w), 418(w).
1H NMR data (400 MHz, DMSO-d6, ppm): δ 8.34 (d, J = 4.8 Hz, 1H), 8.28–8.18 (m, 2H), 8.01 (t, J = 7.9 Hz, 2H), 7.92 (t, J = 7.8 Hz, 1H), 7.72 (d, J = 7.5 Hz, 1H), 7.58 (d, J = 5.1 Hz, 1H), 7.52–7.39 (m, 2H), 7.30 (t, J = 6.0 Hz, 1H), 7.22–7.10 (m, 1H), 6.83 (ddd, J = 12.1, 9.5, 2.3 Hz, 1H), 6.73 (ddd, J = 12.2, 9.5, 2.3 Hz, 1H), 5.81 (s, 2H), 5.65 (dd, J = 8.1, 2.4 Hz, 1H), 5.46 (dd, J = 8.9, 2.4 Hz, 1H).
19F NMR data (377 MHz, DMSO-d6, ppm): δ −107.73, −109.03, −109.44, −111.11.
ESI-MS for [Ir(F2ppy)2(NH2pyrald)] (Ir2): theoretical mass for C28H19N5F4OIr [Ir2H]+, 710.1077; found 710.0981.
Elemental analysis: anal. calcd for C28H18N5F4OIr: C, 47.45; H, 2.56; N, 9.88. Found C, 48.06; H, 3.01; N, 10.42.
The crude product was purified on an Al2O3 column by eluting with an acetone:methanol (1:1, v/v) mixture. The greenish-yellow coloured powder was obtained with a yield of 65%.
IR data (KBr, cm−1): 3063(w), 1603(s), 1571(w), 1558(w), 1474(s), 1440(m), 1400(s), 1360(m), 1288(s), 1247(s), 1162(s), 1100(s), 1043(w), 985(s), 828(s), 785(m), 755(m), 700(m), 668(m), 568(w), 526(w), 418(w).
1H NMR data (400 MHz, DMSO-d6, ppm): δ 8.65 (d, J = 4.8 Hz, 1H), 8.46 (d, J = 4.9 Hz, 1H), 8.27 (t, J = 8.3 Hz, 2H), 8.05 (t, J = 7.8 Hz, 2H), 7.84–7.69 (m, 4H), 7.58–7.45 (m, 3H), 7.41–7.29 (m, 2H), 7.17–7.11 (m, 1H), 6.91–6.82 (m, 1H), 6.78–6.67 (m, 1H), 5.70 (dd, J = 8.1, 2.3 Hz, 1H), 5.46 (dd, J = 8.8, 2.4 Hz, 1H).
19F NMR data (377 MHz, DMSO-d6, ppm): δ −107.64, −109.09, −109.47, −111.06.
ESI-MS for [Ir(F2ppy)2(dipyrald)] (Ir3): theoretical mass for C33H21N5F4OIr [Ir3H]+, 772.1233; found 772.1311.
Elemental analysis: anal. calcd for C33H20N5F4OIr: C, 51.42; H, 2.62; N, 9.09. Found C, 52.26; H, 2.98; N, 9.78.
Physical measurements
The FT-IR spectra of the complexes were recorded using a Shimadzu IR Afinity-1S spectrophotometer with a KBr pallet. A Bruker 700 MHz spectrometer was used to measure 1H and 19F NMR data for all the complexes using a dry DMSO-d6 solvent. The Thermo Finnigan Flash EA1112 series instrument was used for the elemental (C, H, N) analysis of the iridium complexes. An Agilent Carry 100 UV-Vis spectrophotometer instrument was used to record the absorption spectra of all the complexes. A Shimadzu RF 6000 fluorescence spectrometer was used to obtain the photoluminescence spectra. Cyclic voltammograms were recorded on CH Instrument model CHI760E to observe the oxidation and reduction potentials of the iridium complexes. The redox properties were studied under a dinitrogen atmosphere in an acetonitrile medium at room temperature using [(n-C4H9)4N]ClO4 (TBAP) as a supporting electrolyte. The Pt-disk electrode was used as the working electrode, while Pt-wire and saturated calomel (SCE) were used as the reference and auxiliary electrodes, respectively. All the mass spectra were recorded using a Bruker micro TOF-QII mass spectrometer.Crystal structure determination
The X-ray quality single crystal of [Ir(F2ppy)(pyrald)] (Ir1) was obtained upon slow evaporation of a methanol–toluene mixture at room temperature. A suitable single crystal was chosen and mounted on a Rigaku CCD X-ray diffractometer. The X-ray data were collected at 296 K using a microfocus sealed X-ray tube with Cu-Kα (λ = 1.54184 Å) as an X-ray source. The obtained data were refined and reduced through the CrysAlisPro software for further processing. The structure was solved using SHELXT software and refined on F2 by applying a full-matrix least-squares method with the SHELXL programme assembled in Wingx software. The thermal parameters of all the non-hydrogen atoms were refined anisotropically, and hydrogen atoms were added to the atoms at an idealised position using the riding model. The structure was crystallised with one molecule of methanol. The final crystallographic data were submitted to CCDC with deposition numbers 2377820 and 2377821. The different refinement parameters along with selected bond lengths and angle parameters are listed in Tables 1 and S3,† respectively. The thermal ellipsoid plot, as depicted in Fig. 3, was obtained from the ORTEP 3 programme.Computational methods
The ORCA programme was used for the time-dependent density functional theory (TD-DFT) calculation of complex Ir1–Ir3.46 The geometries of all the complexes were optimised in the gas phase prior to theoretical calculations. The hybrid B3LYP-D3/def2-TZVP level of theory was used for TD-DFT calculations.47 Two different basis sets were employed to treat the non-metallic and metallic atoms present in complexes. The Basis LanL2DZ set was used to treat the iridium atom,48 and 6-31G** basis set was used for the treatment of non-metallic atoms, such as C, N, H and F, present in ligand frameworks.49,50 Hessian indices were used as a tool to examine the stationary states. TD-DFT calculations of all the complexes were performed at the gas phase optimized geometry using the SMD continuum solvation model for acetonitrile stated by Truhlar and Cramer.51Anticancer study
Conclusions
Three bis-heteroleptic Ir(III)–F2ppy complexes (Ir1–Ir3) were designed and synthesised, aiming to explore the ortho C–H bond activation potential inherited within the pyridine-2-aldoxime and its two derivatives. However, the ortho C–H bond activation phenomenon was found to be absent in the present complexes, which was also confirmed by the single crystal X-ray structures of Ir1 and Ir3. The molecular structures displayed distorted octahedral geometry with the usual C^N coordination of F2ppy ligands around the Ir(III) centres and an innocent character of aldoxime ligands. All the complexes exhibited very weak luminescence in the solution medium. Anticancer studies with MDAMB, HT-29 and LN 229 cancer cells revealed the cytotoxic nature of all the iridium complexes. The complexes induce oxidative stress by generating reactive oxygen species, which were ultimately associated with the induction of apoptosis in cancer cells. The suppression of colony formation and cell migration by the iridium complexes further underscores their potential to inhibit key cellular processes essential for tumour growth and metastasis. The observed upregulation and nuclear localization of crucial tumour suppressor protein p53 and the activation of caspase-3, a hallmark of apoptosis, suggested that complex Ir1–Ir3 may induce programmed cell death through the p53-dependent pathway. All the biological studies supported the superior anticancer activity of complex Ir2 among the three complexes, and Ir3 was found to be the least effective.Data availability
The data supporting this article have been included as part of the ESI.†Conflicts of interest
There are no conflicts to declare.Acknowledgements
The financial support from the Science and Technology Department, Govt. of Odisha (Grant No. 27562800512017/201288/ST/Bhubaneswar, dt. 24.02.2018) and OSHEC MRIP-2024-Chemistry (Grant No. 305/249/OSHEC, dt. 17.03.2025) is gratefully acknowledged. The work is also supported by the World Bank-Odisha Higher Education Programme for Excellence and Equity (WB-OHEPEE, Letter No-Dev-I/1113/PV/9072/2022, dt. 31.3.2022), DST-FIST program of Govt. of India (SR/FST/CSI/-275/2016 (C) dt. 01.02.2018), RUSA 2.0 and COE in Advanced Materials and Applications of Utkal University.References
- Y. Lan, D. Liu, J. Li, H. Wan and Y. Mei, 2-Phenylpyridine-Based Phosphorescent Ir(III) Complexes for Highly Efficient Greenish-Blue Organic Light-Emitting Diodes with EQEs up to 33.5%, Dyes Pigm., 2023, 210, 111032 CrossRef CAS.
- V. Chandrasekhar, B. Mahanti, M. D. Pandey and R. S. Narayanan, Cyclometalated Ir(III) Complex as a Metalloligand and a Selective Cu(II) Sensor: Synthesis and Structural Characterization of a Heterometallic Tetranuclear Ir(III)/Cu(II) Complex, ACS Omega, 2018, 3, 2786–2792 CrossRef CAS.
- S. Wu, Y. Wang, Y. Zhao, R. Wang, M. Hailin and T. Yu, Synthesis and Luminescence Properties of Two Ir(III) Complexes Containing Styrene-Modified Phenylpyridine Ligands, New J. Chem., 2021, 45(6), 3311–3318 RSC.
- A. F. Henwood and E. Zysman-Colman, Luminescent Iridium Complexes Used in Light-Emitting Electrochemical Cells (LEECs), Top. Curr. Chem., 2016, 374(4), 36 CrossRef.
- J. H. Seo, Y. K. Kim and Y. Ha, Efficient Blue-Green Organic Light-Emitting Diodes Based on Heteroleptic Tris-Cyclometalated Iridium(III) Complexes, Thin Solid Films, 2009, 517(5), 1807–1810 CrossRef CAS.
- G. Y. Park, Y. Kim and Y. Ha, Iridium Complexes Containing Three Different Ligands as White OLED Dopants, Mol. Cryst. Liq. Cryst., 2006, 462(1), 179–188 CrossRef.
- R. Davidson, Y.-T. Hsu, M. A. Fox, J. A. Aguilar, D. Yufit and A. Beeby, Tuning Emission Lifetimes of Ir(C^N)2(Acac) Complexes with Oligo(Phenyleneethynylene) Groups, Inorg. Chem., 2023, 62(6), 2793–2805 CrossRef CAS.
- M. R. Schreier, X. Guo, B. Pfund, Y. Okamoto, T. R. Ward, C. Kerzig and O. S. Wenger, Water-Soluble Tris(Cyclometalated) Iridium(III) Complexes for Aqueous Electron and Energy Transfer Photochemistry, Acc. Chem. Res., 2022, 55(9), 1290–1300 CrossRef CAS.
- B. Joshi and M. Shivashankar, Recent Advancement in the Synthesis of Ir-Based Complexes, ACS Omega, 2023, 8(46), 43408–43432 CrossRef CAS.
- H. Zhang, L. Tian, R. Xiao, Y. Zhou, Y. Zhang, J. Hao, Y. Liu and J. Wang, Anticancer Effect Evaluation in Vitro and in Vivo of Iridium(III) Polypyridyl Complexes Targeting DNA and Mitochondria, Bioorganic Chem., 2021, 115, 105290 CrossRef CAS.
- N. Neelambaran, S. Shamjith, V. P. Murali, K. K. Maiti and J. Joseph, Exploring a Mitochondria Targeting, Dinuclear Cyclometalated Iridium (III) Complex for Image-Guided Photodynamic Therapy in Triple-Negative Breast Cancer Cells, ACS Appl. Bio Mater., 2023, 6(12), 5776–5788 CrossRef CAS.
- A. Sharma S, S. P, N. Roy and P. Paira, Advances in Novel Iridium (III) Based Complexes for Anticancer Applications: A Review, Inorganica Chim. Acta, 2020, 513, 119925 CrossRef CAS.
- Z. Liu and P. J. Sadler, Organoiridium Complexes: Anticancer Agents and Catalysts, Acc. Chem. Res., 2014, 47(4), 1174–1185 CrossRef CAS.
- T. Yang, M. Zhu, M. Jiang, F. Yang and Z. Zhang, Current Status of Iridium-Based Complexes against Lung Cancer, Front. Pharmacol., 2022, 13, 1025544 CrossRef CAS.
- L. Xie, L. Shi, K. Xiong, R. Guan, Y. Chen, J. Long, L. Ji and H. Chao, Synthesis, Subcellular Localization and Anticancer Mechanism Studies of Unsymmetrical Iridium(III) Complexes, Eur. J. Inorg. Chem., 2023, 26(15), e202300001, DOI:10.1002/ejic.202300001.
- Q.-Y. Yi, D. Wan, B. Tang, Y.-J. Wang, W.-Y. Zhang, F. Du, M. He and Y.-J. Liu, Synthesis, Characterization and Anticancer Activity in Vitro and in Vivo Evaluation of an Iridium (III) Polypyridyl Complex, Eur. J. Med. Chem., 2018, 145, 338–349 CrossRef CAS.
- Y. Wu, J. Liu, M. Shao, P. Zhang, S. Song, G. Yang, X. Liu and Z. Liu, Cyclometalated Iridium(III) Dithioformic Acid Complexes as Mitochondria-Targeted Imaging and Anticancer Agents, J. Inorg. Biochem., 2022, 233, 111855 CrossRef CAS.
- K. Naito, K. Yokoi, C. Balachandran, Y. Hisamatsu and S. Aoki, Design, Synthesis, and Anticancer Activity of Iridium(III) Complex-Peptide Hybrids That Contain Hydrophobic Acyl Groups at the N-Terminus of the Peptide Units, J. Inorg. Biochem., 2019, 199, 110785 CrossRef CAS.
- K. Yokoi, C. Balachandran, M. Umezawa, K. Tsuchiya, A. Mitrić and S. Aoki, Amphiphilic Cationic Triscyclometalated Iridium(III) Complex–Peptide Hybrids Induce Paraptosis-like Cell Death of Cancer Cells via an Intracellular Ca2+-Dependent Pathway, ACS Omega, 2020, 5(12), 6983–7001 CrossRef CAS.
- J. Haribabu, Y. Tamura, K. Yokoi, C. Balachandran, M. Umezawa, K. Tsuchiya, Y. Yamada, R. Karvembu and S. Aoki, Synthesis and Anticancer Properties of Bis- and Mono(Cationic Peptide) Hybrids of Cyclometalated Iridium(III) Complexes: Effect of the Number of Peptide Units on Anticancer Activity, Eur. J. Inorg. Chem., 2021, 18, 1796–1814 CrossRef.
- E. Guillén, A. González, P. K. Basu, A. Ghosh, M. Font-Bardia, T. Calvet, C. Calvis, R. Messeguer and C. López, The Influence of Ancillary Ligands on the Antitumoral Activity of New Cyclometallated Pt(II) Complexes Derived from an Ferrocene-Pyrazole Hybrid, J. Organomet. Chem., 2017, 828, 122–132 CrossRef.
- Y. Yang, L. Guo, X. Ge, Z. Tian, Y. Gong, H. Zheng, Q. Du, X. Zheng and Z. Liu, Novel Lysosome-Targeted Cyclometalated Iridium(III) Anticancer Complexes Containing Imine-N-Heterocyclic Carbene Ligands: Synthesis, Spectroscopic Properties and Biological Activity, Dyes Pigm., 2019, 161, 119–129 CrossRef CAS.
- C.-P. Tan, Y.-M. Zhong, L.-N. Ji and Z.-W. Mao, Phosphorescent Metal Complexes as Theranostic Anticancer Agents: Combining Imaging and Therapy in a Single Molecule, Chem. Sci., 2021, 12(7), 2357–2367 RSC.
- R. Guan, L. Xie, L. Ji and H. Chao, Phosphorescent iridium (III) complexes for anticancer applications, Eur. J. Inorg. Chem., 2020, 42, 3978–3986 CrossRef.
- I. A. Schepetkin, M. B. Plotnikov, A. I. Khlebnikov, T. M. Plotnikova and M. T. Quinn, Oximes: Novel therapeutics with anticancer and anti-inflammatory potential, Biomolecules, 2021, 11(6), 777 CrossRef CAS.
- K. E. Yang, H. J. Jang, I. H. Hwang, Y. H. Chung, J. S. Choi, T. H. Lee and I. S. Jang, et al., Phenyl 2-pyridyl ketoxime induces cellular senescence-like alterations via nitric oxide production in human diploid fibroblasts, Aging Cell, 2016, 15(2), 245–255 CrossRef CAS.
- N. R. Palepu, S. Adhikari, A. K. Verma, S. L. Shepherd, R. M. Phillips, W. Kaminsky and M. R. Kollipara, Half-sandwich ruthenium, rhodium and iridium complexes featuring oxime ligands: Structural studies and preliminary investigation of in vitro and in vivo anti-tumour activities, Appl. Organomet. Chem., 2017, 31(7), e3640 CrossRef.
- M. Alinaghi, K. Karami, A. Shahpiri, A. A. Momtazi-Borojeni, E. Abdollahi and J. Lipkowski, A Pd (II) complex derived from pyridine-2-carbaldehyde oxime ligand: Synthesis, characterization, DNA and BSA interaction studies and in vitro anticancer activity, J. Mol. Struct., 2020, 1219, 128479 CrossRef CAS.
- M. M. El-Bendary, T. S. Saleh, M. M. Alomari, E. M. Ali, B. Davaasuren, M. Jaremko and B. A. Babgi, Potential anticancer activities and catalytic oxidation efficiency of Platinum (IV) Complex, Molecules, 2022, 27(14), 4406 CrossRef CAS.
- K. Charan Pradhan, H. K. Kisan and S. Pal, Unexpected Ortho C–H Bond Activation in Coordinated 7,8-Benzoquinoline: Synthesis and Characterisation of Heteroleptic Ir( III )-7,8-Benzoquinoline Complexes, RSC Adv., 2021, 11(21), 12578–12582 RSC.
- K. C. Pradhan, M. Jadab, S. Barik, N. Behera, B. Bag and S. Pal, Pyridine Aldoxime Ligation to Iridium(III) Centre: An Innocent Ancillary Ligand in a Series of Organometallic Complexes, J. Mol. Struct., 2023, 1271, 133998 Search PubMed.
- M. Jadab, K. C. Pradhan, S. Behera, S. K. Agrawalla, S. Barik, C. S. Purohit, S. Samanta, M. K. Santra, J. Kumar and S. Pal, Luminescent Platinum (II) Complexes Featuring Innocent Pyridine-2-aldoxime Ligand: Synthesis, Characterization, and Exploration of Their In Vitro Cytotoxicity Properties, ChemistrySelect, 2025, 10(17), e202500328 CrossRef CAS.
- K. C. Pradhan, M. Jadab, S. Rout, R. Dandela, D. Mandal, T. Parija, S. Barik, J. Kumar and S. Pal, Orange/red light emitting iridium (III) organometallic complexes containing 2, 3-di (pyridine-2-yl) quinoxaline as ancillary ligand and their anticancer properties, Z. Anorg. Allg. Chem., 2023, 649(22), e202300169 CrossRef CAS.
- K. Xiong, Y. Chen, C. Ouyang, R. L. Guan, L. N. Ji and H. Chao, Cyclometalated iridium(III) complexes as mitochondria-targeted anticancer agents, Biochimie, 2016, 125, 186–194 CrossRef CAS.
- A. Zamora, G. Vigueras, V. Rodríguez, M. D. Santana and J. Ruiz, Cyclometalated iridium (III) luminescent complexes in therapy and phototherapy, Coord. Chem. Rev., 2018, 360, 34–76 CrossRef CAS.
- R. D. Sanner, N. J. Cherepy, H. Q. Pham and V. G. Young, Phosphorescent Heteroleptic Iridium(III) Cyclometallates: Improved Syntheses of Acetylacetonate Complexes and Quantum Chemical Studies of Their Excited State Properties, Polyhedron, 2020, 176, 114256 CrossRef CAS.
- Y. You and W. Nam, Photofunctional triplet excited states of cyclometalated Ir (III) complexes: beyond electroluminescence, Chem. Soc. Rev., 2012, 41(21), 7061–7084 RSC.
- B. S. McGhie and J. R. Aldrich-Wright, Photoactive and luminescent transition metal complexes as anticancer agents: a guiding light in the search for new and improved cancer treatments, Biomedicines, 2022, 10(3), 578 CrossRef CAS.
- P. Bujak, I. Kulszewicz-Bajer, M. Zagorska, V. Maurel, I. Wielgus and A. Pron, Polymers for electronics and spintronics, Chem. Soc. Rev., 2013, 42, 8895–8999 RSC.
- F. Du, L. Bai, M. He, W. Y. Zhang, Y. Y. Gu, H. Yin and Y. J. Liu, Design, synthesis and biological evaluation of iridium (III) complexes as potential antitumor agents, J. Inorg. Biochem., 2019, 201, 110822 CrossRef CAS.
- L. Lu, L. J. Liu, W. C. Chao, H. J. Zhong, M. Wang, X. P. Chen and C. H. Leung, Identification of an iridium (III) complex with anti-bacterial and anti-cancer activity, Sci. Rep., 2015, 5(1), 14544 CrossRef CAS.
- M. Redza-Dutordoir and D. A. Averill-Bates, Activation of apoptosis signalling pathways by reactive oxygen species, Biochim. Biophys. Acta Mol. Cell Res., 2016, 1863(12), 2977–2992 CrossRef CAS.
- B. Xie, Y. Wang, D. Wang, X. Xue and Y. Nie, Synthesis, Characterization and Anticancer Efficacy Studies of Iridium (III) Polypyridyl Complexes against Colon Cancer HCT116 Cells, Mol. Basel Switz., 2022, 27(17), 5434 CAS.
- W. L. F. Armarego and C. L. L. Chai, Purification of Laboratory Chemicals, Elsevier, 6th edn, 2013 Search PubMed.
- M. Nonoyama, Benzo[h]Quinolin-10-Yl-N Iridium(III) Complexes. Bull, J. Chem. Soc. Jpn., 1974, 47(3), 767–768 CAS.
- F. Neese, The ORCA Program System, Wiley Interdiscip. Rev.:Comput. Mol. Sci., 2012, 2(1), 73–78 CAS.
- S. Grimme, J. Antony, S. Ehrlich and H. Krieg, A Consistent and Accurate Ab Initio Parametrization of Density Functional Dispersion Correction (DFT-D) for the 94 Elements H-Pu, J. Chem. Phys., 2010, 132(15), 154104 CrossRef.
- P. J. Hay and W. R. Wadt, Ab Initio Effective Core Potentials for Molecular Calculations. Potentials for K to Au Including the Outermost Core Orbitals, J. Chem. Phys., 1985, 82(1), 299–310 CrossRef CAS.
- W. J. Hehre, R. Ditchfield and J. A. Pople, Self—Consistent Molecular Orbital Methods. XII. Further Extensions of Gaussian—Type Basis Sets for Use in Molecular Orbital Studies of Organic Molecules, J. Chem. Phys., 1972, 56(5), 2257–2261 CrossRef CAS.
- P. C. Hariharan and J. A. Pople, The Influence of Polarization Functions on Molecular Orbital Hydrogenation Energies, Theor. Chim. Acta, 1973, 28(3), 213–222 CrossRef CAS.
- A. V. Marenich, C. J. Cramer and D. G. Truhlar, Universal Solvation Model Based on Solute Electron Density and on a Continuum Model of the Solvent Defined by the Bulk Dielectric Constant and Atomic Surface Tensions, J. Phys. Chem. B, 2009, 113(18), 6378–6396 CrossRef CAS.
- J. Pradhan, C. Mohanty and S. K. Sahoo, Protective efficacy of crocetin and its nanoformulation against cyclosporine A-mediated toxicity in human embryonic kidney cells, Life Sci., 2019, 216, 39–48 CrossRef CAS.
- C. C. Liang, A. Park and J. L. Guan, In vitro scratch assay: a convenient and inexpensive method for analysis of cell migration in vitro, Nat. Protoc., 2007, 2, 329–333 CrossRef CAS.
- N. Franken, H. Rodermond, J. Stap, J. Haveman and C. Bree, Clonogenic assay of cells in vitro, Nat. Protoc., 2006, 1, 2315–2319 CrossRef CAS.
- E. Bagheri, F. Hajiaghaalipour, S. Nyamathulla and N. A. Salehen, Ethanolic extract of Brucea javanica inhibit proliferation of HCT-116 colon cancer cells via caspase activation, RSC Adv., 2018, 8(2), 681–689 RSC.
- M. N. Breit, W. C. Kisseberth, M. D. Bear, Y. Landesman, T. Kashyap, D. McCauley, M. G. Kauffman, S. Shacham and C. A. London, Biologic activity of the novel orally bioavailable selective inhibitor of nuclear export (SINE) KPT-335 against canine melanoma cell lines, BMC Vet. Res., 2014, 10(160), 1–11 Search PubMed.
Footnote |
| † Electronic supplementary information (ESI) available. CCDC 2377820 and 2377821. For ESI and crystallographic data in CIF or other electronic format see DOI: https://doi.org/10.1039/d5ra03076e |
| This journal is © The Royal Society of Chemistry 2025 |