
 Open Access Article
 This Open Access Article is licensed under a Creative Commons Attribution-Non Commercial 3.0 Unported Licence
Tribocatalytic degradation of concentrated methyl orange solutions by BiFeO3 nanoparticles prepared through a sol–gel method
Yanhong Gu a,
Weiying Zhanga,
Yuen Lia,
Kelan Wanga,
Lanlan Gea,
Xianghui Zhanga,
Jianguo Zhaoa,
Zhenjiang Shenb,
Wanping Chenc and
Yaohua Hu*a
a,
Weiying Zhanga,
Yuen Lia,
Kelan Wanga,
Lanlan Gea,
Xianghui Zhanga,
Jianguo Zhaoa,
Zhenjiang Shenb,
Wanping Chenc and
Yaohua Hu*a
aSchool of Physics and Electronic Information and Key Lab Electromagnet Transformat&Detect Henan, Luoyang Normal College, Luoyang 471022, Henan, P. R. China. E-mail: huyaohua1@sina.com
bCollege of Physics and Electronic Engineering, Hainan Normal University, Hainan 571158, China
cSchool of Physics and Technology, Wuhan University, Wuhan 430072, China
First published on 4th July 2025
Abstract
With a relatively narrow bandgap of around 2.0 eV, BiFeO3 (BFO) nanoparticles have been extensively investigated as an appealing visible-light photocatalyst. In this study, BFO nanoparticles prepared through a sol–gel method were explored as a tribocatalyst to degrade methyl orange (MO) solutions. With BFO nanoparticles stimulated through magnetic stirring using Teflon magnetic rotary disks, as much as 100% of 10 mg per L MO and 99% of 30 mg per L MO solutions were degraded after 20 min and 160 min of magnetic stirring, respectively. For reference, TiO2 nanoparticles (P25) were stimulated under the same conditions and degraded 97% of 10 mg per L MO and 97% of 30 mg per L MO solutions after 150 min and 540 min of magnetic stirring, respectively. The calculated MO degradation rate constants for BFO at concentrations of 10 mg per L and 30 mg per L were 4.94 h−1 and 1.19 h−1, respectively, while the corresponding values for P25 were 0.86 h−1 and 0.40 h−1, respectively. Free radical trapping experiments showed that positive holes are by far the most important active species in the tribocatalytic degradation of MO by BFO. These findings suggest that in addition to its versatile applications, multiferroic BFO is promising for converting mechanical energy into chemical energy through tribocatalysis.
1. Introduction
The extensive use of fossil fuels has not only resulted in the escalating depletion of fossil fuels but has also detrimentally impacted the global environment.1,2 In recent years, there has been a growing emphasis on technologies able to capture and use renewable energies from nature,3,4 including thermal, solar, chemical, mechanical, and biological energy. Photocatalysis is a well-known technology for absorbing solar light and converting it into chemical energy, in which electron–hole pairs are excited in semiconductors upon light irradiation and subsequently induce various redox reactions.5–7 The photocatalytic treatment of various pollutants has become a research hotspot in the past decade.8–12 However, owing to the inherent instability of solar light and the limited effectiveness of promising photocatalysts, photocatalysis alone is insufficient to provide a satisfactory solution to environmental pollution.13–15Similar to solar light, mechanical energy is a renewable source of energy widely available in nature.4,7 While mechanical energy derived from rivers, winds and tides has been mostly converted into electricity to date, there has been a growing interest in harnessing natural mechanical energy for environmental remediation in recent years, which has inspired the development of some novel technologies.13,16–18 In 2019, Li et al. first reported the tribocatalytic degradation of organic dyes by Ba0.75Sr0.25TiO3 nanoparticles,19 which marks the beginning of the utilization of mechanical energy through friction for environmental remediation. Subsequently, numerous other materials, such as BaTiO3,7,20–22 FeS2,23 ZnO,16,24 BiOIO3,13 Bi2WO6,25,26 SrTiO3,24 TiO2,17,27 and CdS22 were explored for the tribocatalytic degradation of organic dyes, and some encouraging results were obtained. The source of friction catalysis was initially mechanical stirring using Teflon magnetic stir bars. To investigate the efficiency of friction catalysis, the number of Teflon magnetic stir bars was increased.13,19 In 2022, Cui et al. proposed replacing Teflon magnetic stir bars with rotating discs, which significantly enhanced the efficiency of friction catalysis.27 The test methods are ultimately identified and discussed on the basis of the catalytic degradation efficiency of the dyes.
Considering the above-mentioned materials, it can be seen that many materials that have been investigated in tribocatalysis are semiconductors.28 As a matter of fact, a mechanism based on the excitation of electron–holes pairs in semiconductors by mechanical energy absorbed through friction has been proposed for tribocatalysis.17,19 This implies the importance of materials with a semiconductor-type bandgap in tribocatalysis.4,13 BiFeO3, a well-known multiferroic material, has a narrow bandgap of 2.0 eV.6 BFO has demonstrated significant potential in the photocatalytic breakdown of water pollutants9,12 and the construction of heterojunction photocatalytic water splitting for hydrogen production. This is attributed to its outstanding crystal structure characteristics and ability to be activated under visible light for photocatalytic processes.29,30 In this study, BFO nanoparticles were prepared through a sol–gel method, and their potential in environmental remediation was evaluated in terms of the tribocatalytic degradation of methyl orange (MO)solutions. To our great surprise, stimulated by magnetic stirring using Teflon magnetic rotary disks,27 they degraded 99% of 30 mg per L MO in 180 min, with a degradation rate constant three times that of P25, an important commercial photocatalyst. It is well known that MO molecules possess high-energy bonds, and the degradation of a concentrated MO solution is highly challenging.25,31,32 These findings suggest that in addition to its numerous known uses, BFO exhibits a promising role in environmental remediation via tribocatalysis.
2. Experimental procedures
2.1 Material preparation and characterization
All raw materials were purchased from Shanghai Aladdin Biochemical Technology Co., Ltd. At 50 °C, 0.02 mol of Fe (NO3)3 9H2O (99%) and 0.021 mol of Bi (NO3)35H2O (99%) were added to 20 mL of ethylene glycol solution and stirred for 1.5 h. The mixture was left to settle for a while and then placed in an oven to dry at 100 °C for 48 h, followed by heating in a horizontal tube furnace at 600 °C in air for 3 h, and finally cooled to room temperature. For comparison, P25, a commercially available photocatalyst consisting of 30 nm titanium dioxide nanoparticles, was obtained from Degussa Chemical Company.The X-ray diffraction (XRD) patterns of the samples were obtained using an X-ray diffractometer (Smartlab-9) using Cu Kα radiation. The microstructures were analyzed through a scanning electron microscope (Inspect F50). The sample bandgap width was measured using UV-visible analysis (UV-2550; Shimadzu, Kyoto, Japan).
2.2 Tribocatalytic degradation of MO solutions
First, 0.3 g of bismuth ferrite powder or P25 was added to 30 mL of methyl orange solution in a glass beaker of Φ 40 × 50 mm. Next, a homemade Teflon magnetic rotary disk (described in details in a previous paper27) was placed in the beaker to stir the suspension at 400 rpm through a magnetic stirrer. The beaker was kept in the dark, and room temperature was maintained at 20 °C. Next, 1 mL of the suspension was sampled at specific intervals, and a clear solution was obtained through centrifugation. The concentration of MO was determined through UV-visible analysis (UV-2550; Shimadzu, Kyoto, Japan).2.3 Identification of active substances
The scavengers 0.03 mmol p-benzoquinone (BQ), 0.03 mmol disodium ethylenediaminetetraacetic acid salt (EDTA-2Na), 0.03 mmol tert-butanol (TBA), and 0.03 mmol AgNO3 were introduced into beakers containing 300 mg of BFO nanoparticles and 30 mL of MO solution to capture ˙O2− radicals, h+, ˙OH radicals, and electrons, respectively. Subsequently, employing identical conditions as those in the dye degradation experiment allowed us to evaluate the catalytic effect caused by friction on dye degradation.3. Results and discussions
The sol–gel method is widely adopted for the preparation of pure-phase BFO nanopowders at low temperature.33 Fig. 1a shows a representative XRD pattern of the BFO powder prepared using the sol–gel method in this study. The peaks (012), (104), (110), (202) and (024) closely match those of the standard PDF#86-1518 card for the perovskite structure BFO; from this, it can be seen that the BFO nanoparticles prepared using the sol–gel method have already formed a perovskite structure. No peaks from other phases were observed, indicating that the BFO nanoparticles had high phase purity. An electron microscopy image of BFO is shown in Fig. 1b. The average size and standard deviation of the sample grain size are 95.2 ± 32.0 nm, which is typical for BFO nanoparticles prepared through the sol–gel method.30,33 | ||
| Fig. 1 BFO nanoparticles prepared in this study: (a) XRD pattern; (b) SEM image (insert map of grain distribution). | ||
Being chemically stable, non-toxic, and inexpensive, P25 is an important commercial photocatalyst with wide-ranging applications.34–36 In recent years, P25 has also been recognized as a standard tribocatalyst for environmental remediation.17,27 As illustrated in Fig. 2a, when 10 mg per L MO solution suspended with P25 was magnetically stirred using a Teflon magnetic rotary disk, the absorbance peak at 464 nm in the ultraviolet-visible absorption spectrum decreased steadily with an increasing stirring time, and the color of the solution faded simultaneously, as illustrated in the inset. The degradation rate of a dye is usually calculated using the formula D = 1 − A/A0, where A0 represents the initial peak intensity of the dye and A represents the peak intensity during the process. In this way, the degradation rate of MO by P25 reached 97% after 150 min, which is comparable to that obtained for P25 in a previous investigation.27
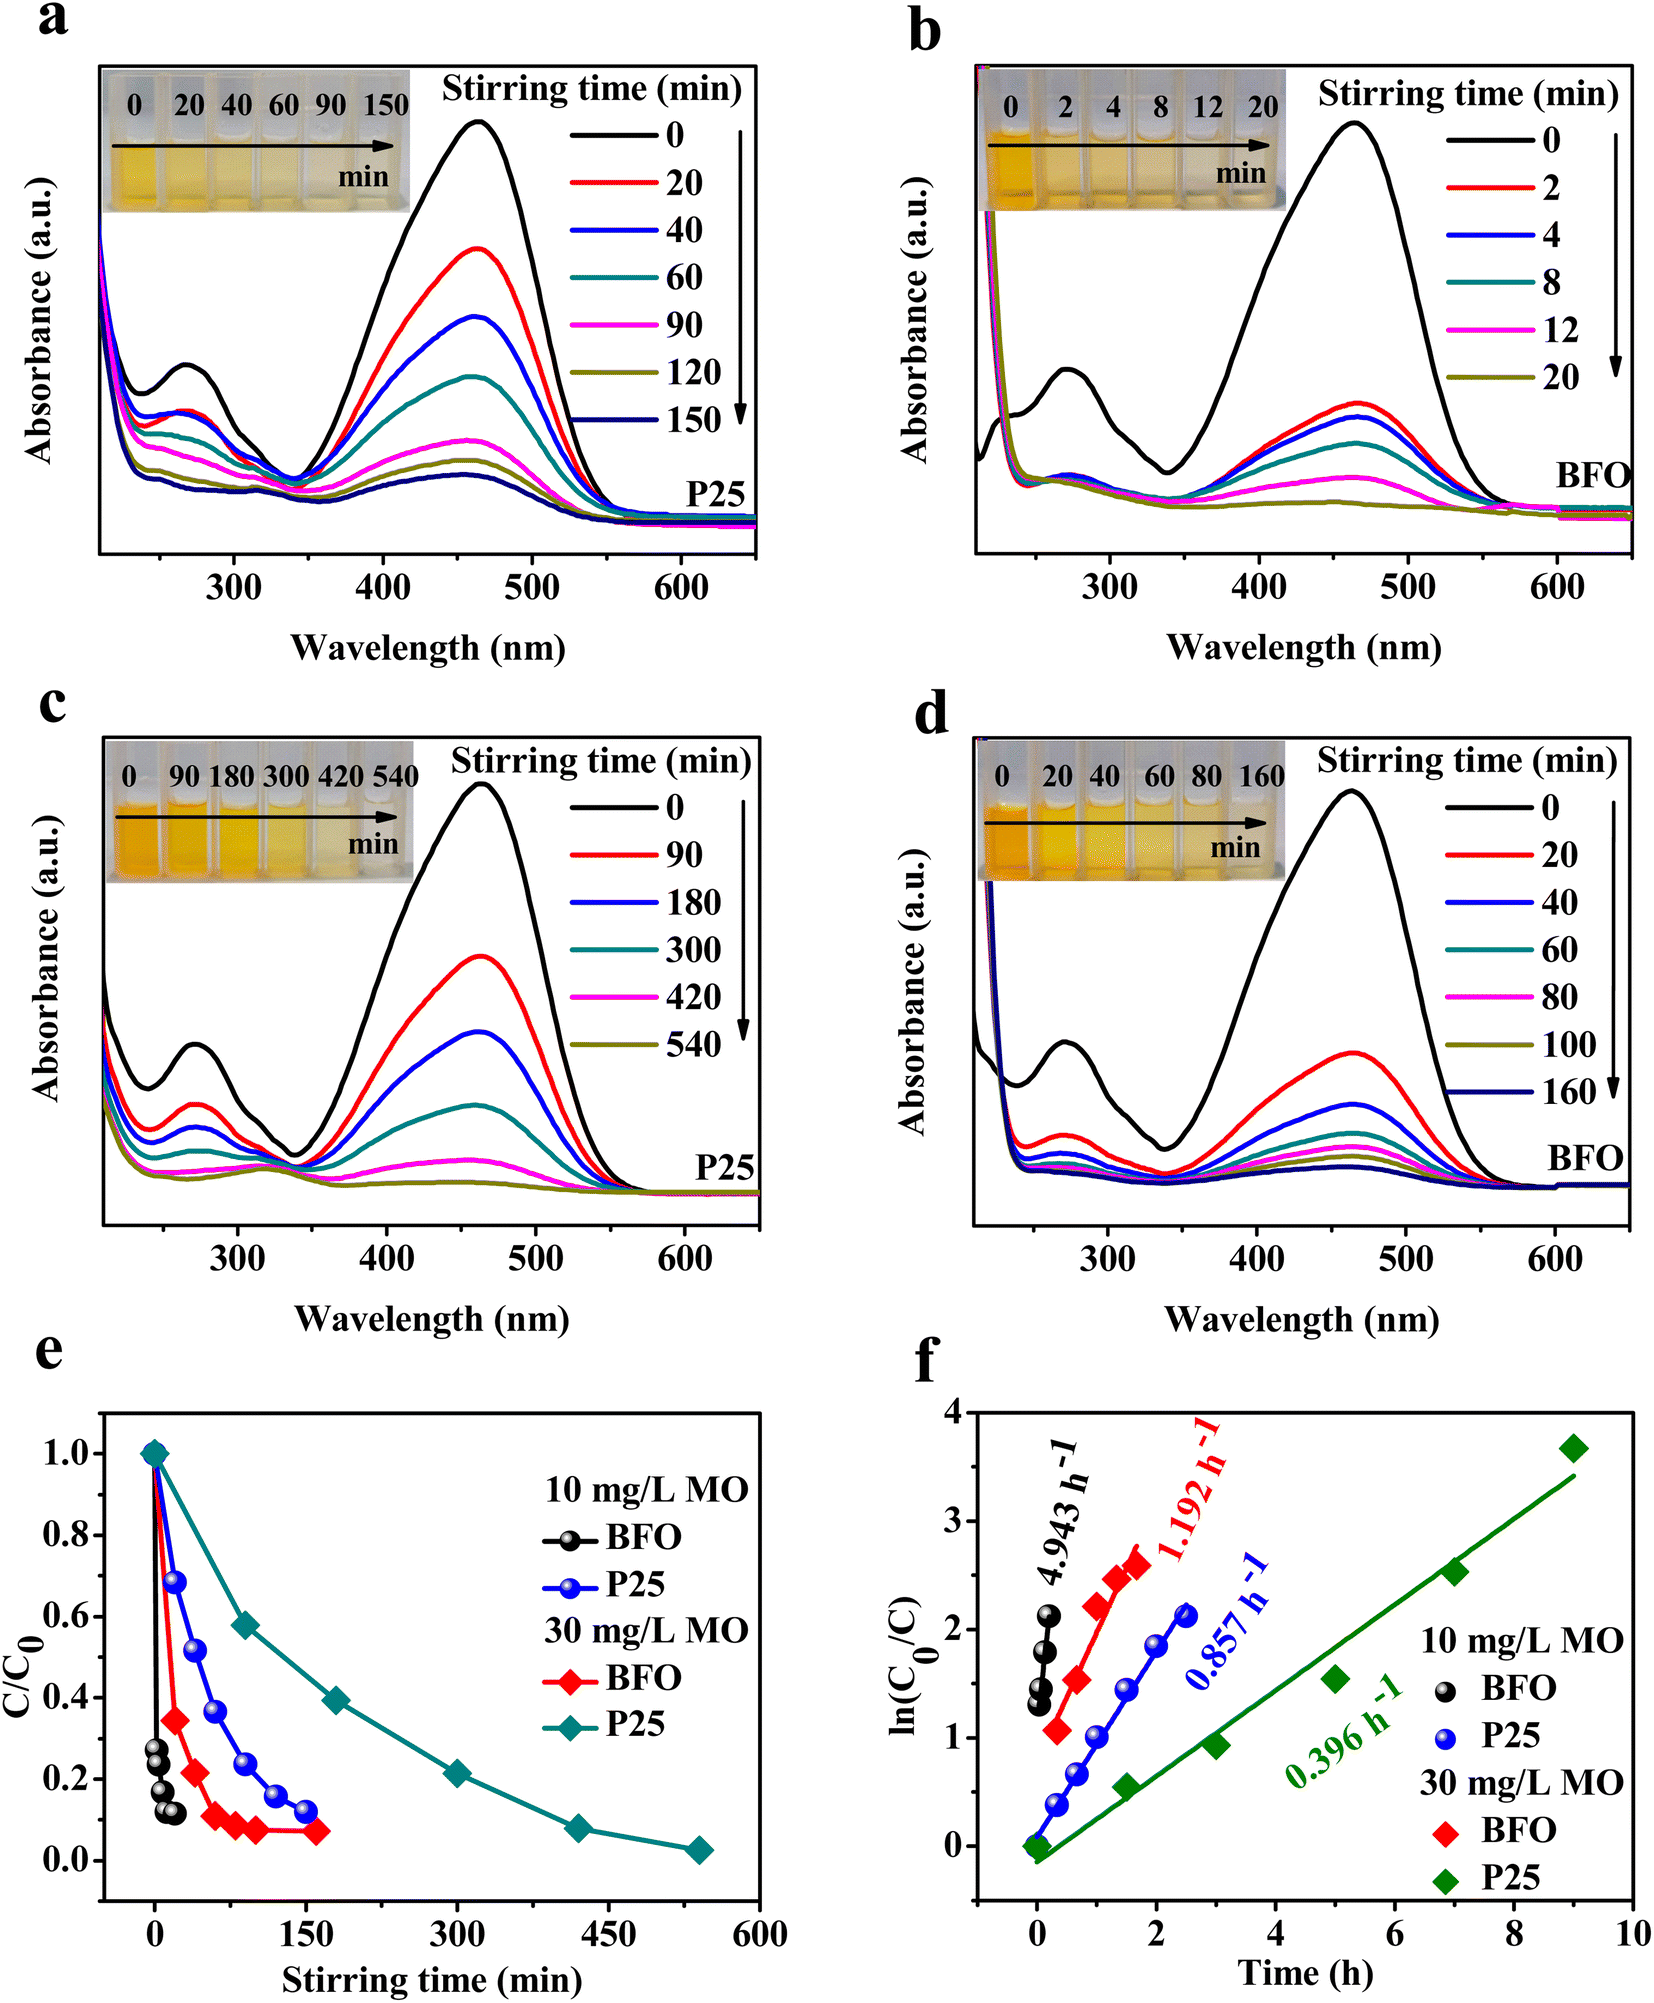 | ||
| Fig. 2 Ultraviolet-visible absorption spectra of MO at different concentrations (inset: color contrast): (a) P25 10 mg L−1, (b) BFO 10 mg L−1, (c) P25 30 mg L−1, and (d) BFO 30 mg L−1. (e) Degradation rates and (f) kinetics curves of BFO and P25 powders at 10 mg L−1 and 30 mg L−1 concentrations. | ||
To our great surprise, a quite different result was observed for the BFO nanoparticles prepared in this study when they were employed to degrade the 10 mg per L MO solution through magnetic stirring. As shown in Fig. 2b, the absorption peak at 464 nm completely disappeared, and the solution became completely colorless after only 20 min of magnetic stirring. Evidently, compared with P25, the BFO nanoparticles exhibited exceptionally outstanding capability in tribocatalytic degradation of MO solution.
It is well known that organic dyes at higher concentrations are more difficult to degrade.25,31,32 Therefore, it is interesting to further explore the tribocatalytic degradation of 30 mg per L MO solutions by the BFO nanoparticles. For reference, P25 was employed to degrade 30 mg per L MO first, and the result is shown in Fig. 2c. Notably, 97% of 30 mg per L MO was degraded by P25 after 540 min of magnetic stirring. Undoubtedly, 30 mg per L MO was much more difficult to degrade by P25 than 10 mg per L MO. The same result was observed for the BFO nanoparticles, which degraded 99% of 30 mg per L MO after 160 min of magnetic stirring, as shown in Fig. 2d. Although 30 mg per L MO was much more difficult to degrade by the BFO nanoparticles than 10 mg per L MO, this should be the most efficient degradation of concentrated MO solutions as per our knowledge.14,31,32,36 In a recent study on commercial 5 nm TiO2 nanoparticles, DXN RT-30, the TiO2 nanoparticles degraded 98.2% of 20 mg per L MO in 330 min17, which was an highly exceptional finding. In another study on the tribocatalytic degradation of 30 mg per L MO by Si single crystals, although the solution became colorless after 120 min of magnetic stirring, MO molecules were only broken into smaller molecules such as benzoic acid, succinic acid, and p-phenol,27 which were still harmful to the ambient environment. Therefore, a comparison of the degradation efficiency and catalytic mechanism of different catalysts for different dyes was conducted, as presented in Table 1.
| Catalyst | Organic dye | Mechanism | Friction Stimulation/speed | Degradation rate/time | Ref. |
|---|---|---|---|---|---|
| Ba0.75Sr0.25TiO3 | MO (5 mg L−1) | Electron transition | One PTFE rod/300 rpm | 100%/24 h | 19 |
| GaN | MO (20 mg L−1) | Electron transition | Teflon magnetic disk/400 rpm | 14%/24 h | 38 |
| TiO2 | MB (20 mg L−1) | Electron transition Al2O3 | Teflon magnetic disk/400 rpm | 93.1%/250 min | 27 |
| SrTiO3 | RhB (5 mg L−1) | Electron transfer | One PTFE rod/800 rpm | 88.6%/24 h | 24 |
| CdS | MO (20 mg L−1) | Electron transition | Teflon magnetic disk/400 rpm | 72%/24 h | 29 |
| Bi2WO6 | RhB (5 mg L−1) | Electron transfer | Two PTFE rods/500 rpm | 91%/12 h | 25 |
| CdS | RhB (5 mg L−1) | Electron transition | Four PTFE rods/— | 99%/14 h | 29 |
| Sr0.3Ba0.7TiO3 | MO (10 mg L−1) | Electron transition | — | 96%/12 h | 28 |
| ZnO2 | — | Teflon magnetic disk/400 rpm | 90%/5 h | 37 | |
| NiCo2O4 | 18 | ||||
| BiFeO3 | MO (30 mg L−1) | Electron transition | Teflon magnetic disk/400 rpm | 99%/160 min | This work |
The relationship curves between the degradation rates of 10 mg L−1 and 30 mg L−1 MO solutions treated with P25 and BFO nanoparticles and the magnetic stirring time are shown in Fig. 2e. For both MO solutions, the BFO nanoparticles exhibited a rather remarkable advantage over P25 in their degradation. On the basis of these curves, we developed an initial kinetic model to characterize the degradation efficiency of MO. As depicted in Fig. 2f, for MO solutions with concentrations of 10 mg L−1 and 30 mg L−1, the frictional catalytic degradation rate constants of P25 were 0.857 h−1 and 0.396 h−1, respectively, while the degradation rate constants of BFO were 4.943 h−1 and 1.192 h−1, respectively. The latter values show a 5.76- and 3.01-fold difference from the former values.
In order to examine the frictional catalytic effect of BFO on other dyes, the frictional catalytic degradation of methylene blue was conducted, as depicted in Fig. 3. From the ultraviolet-visible absorption peak, it can be observed that after 13 h, the degradation rate reached 90%, which was lower than that for methyl orange. The degradation of methylene blue indicates the universality of the BFO nanofriction catalysts prepared using the sol–gel method in the degradation of organic dyes, eliminating the reliance on a single dye type. This result is comparable to the reported degradation of methylene blue by P25, where Mao et al. reported that P25 friction catalyzed degradation of MB (30 mg L−1) occurred within 850 minutes at a degradation rate of 85%.17 From the fitted reaction rate constant, the deviation of the intermediate point is related to the special catalytic process of BFO and methyl blue, namely the process from 3 to 7 h, during which no degradation was observed. This is probably related to dynamic physical adsorption saturation.16 A similar phenomenon also occurred when DXN-RT30 (5 nm TiO2) degraded methylene blue.17 The result in Fig. 3c indicates that the frictional catalytic rate constant for MB degradation by BFO frictional catalysis was 0.126, which is lower than that for MO. This is also the reason for the low degradation efficiency of MB.
 | ||
| Fig. 3 (a) Ultraviolet-visible absorption spectra of methylene blue (MB) (inset color contrast), (b) degradation rate and (c) kinetics curves. | ||
To demonstrate the functioning of friction catalysis from multiple perspectives, solutions without stirring were sampled at the same time points, as shown in Fig. 4a. The results revealed that the MO dye containing BFO nanopowders was hardly degradable in the absence of stirring. In previous investigations, a modified Teflon magnetic stirring rod adorned with two rings was often used to examine the absorption of organic dyes by nanoparticles.13,17,19 Similarly, a rubber-sealed magnetic stirring rod was used to stir a 30 mg per L MO solution containing BFO nanoparticles, as shown in Fig. 4b. The intensity of the peak at 464 nm initially decreased very quickly, then gradually decreased, and even after 8 h of magnetic stirring, 40% of the peak intensity remained. Compared with the results shown in Fig. 2d, it can be concluded that for a concentrated MO solution, the concentration of MO molecules in the solution can be quickly decreased by BFO nanoparticles through adsorption. However, only through tribocatalysis can MO molecules be thoroughly removed from the solution.
 | ||
| Fig. 4 The color and UV-visible adsorption spectra evolution of BFO nanoparticles (a) MO (10 mg per L) without agitation (b) MO (30 mg per L) under stirring using a rubber-sealed stirring rod. | ||
In the friction catalytic process, a polytetrafluoroethylene circular turntable is used instead of a polytetrafluoroethylene magnetic rod, and friction-catalytic efficiency is improved. The results indicated that the greater the number of magnetic stirring rods, the larger the contact area and the higher the efficiency of dye degradation.16,25 When the size of the stirring rods was determined, the stirring speed of the magnets also played a decisive role. Generally, the degradation efficiency of friction catalysis at a medium stirring rate was superior to that at low speed.13,16 The above results fully illustrate the crucial role of friction in the degradation process (Table 2).
| Full name | BiFeO3 | Methyl orange | TiO2 nanoparticles | 5 nm TiO2 nanoparticles |
| Abbreviations | BFO | MO | P25 | DXN RT-30 |
The recyclability and stability, regarded as a major indicator for evaluating catalysts, the recyclability result for BFO as a friction catalyst for degrading methyl orange is presented in Fig. 5. As can be seen from the data in the figure, the degradation rate for BFO nanopowder for the first time was 99.12%, and the degradation rates for the subsequent four times were 92.26%, 81.43%, 63.45%, and 90%. With the increase in the number of cycles, the degradation rate slightly decreased. On the one hand, it is somewhat related to the loss of powder in the degradation process; on the other hand, it has a certain relationship with the structural stability of the powder. XRD results after five cycles of testing indicate that the XRD peaks of iron oxide are detected in the BFO powder after the fifth cycle, suggesting the generation of new substances during the friction process. Further in-depth studies are underway.
 | ||
| Fig. 5 The process cycle diagram of the tribocatalytic degradation of methyl orange by BFO nanopowders. | ||
The band structures and bandgap widths of BFO and P25 were analyzed. The UV-visible absorption spectra of the BFO and P25 nanoparticles are presented in Fig. 4a. It is evident that with a decreasing wavelength, absorption abruptly increases at 678 nm for BFO and at 400 nm for P25, which are consistent with previously reported data.6,33 The Tauc plot was employed to perform a linear extrapolation of (αhv)2(α: absorption coefficient; h: Planck's constant; v: frequency of incident light) to zero, allowing for the determination of optical bandgap values for BFO and P25 nanoparticles, which were found to be approximately 1.9 and 3.24 eV, respectively, as depicted in Fig. 4b. These values are typical for BFO and P25. According to the electron transition mechanism for tribocatalysis,4,17 electron–hole pairs are excited in semiconductors by the mechanical energy absorbed through friction. Furthermore, the position of the valence band directly determines the oxidation ability of the vacancies located in the valence band; this indicates that the larger the position, the stronger the oxidation ability of the holes at that position. The position of the conduction band determines the reduction ability of electrons.14,19 Therefore, considering the overall band transition mechanism, on the basis of satisfying the band electron transition, the larger the valence band position, the stronger the oxidation ability of the holes. The valence band position of BFO is approximately 1.75 eV vs. NHE, while that of P25 is 3.0 eV vs. NHE.13,15 However, the wide bandgap of P25 limits the generation of electrons and holes, affecting its frictional catalytic efficiency. With a much smaller bandgap, BFO will have more electron–hole pairs excited than P25, which should explain its much better tribocatalytic degradation of MO than that of P25 (Fig. 6).
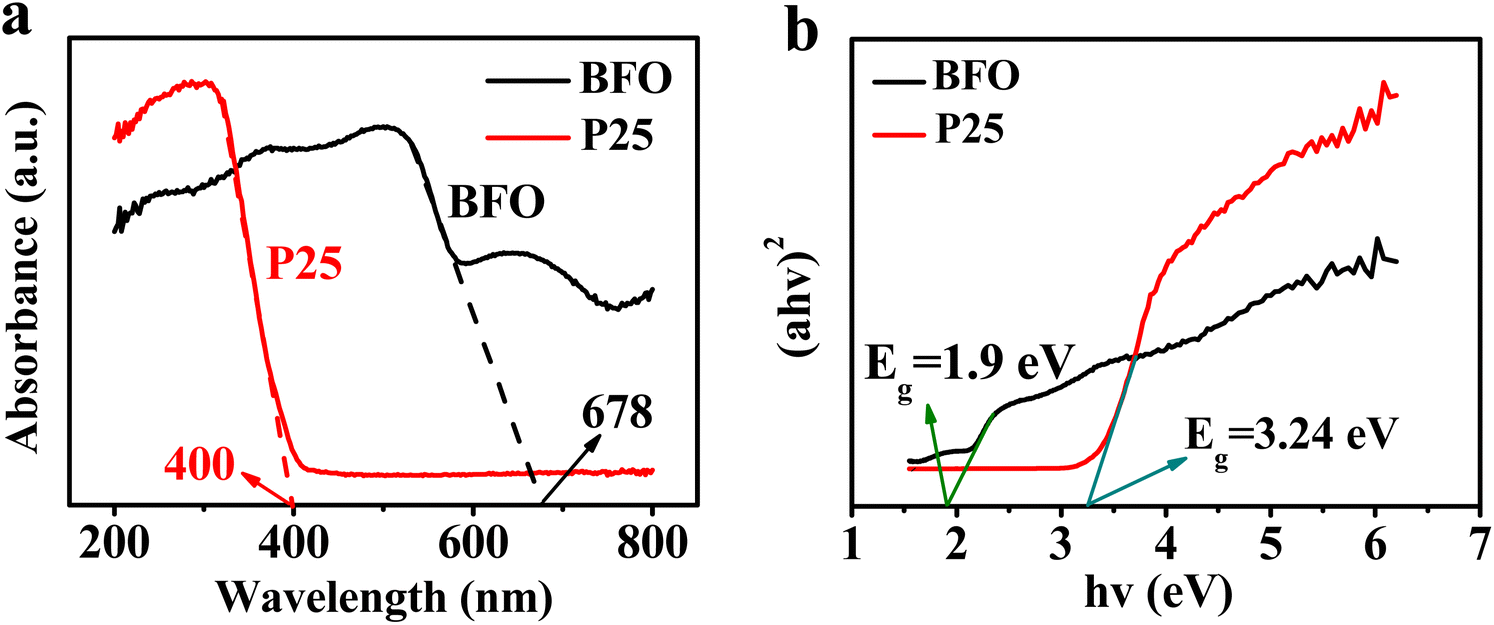 | ||
| Fig. 6 (a) p25 and BFO UV absorption; (b) calculated bandgap plots. | ||
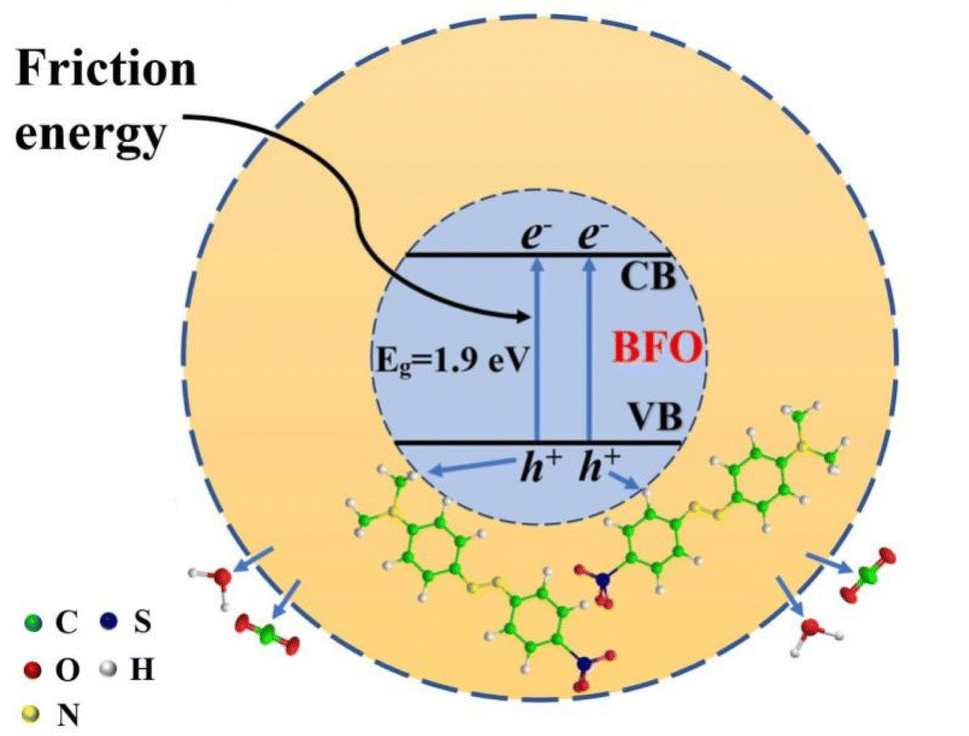
After electron–hole pairs are excited in BFO, they diffuse to the surface of the nanoparticles and induce various subsequent reactions. Experiments were carried out to investigate the main active species responsible for degrading MO solutions using BFO nanoparticles. As shown in Fig. 7, the inhibitory effects of TBA, BQ, and EDTA-2Na on the degradation of methyl orange by BFO are 10.8%, 17.5%, and 95.1%, respectively, while the inhibitory effect of AgNO3 is almost negligible. It is well known that BQ, EDTA-2Na, TBA, and AgNO3 capture ˙O2− radicals, h+ holes, ˙OH radicals, and e− electrons, respectively. Obviously, positive holes are by far the most active species in the tribocatalytic degradation of methyl orange by BFO.
 | ||
| Fig. 7 Effects of different free radical scavengers on the tribocatalytic degradation of MO by BFO nanoparticles. | ||
The mechanism of friction catalysis is likely similar to that of photocatalysis. The semiconductor materials involved in friction catalysis are typically narrow-bandgap semiconductors. Friction, as a kind of mechanical energy, and the catalyst, which is generally a semiconductor material, promotes the electrons of the catalyst to jump from the valence band to the conduction band during the friction process, thereby generating holes in the valence band and electrons in the conduction band. These electrons and holes participate in redox reactions that facilitate the degradation of dyes. For the tribocatalytic degradation of MO by TiO2 nanoparticles, it has been shown that h+, e−, ˙OH, and ˙O2− all participate in the degradation of MO molecules within the solution, which can be expressed as follows:17
| h+/e−/˙OH/˙O2− + MO → degradation | (1) |
However, according to the radical capturing results shown in Fig. 5, holes are mostly responsible for the degradation of MO in this study, which can be expressed as follows:
| BFO → BFO + eVC− + hVB+ | (2) |
| h+ + OH− + MO → degradation | (3) |
Fig. 8 presents a schematic of the process of tribocatalytic degradation of MO by BFO nanoparticles. Two points are worthy to be emphasized: one is that the bandgap (1.9 eV) is relatively narrow, which accounts for the exceptional tribocatalytic degradation of MO by BFO. The other is that holes have been found by far the most active species in the tribocatalytic degradation of methyl orange by BFO, and the reaction of holes and MO molecules is highlighted in Fig. 8.
 | ||
| Fig. 8 Mechanism diagram of the friction catalytic effect of BFO powder. | ||
4. Conclusions
As a branch of mechanochemistry, friction catalysis exhibits vast application prospects in dye degradation, water pollution governance, and environmental restoration. BFO nanoparticles prepared via the sol–gel method demonstrated significant mechanical degradation capability in 10 mg per L and high-concentration 30 mg per L MO solutions. At a Teflon disk rotation speed of 400 rpm, under dark and room temperature conditions, the BFO nanoparticles exhibited degradation rates of 99% and 100% for MO at concentrations of 10 mg per L and 30 mg per L within 20 minutes and 160 minutes, respectively. These results can be attributed to the appropriate crystallite size (≈150 nm), crystallinity, and suitable bandgap width (1.9 eV) of the BFO nanoparticles. The BFO nanoparticles exhibited pronounced physical adsorption characteristics toward MO dye molecules. Based on the results of the active substance capture experiment, it is hypothesized that the degradation of MO molecules is primarily facilitated by the action of h+ ions. This study not only underscores the significant potential of BFO nanoparticles prepared using the sol–gel method for environmental remediation, but also promotes the advancement of more sophisticated friction catalysts.Data availability
The data that support the findings of this study are available from the corresponding author upon reasonable request.Author contributions
Y. G.: conceptualization and writing; W. Z.: funding and revisions; Y. L.: experiment implementation and analysis; K. W.: model building and experiment implementation; L. G.: experiment implementation; X. Z.: formal analysis; J. Z.: funding and revisions; W. C. and Y. H.: writing – reviewing and editing.Conflicts of interest
The authors declare that all the authors have no competing financial interests or personal relationships that influence the work reported in this article.Acknowledgements
This research was supported by the Basic Research Project of Key Research Projects in Higher Education Institutions in Henan Province (23ZX019), Program for Young Core Teachers of Colleges and Universities in Henan Province (2019GGJS197), and The Higher Education Undergraduate Innovation Training Program in Henan Province (202410482041).References
- P. Anand, D. P. Jaihindh, W. K. Chang and Y. P. Fu, Appl. Surf. Sci., 2021, 540, 148387 CrossRef CAS.
- Y. Wang, S. Shen, M. Liu, G. He and X. Li, Colloid Interface Sci., 2024, 655, 187–198 CrossRef CAS.
- Z. Wang, X. Xuanli Dong, W. Tang and Z. L. Wang, Chem. Soc. Rev., 2024, 53, 4349–4373 RSC.
- X. Li, W. Tong, J. Shi, Y. Chen, Y. Zhang and Q. An, J. Mater. Chem. A, 2023, 11, 4458–4472 RSC.
- A. Soam, R. Kumar, M. Singh, D. Thatoi and R. O. Dusane, J. Alloys Compd., 2020, 813, 152145 CrossRef CAS.
- Y. Zhu, C. Quan, Y. Ma, Q. Wang, W. Mao, X. Wang, J. Zhang, Y. Min, J. Yang and X. a. Li, Mater. Sci. Semicond. Process., 2017, 57, 178–184 CrossRef CAS.
- A. Gaur, C. Porwal, V. S. Chauhan and R. Vaish, J. Am. Ceram. Soc., 2024, 107, 2393–2406 CrossRef CAS.
- Z. Li, Y. Xie, Y. Wang, Y. Peng, Z. Deng, B. Liu, G. Zhang, X. Wang, F. Zhang and L. Zhu, J. Solid State Chem., 2023, 317, 123707 CrossRef CAS.
- A. Dhawan, A. Sudhaik, P. Raizada, S. Thakur, T. Ahamad, P. Thakur, P. Singh and C. M. Hussain, J. Ind. Eng. Chem., 2023, 117, 1–20 CrossRef CAS.
- P. Banoth, C. Kandula, P. K. Lavudya, S. Akaram, L. De Los Santos Valladares, R. Ammanabrolu, G. K. Mamidipudi and P. Kollu, ACS omega, 2023, 8, 18653–18662 CrossRef CAS.
- M. Ghorbani, S. Sheibani, H. Abdizadeh and M. R. Golobostanfard, J. Mater. Res. Technol., 2023, 22, 1250–1267 CrossRef CAS.
- F. Gao, X. Chen, K. Yin, S. Dong, Z. Ren, F. Yuan, T. Yu, Z. Zou and J. Liu, Adv. Mater., 2007, 19, 2889–2892 CrossRef CAS.
- H. Lei, M. Wu, F. Mo, S. Ji, X. Dong, Z. Wu, J. Gao, Y. Yang and Y. Jia, Nano Energy, 2020, 78, 105290 CrossRef CAS.
- L. V. Trandafilović, D. J. Jovanović, X. Zhang, S. Ptasińska and M. Dramićanin, Appl. Catal., B, 2017, 203, 740–752 CrossRef.
- S. Fang and Y. H. Hu, Soc. Rev., 2022, 51, 3609–3647 RSC.
- J. Zhao, F. Chen, W. Luo, H. Li, Z. Wu, Z. Xu, Y. Zhang, H. Zhang, G. Yuan and J. Gao, Ceram. Int., 2020, 46, 25293–25298 CrossRef CAS.
- C. Mao, H. Lei, Z. Guo, X. Jia, X. Cui, J. Huang, L. Fei, Y. Jia and W. Chen, Ceram. Int., 2024, 50, 4737–4745 CrossRef CAS.
- H. Lei, X. Cui, X. Jia, J. Qi, Z. Wang and W. Chen, Nanomaterials, 2022, 13, 46 CrossRef.
- P. Li, J. Wu, Z. Wu, Y. Jia, J. Ma, W. Chen, L. Zhang, J. Yang and Y. Liu, Nano Energy, 2019, 63, 103832 CrossRef CAS.
- A. Gaur, C. Porwal, V. S. Chauhan and R. Vaish, Sci.: Mater. Electron., 2023, 34, 2154 CAS.
- L. Geng, Y. Qian, W. Song and L. Bao, Appl. Surf. Sci., 2023, 637, 157960 CrossRef CAS.
- B. Yang, H. Chen, Y. Yang, L. Wang, J. Bian, Q. Liu and X. Lou, J. Mater. Chem. C, 2021, 416, 128986 CAS.
- X. Li, W. Tong, W. Song, J. Shi and Y. Zhang, J. Cleaner Prod., 2023, 414, 137566 CrossRef.
- J. Cao, Y. Jia, X. Wan, B. Li, Y. Zhang, S. Huang, H. Yang, G. Yuan, G. Li and X. Cui, Ceram. Int., 2022, 48, 9651–9657 CrossRef CAS.
- M. Wu, H. Lei, J. Chen and X. Dong, J. Colloid Interface Sci., 2021, 587, 883–890 CrossRef CAS.
- M. Wu, Y. Zhang, Y. Yi, B. Zhou, P. Sun and X. Dong, J. Hazard. Mater., 2023, 459, 132147 CrossRef CAS.
- X. Cui, P. Li, H. Lei, C. Tu, D. Wang, Z. Wang and W. Chen, Sep. Purif. Technol., 2022, 289, 120814 CrossRef CAS.
- C. Mao, Y.-C. Zhang, H. Lei, X. Jia, F. Chen, W. Yao, P. Liu and W. Chen, Appl. Surf. Sci., 2024, 663, 160172 CrossRef CAS.
- A. Lima, J. Phys. Chem. Solids, 2020, 144, 109484 CrossRef CAS.
- H. You, Z. Wu, L. Zhang, Y. Ying, Y. Liu, L. Fei, X. Chen, Y. Jia, Y. Wang and F. Wang, Angew. Chem., Int. Ed., 2019, 131, 11905–11910 CrossRef.
- A. Ranjbari, J. Kim, J. Yu, J. Kim, M. Park, N. Kim, K. Demeestere and P. M. Heynderickx, Catal. Today, 2024, 427, 114413 CrossRef CAS.
- A. Hojjati-Najafabadi, E. Farahbakhsh, G. Gholamalian, P. Feng, F. Davar, T. M. Aminabhavi, Y. Vasseghian, H. Kamyab and H. Rahimi, J. Water Process Eng., 2024, 59, 105002 CrossRef.
- J.-H. Xu, H. Ke, D.-C. Jia, W. Wang and Y. Zhou, J. Alloys Compd., 2009, 472, 473–477 CrossRef CAS.
- K. Nakata and A. Fujishima, J. Photochem. Photobiol., C, 2012, 13, 169–189 CrossRef CAS.
- M. Rafique, S. Hajra, M. Irshad, M. Usman, M. Imran, M. A. Assiri and W. M. Ashraf, ACS Omega, 2023, 8, 25640–25648 CrossRef CAS.
- Y. Zhu, J. Ren, G. Huang, C. L. Dong, Y. C. Huang, P. Lu, H. Tang, Y. Liu, S. Shen and D. Yang, Adv. Funct. Mater., 2024, 34, 2311623 CrossRef CAS.
- X. Xu, C. Mao, J. Song, S. Ke, Y. Hu, W. Chen and C.J.M. Pan, Materials, 2024, 17, 3487 CrossRef CAS.
- H. Lei, X. Cui, X. Jia, J. Qi, Z. Wang and W.J.N. Chen, Nanomaterials, 2022, 13, 46 CrossRef.
| This journal is © The Royal Society of Chemistry 2025 |