DOI:
10.1039/D5RA02116B
(Paper)
RSC Adv., 2025,
15, 23414-23426
Numerical investigation on the dynamic behavior of bubbles under forced flow in a microchannel†
Received
26th March 2025
, Accepted 30th June 2025
First published on 8th July 2025
Abstract
Understanding the process of bubble detachment and motion along microchannel walls, driven by liquid flow, is crucial for elucidating bubble dynamics and realizing diverse applications within the realm of microfluidics. This paper uses the phase-field method to perform a comprehensive numerical study on the conversion of surface gas bubbles into bulk bubbles at the lower wall of a microfluidic channel. The study identifies several key factors that have a coupled impact on the ‘surface-bulk’ conversion, including wall wettability, Reynolds number, and the initial contact angle/volume of the surface bubbles (with contact angle and volume positively correlated at a fixed base radius). Specifically, higher Reynolds numbers, smaller initial bubble contact angles, and more hydrophilic channel walls facilitate the detachment of surface bubbles from the channel wall. However, at high Reynolds numbers, bubbles on superhydrophilic surfaces may be split, causing fluctuations or longer conversion time. Conversely, as wall hydrophobicity increases, surface bubbles remain attached.
Introduction
Surface and bulk micro/nanobubbles are two distinct types of gaseous domains at the micro/nanoscale. Surface bubbles are spherical-cap-shaped gas bubbles forming on immersed substrates,1–3 while bulk bubbles are gaseous domains dispersed in solutions.4 The two kinds of gas bubbles have attracted significant attention in recent decades due to their numerous potential applications. Bulk bubbles exhibit promising prospects in fields such as medical diagnosis, oxygen delivery, hydrogen storage, and sediment improvement.4,5 On the other hand, surface micro/nanobubbles are considered key factors in drag reduction,6–10 mineral separation,11 protein adsorption,12 energy efficient13 and interface science.14
With the advancement of microfluidic technology, the effectiveness of fluid flows in microchannels has become increasingly important. The study of bubble dynamics within microchannels has also attracted significant attention, and such studies have shown that bubble dynamics significantly impact the thermal and hydraulic characteristics of liquid flow in confined environment.15–31 Xiong and coauthors15 conducted both experimental and numerical investigations on the formation of bulk bubbles in a simple microchannel setup. Their research revealed that bubble shapes varied with the viscosity and surface tension of the liquid, while bubble length was influenced by the rates of liquid and gas flow. Triplett et al.16 conducted a comprehensive experimental study on the gas–liquid two-phase flow patterns in microchannels. They identified several distinct flow patterns, including bubbly, slug, slug-annular, churn, and annular flow. Similarly, Yang and Shieh17 emphasized the roles of buoyant force, turbulent fluctuations, and surface tension in determining flow patterns in small tubes. They also observed that bubble locations during the transition from plug flow to slug flow could be influenced by fluid properties. Tseng and coauthors experimentally studied the dynamics of bubble growth for convective boiling in a single microchannel18 and two parallel microchannels.19 They found that surface tension and bulk flow drag were key factors governing the size of bubble departure from the channel wall. Fu and Pan20 investigated the nucleation and growth of CO2 bubbles resulting from the reactions of sulfuric acid and sodium bicarbonate in microchannels with diverging and uniform cross-sections. They observed that the equivalent radius of gas bubbles exhibited a linear increase during the initial stage of bubble growth. For high liquid flow rates, the bubbles moved along with the liquid flow, whereas for low liquid flow rates, the bubbles mostly remained at the nucleation site and grew at a constant rate of gas generation.
The utilization of surface gas bubbles or gas layers at the solid–liquid interface to achieve drag reduction has received extensive attention and is anticipated as a strategy to effectively mitigate fluid drag within microfluidic systems, thereby enhancing the fluid dynamics and optimizing flow efficiency.6–10,32 The formation of surface bubbles at the solid–liquid interface converts solid–liquid contact into gas–liquid contact, thereby transforming the non-slip boundary condition into a slip boundary condition and effectively reducing fluid flow resistance. It is worth noting that the stable presence of gas bubbles on the wall is the prerequisite for its drag reduction application. However, experimental studies have found that surface bubbles may detach from the wall, which is believed to be responsible for pulsatile flow in microchannels.33 Furthermore, the detachment of surface bubbles from the microchannel wall can result in gas bubble embolism, as reported in ref. 16, 17 and 34. This phenomenon is even considered to be the cause of failure in specific chemical and biological experiments.35,36 Therefore, studying surface-to-bulk conversion in a microchannel is crucial for understanding bubble dynamics and their applications in microfluidics, particularly in lab-on-chip devices.
The stability of surface gas bubbles, particularly those at the micro-nano scale, has long been a central focus of research. Classical thermodynamic theories indicate that the small-scale effect induces extremely high internal pressure within bubbles. Theoretically, nanoscale bubbles in water should dissolve rapidly; however, experimental evidence demonstrates that surface nanobubbles can stably persist at the solid–liquid interface. To account for the prolonged longevity of nanobubbles, several plausible mechanisms have been proposed: contamination, dynamic equilibrium, contact line pinning, and gas supersaturation.3 Current consensus suggests that the stability of nanobubbles is predominantly governed by gas saturation and contact line pinning.37,38
Similar to droplet depinning, surface bubble pinning force predominantly originates from the synergistic dynamics of the three-phase contact line and the liquid–gas interface.39 The primary factors affecting this pinning force include liquid–gas interfacial tension, surface texture geometry, and material wettability. When analyzing the depinning process of a droplet or a bubble in a confined channel, the influence of droplet/bubble volume and the viscosity ratio should also be taken into account.40 Notably, while the majority of research on gas bubble detachment has focused on flow boiling,29–31,41–43 very few studies have explored the factors influencing surface bubble detachment from microchannel walls without considering heat transfer. In this paper, we investigated the dynamic behavior of gas bubbles under forced flow in a microchannel. We focused on elucidating the mechanism by which micro-sized surface gas bubbles on the lower wall transform into bulk bubbles. Given the complexity of the experiment, we conducted a comprehensive simulation analysis to assess how wall wettability, Reynolds number, and initial contact surface bubble angle influence the surface-to-bulk conversion process. Our research provides valuable insights for understanding nanobubble stability, bubble dynamics theory and applying surface gas bubbles to improve boundary slip.
Simulation methodology
A. Simulation model description
Numerical simulation method (phase field method, the COMSOL Multiphysics software) is used to study the surface-bulk conversion process of surface gas bubbles on a microchannel lower wall. Fig. 1 illustrates the microchannel model, which has dimensions of length (L) 17.2 μm, height (H) 20 μm, and width (W) 7 μm. A zoomed-in view of the rectangular region in Fig. 1 shows an example of a micro-sized surface bubble with a base radius (r) of 2.4 μm and varying initial gas-phase contact angle (θ) ranging from 30° to 90°.
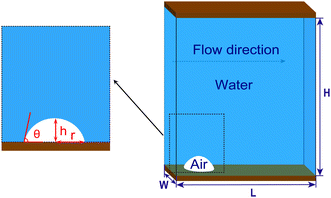 |
| | Fig. 1 Schematic diagram of microchannel model. A zoomed-in view showing the morphological parameters of a surface gas bubble. The bubble radius is 2.4 μm, and the initial contact angle θ is varied within the range of 30° to 90° in the simulation study. | |
The liquid flows from the left side to the right side of the channel. The flow behavior is considered to be laminar, and the Reynolds number (Re) is chosen within the range of 10–1200 based on the equation Re = ρuDeq/μ (where Deq = 2WH/(W + H) is the equivalent hydraulic diameter; ρ, u and μ are the fluid density, mean velocity at the channel inlet and dynamic viscosity of the liquid, respectively). Table 1 lists the Re values and corresponding inlet velocities used in this study.
Table 1 Reynolds number (Re) and corresponding inlet velocity (V)
| Reynolds number (Re) |
3 |
10 |
52 |
104 |
208 |
312 |
416 |
800 |
1200 |
| Inlet velocity V (m s−1) |
0.29 |
0.97 |
5 |
10 |
20 |
30 |
40 |
76.9 |
115.4 |
B. Fluid properties and governing equations
The phase-field method is utilized to simulate the two-phase flow dynamics, where incompressible water with surface tension value 72.75 mN m−1 is selected as the fluid, and the simulations are based on the Navier–Stokes equations.| | |
ρl(u·∇)u = ∇·[−pI + μ(∇u + (∇u)T)] + F
| (1) |
Here ρl is the fluid density (ρl = 0.9982071 × 10³ kg m−3), u is the velocity vector, p is the driving pressure, μ is the fluid dynamic viscosity (1.005 × 10⁻³ Pa s) and F is external forces. Simulation is conducted under constant temperature conditions at 293.15 K.
C. Boundary conditions
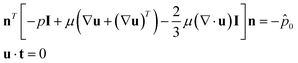
The wettability of the channel wall is adjusted by setting the wall wettability contact angle according to simulation requirements. The microchannel has smooth upper and lower walls, with no-slip boundary conditions defined as:| |
 | (3) |
The gas–liquid interface of surface gas bubbles is set to be no shear boundary condition,44 which means:
Here
K = [
μ(∇
u + (∇
u)
T)]
n,
n represents the normal vector. To simplify calculations, the side walls of the microchannel are assumed to be symmetric to each other, which can be expressed as
eqn (4).
The fluid is set to be a velocity driven fluid, and there is no backflow at the microchannel outlet. The boundary condition can be expressed as
| |
 | (5) |
where
![[p with combining circumflex]](https://www.rsc.org/images/entities/i_char_0070_0302.gif) 0
0 represents the outside pressure near the outlet, and
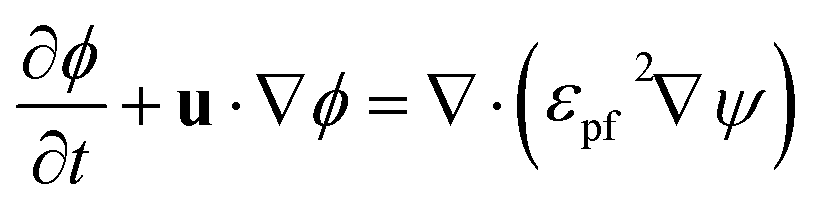
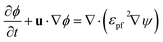
t is the wall tangent vector. The gas–liquid interface evolution during flow is governed by the phase-field equation:
| |
 | (6) |
Here
ϕ is the phase-field variable, which indicates the position of the gas–liquid interface, and generally varies from −1 (gas phase) to 1 (liquid phase);
εpf is the parameter related to the interface thickness,
ψ is the chemical potential, which represents the gradient of the system's free energy density, and can be expressed as
| |
 | (7) |
where
f denotes the free energy density function; the variable
λ serves as the Lagrange multiplier, intrinsically related to interfacial energy, ensuring the overall balance of the system's total free energy, that is
| |
 | (8) |
Here
σ represents the surface tension coefficient.
During the evolution of bubbles, the diffusion of gas molecules into water is governed by the gas phase transport equation.45
| |
 | (9) |
where
ρg is the gas density,
Φg denotes the volume fraction occupied by the gas phase,
mgl represents the mass transfer rate from the gas phase to the liquid phase, which can be modeled on the basis of two-film theory, as described in the COMSOL CFD Module User's Guide.
Here
kL represents the mass transfer coefficient,
c denotes the dissolved gas concentration in the liquid phase,
M stands for the molecular weight of the species, and
a is the interfacial area per unit volume. According to Henry's law, the equilibrium concentration
c* of the gas dissolved in the liquid phase can be calculated as.
| |
 | (11) |
where
H is Henry's constant and
pref is the reference pressure.
D. Grid convergence test
To assess grid independence and determine the precision of numerical simulations, a spectrum of grid configurations with varying densities were employed to mesh the model. Eight distinct grids were used to calculate the average fluid velocity at the microchannel exit (with a bubble protrusion angle of 50°); the wettability angle of the channel wall was set to 1°, the inlet velocity V = 10 m s−1, and the corresponding Reynolds number Re = 104. As presented in Table 2, the grid number utilized in our numerical simulations was 648![[thin space (1/6-em)]](https://www.rsc.org/images/entities/char_2009.gif) 634, the relative error compared to the maximum grid resolution was approximately 0.62%, demonstrating acceptable accuracy. The maximum observed relative error of around 4.66% occurred when using a grid size of 718. Furthermore, a diagram showing the comparison of the velocity distributions under conditions with and without bubbles at different grid numbers is presented in Fig. 2. This finding shows the robustness of the physical model across diverse grid resolutions, ensuring that numerical results consistently maintained their precision in all simulation scenarios.
634, the relative error compared to the maximum grid resolution was approximately 0.62%, demonstrating acceptable accuracy. The maximum observed relative error of around 4.66% occurred when using a grid size of 718. Furthermore, a diagram showing the comparison of the velocity distributions under conditions with and without bubbles at different grid numbers is presented in Fig. 2. This finding shows the robustness of the physical model across diverse grid resolutions, ensuring that numerical results consistently maintained their precision in all simulation scenarios.
Table 2 Results of mesh convergence test
| Test number i |
1 |
2 |
3 |
4 |
5 |
6 |
7 |
8 |
| Mesh number |
718 |
9843 |
87658 |
300240 |
648634 |
1191870 |
2386618 |
3329013 |
| V (m s−1) |
9.20 |
9.30 |
9.42 |
9.54 |
9.59 |
9.62 |
9.65 |
9.65 |
 |
4.66% |
3.63% |
2.38% |
1.14% |
0.62% |
0.31% |
0 |
…… |
 |
| | Fig. 2 Comparison of the velocity distributions under conditions with and without bubbles at different grid numbers. | |
E. Force analysis of bubble detachment from the lower wall in a microchannel
The forces acting on a surface bubble formed on the lower wall of a microchannel mainly include quasi-steady drag force Fqs, shear lift force Fsl, contact pressure force Fcp, buoyancy force Fb, and pinning force Fp. As shown in Fig. 3, the fluid drag force Fqs can be expressed as41,42| |
 | (12) |
where R and v are the curvature radius and moving speed of a sliding bubble on the wall respectively; u represents the velocity vector of the liquid, ρl is the liquid density, and CD represents the drag coefficient, which depends on the flow regime, liquid properties, and contamination level. Based on a recent review by Chen and coauthors,46 an appropriate CD value can be selected.
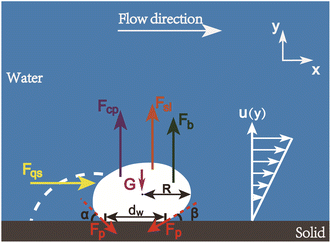 |
| | Fig. 3 Forces acting on a surface gas bubble. The white dotted line next to the bubble depicts the initial contour of the bubble before any changes occur to its morphology. | |
The shear lift force Fsl on a bubble in the laminar flow is given as42
| |
 | (13) |
where
Cl is the factor of shear lift force, and it can be selected in accordance with the guidance provided in the ref.
47 and
48.
The contact pressure force Fcp accounts for the bubble inner pressure acting on the solid wall, which can be approximated as43
| |
 | (14) |
Here
dw is the base diameter of a surface bubble on the channel wall,
γlg is the surface tension of gas–liquid interface.
The buoyancy force Fb acting on a surface gas bubble is estimated according to Archimedes' principle and can be expressed as43
where
ρg is the gas density and
V is the bubble volume.
The pinning force Fp is defined as the force that deviates the contact angle from that predicted by Young's equation.49 Numerical and experimental observations show that during bubble nucleation, the three-phase contact line of surface nanobubbles first expands from the bottom of the nanoscale hole to the edge, then protrudes out and extends around the pit mouth.50,51 According to the classical nucleation theory, the driven force for the three-phase contact line change can be calculated, from which the pinning force can be estimated as52
| |
 | (16) |
where Δ
GS and Δ
GV represent the surface and volume components of surface free energy respectively, Δ
r is the difference of the radius of three-phase contact line; Δ
Alg and Δ
Asl are the differences in the liquid–gas and solid–liquid interface areas before and after the surface bubble contact line changes;
γsl and
γsg are the surface tension of solid–liquid and solid–gas respectively; Δ
V and Δ
P are the differences in volume and inner pressure before and after the bubble contact line has been changed.
The forces acting on a surface gas bubble in horizontal direction are a vector sum including the force of fluid flow Fqs and the pinning force Fpx. Therefore, the resultant horizontal force acting on a surface gas bubble can be written as
Similarly, the forces acting on a surface bubble in the vertical direction include the shear lift force Fsl, buoyancy Fb, contact pressure force Fcp and vertical pinning force Fpy, the resultant vertical force acting on the surface bubble can be expressed as
| | |
∑Fy = Fsl + Fb + Fpy + Fcp
| (18) |
Suppose that the positive directions are the rightward horizontal and upward vertical directions. The surface gas bubble will remain stationary on the wall when the resultant forces in both directions are less than or equal to zero, i.e., ∑Fx ≤ 0, ∑Fy ≤ 0. If ∑Fx > 0, the surface bubble slides on the wall; if ∑Fy > 0, it detaches from the wall to convert into a bulk bubble.
Results and discussion
A. Influence of initial contact angle on the bubble detachment from the channel wall
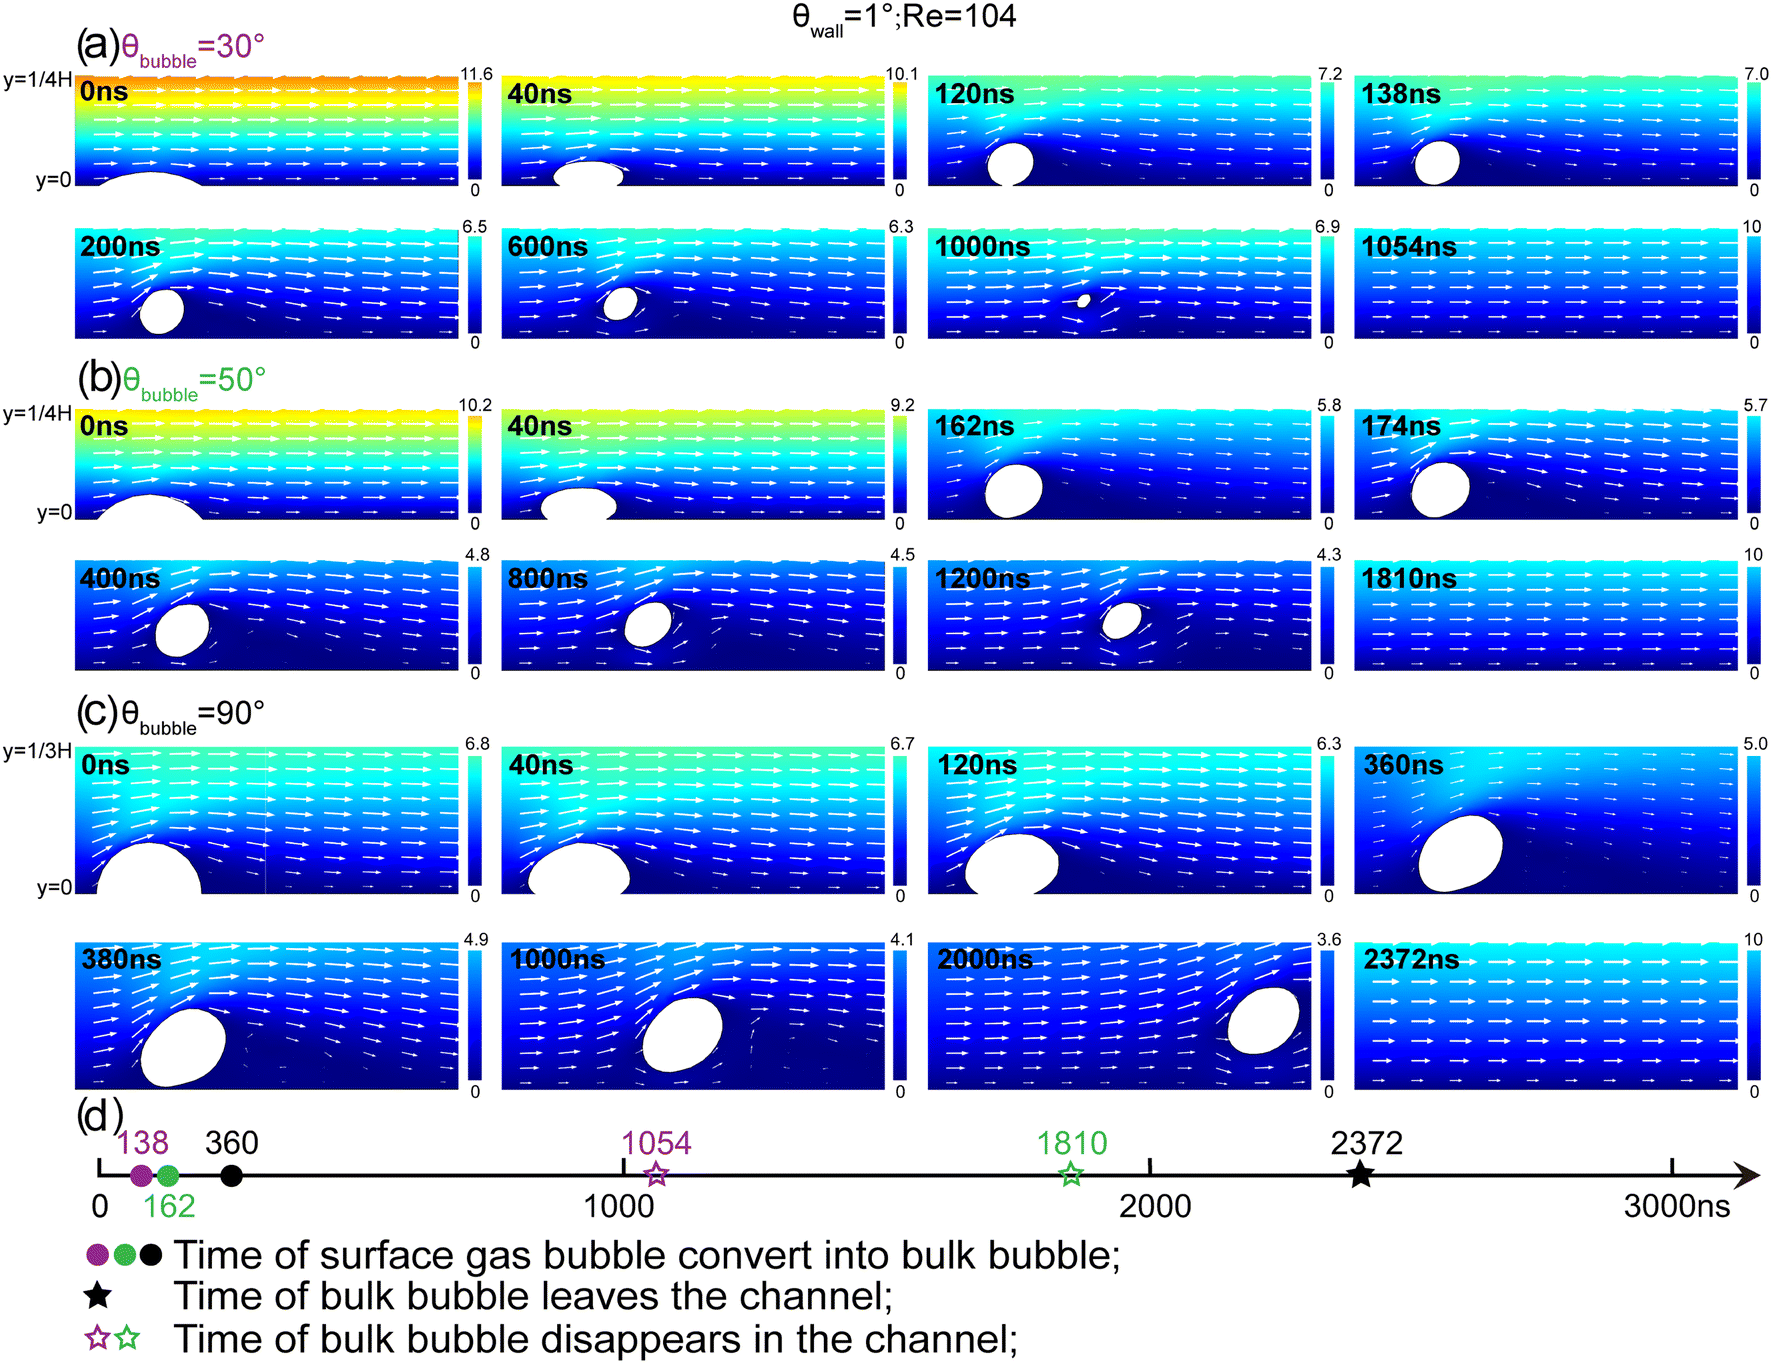
Fig. 4 illustrates the influence of the initial contact angle of a surface gas bubble on morphology changes during the surface-to-bulk conversion process. For a surface bubble with an initial contact angle of 30°, as depicted in Fig. 4a, a clear shrinking of the three-phase contact line is observed at 40 ns. This phenomenon also shows a concurrent increase in both the bubble's contact angle and height. By 120 ns, the contact line reduction accelerates, resulting in a significant increase in bubble height. With the contraction of the three-phase contact line and increase in bubble height, the micro-sized surface bubble detaches from the lower wall at 138 ns and transforms into an ellipsoidal bulk bubble. Subsequently, the volume of the newly converted bulk bubble decreases as gas molecules diffuse, until it completely disappears in the channel at 1054 ns. Similarly, for a surface bubble with an initial contact angle of 50° (Fig. 4b), it converts into a bulk bubble at 162 ns and disappears in the microchannel at 1810 ns. In contrast, the surface bubble with a 90° initial contact angle in Fig. 4c detaches from the lower wall at 360 ns and exits the channel at 2372 ns. Notably, surface bubbles with varying contact angles on the superhydrophilic channel wall exhibit almost imperceptible sliding behavior along the solid surface until they transform into bulk bubbles under the forced flow.
 |
| | Fig. 4 Water flow field showing surface bubbles converting into bulk bubbles. The gas phase initial contact angle (θbubble) is (a) 30°, (b) 50° and (c) 90°; (d) a time-axis showing the time of surface bubble converting into bulk bubble and the time of bubble leaving or disappearing in the channel, different colors of symbols correspond to bubbles with different contact angles. The color bar signifies the flow field velocity (nm ns−1). The Reynolds number Re = 104 and the wetting angle of the lower wall θwall = 1°. | |
This phenomenon serves as an indication that as the contraction of the three phase contact line of surface bubbles, the fluid flow force Fqs exceeds the x-direction pinning force component Fpx (i.e., ∑Fx > 0), driving the bubble to slide along the x-axis; meanwhile, if the sum of shear lift force Fsl, buoyancy force Fb and contact pressure force Fcp becomes substantially larger than the pinning force component Fpy in the y-direction (i.e., ∑Fy > 0), the surface bubble will detach from the wall. Considering that undertaking a quantitative force analysis across various stages would demand highly precise measurements of dynamic bubble morphology parameters. These parameters encompass the surface area, volume, and the geometric characteristics of the three-phase contact line. Given the inherently dynamic and multi-dimensional nature of bubble behavior, these measurements are inherently intricate. Especially, the shapes of bubbles after deformation often display a high degree of irregularity, posing formidable obstacles to obtaining accurate and consistent data. Therefore, Table 3 summarizes the estimated force trends for the scenarios of bubble sliding and with or without detaching, a detailed analysis of these force variations is provided in the ESI.†
Table 3 A summary on estimated force trends for surface bubble sliding and detachinga
| Behaviors forces |
Fsl |
Fb |
Fpy |
Fcp |
Fqs |
Fpx |
| Force increase (↑) or decrease (↓). |
| Sliding and detaching |
↑ |
↑ |
↓ |
↑ ↓ |
↑ |
↓ |
| Sliding without detaching |
↑ |
↓ |
↓ |
↓ |
↑ |
↓ |
Fig. 4d is a temporal plot showing the conversion time of a surface bubble to a bulk bubble and the subsequent departure time or disappearance time of the bulk bubble in the channel due to gas molecule diffusion. It is noticeable that surface bubbles with larger initial contact angles require more time to convert into bulk bubbles. In our model, the base radius of surface bubbles is kept constant. So the bubble contact angle is positively correlated with its volume. This implies that as the initial contact angle increases, both the bubble volume and the gas–liquid interface area increase. As a result, the pinning force acting on the bubble also increases, which aligns with the findings of Mhatre and Kumar.40 They showed that droplet volume is a key factor affecting droplet depinning, helping to explain why surface bubbles with larger initial contact angles take longer to transform into bulk bubbles.
Fig. 5 shows pressure contour plots depicting the correlation between the initial contact angles of gas bubbles and their impact on bubble morphology during the surface-to-bulk transition. It should be noted that distinct bubble morphologies imply different curvatures of the gas–liquid interface. According to Laplace's formula (ΔP = 2σ/R), these curvature variations result in varied internal pressures within the bubbles. This pressure disparity, in turn, serves as a pivotal determinant in shaping the pressure gradient of the surrounding fluid. For an ellipsoidal bubble at a specific angle to the wall, the minimum and maximum pressures occur primarily at the lower-left and upper-right ends of the ellipsoid's major axis, respectively. During the transformation of surface bubbles to bulk bubbles, an upward trend in fluid pressure is observed near the wall on the left side of the surface gas bubble, along with a pressure decline on the opposite side as the initial contact angle increases. As the gas diffuses and the bubble volume gradually shrinks, the high-pressure area on the left side increases steadily, while the low-pressure region on the right diminishes. This highlights the key role of initial contact angle in bubble dynamics, significantly affecting morphological characteristics and the corresponding surface-to-bulk conversion duration.
 |
| | Fig. 5 Pressure contour plots showing the effects of bubble initial contact angle on the bubble morphology in the course of surface-to-bulk conversion. The initial contact angle of surface gas bubble is (a) 30°, (b) 50° and (c) 90°. The color bar reflects the pressure change of the flow field (Pa). | |
B. Influence of Reynolds number on the surface-bulk conversion of surface bubbles
Fig. 6 presents the impact of Reynolds number (Re) on the shape changes of a micro-sized gas bubble during the surface-to-bulk conversion. Similar to the phenomena in Fig. 4, the surface bubble in Fig. 6 undergoes three-phase contact line contraction and bubble height increase before transforming into a bulk bubble at different Re values. The main difference lies in the bubble's shape change with increasing Re. Specifically, the spherical-cap surface bubble evolves into a subspherical bulk bubble at Re = 52 (Fig. 6a), when Re rises to 416 (Fig. 6b), it becomes an elongated ellipsoidal shape. Surprisingly, at Re = 1200 (Fig. 6c), the bubble elongates further and even splits into multiple parts during conversion. The conversion time initially decreases with increasing Re (Fig. 6d), from 240 ns at Re = 52 (Fig. 6a) to 214 ns at Re = 416 (Fig. 6b). However, when the bubble bottom is torn apart at high Re, the conversion time increases to 276 ns at Re = 1200 (Fig. 6c). Simultaneously, the bulk bubble flows out of the channel sooner as the Re increases.
 |
| | Fig. 6 Water flow field showing the effect of Reynolds number (Re) on the surface-to-bulk conversion. Re values are set to (a) 52, (b) 416 and (c) 1200; (d) a time axis showing surface-to-bulk conversion times and bubble departure/disappearance times in the channel, where symbols of different colors denote different Re values. The color bar represents flow field velocity (nm ns−1). Conditions: initial bubble contact angle is 60°, channel lower wall wetting angle is 1°. | |
Fig. 7 shows representative pressure contour plots depicting the significant impact of Re on bubble morphology during the ‘surface-bulk’ transition. As Re increases from 52 to 416 and then to 1200, both the amplitudes and the spatial scopes of the high-and low-pressure zones of bubbles experience a remarkable increase. This is mainly attributed to bubble shape changes induced by liquid flow. These drastic morphological alterations cause corresponding changes in bubble internal pressures, thus significantly influencing the surrounding pressure field. Specifically, the high-pressure area on their left side grows in accordance with the increase in Re. By contrast, the low-pressure area on the right side decreases as Re becomes larger. Additionally, as gas molecule diffusion within the bubble decreases, the strengths of both high-pressure and low-pressure zones diminish. These visual representations illustrate the intricate interplay between flow dynamics and bubble morphology.
 |
| | Fig. 7 Pressure contour plots showing the influence of Re on bubble morphology during surface-to-bulk conversion (a) Re = 52, (b) Re = 416 and (c) Re = 1200. The color bar reflects flow field pressure (Pa). | |
Wang et al.53 numerically investigated the effect of bubble morphological deformation on drag reduction at varying flow velocities. Their study revealed that on smooth hydrophobic surfaces, bubbles exhibited sliding behavior, accompanied by obvious shape changes at flow velocities of 5–15 m s−1 (corresponding to Re ≈ 400–1200 in their simulations). Specifically, at 5 m s−1 (Re ≈ 400), the bubbles maintained a relatively stable shape. However, as the velocity increased to 10 m s−1 (Re ≈ 800), the enhanced fluid forces caused noticeable deformations; the bubbles elongated and tilted forward. When the flow velocity reached 15 m s−1 (Re ≈ 400), a significant transition took place: surface bubbles detached from the channel wall, and the bottom of the gas bubbles was torn apart. This observed phenomenon aligns well with the findings of our research. Gao et al.33 employed microparticle image velocimetry (μPIV) to examine the dynamics of surface bubbles on PDMS microchannel walls under depressurization. As pressure decreased, bubbles grew and detached, triggering periodic fluctuations in flow velocity. The frequency of these fluctuations increased with higher pressure differentials (ΔP), a phenomenon linked to accelerated bubble growth–detachment cycles. Critically, these findings provide direct experimental evidence for enhanced surface bubble detachment under high ΔP conditions, which are inherently linked to elevated Reynolds numbers (Re) due to increased flow velocities. This mechanistic consistency aligns closely with the detachment dynamics observed in our study, reinforcing the validity of our numerical predictions across both simulation and experimental frameworks.
C. Influence of wall wettability on the surface-to-bulk conversion of surface bubbles
The effects of wall wettability on the surface-to-bulk conversion are illustrated in Fig. 8. The wetting angles (θwall) of the lower channel wall are of 1°, 45°, and 135°, the Reynolds number is 104 and the initial bubble contact angle is 60°. For the superhydrophilic wall (θwall = 1°, Fig. 8a), the surface bubble transforms to a bulk bubble promptly, taking about 236 ns. In contrast, at θwall = 45° (Fig. 8b), the conversion time increase significantly to about 1980 ns. It is noted that the bubble slides forward before detaching from the channel wall, indicating that the fluid flow Fqs changes larger than x-component of the pinning force Fpx first (i.e., ∑Fx > 0), and then the resultant forces in the y-direction becomes positive (i.e., ∑Fy > 0). When the lower wall is hydrophobic (θwall = 135°, Fig. 8c), the surface bubble remains attached to the wall, undergoing a reduction in height and sliding along the surface without detachment. Even at Re = 800, the surface bubble consistently adheres to the hydrophobic surface (∑Fx > 0, ∑Fy < 0). The estimated force trends for the scenario of bubble sliding and without detaching can be seen in Table 3.
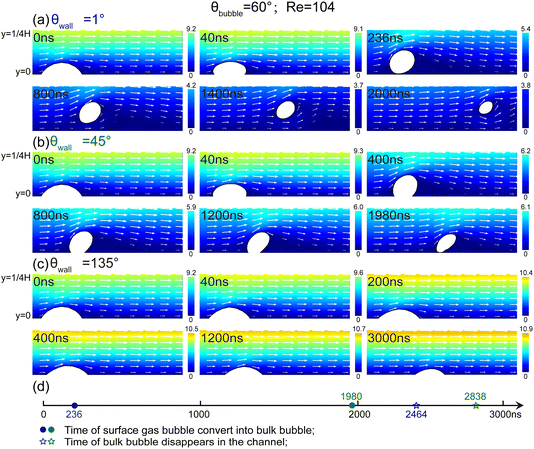 |
| | Fig. 8 Water flow field illustrating the effects of microchannel wall wettability on bubble morphology. The values of θwall are (a) 1°, (b) 45° and (c) 135°; (d) a time-axis showing surface-to-bulk bubble conversion times and bubble departure/disappearance times in the channel; where symbols of different colors denote different wall wettabilities. The color bar represents flow field velocity (nm ns−1). Conditions: Reynolds number Re = 104, initial bubble contact angle θbubble = 60°. | |
Studies have revealed that hydrophobic surfaces exhibit a pronounced tendency to adsorb gas molecules, thereby facilitating surface bubble nucleation.3,54 Notably, the gas – phase contact angle of micro/nano-scale surface bubbles is typically much smaller than the macroscopic contact angle.55 Based on the modified Young's equation, the pinning strength Fp of surface gas bubbles can be expressed as:52
| | |
Fp = (cosθY − cosθ)γlg
| (19) |
Here
θY represents the macroscopic gas-phase contact angle,
θ denotes the micro/nanoscopic gas-phase contact angle of a gas bubble, and
γlg is the liquid–gas surface tension.
52 It is crucial to emphasize that
θY is inversely related to substrate hydrophobicity. That is, as the surface hydrophobicity increases, the value of
θY decreases, leading to an increase in cos
θY, and thus enhancing the bubble pinning strength
Fp. This theoretical relationship explains why, even under high Reynolds numbers, surface gas bubbles on hydrophobic surface remain firmly adhered to the channel wall. In
Fig. 9, the fluid pressure contour maps further illustrate the significant effect of channel wall wettability, which induces distinct changes in bubble geometries within the flow field.
 |
| | Fig. 9 Pressure contour plots showing the effects of microchannel wall wettability on bubble morphology. The value of θwall was (a) 1°, (b) 45° and (c) 135°. The color bar indicates flow field pressure (Pa). | |
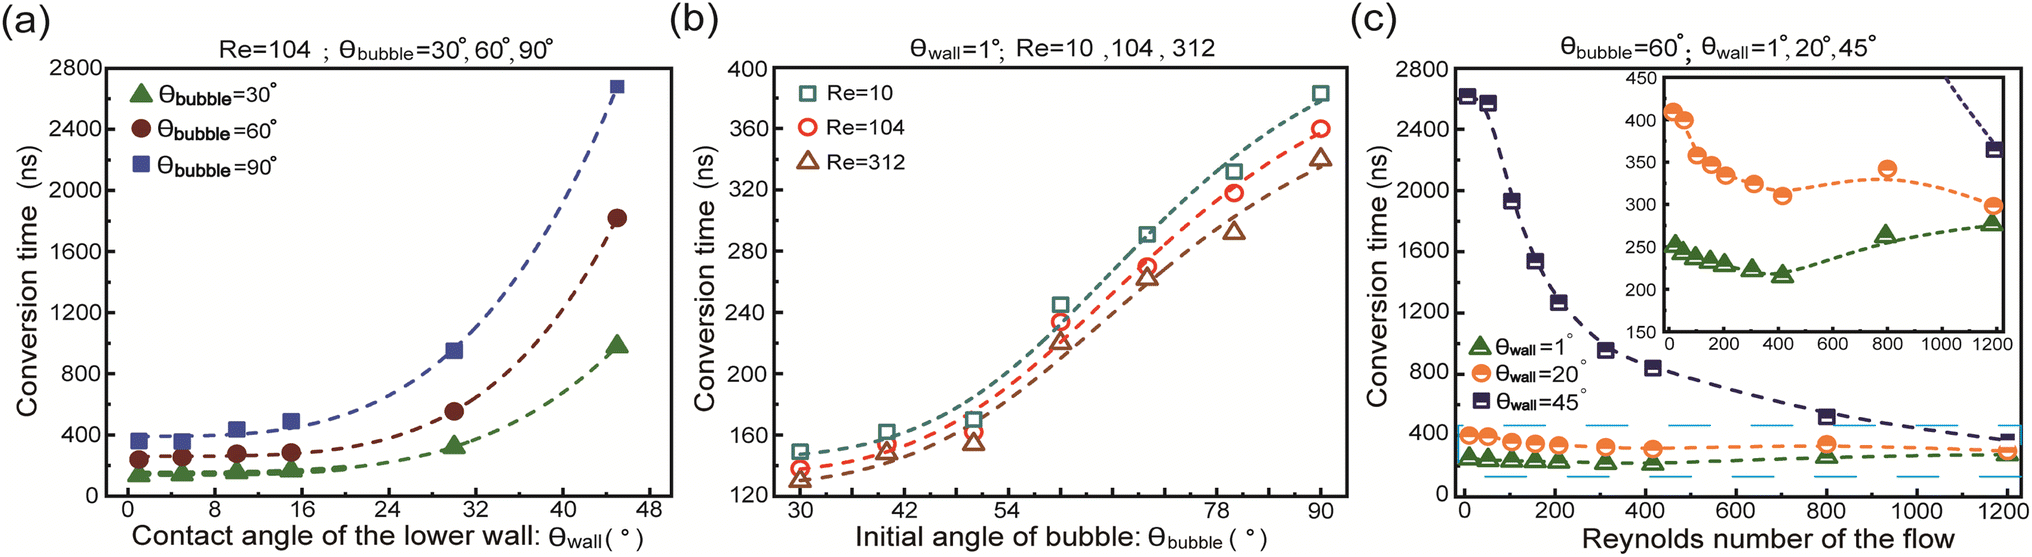
More specifically, Fig. 10a presents the relationship between wall wettability and surface-to-bulk conversion time at Re = 104. As the value of θwall changes in the range of 0–20°, the conversion time increases very slowly. However, when θwall > 20°, the conversion time rises dramatically, and no surface bubbles detach from the channel wall when θwall > 50°. As shown in Fig. 10b, the conversion time for surface bubbles on a superhydrophilic surface (θwall = 1°) exhibits a nearly linear upward trend, directly correlating with the increments in the initial bubble contact angle.
 |
| | Fig. 10 Surface-to-bulk conversion time vs. (a) Surface bubble initial contact angle; (b) Reynolds numbers (Re); (c) wall wettability (θwall). | |
Fig. 10c presents the surface-to-bulk conversion time as a function of Re. For bubbles on superhydrophilic (θwall = 1°) and hydrophilic (θwall = 20°) surfaces, the conversion time decreases slowly as Re increases. At high Re, however, the conversion time fluctuates (θwall = 20°) or increases (θwall = 1°) due to bubble bottom tearing or morphology changes. In addition, when examining the scenario where θwall = 45°, the conversion time is obviously longer than that for θwall = 1° and 20°, and notable acceleration in bubble detachment is observed at higher Re.
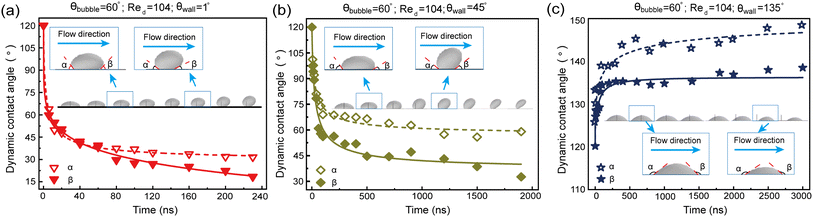
D. Dynamic changes in the contact angle of surface nanobubbles during the ‘surface-to-bulk’ conversion
Fig. 11 presents the dynamic evolution of the contact angle during the transition of a surface bubble to a bulk bubble at different Reynolds number. The angle between the solid–liquid interface on bubble left side and the gas–liquid interface is defined as advancing angle α, while the angle between the solid–liquid interface on the bubble right side and the gas–liquid interface is defined as receding angle β (as shown in Fig. 3). The initial contact angle of a surface gas bubble is 60°, meaning that both advancing angle α and receding angle β are initially 120°. When the wetting angle θwall = 1° and Re = 52 (Fig. 11a), the three-phase contact line of the gas bubble experiences rapid shrinkage at the onset. Observations show that α decreases from 120° to 74°, while β accordingly decreases to 83°. Subsequently, both α and β exhibit a discernible decline in their respective values, depicting a virtually symmetrical reduction pattern. As the surface bubble detaches from the wall, the advancing angle α settles at 21°; concurrently, the receding angle β decreases to 18°, reflecting the progressive detachment process.
 |
| | Fig. 11 Dynamic evolution of contact angles for surface bubbles at different Reynolds numbers (Re): (a) 52, (b) 416 and (c) 1200. The advancing angle and receding angles are denoted as α and β respectively. | |
As Re increases to 416 (Fig. 11b), the surface bubble asymmetrically transforms from a spherical shape to prolate oval morphology during the transition to a bulk bubble. With the contraction of the three-phase contact line, both the advancing angle α and the receding angle β gradually decrease. Notably, when the surface bubble detaches from the substrate, β drops to 13°, contrasted with α, which remains at 46°. As the value of Re surges to 1200 (Fig. 11c), the three-phase contact line of the surface bubble undergoes a rapid decrease between 0 and 20 ns, correspondingly altering α from 120° to 60° and β from 120° to 43°. Subsequently, starting from 20 ns, the fluid's stretching effect distinctly transforms the bubble morphology, significantly increasing the advancing angle α. At the moment of the surface bubble detaching from the wall, α surges to 147°, while β decreases to 12°. Evidently, increasing Re has a more pronounced effect on α, whereas its impact on β is relatively limited.
Fig. 12 shows the variations in advancing angle α and receding angle β for surface bubbles on walls with different wettabilities. The lower channel wall is characterized by three wetting angles: 1°, 45°, and 135°. As shown in Fig. 12c, surface bubbles on the hydrophobic wall exhibit a contrasting behavior, which do not transition to bulk bubbles, but exhibit a pure sliding motion along the surface. In particular, from t = 0 to 200 ns, the decrease in bubble height during sliding leads to an increase in both α and β from 120° to 139° and 135°, respectively. Subsequently, from 200 to 3000 ns, a gradual increase is noted, with α settling around 148° and β reaching to approximately 139°.
 |
| | Fig. 12 Dynamic evolution of contact angles for surface bubbles at different wall wettabilities. The wetting angles θwall are (a) 1°, (b) 45° and (c) 135°. The advancing and receding angle are labeled as α and β, respectively. | |
Our investigations further revealed a significant correlation between surface bubble characteristics and their detachment behavior in hydrophilic and hydrophobic microchannels. At low Reynolds numbers, hydrophilic surfaces predominantly yield spherical bubbles upon detachment, reflecting their tendency to maintain a more uniform shape. Conversely, when hydrophobicity increases and Re rises, the detachment morphology becomes more elongated, indicating a departure from the spherical form. Under exceedingly high Reynolds numbers, bubble fragmentation was observed. This observation underscores the pivotal role of the channel wall wettability, Reynolds number, and the initial contact angle/volume of surface gas bubbles in the surface-to-bulk transformation within the microchannel. The interplay of these factors collectively dictates the ‘surface-bulk’ transition dynamics of bubbles. Our findings underscore the intricate nature of these factors and their significance in understanding bubble dynamics in microchannels.
Conclusion
In this study, we conducted numerical analysis to investigate how a micro-sized surface bubble converts into a bulk bubble within a microfluidic channel. The wettability of the channel wall, Reynolds number, and bubble contact angle/volume were identified as crucial factors affecting the surface-to-bulk conversion. Our findings reveal that surface bubbles on hydrophilic wall exhibit rapid three-phase contact line contraction at low Reynolds number, with both the advancing angle α and receding angle β decreasing as surface bubbles transform into bulk bubbles. At high Reynolds numbers, surface bubbles are elongated, with α rapidly contracting before a sharp increase. In scenarios where surface bubbles remain attached to the wall (specifically, when the channel wall hydrophobicity is sufficiently high and Re is increased), it has been observed that both α and β exhibit a gradual increment as the bubble volume decreases. Meanwhile, it is observed that hydrophilic surface and lower Reynolds number result in a surface bubble approaching to a spherical shape when it detaching from the wall.
The evolution of a surface bubble converting into a bulk bubble in a microchannel is influenced by the initial bubble contact angle θbubble, wall wetting angle θwall, and Reynolds number Re. Specifically, a rise in both θbubble and θwall results in a prolonged conversion period. Conversely, a rise in Re generally accelerates the conversion process. However, at high Re, bubble fragmentation occurs, thus leading to fluctuations in conversion time. For superhydrophilic surfaces, a larger θbubble and a higher Re accelerate bubble detachment. Conversely, with the increase in θwall, surface bubbles will not detach from the substrate. For example, surface bubbles do not convert into bulk bubbles on the channel wall with a wetting angle θwall > 50° at a Reynolds number of 104. Overall, this research elucidates the intricate dynamics of surface bubble detachment in microfluidic channels, contributing to a deeper comprehension of bubble dynamics theory and potential applications, such as investigating how surface gas bubbles enhance boundary slip in microchannel flows.
Data availability
I would like to declare on behalf of my co-authors that the data that support the findings of this study are available on request from the corresponding author, [DL], upon reasonable request. All the authors listed have approved the manuscript that is enclosed.
Conflicts of interest
There are no conflicts to declare.
Acknowledgements
We acknowledge the financial support from National Natural Science Foundation of China (No. 11972150); Heilongjiang Province Natural Science Foundation of China (No. LH2020A022) and Research Foundation for Talents of Yantai University.
References
- D. Lohse and X. Zhang, Surface nanobubbles and nanodroplets, Rev. Mod. Phys., 2015, 87(3), 981 CrossRef CAS
 .
. - D. Li, J. Gu, Y. Li, Z. Zhang and Y. Ji, Manipulating Trapped Nanobubbles Moving and Coalescing with Surface Nanobubbles, Langmuir, 2022, 38(42), 12991–12998 CrossRef CAS PubMed .
- D. Li, D. Jing, Y. Pan and X. Zhao, Coalescence and stability analysis of surface nanobubbles on the polystyrene/water interface, Langmuir, 2014, 30(21), 6079–6088 CrossRef CAS .
- L. Zhou, S. Wang, L. Zhang and J. Hu, Generation and stability of bulk nanobubbles: A review and perspective, Curr. Opin. Colloid Interface Sci., 2021, 53, 101439 CrossRef CAS .
- J. R. T. Seddon, D. Lohse, W. A. Ducker and V. S. Craig, A deliberation on nanobubbles at surfaces and in bulk, ChemPhysChem, 2012, 13(8), 2179–2187 Search PubMed .
- D. Li, Y. Wang, Y. Pan and X. Zhao, Measurements of slip length for flows over graphite surface with gas domains, Appl. Phys. Lett., 2016, 109(15), 151602 CrossRef .
- A. Maali and B. Bhushan, Nanobubbles and their role in slip and drag, J. Phys.:Condens. Matter, 2013, 25(18), 184003 CrossRef PubMed .
- Y. Pan, B. Bhushan and X. Zhao, The study of surface wetting, nanobubbles and boundary slip with an applied voltage: a review, Beilstein J. Nanotechnol., 2014, 5(1), 1042–1065 CrossRef .
- D. Li, D. jing, Y. Pan and B. Bhushan, Study of the relationship between boundary slip and nanobubbles on a smooth hydrophobic surface, Langmuir, 2016, 32(43), 11287–11294 CrossRef CAS .
- Y. Wang and B. Bhushan, Boundary slip and nanobubble study in micro/nanofluidics using atomic force microscopy, Soft Matter, 2010, 6(1), 29–66 RSC .
- F. Ma, P. Zhang and D. Tao, Surface nanobubble characterization and its enhancement mechanisms for fine-particle flotation: a review, Int. J. Miner., Metall. Mater., 2022, 29(4), 727–738 CrossRef CAS .
- Z. Wu, H. Chen, Y. Dong, J. Sun, S. Chen, V. S. J. Craig and J. Hu, Cleaning using Nanobubbles: defouling by electrochemical generation of bubbles, J. Colloid Interface Sci., 2008, 238, 10–14 CrossRef PubMed .
- L. Ouyang, H. Cha, J. Zhang, H. H. Hansen, Q. Li, B. H. Tan, P. Liu, D. Zhang, L. Wang, N. T. Nguyen and H. An, Energy-efficient nanobubble generation with microporous materials, J. Mol. Liq., 2025, 126873 CrossRef CAS .
- S. Darwich, K. Mougin, L. Vidal, E. Gnecco and H. Haidara, Nanobubble and nanodroplet template growth of particle nanorings versus nanoholes in drying nanofluids and polymer films, Nanoscale, 2011, 3(3), 1211–1217 RSC .
- R. Xiong, M. Bai and J. N. Chung, Formation of bubbles in a simple co-flowing micro-channel, J. Manuf. Syst., 2007, 17(5), 1002 Search PubMed .
- K. A. Triplett, S. M. Ghiaasiaan, S. I. Abdel-Khalik and D. L. Sadowski, Gas–liquid two-phase flow in microchannels part I: two-phase flow patterns, Int. J. Multiphase Flow, 1999, 25(3), 377–394 CrossRef CAS .
- C. Y. Yang and C. C. Shieh, Flow pattern of air–water and two-phase R-134a in small circular tubes, Int. J. Multiphase Flow, 2001, 27(7), 1163–1177 CrossRef CAS .
- P. C. Lee, F. G. Tseng and C. Pan, Bubble dynamics in microchannels. part I: single microchannel, Int. J. Heat Mass Transfer, 2004, 47(25), 5575–5589 CrossRef CAS .
- H. Y. Li, F. G. Tseng and C. Pan, Bubble dynamics in microchannels. part II: two parallel microchannels, Int. J. Heat Mass Transfer, 2004, 47(25), 5591–5601 CrossRef CAS .
- B. R. Fu and C. Pan, Bubble growth with chemical reactions in microchannels, Int. J. Heat Mass Transfer, 2009, 52(3–4), 767–776 CrossRef CAS .
- Y. Zhao and S. K. Cho, Micro air bubble manipulation by electrowetting on dielectric (EWOD): transporting, splitting, merging and eliminating of bubbles, Lab Chip, 2007, 7(2), 273–280 RSC .
- S. Wang, H. H. Chen and C. L. Chen, Electrowetting-on-dielectric assisted bubble detachment in a liquid film, Appl. Phys. Lett., 2016, 108(18), 181601 CrossRef .
- C. V. Brown, A. M. J. Edwards and A. Roberts, Bubble control, levitation, and manipulation using dielectrophoresis, Adv. Mater. Interfaces, 2021, 8(2), 2001204 CrossRef CAS .
- S. T. Kadam, I. Hassan and R. Kumar, Bubble dynamics in microchannel: an overview of the state-of-the-art, Meccanica, 2021, 56, 481–513 CrossRef .
- S. Siedel, S. Cioulachtjian and A. J. Robinson, Integral momentum balance on a growing bubble, Phys. Fluids, 2013, 25(12), 123301 CrossRef .
- M. K. Gupta, D. S. Sharma and V. J. Lakhera, Vapor bubble formation, forces, and induced vibration: a review, App. Mech. Rev., 2016, 68(3), 030801 CrossRef .
- H. Li and P. Hrnjak, Modeling of bubble dynamics in single diabatic microchannel, Int. J. Heat Mass Transfer, 2017, 107, 96–104 CrossRef CAS .
- S. T. Kadam and R. Kumar, Understanding of bubble growth at nucleation site using energy based non-dimensional numbers and their impact on critical heat flux condition in microchannel, Therm. Sci. Eng. Prog., 2018, 7, 70–75 CrossRef .
- L. Yin, L. Jia and P. Guan, Bubble confinement and deformation during flow boiling in microchannel, Int. Commun. Heat Mass Transfer, 2016, 70, 47–52 CrossRef .
- L. Yin, L. Jia and M. Xu, Experimental investigation on bubble sliding during subcooled flow boiling in microchannel, Exp. Therm. Fluid Sci., 2015, 68, 435–441 CrossRef CAS .
- V. Talimi, Y. S. Muzychka and S. Kocabiyik, A review on numerical studies of slug flow hydrodynamics and heat transfer in microtubes and microchannels, Int. J. Multiphase Flow, 2012, 39, 88–104 CrossRef CAS .
- E. Karatay, A. S. Haase, C. W. Visser, C. Sun, D. Lohse, P. A. Tsai and R. G. Lammertink, Control of slippage with tunable bubble mattresses, Proc. Natl. Acad. Sci. U. S. A., 2013, 110(21), 8422–8426 CrossRef CAS PubMed .
- Y. Gao, J. Li, H. C. Shum and H. Chen, Drag reduction by bubble-covered surfaces found in PDMS microchannel through depressurization, Langmuir, 2016, 32(19), 4815–4819 CrossRef CAS PubMed .
- L. Guo, Y. Liu, P. Ran, G. Wang, J. Shan, X. Li, C. Liu and J. A. Li, A bioinspired bubble removal method in microchannels based on angiosperm xylem embolism repair, Microsyst. Nanoeng., 2022, 8(1), 34 CrossRef CAS PubMed .
- M. Yang, N. Sun, Y. Luo, X. Lai, P. Li and Z. Zhang, Emergence of debubblers in microfluidics: a critical review, Biomicrofluidics, 2022, 16(3), 031503 CrossRef CAS .
- I. Pereiro, A. F. Khartchenko, L. Petrini and G. V. Kaigala, Nip the bubble in the bud: a guide to avoid gas nucleation in microfluidics, Lab Chip, 2019, 19(14), 2296–2314 RSC .
- Y. Liu and X. Zhang, A unified mechanism for the stability of surface nanobubbles: contact line pinning and supersaturation, J. Chem. Phys., 2014, 141(13), 134907 CrossRef .
- D. Lohse and X. Zhang, Pinning and gas oversaturation imply stable single surface nanobubbles, Phys. Rev. E:Stat., Nonlinear, Soft Matter Phys., 2015, 91(3), 031003 CrossRef PubMed .
- Y. Jiang, Droplet depinning on superhydrophobic surfaces: from simple rigid wetting to complex soft wetting, Surf. Innovations, 2022, 10(6), 373–378 CrossRef .
- N. V. Mhatre and S. Kumar, Shear-induced Depinning of Thin Droplets on Rough Substrates, J. Fluid Mech., 2024, 14, 990 Search PubMed .
- E. Delnoij, J. A. M. Kuipers and W. P. M. van Swaaij, Dynamic simulation of gas-liquid two-phase flow: effect of column aspect ratio on the flow structure, Chem. Eng. Sci., 1997, 52(21–22), 3759–3772 CrossRef CAS .
- J. Xu, B. Chen and X. Wang, Prediction of sliding bubble velocity and mechanism of sliding bubble motion along the surface, J. Enhanced Heat Transfer, 2010, 17(2), 111–124 CrossRef .
- J. F. Klausner, R. Mei and D. M. Bernhard, Vapor bubble departure in forced convection boiling, Int. J. Heat Mass Transfer, 1993, 36(3), 651–662 CrossRef CAS .
- D. Li, Y. Ji, Z. Zhang and Y. Li, How the distribution and morphology of interfacial gas bubbles enhancing the boundary slip of fluid flow, Tribol. Int., 2023, 109037 CrossRef .
- C. De Crescenzo, S. Sabbarese, R. Ciampa, G. Capece, A. Migliaccio, D. Karatza, S. Chianese and D. Musmarra, Simulation of Methane Mass Transfer in a Bubble Columni Incipient Turbulent Regime Using Comsol Multiphysics®, Chem. Eng. Trans., 2021, 86, 1183–1188 Search PubMed .
- Y. Chen, L. Wang, H. Chang and Q. Zhang, A Review of Drag Coefficient Models in Gas-Liquid Two-Phase Flow, ChemBioEng Rev., 2023, 10(3), 311–325 CrossRef CAS .
- R. Mei and J. F. Klausner, Shear lift force on spherical bubbles, Int. J. Heat Fluid Flow, 1994, 15(1), 62–65 CrossRef CAS .
- S. R. Bazaz, A. Mashhadian, A. Ehsani, S. C. Saha, T. Krüger and M. E. Warkiani, Computational inertial microfluidics: a review, Lab Chip, 2020, 20(6), 1023–1048 RSC .
- H. Kusudo, T. Omori and Y. Yamaguchi, Extraction of the Equilibrium Pinning Force on a Contact Line Exerted from a Wettability Boundary of a Solid Surface through the Connection between Mechanical and Thermodynamic Routes, J. Chem. Phys., 2019, 151(15), 154501 CrossRef .
- P. Lv, P. Peñas, J. Eijkel, A. V. D. Berg and X. Zhang, Self-Propelled Detachment upon Coalescence of Surface Bubbles, Phys. Rev. Lett., 2021, 127(23), 235501 CrossRef CAS PubMed .
- S. Peng, V. Spandan, R. Verzicco, D. Lohse and X. Zhang, Growth Dynamics of Microbubbles on Microcavity Arrays by Solvent Exchange: Experiments and Numerical Simulations, J. Colloid Interface Sci., 2018, 532, 103–111 CrossRef CAS PubMed .
- D. Li and J. Gu, Estimating the Pinning Force of Surface Nanobubbles Based on Trapped Nanobubble Protruding, J. Phys. Chem. C, 2022, 126(6), 3221–3226 CrossRef CAS .
- Z. Wang, B. Wang, D. Weng, C. Wang, N. Sun and J. Wang, Influence of entrapped gas morphology at liquid–solid interface on underwater drag reduction effect, Phys. Fluids, 2021, 33(12), 122111 CrossRef CAS .
- B. H. Tan, H. An and C. D. Ohl, Surface nanobubbles are stabilized by hydrophobic attraction, Phys. Rev. Lett., 2018, 120(16), 164502 CrossRef PubMed .
- D. Li, Y. Ji, Z. Wei and L. Wang, Toward a Comprehensive Understanding of the Anomalously Small Contact Angle of Surface Nanobubbles, Langmuir, 2024, 40(16), 8721–8729 Search PubMed .
Footnote |
| † Electronic supplementary information (ESI) available: A detailed analysis of force variation in estimated force trends (Table 3) during surface bubble sliding and detachment. See DOI: https://doi.org/10.1039/d5ra02116b |
|
| This journal is © The Royal Society of Chemistry 2025 |
Click here to see how this site uses Cookies. View our privacy policy here. 
 Open Access Article
 This Open Access Article is licensed under a Creative Commons Attribution-Non Commercial 3.0 Unported Licence
 *,
Junbo Xing,
Ziqun Zhang and
Hongfei Wang
*,
Junbo Xing,
Ziqun Zhang and
Hongfei Wang