
 Open Access Article
 This Open Access Article is licensed under a
 Creative Commons Attribution 3.0 Unported Licence
Modeling the melting temperature of metallic nanocrystals: dependencies on size, dimensionality, and composition
Yanli Maa,
Ming Li *a and
Haiming Lu*b
*a and
Haiming Lu*b
aAnhui Province Industrial Generic Technology Research Center for Alumics Materials, Huaibei Normal University, Huaibei, 235000, China. E-mail: liming2010@chnu.edu.cn
bNational Laboratory of Solid State Microstructures, Collaborative Innovation Center of Advanced Microstructures, College of Engineering and Applied Sciences, Nanjing University, Nanjing, Jiangsu 210093, China. E-mail: haimlu@nju.edu.cn
First published on 7th May 2025
Abstract
The melting temperature is an extremely important property in describing the stability of metallic nanocrystals and can be modulated by the size, dimensionality, and composition. In this study, a new model was developed to comprehend these effects on the melting temperature by considering the surface stress and the size-dependent surface energy. The developed model predicts a decrease in the melting temperature with decreasing size or dimensionality. Moreover, for nanoalloys with identical size and dimensionality, the model suggests that the melting temperature decreases as the component with lower surface energy increases. Importantly, our model's predictions are consistent with experimental and simulation data, validating its accuracy and universality.
Introduction
As a fundamental property in practical applications, the melting temperature Tm holds significant importance.1–4 Some useful material properties are functions of the ratio of working temperature (Tw) to Tm.5,6 Usually, for bulk materials, these functions become irrelevant due to the constant Tm(∞), where ∞ denotes the bulk. Nevertheless, as the size (D) of metallic nanocrystals (MNCs) decreases into the nanoscale range, their melting temperature Tm(D) also decreases due to the significant increase in surface-to-volume ratio (A/V).7–9 Simultaneously, Tw/Tm(D) increases with decreasing D and associated functions start to come into play. Consequently, at equivalent Tw values, MNCs can exhibit superior properties compared to bulk materials, which is advantageous for practical applications.10,11 Furthermore, the decrease in Tm(D) will be a critical factor contributing to failure of many MNCs that operate at elevated temperatures.12 For efficient applications of MNCs, we should consider the trade-off between stability and properties to determine the optimal size at which both coexist. Additionally, certain properties of MNCs are directly or indirectly related to Tm(D).13,14 Once we know how Tm(D) behaves, it can serve as a bridge towards determining those size-dependent properties. Therefore, investigating the melting behavior of MNCs is crucial for determining the optimal size as well as identifying other size-dependent properties.In order to understand the melting behavior of MNCs, extensive research has been conducted in both experimental and simulation fields. For example, electron diffraction patterns were used to analyze the thermostability of Pb nanoparticles (NPs).15 Additionally, the molecular dynamics method was utilized to study the melting behaviors of Pb nanowires (NWs)16 and CuxNi1−x nanoalloys (NAs),17 with x representing the composition. In summary, the aforementioned references suggest that Tm(x, D, d) can be customized by varying D, dimensionality (d) and x. To enhance our understanding of the melting behavior of MNCs and facilitate the design of nanodevices, it is imperative to comprehend the impact of these parameters.
Apart from experiments and simulations, theoretical studies are also effective in illustrating the melting mechanism. Many theoretical works have been conducted, such as Wautelet's Gibbs free energy model (FEM)18 and Nanda's Liquid-drop model (LDM).19 These two models share a common feature: Tm(D) is inversely proportional to D, which can be expressed as:
 | (1) |
Although β is defined as a material constant, it has no explicit physical meaning and its value depends on the models employed. For instance, in the case of Pb, β can be 1.4 nm (ref. 18) in FEM or 1.8 nm (ref. 19) in LDM. In deriving these models, surface energy γ – an important thermodynamic parameter – was taken into account to determine the value of β. However, it should be noted that γ is size-dependent,20,21 whereas both LDM and FEM models treated it as a size-independent parameter, resulting in inaccurate values for β. Additionally, the reorganization of surface atoms when a new surface is formed can create surface stress. This surface stress, denoted as f, can result in surface strain and ultimately impact the Tm(x, D, d) function.21–24 Specifically, both γ(D) and f can affect the Tm(x, D, d) function. Therefore, to achieve a comprehensive understanding of the melting behavior of MNCs, it is essential to incorporate both factors into the model. In this contribution, the objective is to propose an analytical model that incorporates both γ(D) and f to predict the Tm(x, D, d) function of MNCs. The accuracy and universality of our proposed model will be validated through comparison with corresponding experimental and simulation data.
Model
As previously noted in our research, the role of cohesive energy per atom (Ec) plays an equivalent role to that of Tm in determining thermostability,25 Specifically, Tm(∞) is proportional to Ec(∞). The absence of structural change should result in Tm and Ec being continuous functions as size decreases from bulk to nanoscale, with A/V increasing as the sole variable.25 Consequently, this relationship can be extended to the nanoscale level:
 | (2) |
Therefore, the determination of Tm(D) relies on knowledge of the Ec(D) function. Compared with bulk crystals, MNCs possess a larger surface area, leading to the breaking of bonds of surface atoms and subsequent reorganization. The total energy of MNCs can be divided into three components: internal energy Ec(D), surface free energy γ(D) arising from new surface formation, and distortion energy U caused by reorganization of surface atoms. According to the law of the conservation of energy, it can be expressed as:
| nEc(∞) = nEc(D) + Aγ(D) + U | (3) |
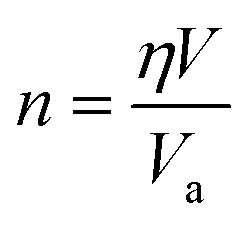
For crystals with varying structures, the atoms arrange themselves in distinct patterns, resulting in diverse packing densities η. In the case of MNCs with a given volume V, n can be mathematically expressed as:
 | (4) |
According to our previous model and Qi's work, the approximate relationship between γ and Ec has been assessed as  26,27 where Aa is the surface area of one atom. By extending this expression to the nanoscale, it can be reformulated as:
 | (5) |
| f = [(3σsl0D0B)/8]1/2 | (6) |
| σsl0 = 2hHm(∞)Svib(∞)/[3Vm(∞)R] | (7) |
 | (8) |
By combining eqn (3)–(5) and (8), Tm(D, d) or Ec(D, d) can be written as:
 | (9) |
For NAs, the parameters required for calculation in eqn (9) are composition-dependent due to component interactions and can be approximated using the Fox equation:34
 | (10) |
Results and discussion
Fig. 1 shows the model's prediction of Tm(D) for Pb NPs based on eqn (9), represented by the black line. The parameters utilized in eqn (9) are detailed in Table 1. The general trend is that Tm(D) decreases as D decreases, with a significant decrease occurring at D < 10 nm, indicating that size has a noticeable effect on Tm(D) at smaller sizes. This tendency can be attributed to an increase in A/V. As the decline of D, a multitude of atoms attach to the surface, leading to an increase in A/V. Subsequently, the surface atoms take precedence in determining the properties of MNCs. Given that surface atoms possess higher energetic states than inner atoms, thermal vibration of MNCs intensifies as D declines. Based on this analysis and the Lindemann criterion, it is reasonable to anticipate a reduction in Tm(D). During derivation of eqn (9), this decrease in Tm(D) is attributed to synergistic effects between f and γ(D), however, existing analytical models scarcely consider the effect of f on Tm(D). To determine whether f affects the Tm(D) or not, we also plotted the prediction of ignoring the effect of f in eqn (9) as a red line in Fig. 1. As shown in Fig. 1, the red line is higher than both the present model prediction and the experimental (■15) and simulation (□35) data. However, good consistency can be observed between our present model prediction and these symbols. Therefore, it can be concluded that the existence of f has a decreasing effect on Tm(D). From the perspective of energy, the presence of f can enhance the free energy of MNCs and subsequently decrease the Tm(D). Additionally, Lu's research has demonstrated that f effectively reduces Tm(D),21 thereby confirming the aforementioned analysis. Consequently, it is imperative to consider the impact of f as disregarding its effect may lead to an overestimation of Tm(D). | ||
| Fig. 1 Tm(D) function of Pb NPs. The symbols ■15 and □35 are the corresponding experimental and simulation data. The illustration expounds on the influences of γ(D) and f on the ΔTm(D). | ||
| h | Hm(∞) | Tm(∞) | Svib(∞) | Vm(∞) | B | Ec(∞) | η44 | |
|---|---|---|---|---|---|---|---|---|
| a The units for B, h, Hm(∞), Tm(∞), Svib(∞), Vm(∞) and Ec(∞) are GPa, nm, kJmol−1, K, cm3 mol−1, J mol−1 K−1 and eV, respectively. The values of B, h, Hm(∞), Tm(∞) and Vm(∞) are taken from the reference,45 the values of Svib and Ec(∞) are taken from the references.46,47.b The parameters are calculated by eqn (11). | ||||||||
| Pb | 0.350 | 4.77 | 600.6 | 6.65 | 18.26 | 46.00 | 2.03 | 0.74 |
| Au | 0.270 | 12.50 | 1337.3 | 7.62 | 10.21 | 220.00 | 3.82 | 0.74 |
| Sn | 0.290 | 7.00 | 505.1 | 9.22 | 16.29 | 58.00 | 3.06 | 0.53 |
| Al | 0.250 | 10.70 | 933.5 | 6.15 | 10.00 | 76.00 | 3.40 | 0.74 |
| Bi | 0.320 | 10.90 | 544.7 | 7.20 | 21.31 | 31.00 | 2.18 | 0.44 |
| Ag | 0.289 | 11.30 | 1234.9 | 7.82 | 21.31 | 100.00 | 2.94 | 0.74 |
| In | 0.368 | 3.26 | 429.8 | 7.58 | 15.76 | 43.00 | 2.52 | 0.68 |
| Cu | 0.270 | 13.10 | 1357.8 | 7.85 | 7.11 | 140.00 | 3.48 | — |
| Ni | 0.270 | 17.20 | 1728.0 | 8.11 | 6.59 | 180.00 | 4.47 | — |
| Pd | 0.275 | 16.70 | 1828.1 | 7.22 | 8.56 | 121.00 | 3.90 | — |
| Pt | 0.270 | 20.00 | 2041.4 | 7.80 | 9.09 | 230.00 | 5.85 | — |
| Cu0.2Ni0.8b | 0.270 | 16.20 | 1677.1 | 8.05 | 6.69 | 170.27 | 4.23 | 0.74 |
| Cu0.5Ni0.5b | 0.270 | 14.87 | 1520.7 | 7.98 | 6.84 | 157.50 | 3.92 | 0.74 |
| Cu0.8Ni0.2b | 0.270 | 13.76 | 1418.6 | 7.90 | 7.00 | 146.51 | 3.64 | 0.74 |
| Pd0.25Ni0.75b | 0.255 | 17.07 | 1752.0 | 7.87 | 6.99 | 160.44 | 4.55 | 0.74 |
| Pd0.5Pt0.5b | 0.272 | 17.44 | 1928.8 | 7.49 | 8.82 | 158.58 | 4.68 | 0.74 |
| Pd0.5Cu0.5b | 0.265 | 14.68 | 1558.2 | 7.52 | 7.77 | 128.33 | 3.69 | 0.74 |
| Pb0.5Bi0.5b | 0.335 | 6.64 | 571.1 | 6.92 | 19.67 | 37.00 | 4.72 | 0.74 |
In addition, the prediction of FEM is also shown in Fig. 1 with an orange line for comparison. It is evident that the prediction of FEM is lower than both the symbols and the prediction of present model. During the derivation of FEM, γ was considered size-independent.18 However, it actually decreases with the decrease of D.14,36 According to FEM's expression, Tm (D) declines as increasing γ.18 Therefore, neglecting the size effect on γ(D) would lead to an overestimation of the impact of surface energy and a subsequent underestimation of Tm(D). In light of the above analysis, it is imperative to consider the effects of f and γ(D), as failing to do so could lead to either an underestimation or overestimation of the size effect.
Based on the aforementioned analysis, both f and γ(D) are essential factors in determining the Tm(D) function. To comprehend the individual impact of f and γ(D), one can express the difference in melting temperature (ΔTm(D) = Tm(D) − Tm(∞)) as follows using eqn (9):
 | (11) |
 denoting the influences of γ(D) and f, respectively. The influences on ΔTm(D) are depicted in the inserted graph of Fig. 1, where the green and pink lines represent their respective effects. As illustrated in the graph, both lines are below zero, suggesting that either γ(D) or f contributes to the decrease in Tm(D). Additionally, the green line shows a more significant decline than the pink line, suggesting that f causes a greater depression in Tm(D) depression compared to γ(D), as verified by Jiang's work.37
Fig. 2 depicts the Tm(D, d) function of Pb MNCs in light of eqn (9). The red, black and blue lines represent Pb NFs, NWs and NPs respectively from top to bottom. It is evident that all three lines decrease as D decreases. Furthermore, for a given D value, the Tm(D, d) values can be ranked in descending order as follows: Tm(D, 2) > Tm(D, 1) > Tm(D, 0). For MNCs with identical D but different d values, A/V can be sequenced as: (A/V)NFs < (A/V)NWs < (A/V)NPs. Based on the aforementioned analysis, the depression of Tm(D, d) is caused by the increase in A/V. Henceforth, in terms of size effect, NPs exhibit the most significant impact followed by NWs while NFs exert a relatively weaker influence; this means that as d decreases, Tm(D, d) also declines.
 | ||
| Fig. 2 Tm(D, d) functions of Pb MNCs. The symbols ▲48 and ●16 are the simulation data for Pb NFs, NWs, ■15 and □35 are the experimental and simulation data for Pb NPs, respectively. | ||
To further demonstrate the universality of eqn (9), Fig. 3 presents a comparison between our model's predictions and experimental/simulation data for various MNCs, including Au, Ag, Al, Sn, Bi NPs and In MNCs. It is evident that the Tm(D, d) curves of above MNCs are in agreement with their corresponding symbols. By combining Fig. 1–3, the validity and universality of the eqn (9) are fully demonstrated due to the remarkable consistency with both experimental and simulation data.
 | ||
| Fig. 3 Tm(D, d) functions of (a) Au NPs, (b) Sn NPs, (c) Al NPs, (d) Bi NPs, (e) Ag NPs and (f) in MNCs. The symbols ■,49 ●,50 □,51 ○52 ☆,53 ★,54 △55 and ▲56 are the experimental results, ▼57 and ▽58 are the simulation data. | ||
For bimetallic NAs, the variation in component x can alter the interatomic interaction and subsequently impact melting temperature.38 Fig. 4 illustrates the comparison between model predictions (Eq. (9)) and simulation results for Tm (x, D) of CuxNi1−x NPs with x = 0.2, 0.5 and 0.8. It is evident that both of them exhibit a high degree of consistency. For instance, when D equals 4 nm, the simulation results are recorded at temperatures of 1250 K, 1150 K, and 1073 K,17 while the corresponding predicted values are 1260 K, 1167 K, and 1089 K for x equal to 0.2, 0.5, and 0.8, respectively. The margin of error between the two sets of data is approximately 1%. Furthermore, it also can be observed that, as Cu content increases, Tm (x, D) decreases. For NAs, the distribution of components is non-uniform, exhibiting surface segregation. The segregation phenomenon can be described as follows: the component with the lowest γ value preferentially segregates to the surface.39,40 Consequently, for the CuxNi1−x NAs, Cu atoms will preferentially segregate to the surface due to their lower surface energy compared to Ni (γCu = 1.566 J m−2 vs. γNi = 2.080 J m−2).41 With the increase of Cu, more surface segregation of Cu atoms leads to a decrease in the bond energy of Cu–Ni NAs, especially for surface atoms, and then leads to an increase in the thermal vibration of surface atoms. According to the Lindemann criterion,42 the decrease in Tm(x, D) can be expected with the increase of the Cu component. The alignment between model predictions and simulation data confirmed the effectiveness of eqn (9).
 | ||
| Fig. 4 Tm(x, D) functions of CuxNi1−x NPs with x = 0.2, 0.5 and 0.8. The symbol ■17 is the simulation data. | ||
Furthermore, the Tm(x, D, d) functions for Pd0.25Ni0.75, Pd0.5Cu0.5, Pb0.5Bi0.5 NPs and Pd0.5Pt0.5 NWs are depicted in Fig. 5 to demonstrate the validity and universality of eqn (9), which is supported by both experimental and simulation data.
 | ||
| Fig. 5 Tm(x, D, d) functions of (a) Pb0.5Bi0.5 NPs, (b) Pd0.25Ni0.75 NPs, (c) Pd0.5Cu0.5 NPs and (d) Pd0.5Pt0.5 NWs. The symbol ●59 denotes the experimental results. ♦,60 ▲61 and ■62 are the corresponding simulation data, respectively. | ||
The model introduced in this study offers valuable insights into modifying Tm(x, D, d) in MNCs by manipulating their size, dimensionality and composition. The parameters required for model prediction possess clear physical significance, which ensures the model's applicability not only to metallic nanocrystals but also to non-metallic nanocrystals. Given the critical importance of Tm(x, D, d) in characterizing fundamental property variations,13,14 this model facilitates a quantitative exploration of key challenges in MNCs ' research. It is noteworthy that the model's applicability is currently restricted to MNCs under ambient pressure conditions. While as the pressure increases, the intermolecular distance of most substances decreases, leading to more stable solid structures that require higher temperatures to melt. Consequently, the melting temperature generally increases with increasing pressure,3,43 demonstrating an inverse relationship with the size effect. Therefore, our subsequent research will focus on exploring the competition between size-induced undercooling and pressure-induced overheating.
Conclusions
In summary, a novel model is established by taking into account both f and γ(D), which can be utilized to predict the Tm(x, D, d) of MNCs. The depression of Tm(x, D, d) with decreasing D or d results from the synergistic effects of f and γ(D). While both f and γ(D) contribute to the reduction in Tm(x, D, d), the impact of f is more pronounced than that of γ(D). Neglecting either factor would lead to an underestimation or overestimation of Tm(x, D, d). Furthermore, as the component with the lowest γ increases, surface segregation causes a decrease in NAs' Tm(x, D, d). By comparing it to corresponding experimental and simulation data, the validity and universality of the newly constructed model are confirmed, providing guidance for designing and applying new nanodevices.Abbreviation
| A/V | Surface-to-volume ratio |
| Aa | Surface area of one atom |
| B | Bulk modulus |
| D | Size |
| d | Dimensionality |
| D0 | Critical diameter |
| Ec | Cohesive energy per atom |
| f | Surface stress |
| FEM | Gibbs free energy model |
| h | Nearest neighbor atomic distance |
| Hm | Melting enthalpy |
| LDM | Liquid-drop model |
| MNCs | Metallic nanocrystals |
| NAs | Nanoalloys |
| NFs | Nanofilms |
| NPs | Nanoparticles |
| NWs | Nanowires |
| Pin | Addition internal pressure |
| R | Ideal gas constant |
| σsl0 | Solid-liquid interface energy |
| Svib | Vibration entropy |
| Tm | Melting temperature |
| Tw | Working temperature |
| U | Distortion energy |
| Vm | Molar volume |
| x | Composition |
| γ | Surface energy |
| η | Packing density |
| β | Material constant |
| ∞ | Bulk |
Data availability
All data that support the findings of this study are included within the article.Conflicts of interest
There are no conflicts to declare.Acknowledgements
This work was supported by the National Natural Science Foundation of China (51301073, 11774148).References
- F. Wang, D. Zhou and Y. Han, Adv. Funct. Mater., 2016, 48, 8903–8919 Search PubMed.
- G. Guisbiers, Adv. Phys.:X, 2019, 4, 1668299 Search PubMed.
- G. de With, Chem. Rev., 2023, 123, 13713–13795 Search PubMed.
- L. Delgado-Callico, K. Rossi, R. Pinto-Miles, P. Salzbrenner and F. Baletto, Nanoscale, 2021, 13, 1172–1180 Search PubMed.
- M. Li and T. S. Zhu, Phys. Chem. Chem. Phys., 2016, 18, 16958–16963 Search PubMed.
- H. Gleiter, Prog. Mater. Sci., 1989, 33, 223–315 Search PubMed.
- Z. Yan, M. G. Taylor, A. Mascareno and G. Mpourmpakis, Nano Lett., 2018, 18, 2696 Search PubMed.
- C. C. Yang and Y. W. Mai, Mater. Sci. Eng., R, 2014, 79, 1–40 Search PubMed.
- X. Jiang, H. Sheng and B. Xiao, Phys. Chem. Chem. Phys., 2023, 25, 29310–29314 Search PubMed.
- T. Mallát, Z. Bodnár, S. Szabó and J. Petró, Appl. Catal., 1991, 69, 85–95 Search PubMed.
- L. Lu, M. Sui and K. Lu, Science, 2000, 287, 1463–1466 Search PubMed.
- Z. L. Wang, J. M. Petroski, T. C. Green and M. A. El-Sayed, J. Phys. Chem. B, 1998, 102, 6145–6151 Search PubMed.
- C. C. Yang and Y. W. Mai, J. Phys. Chem. C, 2013, 117, 2421–2426 Search PubMed.
- Q. Jiang and H. Lu, Surf. Sci. Rep., 2008, 63, 427–464 Search PubMed.
- C. Coombes, Met. Phys., 1972, 2, 441 Search PubMed.
- O. Gülseren, F. Ercolessi and E. Tosatti, Phys. Rev. B:Condens. Matter Mater. Phys., 1995, 51, 7377 Search PubMed.
- G. Li, Q. Wang, D. Li, L. Xiao and J. He, Mater. Chem. Phys., 2009, 114, 746–750 Search PubMed.
- M. Wautelet, Eur. Phys. J.:Appl. Phys., 2004, 29, 51–54 Search PubMed.
- K. Nanda, S. Sahu and S. Behera, Phys. Rev. A, 2002, 66, 013208 Search PubMed.
- E. H. Kim and B. J. Lee, Met. Mater. Int., 2009, 15, 531–537 Search PubMed.
- Q. S. Mei and K. Lu, Prog. Mater. Sci., 2007, 52, 1175–1262 Search PubMed.
- H. Wang and H. Zhu, Nanoscale Res. Lett., 2015, 10, 1–9 Search PubMed.
- H. Sheng, R. Gao, B. Xiao and X. Jiang, Vacuum, 2021, 192, 110428 Search PubMed.
- Y. Ma, W. Li, P. Dong, M. Yang, Y. He, S. Zheng, Z. Zhao, R. Zhang, Z. Zhang and M. Li, Eur. Phys. J. Plus, 2022, 137, 824 Search PubMed.
- H. M. Lu, D. N. Ding, Z. H. Cao, S. C. Tang and X. K. Meng, J. Phys. Chem. C, 2007, 111, 12914–12917 Search PubMed.
- Q. Jiang, H. M. Lu and M. Zhao, J. Phys.: Condens. Matter, 2004, 16, 521–530 Search PubMed.
- W. H. Qi and M. P. Wang, J. Mater. Sci. Lett., 2002, 21, 1743–1745 Search PubMed.
- S. Li, J. Lian and Q. Jiang, Chem. Phys. Lett., 2008, 455, 202–206 Search PubMed.
- R. C. Cammarata and K. Sieradzki, Annu. Rev. Mater. Sci., 1994, 24, 215–234 Search PubMed.
- M. Zhao, X. Zhou and Q. Jiang, J. Mater. Res., 2001, 16, 3304–3308 Search PubMed.
- L. H. Liang, J. C. Li and Q. Jiang, Solid State Commun., 2002, 121, 453–455 Search PubMed.
- Z. Zhang, X. X. Lü and Q. Jiang, Phys. B, 1999, 270, 249–254 Search PubMed.
- Q. Jiang, H. X. Shi and M. Zhao, Acta Mater., 1999, 47, 2109–2112 Search PubMed.
- T. G. Fox, Bull. Am. Phys. Soc., 1956, 1, 123 Search PubMed.
- H. Lim, C. Ong and F. Ercolessi, Zeitschrift für Physik D Atoms, Molecules and Clusters, 1993, 26, 45–47 Search PubMed.
- T. D. Chen, Y. L. Ma, X. D. Fu and M. Li, ACS Appl. Nano Mater., 2020, 3, 1583–1591 Search PubMed.
- X. Jiang, B. Xiao, R. Lan, X. Gu, H. Sheng, H. Yang and X. Zhang, J. Phys. Chem. C, 2018, 122, 26260–26266 Search PubMed.
- S. P. Huang and P. B. Balbuena, J. Phys. Chem. B, 2002, 106, 7225–7236 Search PubMed.
- A. V. Ruban, H. L. Skriver and J. K. Nørskov, Phys. Rev. B, 1999, 59, 15990–16000 Search PubMed.
- M. J. Cui, H. M. Lu, H. P. Jiang and X. K. Meng, ACS Nano, 2016, 10, 10618–10619 Search PubMed.
- W. R. Tyson and W. A. Miller, Surf. Sci., 1977, 62, 267–276 Search PubMed.
- F. A. Lindemann, Phys. Z., 1910, 11, 609–612 Search PubMed.
- Z. Chen, C. Q. Sun, Y. Zhou and G. Ouyang, J. Phys. Chem. C, 2008, 112, 2423–2427 Search PubMed.
- H. Lu and Q. Jiang, Phys. Status Solidi A, 2004, 241, 2472–2476 Search PubMed.
- R. Rossetti, R. Hull, J. M. Gibson and L. E. Brus, J. Chem. Phys., 1985, 82, 552–559 Search PubMed.
- H. M. Lu, Z. Wen and Q. Jiang, Colloids Surf., A, 2006, 278, 160–165 Search PubMed.
- C. Kittel, Introduction to Solid State Physics, 5th edn Wiley, 2005 Search PubMed.
- W. H. Qi and M. P. Wang, Chin. J. of Nonferrous Met., 2006, 16, 1161–1165 Search PubMed.
- K. Dick, T. Dhanasekaran, Z. Zhang and D. Meisel, J. Am. Chem. Soc., 2002, 124, 2312–2317 Search PubMed.
- S. Lai, J. Guo, V. Petrova, G. Ramanath and L. Allen, Phys. Rev. Lett., 1996, 77, 99 Search PubMed.
- S. Lai, J. Carlsson and L. Allen, Appl. Phys. Lett., 1998, 72, 1098–1100 Search PubMed.
- V. Skripov, V. Koverda and V. Skokov, Phys. Status Solidi A, 1981, 66, 109–118 Search PubMed.
- M. Zhang, M. Y. Efremov, F. Schiettekatte, E. Olson, A. Kwan, S. Lai, T. Wisleder, J. Greene and L. Allen, Phys. Rev. B, 2000, 62, 10548 Search PubMed.
- G. Allen, R. Bayles, W. Gile and W. Jesser, Thin Solid Films, 1986, 144, 297–308 Search PubMed.
- K. M. Unruh, T. E. Huber and C. A. Huber, Phys. Rev. B, 1993, 48, 9021–9027 Search PubMed.
- G. Krausch, T. Detzel, H. Bielefeldt, R. Fink, B. Luckscheiter, R. Platzer, U. Wöhrmann and G. Schatz, Appl. Phys. A:Mater. Sci. Process., 1991, 53, 324–329 Search PubMed.
- W. Luo, W. Hu and S. Xiao, J. Phys. Chem. C, 2008, 112, 2359–2369 Search PubMed.
- S. Xiao, W. Hu and J. Yang, J. Phys. Chem. B, 2005, 109, 20339–20342 Search PubMed.
- W. A. Jesser, R. Z. Shneck and W. W. Gile, Phys. Rev. B, 2004, 69, 144121 Search PubMed.
- U. Domekeli, S. Sengul, M. Celtek and C. Canan, Philos. Mag., 2017, 98, 1–17 Search PubMed.
- S. K. R. S. Sankaranarayanan, V. R. Bhethanabotla and B. Joseph, J. Phys. Chem. C, 2007, 111, 2430–2439 Search PubMed.
- S. K. R. S. Sankaranarayanan, V. R. Bhethanabotla and B. Joseph, Phys. Rev. B, 2006, 71, 155441 Search PubMed.
| This journal is © The Royal Society of Chemistry 2025 |