
 Open Access Article
 This Open Access Article is licensed under a Creative Commons Attribution-Non Commercial 3.0 Unported Licence
Weak localization in pure and Cr-doped MoS2 macroparticles probed through a low field magnetoimpedance effect
A. K. Swethaa,
Rajesh Cherukub,
K. P. Shindeb,
Ki Buem Kimc,
Y. Jod and
Rajeev Shesha Joshi *a
*a
aCentral University of Karnataka, Kalaburagi-585367, India
bDepartment of Physics, School of Engineering, Dayananda Sagar University, Harohalli, Bengaluru, Karnataka 562112, India
cDepartment of Nanotechnology and Advanced Materials Engineering, Sejong University, Seoul 05006, Republic of Korea
dCenter for Scientific Instrumentation, Korea Basic Science Institute, Daejeon 34133, Republic of Korea. E-mail: rajeevsj@cuk.ac.in
First published on 24th June 2025
Abstract
Globular MoS2 with Cr doping, exhibiting a flake-like texture, was studied through AC magnetoelectric transport to identify weak charge localization that is not identified using magnetic measurements, in order to establish inhomogeneity-driven magnetoelectric coupling. Hydrothermally synthesized MoS2 had a mixed 2H/1T phase in native conditions. Upon doping, the proportion of the 1T phase increased. To probe inhomogeneity-driven magnetoelectric coupling and localization, magnetoimpedance studies were carried out to establish an MR of 110% at 100 Hz frequency for pure MoS2. For the doped condition, they were −7% for MoS2–Cr 5%, 1.9% for MoS2–Cr 10% and 58% for MoS2–Cr 15%. The feeble spin order was lost in all the compounds at low temperature from 17 to 51 K, as shown in magnetization studies, developing a blocking behavior in resistivity. Weak charge localization was detected that changed the polaronic radius in MoS2 and decreased its width with doping according to relaxation studies. The change in activation energy and the effect of the magnetic field on the bulk resistivity and relaxation time revealed that the strength of localization was weaker following doping. The change in relaxation time of MoS2 across doping concentrations with the application of a magnetic field at a given temperature confirms the spin accumulation/deaccumulation process. This establishes inhomogeneity-driven weak localization in Cr-doped MoS2.
Introduction
Research on the magnetic response of MoS2 demonstrates its potential use in spintronic and nanoelectronic systems. Although the bulk MoS2 is diamagnetic like graphite, many theoretical investigations suggest that MoS2 turns ferromagnetic when the nanoribbons are made with zigzag edges, or if it is engineered with defects.1 One important results by Gao et al. correlated ferromagnetism with fluorine doping of MoS2 nanosheets with well-defined hysteresis. It has Ms of 0.06 emu g−1 and a MR of 4.1%. In this case, the concentration of the adatom can be altered to adjust the detected ferromagnetism. Demonstrations using first-principles computations show that the fluorine absorbed MoS2 monolayer supports spontaneous spin polarization and production of a local moment as well as the possibility of long-range magnetic order in the spin moments. Furthermore, the tunability of ferromagnetic ordering in MoS2 is possible via doping and substrate strain.2 It was discovered that substitutional doping in TMDCs—which uses elements from groups 5 to 7 such as Cr, Mn, or Fe, instead of dopants at the interstitial or defect sites—has a profound effect on the structure and properties of the material.3–5The preferred substitutional position of Cr atoms at Mo sites leads to significant changes in the material's band structure and introduces magnetic behavior, which can be leveraged for various applications, including spintronics and catalysis. Understanding the precise positioning and effects of Cr doping is crucial for tailoring MoS2-based materials for specific technological applications.6–9 Chromium atoms preferentially substitute for molybdenum (Mo) atoms in the MoS2 lattice. This substitutional doping is energetically favorable compared with interstitial or surface adsorption configurations. In monolayer MoS2, Cr atoms tend to occupy nearest-neighbor positions, while in multilayer MoS2, they are more likely to remain in the outermost surface layers. This behavior is consistent across various computational studies employing density functional theory (DFT) and hybrid functionals.10
The substitutional doping or defects induce typically long-range spin order; however, there can be short range ordering associated with spin fluctuation in reduced dimensions,11 which has a positive correlation with resistivity of the metal or semiconductor. This positive correlation induces change in charge transport leading to localization effects. Based on the nature of the defect and charge trapping strength, the localization could be weaker or stronger.12 Based on the nature of magnetoresistance, the applied magnetic field can destroy this correlation effect, giving rise to cusp-like positive or negative magnetoresistance developing a localization or antilocalization effect. These spin fluctuation induced localizations mimic magnetoelectric effects which can be seen through the change in permittivity13 or permeability14 with respect to the applied magnetic field, typically probed through magnetoimpedance or magnetocapacitance effects.15,16 These studies are significant to understand inhomogeneity induced spin relaxation in low dimensional structures. The studies were conducted at low magnetic fields using macrospin approximation. This approach allows us to develop low field, low power spintronic devices.
In the present study, we investigate the weak localization effect in textured MoS2 nanoparticles induced by morphological inhomogeneities using impedance spectroscopy. The DC and AC magnetoresistance studies are used to probe the spin scattering strength and spin localization effect with respect to temperature. The doping of this low dimensional MoS2 with chromium (which has an antiferromagnetic ground state17 and is capable of inducing spin density waves) is expected to enhance or suppress the localization effect based on the nature of spin–spin interactions.18 Hence, AC and DC magnetotransport is studied over a range of substitutions containing 5%, 10% and 15% doping of chromium in the MoS2 matrix.
Experimental
The hydrothermal approach was used to synthesize MoS2 and MoS2 doped with chromium (5%, 10%, and 15%)19 through sodium molybdate dihydrate and thiourea precursors. Sodium molybdate dihydrate (0.1 M) and 0.3 M thiourea were separately dissolved in 35 mL of water by stirring for 30 minutes each and then mixing both solutions well by stirring for 1 h. This solution was transferred into a Teflon-lined, sealed stainless steel autoclave and placed into the furnace. The temperature was increased to achieve the hydrothermal process. An autogenous pressure is formed inside the chamber leading to a chemical reaction and MoS2 crystals are formed. For doping chromium into the matrix, chromium nitrate monohydrate was dissolved in distilled water to form a 0.1 M solution in stoichiometric ratios and added to the hydrothermal mixture before subjecting it to increasing temperature. After the hydrothermal process, the powder was filtered and dried. Further it was annealed at 400 °C for 1 h.The crystal structure of the powder was recorded using the PROTO AXRD powder diffraction system with Cu Kα radiation (λ = 1.5405 Å) in the 2θ region of 10° to 80°. A Jeol JSM-IT500 SEM was used to study the morphology of the formed nanoparticles. The indirect band gaps were identified using reflection measurements of UV-Vis spectroscopy. Raman analysis was performed using the Horiba Scientific macroRAM Raman spectrometer with a 785 nm wavelength laser with spectral resolution of 8 cm−1. A quantum design Dynacool VSM was used to study the magnetic characteristics of these particles. The FC measurements were done by cooling the material with a 100 G magnetic field from 10 K to 300 K. The ZFC measurements were also recorded in the heating cycle.
The powder was cold compressed under 10 T pressure without binder to preserve the low dimensionality. The pellet was held intact by the coercive strength, where the electrical contacts were made through low temperature compatible silver paint. Further, the contact pads were baked at 80 °C to achieve higher conductivity.
The magnetoresistance was studied using a Keysight SMU B2902A instrument. Low temperature transport studies were carried out from 9 K to 290 K using an Advanced Research Systems, Inc. closed cryogenic refrigerator (CCR), along with a Lakeshore Model 335 temperature controller. To analyze the impedance response, a ZM2376 LCR meter was used at frequency ranges from 100 Hz to 5.5 MHz. Parameters like parallel resistance (Rp), reactance (X), and capacitance (Cp) were measured at various temperatures from 9 K to room temperature with a magnetic field of 2000 G and the response was analyzed. Here, the range of the magnetic field was selected up to 2000 G to pick the spin fluctuation in macrospin responses that usually diminish above coercivity.
Results and discussion
Hydrothermally synthesized MoS2 nanoparticles and 5%, 10% and 15% chromium doped MoS2 nanoparticles were subjected to X-ray diffraction studies and the results were depicted in Fig. 1. | ||
| Fig. 1 (a) XRD patterns of pure MoS2 nanoparticles and those doped with 5%, 10% and 15% Cr. (b) Peak shift with respect to the variation in doping percentage of chromium. | ||
Standard powder diffraction patterns of the MoS2 hexagonal structure (JCPDS card no. 37-1492) were consistent with the principal diffraction peaks. The high degree of crystallinity and occurrence of well-stacked layered MoS2 nanoparticles during the hydrothermal process were confirmed by the strong preferred orientation at the (002) plane. There were no impurities or secondary phases observed in Cr-doped MoS2.20,21 The 1T phase of MoS2 was more prominent in exfoliated samples compared with hydrothermally synthesized MoS2. However, XRD does not serve as the conclusive tool to identify the 1T or 2H phase of this layered material. Furthermore, the variation in the lattice parameters points towards the possibility of mixed phase occupancy, which can be further identified using Raman spectroscopy studies.22
The crystallite size was found and the values were tabulated in Table 1. Furthermore, the interplanar spacing and peak shift with respect to the chromium doping percentage was calculated. Re-doped MoS2 exhibited shifts in the (002) peak with increasing doping concentration, suggesting changes in the interlayer spacing.23 A right shift (toward higher 2θ values) implies lattice contraction, often resulting from substitutional doping with smaller Cr ions, which was observed as the 5% Cr doped into MoS2. Further, a left shift of the (002) XRD peak toward lower 2θ values indicates lattice expansion, typically due to increased interlayer spacing from interstitial Cr doping or tensile strain. Cr doping in MoS2 can cause either shift depending on its oxidation state and position in the lattice. These shifts reflect structural distortions, influencing crystallinity and material performance. Understanding these changes is key to tailor MoS2 properties for catalysis and electronics.24,25
| Material | 2 theta (degree) | FWHM (degree) | Crystallite size (nm) | Peak shift (degree) | D spacing (Å) |
|---|---|---|---|---|---|
| MoS2 | 14.08 | 0.93 | 8.71 | 0 | 1.12 |
| MoS2–Cr 5% | 14.54 | 1.01 | 8.03 | 0.46 | 0.92 |
| MoS2–Cr 10% | 14.09 | 0.85 | 9.55 | 0.01 | 1.11 |
| MoS2–Cr 15% | 14.02 | 1.13 | 7.21 | −0.05 | 1.15 |
As the proportion of chromium doping increases, it results in an increment in interplanar spacing. Above 5% doping of Cr, there was a sharp reduction in the d spacing, and it steadily increased with 10% and 15% Cr doping. The layers of chromium are pulled together when the structure shrinks in the z direction, causing the response mentioned earlier. It is shown that the intensity of the (002) peak decreases and broadens as the Cr doping increases, indicating the decrease of crystallite size with higher doping.26 There is no indication of phase separation in the solid.
The morphological studies of pure and chromium doped MoS2 nanoparticles were performed using FE-SEM analysis, which showed the micro-flower structure of pure and doped MoS2, where large numbers of interwoven nm-sized flakes agglomerated to form a globular structure, as shown in Fig. 2. These flakes preserve the dimensionality of charge transport to be 2D and the layers grained in the form of a flower constitute inhomogeneities that trigger stronger charge relaxation with an applied magnetic field.27–29
 | ||
| Fig. 2 SEM images of (a) pure MoS2 nanoparticles and those doped with (b) 5% Cr, (c) 10% Cr, and (d) 15% Cr. | ||
Fig. 3 shows the EDX spectra of MoS2 where the S to Mo atomic ratio is about 1.58, indicating sulfur vacancies in the samples. This can increase the possibility of charge transfer in MoS2 nanoflakes.
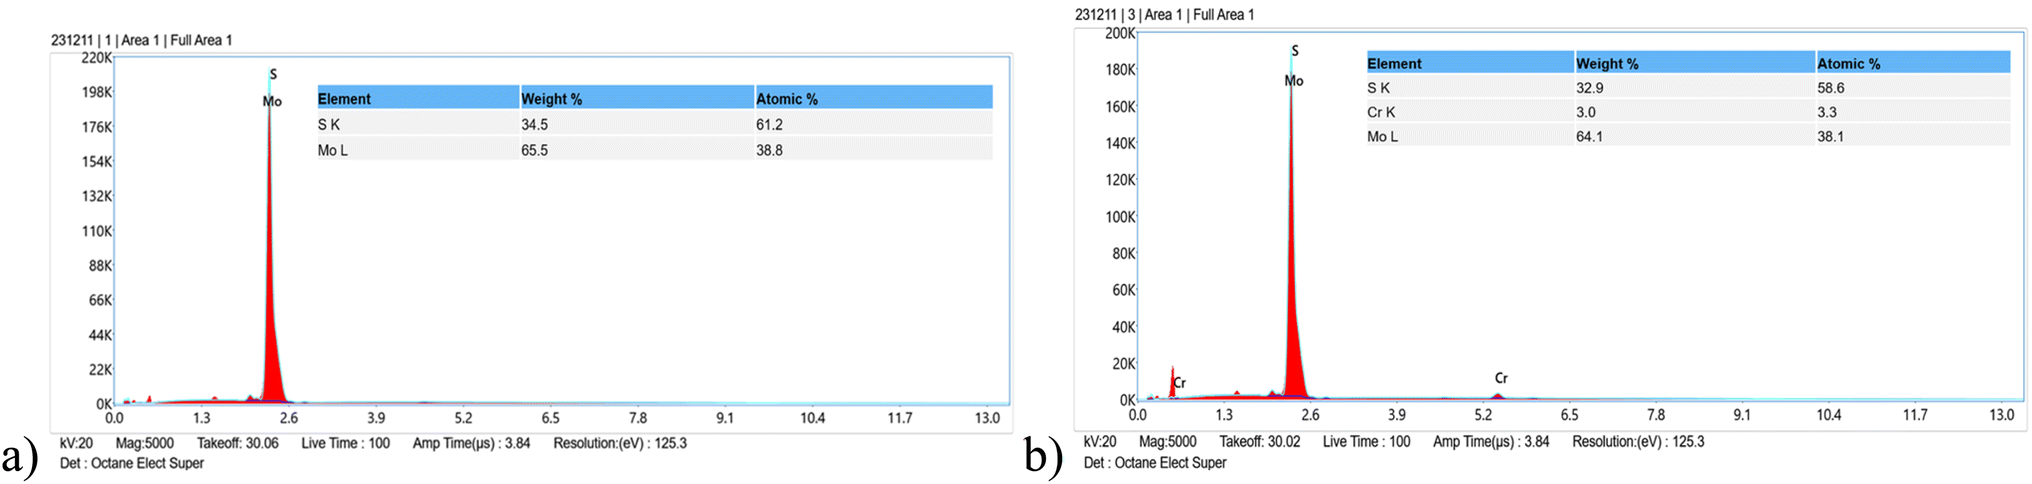 | ||
| Fig. 3 EDAX spectra of (a) pure MoS2 nanoparticles and (b) 15% Cr doped MoS2 nanoparticles indicating the percentage of Mo, Cr and S elements present in the samples. | ||
Here, we employed UV-Vis reflectance spectroscopy to analyze the indirect band gaps of MoS2 and its chromium-doped systems. The doping percentage is expected to alter the band gap value. From the diffuse reflectance (DR) spectrum, the absorption coefficient (α) can be directly determined. The analytic work developed by P. Kubelka and F. Munk (K–M)30 allows us to calculate the band edge. The absorption spectrum can be produced by combining Tauc's31 and K–M functions.32–34 The Tauc plot of MoS2 nanoparticles is shown in Fig. 4.
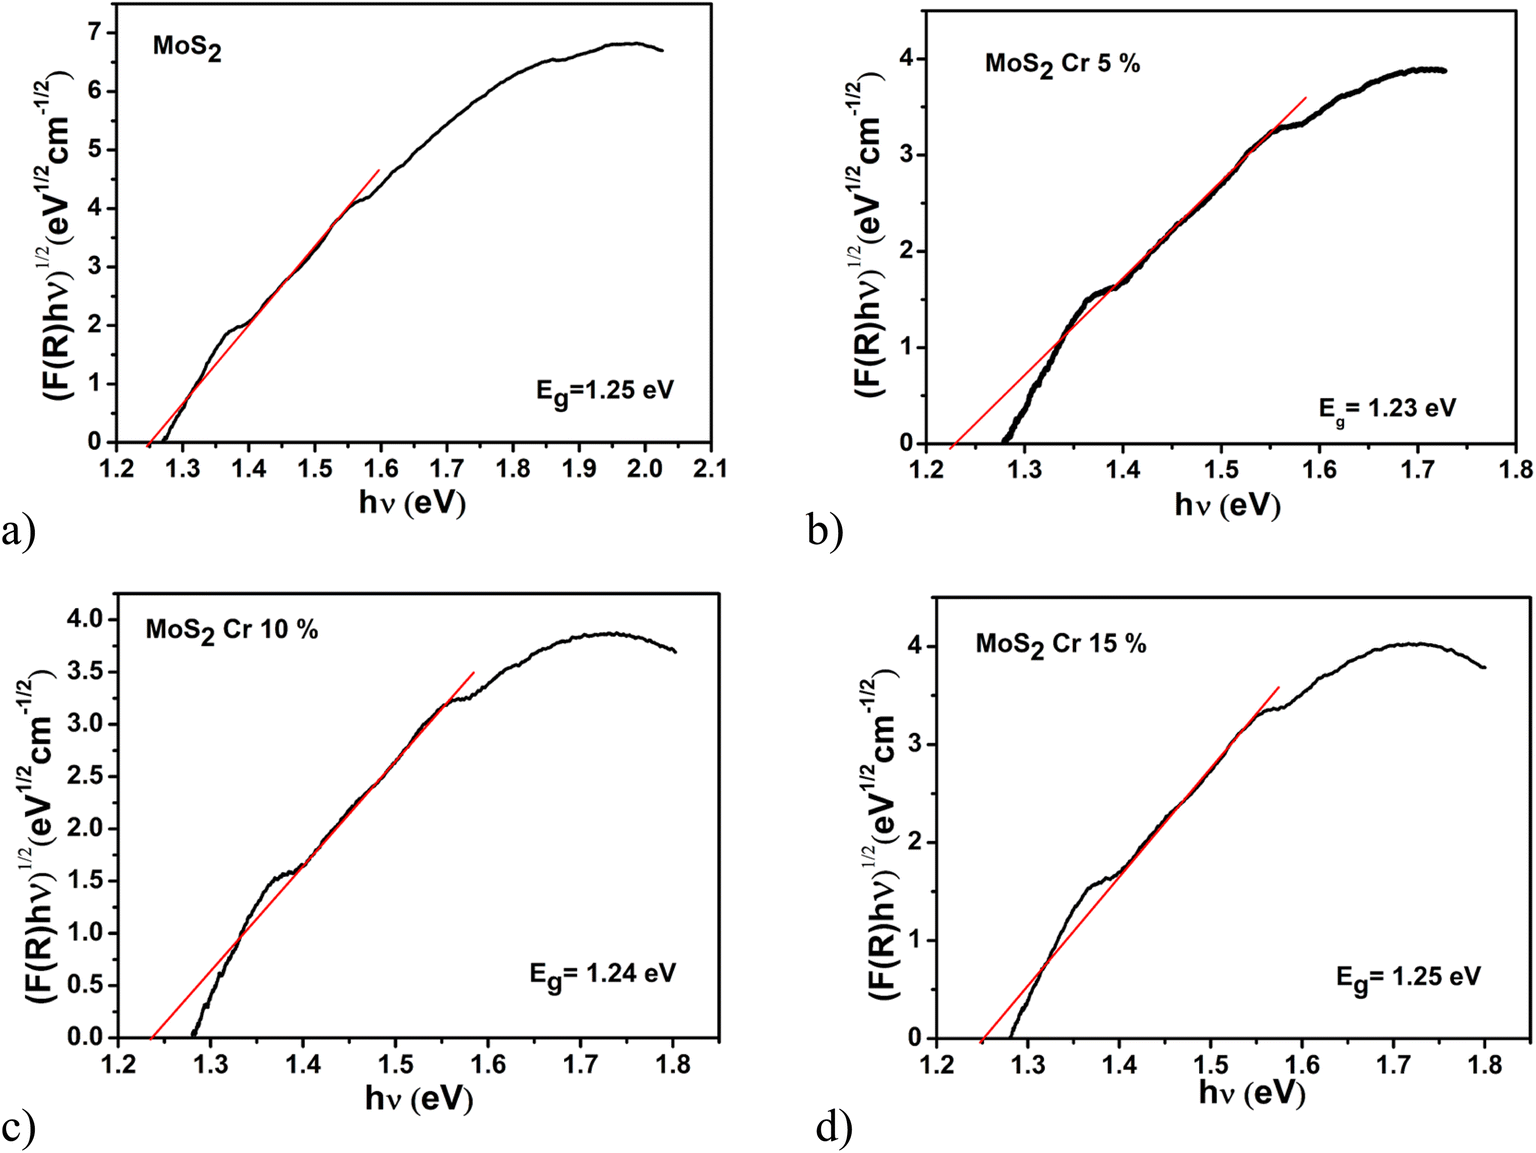 | ||
| Fig. 4 Indirect bandgap of (a) pure MoS2 nanoparticles and those doped with (b) 5% Cr, (c) 10% Cr, and (d) 15% Cr. | ||
MoS2 was found to have an indirect bandgap of 1.25 eV which is in agreement with the literature.32 The results are listed in Table 2. Here, it is important to note that the bandgap matches with the bulk value since the flakes coagulate to form a globular structure from a single base extending the particle size to a few micrometers during the hydrothermal process. As we doped Cr onto it, the band gap reduces to 1.23 eV for 5% chromium, showing a minor decrease resetting to its original value above 10%. Here, a 0.05 substitution in stoichiometry leads to compression of the lattice by 17.85% that is expected to result in an increase of electron density of at least one order of magnitude which can be confirmed using DC resistivity measurements. Furthermore, this change in electron density is expected to produce a change in polar relaxation time, which can be confirmed using AC transport studies. As the doping increased from 5% to 10% and 10% to 15%, there was no significant change observed in the bandgap. This was corroborated by the X-ray diffraction studies where no significant change was observed in lattice volume with higher doping.
| Material | Indirect bandgap eV |
|---|---|
| MoS2 | 1.25 |
| MoS2–Cr 5% | 1.23 |
| MoS2–Cr 10% | 1.24 |
| MoS2–Cr 15% | 1.25 |
Fig. 5 depicts the Raman spectra of pure and Cr doped MoS2 at room temperature with multiple peaks deconvoluted and fitted to Lorentzian responses using the Fityk open source tool.35 Raman spectra can be utilized to identify the existence of various phases in 2D materials. Here, the Raman spectra are indexed with various characteristic vibrational modes, which confirms the 2H–MoS2 phase with 1T structure incorporated with the parent matrix.36 The spectra show characteristic peaks at 373, 409, and 451 cm−1 ascribed as E2g1, A1g and the acoustic phonon mode with longitudinal vibration (A2u), respectively. Here, the A1g mode corresponds to the out of plane movement of the sulfur atoms that are in the top and bottom while Mo is stationary.37 Another distinct peak at 373 cm−1 represents the E2g1 mode where molybdenum and sulfur are moving in plane in opposite directions.38,39 In addition to these, there are weak vibrational modes at 149, 237, 282, 336, and 409 cm−1 (J1, J2, E1g, J3 and A1g, respectively) in the spectra, confirming the presence of the 1T-MoS2 phase.40 The presence of the E1g band represents the octahedral coordination of Mo in 1T-MoS2. Here, the E1g mode is prominent in response and confirms the 1T phase. Since A1g is common in both the 2H and 1T phase, the formation is usually confirmed by the appearance of J1, J2, J3 and E1g modes.41 We observed a blue shift in the spectra upon doping of chromium into MoS2. Broadening and mild splitting of the A1g mode indicates the presence of chromium inside the lattice with a phase pressure.42
 | ||
| Fig. 5 Raman spectra of (a) MoS2 and MoS2 nanoparticles doped with (b) 5% Cr, (c) 10% Cr, and (d) 15% Cr. | ||
Pure MoS2 synthesized by the hydrothermal method with a globular morphological form was found to preserve the 2D flake-like arrangement with a significant amount of grain boundary volume. This makes the material have 1T and 2H mixed phases. As evident from Fig. 4, the presence of J1, J2, J3, E1g and E2g1 peaks along with A1g and A2u phonon modes indicates the orientational inhomogeneity in the solid. The E1g mode was the most prominent vibrational peak at 282 cm−1 for MoS2 indicating the dominance of edge plain scattering in the particles.43 The J1 mode vanishes with a mild splitting in J3 due to emergence of the E2g1 mode. Here, J2 is the most prominent peak with a mild split corresponding to the dominant 1T phase which can induce metallicity.44,45 The emergence of this peak configuration could be due to an induced lattice strain as seen in the XRD studies. When the doping percentage increases to 10% the E1g mode becomes prominent, which is essentially forbidden under backscattering geometry46 appearing due to the edges of the sheets indicating the reduction in the strain (not significantly). This is corroborated by the XRD studies showing similarity to nascent MoS2. However, this may not be the proof of phase separation. When MoS2 was substitutionally doped by 15% Cr, the pure MoS2 configuration is retained with a prominent E1g mode at 282 cm−1; however, a new peak emerges at 219 cm−1 convoluted with one more peak at 201 cm−1 due to a strong distortion in the J2 mode indicating the presence of a distorted 1T| phase.47
Magnetization of pure and Cr doped MoS2 nanoparticles is studied from 10 K to 300 K. The hysteresis loop for the same are shown at 10 K and 300 K in Fig. 5. It can be seen that pure and 10% chromium doped MoS2 show very weak ferromagnetism, whereas the saturation magnetization is higher for the 5 and 15% chromium doped cases. Cr doping increased the variable ferromagnetic behavior in MoS2 with an increase in coercivity from 140 G (MoS2) to a maximum of 490 G with doping (MoS2–Cr 5%). Pure and 10% Cr doped MoS2 showed the same coercivity whereas 5 and 15% Cr-doped MoS2 nanoparticles had higher coercivity (490 G and 300 G, respectively) at 10 K (Fig. 6).
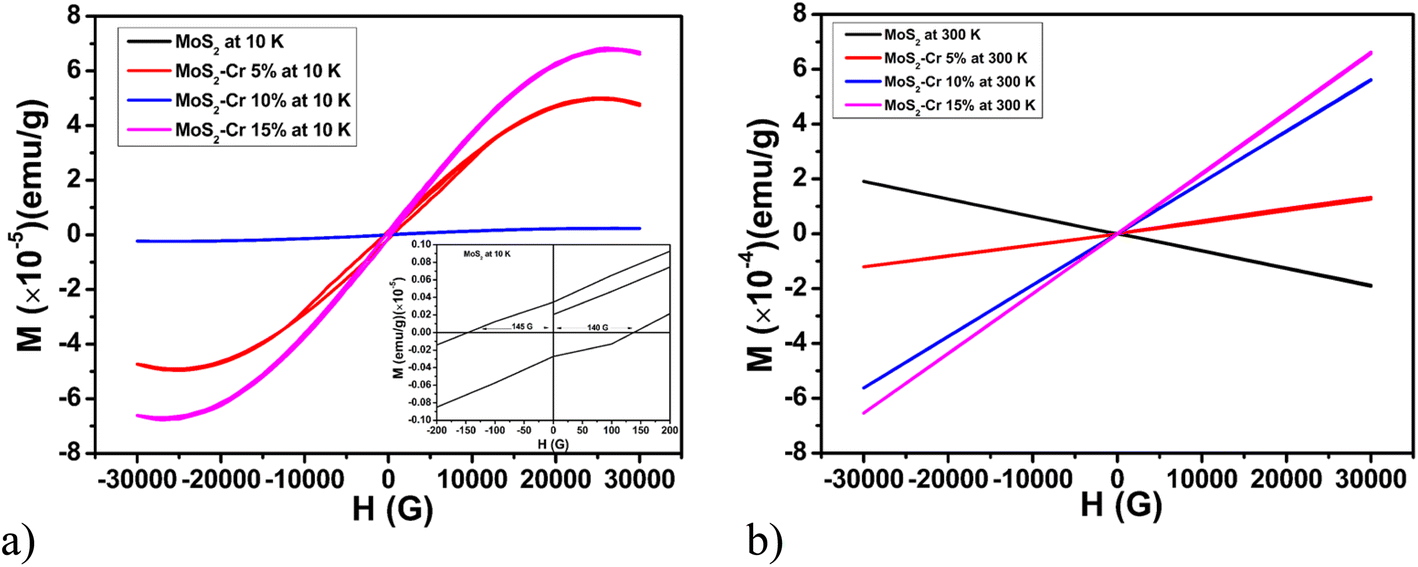 | ||
| Fig. 6 Hysteresis loop for MoS2 and MoS2 nanoparticles doped with 5%, 10% and 15% Cr at (a) 10 K and (b) 300 K. | ||
The observed ferromagnetic nature changes as the temperature varies from 10 to 300 K. Undoped MoS2 shows a ferro to diamagnetic transition as the temperature changes from 10 to 300 K, whereas all the chromium doped samples show room temperature paramagnetism. Previous literature shows that a stable and correlated ferromagnetic state could be obtained in 1T/2H phase by doping with Cr, and the coercivity decreases as the temperature increases.48 Also Hwang et al. shows that 2H MoS2 nanosheets exhibit the typical diamagnetism at room temperature and the paramagnetism increases when the proportion of the 1T phase increases.49 It is discovered that a temperature-dependent diamagnetic background and zigzag edges with associated magnetism at grain boundaries may be the source of MoS2's magnetization. It is clear that the diamagnetic character dominates the magnetic response, but the ferromagnetic loop is superimposed on the diamagnetic background. It is anticipated that the net magnetic moment will decrease and the ferromagnetic reaction will become less pronounced in the bulk limit as grain size (or ribbon width) increases,50 which could be the reason for our observation of diamagnetism at room temperature. In the hydrothermally synthesized MoS2, the nanosheets coagulate to form a globular structure that contributes to large edge states with diamagnetic contribution masking the internal ferromagnetism.
When doped with chromium, the 1T phase is pronounced and the total metallic content increases. The addition of chromium substituting the surfer site produces a d-band asymmetry above the Fermi level, building spin polarization in transport electrons.51 This is expected to produce ferromagnetism as observed at low temperature in our samples. At higher temperature, the edge state contributed diamagnetism opposes the long range ferroic order inducing paramagnetism. However, the paramagnetic content increases with doping leading to higher grades of magnetization.
Ferromagnetic ordering and temperature dependance of magnetization of pure and Cr doped MoS2 were characterized by M versus T measurements under ZFC and FC conditions at 100 G as shown in Fig. 7. Typically, ferromagnetic materials show a visible FC-ZFC bifurcation due to long range spin order, preferably at lower temperatures. In this study, the separation between FC and ZFC is minimal to the limit of the measurement in all the cases, indicating the presence of short-range spin ordering. In the case of pure MoS2, the magnetic moment decreases with temperature with a drastic slope change at 17 K, which may correspond to loss of the short-range order in low dimensional TMDC's52 or the antiferromagnetic coupling between the defect spins.53 As 5% Cr is doped into MoS2, there is a significant opening which is due to the localized spin order and there is a slope change between 25–200 K, which infers the possibility of melting of short-range spin order in the system. The dMZFC/dT curve shows a kink at 57 K and ending at 80 K, depicting a local ordering in this range of temperature peaking at 57 K and melting at 80 K. Such transitions are observed when there is spin frustration competing with the tendency of ordering. This facilitates fluctuation driven electron dynamics in such 2D materials. Here, the hysteresis for 5% Cr doped MoS2 indicates ferromagnetic ordering which is expected to be masked by the demagnetizing field. These competing orders are responsible for the twisted opening. It is important to note that there is a mild uptrend in the M–T in zero field configuration after this transition which supports this claim. The 10% and 15% Cr-doped MoS2 shows a similar trend to that of pure MoS2 with transition temperatures of 51 K and 44 K, respectively. Overall, this indicates that the addition of Cr produces spin frustration or spin instability in these solids.
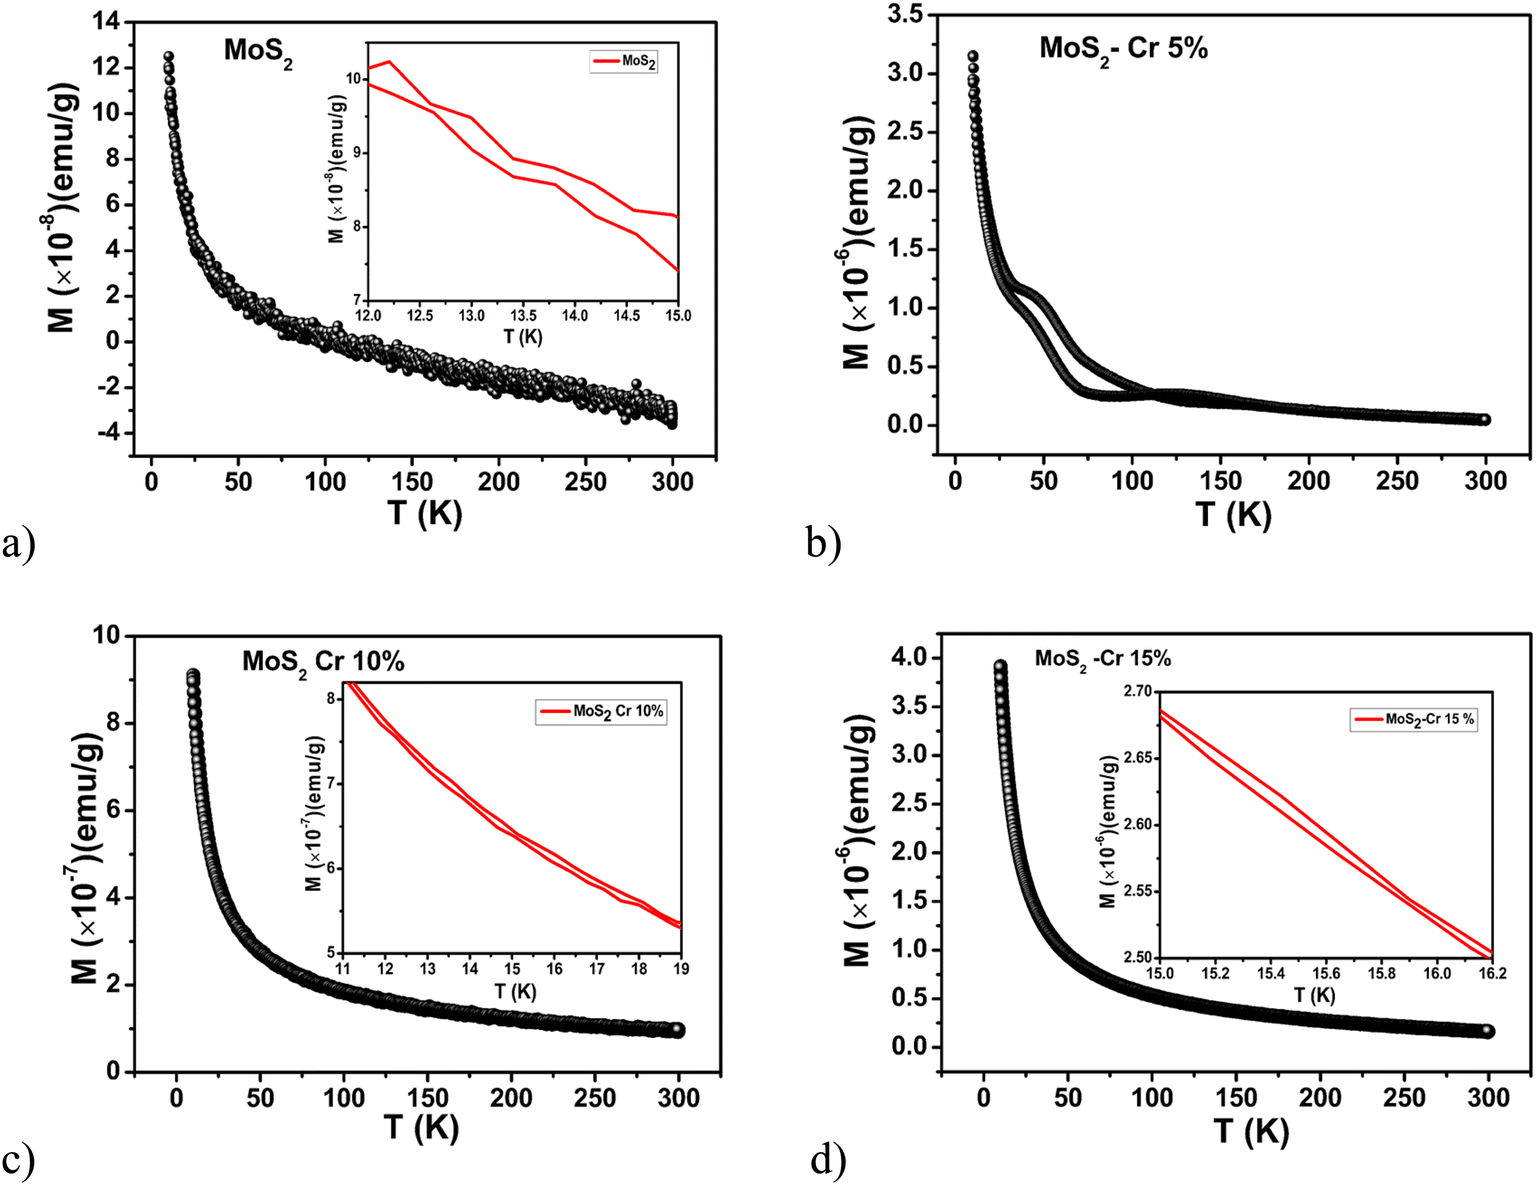 | ||
| Fig. 7 M–T for (a) pure MoS2 nanoparticles and those doped with (b) 5% Cr, (c) 10% Cr, and (d) 15% Cr. | ||
Since the magnetization response with respect to temperature has indicated the existence of competing order, it is important to investigate possible magnetoelectric response and resistance dispersion with respect to the applied magnetic field, which is a feature of inhomogeneity driven non ferromagnetic solids as extensively discussed by Parish et al. and S Singh.15,16,27,28 Typically, dispersion in response function with respect to the magnetic field is used to identify the competing orders or the spin fluctuation54 set in solids which are Fermi liquids55 or heavy fermions.
With the help of an impedance analyzer, the real and imaginary components of complex impedance (Rp and X) were measured as a function of frequency for various applied magnetic fields. Fig. 8 shows the variation of resistance with respect to frequency in the presence of magnetic fields for MoS2 and 5, 10 and 15% chromium-doped MoS2 nanoparticles at room temperature which shows a capacitive coupling where the impedance decreases with respect to frequency, with a distinct grain interior relaxation at around 100 kHz.56 In Fig. 8a at a zero magnetic field, the impedance response behaves capacitively with single relaxation, while the magnitude of resistance increases and remains in a few kilo ohm range by applying a magnetic field, resulting in significant spin accumulation.57 As chromium is doped into pure MoS2, the total resistance and capacitiveness decreases (Fig. 8b). The resistance decreases with an applied magnetic field, depicting a negative MR and change in the carrier mobility. Further, it is seen that the higher magnetic field response crosses the zero field at higher frequencies indicating the change of sign of MR. At 10% doping, the resistance further decreases. As the magnetic field rises, there is an increase in resistance, indicating a positive MR that could be due to the granular nature of the solid. Further, the resistance at different magnetic fields remains parallel at higher frequencies, indicating stronger space charge contribution at grain boundaries.56 In the case of 15% and 10% doping, resistance increases with respect to the magnetic field. At higher frequencies, the resistance response does not merge at different magnetic fields, indicating intergranular space charge contribution.
 | ||
| Fig. 8 Variation of resistance with respect to frequency in the presence of a magnetic field for (a) MoS2 and MoS2 nanoparticles doped with (b) 5% Cr, (c) 10% Cr, and (d) 15% Cr. | ||
The responses were fit using a modified Havriliak–Negami equation shown below and the relaxation time was determined.

The choice of the response function was to account for non-Debye-like dipolar responses associated with depression and loss, which is one of the general models for polar solids. In granular polar solids, the grain interior transport is observed in a few MHz region, the intra grain transport is seen in kHz and the space charge blocking is shown in the mHz range. Further, it is interesting to note that solids which are semiconducting or have impurities show strong dispersion in impedance with respect to the applied magnetic field.58,59
Pure MoS2 shows its relaxation at 105 Hz at 0 G with the asymmetry parameter α of 2 and broadening factor β of 0.25. Here, the asymmetry parameter is greater than one which indicates incoherent charge relaxation. The broadening parameter is less than one, indicating that the impedance response is depressive with internal loss. When the magnetic field increases, the relaxation time increases without changes in α and β parameters. Hence, there is no change in the mode of transport but the strength of charge accumulation (also depicted through change of AC conductivity) changes with the applied magnetic field. Since the accumulation or deaccumulation is driven by an applied magnetic field, the charge builds with spin polarization. Hence, the change in accumulation is spin dependent or it is due to spin accumulation. With different doping concentrations, the α and β values do not change, indicating no variation in the transport process; however, the basic features of incoherent lossy transport continued.
The relaxation characteristics change when pure MoS2 is doped with Cr. The obtained relaxation time from HN fit for various magnetic fields are depicted in Fig. 9.
 | ||
| Fig. 9 Variation in relaxation time with respect to magnetic field at room temperature for (a) MoS2 and MoS2 nanoparticles doped with (b) 5%, 10% and 15% Cr. | ||
The relaxation time for pure MoS2 increases with respect to the applied magnetic field following a power law. The increase in the relaxation time is due to the slower hopping of the charge cluster expanding its radius owing to spin accumulation. As the doping concentration increases the electron density changes in the solid which results in an increase of relaxation time. The relaxation time is in the order of milliseconds for all three doping concentrations.
The AC magnetoresistance was examined in relation to the applied magnetic field variation and the influence of chromium doping was studied at room temperature for various applied frequencies (shown in Fig. 10). For pure MoS2, a significant positive MR of the order of 110% was seen in the lower frequency range (100 Hz) due to dipole-like interactions.50 As the frequency increases, the magnitude of MR rapidly decreases due to the increase in macrospin interactions effectively reducing the scattering. As we doped MoS2 with 5% chromium, MR turned negative at lower frequencies and shifted from negative to positive above 1 MHz in the high magnetic field region. In this case, the maximum observed negative MR was of the order of 8% at 100 Hz and a 2000 G magnetic field. After applying a 1000 G magnetic field, it was noticed that the MR sign changed from negative to positive when the amount of chromium doping increased from 5 to 10%. In this region, the magnitude of MR was maximum (about −12%) for the sample at 100 Hz and 300 G. The intercalation of chromium results in a more dipolar kind of interaction than an exchange type; hence, the magnitude of MR was greater at 10% Cr doping compared with the 5% Cr doping case.
 | ||
| Fig. 10 Variation of magnetoresistance with respect to applied magnetic field at room temperature for (a) MoS2 and MoS2 nanoparticles doped with (b) 5% Cr, (c) 10% Cr and (d) 15% Cr. | ||
The switching in the sign of MR from positive to negative becomes noticeable as the doping percentage increases to 15%. The highest positive MR of 60% was seen at 2000 G at 100 Hz frequency. This higher MR is due to the prominent intergranular interaction in the low frequency region. Here, the material changes from being a conductor to an insulator when an external magnetic field is used, and this behaviour is more obvious in a material with a high dopant concentration on the verge of phase separation.60 The dipolar content increases with rising frequency resulting in more positive MR, and the change of sign indicates possible ferromagnetic resonance at 1250 G.
To understand the spin transport mechanism and other localization effects, the study of magnetotransport with respect to temperature is essential. Further, to understand the generalized spin accumulation model, the temperature dependent AC MR needs to be studied.61 It is understood that magnetization orientation and the spin-transport characteristics are impacted by temperature. The spin dependent resistivity at any finite temperature can be used to account for its influence on the transport parameters. Through the calculation of temperature-dependent spin-transport parameters, the thermal impacts on spin accumulation, spin current, and spin torque can be subsequently calculated.62
Here, the temperature dependence of resistance was investigated using two probe methods with the help of a closed cycle cryogenic refrigerator. The variation of resistance with respect to temperature at a frequency of 100 Hz was noted in the temperature range of 9 to 290 K, shown in Fig. 11, which is close to the DC response and region without noise. The system under investigation was granular with strong interface capacitance and the low temperature resistance was seen to be high. At the lowest temperature, the resistance was 370 MΩ, increasing up to 400 MΩ at 20 K due to the cold pressing effects. This measurement of large resistance was possible due to the use of AC techniques restricted to low frequency. Further, the resistance decreases as the temperature increases, indicating the semiconducting behavior of pure MoS2. All samples show typical semiconducting transport behavior. That is, the magnitude of resistance decreases as the temperature increases, as reported in the literature.55,56,63,64 As the Cr doping increases, the intergranular scattering increases, resulting in high effective resistance. In this capacitive coupling region (that is, at around 100 K), this scattering becomes prominent. For all the doping concentrations, the resistance increases systematically from 20 K to 50 K, representing Bloch behavior which can be related to the transitions observed in magnetization. The peak positions coincide with this melting of local order as in any solid with spin fluctuations65 or short-range order.66
 | ||
| Fig. 11 Variation of resistance with respect to temperature at a frequency of 100 Hz. | ||
Arrhenius analysis of the resistance-temperature response indicated the activation energy change in MoS2 at 40 K, MoS2–Cr 5% at 50 K, MoS2–Cr 10% at 50 K and MoS2–Cr 15% at 60 K (as shown in Fig. 12), which corresponds to the loss of local short-range order with the average activation energy less than a mV. Furthermore, there is change in activation energy at around 130 K for MoS2, 120 K for MoS2–Cr 5%, 160 K for MoS2–Cr 10% and 140 K for MoS2–Cr 15% with the average activation energy of a few meV. The results were tabulated in Table 3. To understand the nature of the change in the activation energy at higher temperatures, we studied the charge cluster relaxation time in detail.
 | ||
| Fig. 12 Variation resistivity with respect to temperature in the Arrhenius representation. Inset shows the linear fit in three different regions with distinct activation. | ||
| Material | 9–40 K (meV) | 50–130 K (meV) | 140–290 K (meV) |
|---|---|---|---|
| MoS2 | −0.20 | 14.87 | 31.4 |
| MoS2–Cr 5% | −0.033 | −2.56 | 63 |
| MoS2–Cr 10% | 0.339 | −4.53|29 | 109 |
| MoS2–Cr 15% | −4.87 | 30.96|–10.93 | 50.42 |
The individual relaxations analyzed with the protocol stated earlier are represented in Fig. 13. We can see that the resistance is higher at lower temperature in all the four cases and it decreases as the temperature increases. The relaxation time for various magnetic fields and temperatures is depicted in Fig. 14. Pure MoS2 is slow relaxing compared with the chromium doped MoS2.
 | ||
| Fig. 13 Variation of resistance with respect to frequency at various temperatures and an applied magnetic field of 2000 G for (a) MoS2 and MoS2 nanoparticles doped with (b) 5%, (c) 10% and (d) 15% Cr. | ||
 | ||
| Fig. 14 Relaxation time with respect to temperature and different magnetic fields for (a) MoS2 and MoS2 nanoparticles doped with (b) 5% Cr, (c) 10% Cr, and (d) 15% Cr. | ||
For pure MoS2, there is a down trend in relaxation time with a significant change of slope at 50 K. As the temperature increases, the relaxation time increases producing a broad peak from 100 K to 210 K. The same trend is seen at higher magnetic fields of 2000 G as well. After 210 K, there is a down trend in the relaxation time. This change in relaxation time with temperature is a signature of the reduction in the charge cluster radius or polaronic radius with temperature. It is observed that this charge cluster radius increases between 100 K to 250 K, which confirms localization where there is accumulation of charges which are feebly detected in the DC transport. Here, it is interesting to realize that the activation energy increases by an order of magnitude. In the case of MoS2, the activation energy has changed from 15 meV to 31 meV in the range of localization seen through the relaxation time change. The localization and delocalization process in the above data is characterized by an exponential reduction in relaxation time below 100 K and above 210 K. As the pure MoS2 was subjected to a magnetic field, a minimal effect on relaxation time was seen, indicating no significant change in mobility in this range of magnetic field. Furthermore this confirmed that the localization is weaker.
Schwartz et al. showed that the existence of disorder causes the change in mechanism of transport from ballistic to diffusive and then to localization as a function of defect density.67 For pure MoS2, the localization region shifts from 120 to 160 K with doping. In the case of MoS2–Cr 5%, the width of the peak is from 150 to 240 K; for MoS2–Cr 10%, it is from 170 to 260 K; and for MoS2–Cr 15%, it is from 210 to 260 K.
There is no explicit signature of change of resistance in these solids. The relaxation time remains in the milliseconds range in the doped cases. Also, the magnetic field has little influence across the temperature of study and doping. The localization region decreases and becomes sharper according to the increment in the doping percentage.
To understand the nature of ordering, which could be orbital in nature, AC magnetoresistance was studied with respect to magnetic field for various temperatures as depicted in Fig. 15. The plots are for pure MoS2 (Fig. 15a), and MoS2 doped with 5% Cr (Fig. 15b), 10% Cr (Fig. 15c) and 15% Cr (Fig. 15d). They are chosen so that the exemplary plots are (1) near the blocking temperature (2) in the localization region and (3) during the delocalization process. The frequency of choice is the one where the sample couples to the electromagnetic radiation inductively as the macrospins are expected to come closer and majorly interacting due to exchange-like interactions. If there are defect barriers, they are expected to induce dipolar coupling between the spins. This will allow us to phenomenologically estimate the increase or decrease of charge cloud radius and the spin cluster scattering strength. Further, this will allow us to predict the nature of macrospin interactions.
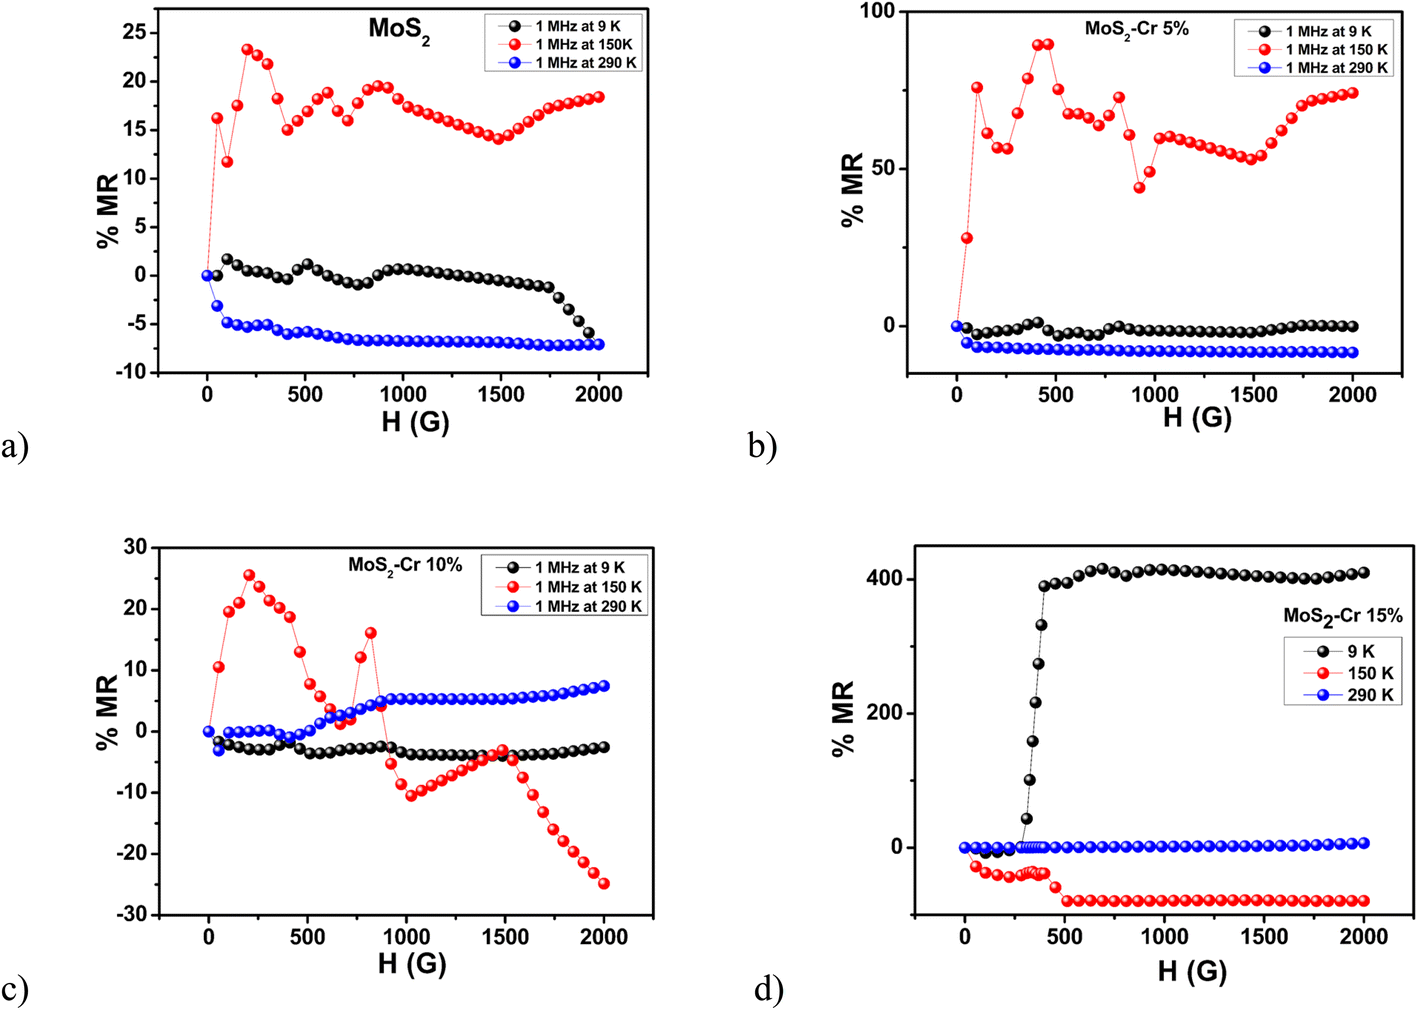 | ||
| Fig. 15 Variation of AC magnetoresistance with respect to an applied magnetic field at a frequency of 1 MHz for (a) MoS2 and MoS2 nanoparticles doped with (b) 5% Cr, (c) 10% Cr and (d) 15% Cr. | ||
At low temperature, i.e., at 9 K, MR was negative for MoS2 with a magnitude of 7%. As the temperature increases to 150 K, we enter the localization zone where the charge and the spin gets localized due to the nature of defects in the solid.18,68 At 290 K, the MR was negative and was of the order of 10%. In the delocalization region, the interaction turns dipole-like as the charge cluster radius increases, with a rise in the relaxation time. With increasing temperature, the cluster melts, going to the macrospin overlap zone (inductive) and producing a negative MR.
As 5% Cr was doped into MoS2, it switched its sign from negative to positive, with a magnitude of 2%. At 150 K, which is in onset of localization, it produces MR of the order of 80% at 500 G, which indicates that the spin dependent scattering is more prominent for 5% doping. At room temperature, the MR is negative beyond the melting of localization similar to the pure MoS2 case. In the 10% Cr doped case, the MR was of the order of 3% at 9 K. In the localization zone (150 K), the sign of MR switched from positive to negative with a maximum positive MR in the order of 25% at 250 G and the maximum negative MR in the order of 26% at 2000 G. As it enters the delocalization region, the maximum MR of 10% was observed at 2000 G. Here, the localization zone shifts beyond 150 K as the Cr doping percentage increases, resulting in exchange of the initial dipole-like interaction at lower magnetic fields as the magnetic field increases. Further, the space charge interaction is prominent at room temperature, and the MR becomes purely positive as evidenced in the resistance dispersion curve (Fig. 15a).
In the case of 15% Cr doped into MoS2, a large MR value of around 400% was obtained at 9 K. At 150 K, the sign of MR was completely negative of the order of 100%. At the delocalization region (290 K), MR was positive with a magnitude of 10%. At low temperature, Cr had a phase separation tendency with large intrinsic resistance; therefore, it produced significant spin dependent scattering corroborated by the MH response at that temperature.
Conclusion
Hydrothermally synthesized Cr doped MoS2 showed a globular nature with flake-like surface arrangement. This structure is expected to couple chromium spins with sulfur defects, producing a ferromagnetic order at low temperature, confirmed by magnetization studies. The spin order was lost in all the samples from 17 to 51 K as indicated by magnetization studies, which was corroborated by a peak in resistivity. Here, the transport was identified as Arrhenius for pure and doped cases. The change of charge cluster radius which is not well picked in near DC transport studies was observed using the change of relaxation time, supporting the possible weak localization corresponding to the defect driven magnetoelectric effect. The increase in doping percentage leads to a reduced localization region with respect to temperature. This study establishes inhomogeneity driven weak localization beyond explicit spin order in granular MoS2.Data availability
The authors confirm that the data supporting the findings of this study are available within the article.Conflicts of interest
There are no conflicts to declare.References
- C. Ataca, H. Sahin, E. Akturk and S. Ciraci, Mechanical and electronic properties of MoS2 nanoribbons and their defects, J. Phys. Chem. C., 2011, 115(10), 3934–3941 CrossRef CAS.
- D. Gao, S. Shi, K. Tao, B. Xia and D. Xue, Tunable ferromagnetic ordering in MoS 2 nanosheets with fluorine adsorption, Nanoscale, 2015, 7(9), 4211–4216 RSC.
- S. Susarla, A. Kutana, J. A. Hachtel, V. Kochat, A. Apte, R. Vajtai, J. C. Idrobo, B. I. Yakobson, C. S. Tiwary and P. M. Ajayan, Quaternary 2D transition metal dichalcogenides (tmds) with tunable bandgap, Adv. Mater., 2017, 29(35), 1702457 CrossRef PubMed.
- Y. C. Cheng, Z. Y. Zhu, W. B. Mi, Z. B. Guo and U. Schwingenschlogl, Prediction of two-dimensional diluted magnetic semiconductors: Doped monolayer MoS2 systems, Phys. Rev. B:Condens. Matter Mater. Phys., 2013, 87(10), 100401 CrossRef.
- J. Xiao, X. Qi and L. Wang, et al., Anion regulating endows core@shell structured hollow carbon spheres@MoSxSe2−x with tunable and boosted microwave absorption performance, Nano Res., 2023, 16, 5756–5766, DOI:10.1007/s12274-023-5433-4.
- J. Xiao, B. Zhan, X. Qi, J. Ding, Y. Qu, X. Gong and R. Che, Metal valence state modulation strategy to design core@ shell hollow carbon microspheres@ MoSe2/MoOx multicomponent composites for anti-corrosion and microwave absorption, Small, 2024, 2311312 Search PubMed.
- M. Zhao, Z. Zhang, C. Tan, W. Wang, L. Yang and Z. Wang, MoS2-Based NH3 Sensor for In Situ Helicobacter pylori Detection, ACS Appl. Mater. Interfaces, 2024, 16(50), 69798–69806 CrossRef CAS PubMed.
- R. Rahman, D. Samanta, A. Pathak and T. K. Nath, Tuning of structural and optical properties with enhanced catalytic activity in chemically synthesized Co-doped MoS2 nanosheets, RSC Adv., 2021, 11(3), 1303–1319 RSC.
- X. Zhao, P. Chen, C. Xia, T. Wang and X. Dai, Electronic and magnetic properties of n-type and p-doped MoS 2 monolayers, RSC Adv., 2016, 6(20), 16772–16778 RSC.
- A. R. Sahoo and S. Chandra, An investigation on electronic and magnetic properties of Cr substituted MoS2 monolayer and multilayers—hybrid functional calculations, Sadhana, 2024, 49(2), 103 CrossRef CAS.
- W. Brzezicki, A. M. Oles and M. Cuoco, Spin-orbital order modified by orbital dilution in transition-metal oxides: From spin defects to frustrated spins polarizing host orbitals, Phys. Rev. X, 2015, 5(1), 011037 Search PubMed.
- H. Qiu, T. Xu, Z. Wang, W. Ren, H. Nan, Z. Ni and X. Wang, Hopping transport through defect-induced localized states in molybdenum disulphide, Nat. Commun., 2013, 4(1), 2642 CrossRef PubMed.
- E. J. Santos, Carrier-mediated magnetoelectric coupling in functionalized graphene, ACS Nano, 2013, 7(11), 9927–9932 CrossRef CAS PubMed.
- X. Chen and W. Mi, Mechanically tunable magnetic and electronic transport properties of flexible magnetic films and their heterostructures for spintronics, J. Mater. Chem. C, 2021, 9(30), 9400–9430 RSC.
- S. Singh, K. S. Kumar, Y. Bitla, B. Kori, B. Hiremath, M. Rampur and R. S. Joshi, Large low-magnetic-field magnetocapacitance effect and spin accumulation in graphene oxide, IEEE Trans. Magn., 2021, 58(2), 1–5 Search PubMed.
- A. K. Swetha, T. Dash, A. K. Maharana, K. P. Shinde, J. S. Park, Y. Jo and R. S. Joshi, Change of orbital ordering in Fe3O4 probed through low frequency-low magnetic field magnetoimpedance effect mediated by magnetic inhomogeneity, J. Magn. Magn. Mater., 2023, 587, 171235 CrossRef CAS.
- N. Sethulakshmi, A. Mishra, P. M. Ajayan, Y. Kawazoe, A. K. Roy, A. K. Singh and C. S. Tiwary, Magnetism in two-dimensional materials beyond graphene, Mater. Today, 2019, 27, 107–122 CrossRef CAS.
- S. Maekawa, T. Kikkawa, H. Chudo, J. I. Ieda and E. Saitoh, Spin and spin current—From fundamentals to recent progress, J. Appl. Phys., 2023, 133, 020902 CrossRef CAS.
- L. Chacko, A. K. Swetha, R. Anjana, M. K. Jayaraj and P. M. Aneesh, Wasp-waisted magnetism in hydrothermally grown MoS2 nanoflakes, Mater. Res. Express, 2016, 3(11), 116102 CrossRef.
- X. Zhou, B. Xu, Z. Lin, S. Dong and Ma Lin, Hydrothermal synthesis of flower-like MoS2 nanospheres for electrochemical supercapacitors, J. Nanosci. Nanotechnol., 2014, 14(9), 7250–7254 CrossRef CAS PubMed.
- R. Zhang, Y. Du, G. Han and X. Gao, Ferromagnetism and microwave absorption properties of cr-doped MoS2 nanosheets, J. Mater. Sci., 2019, 54, 552–559 CrossRef CAS.
- S. Shi, Z. Sun and Y. H. Hu, Synthesis, stabilization and applications of 2-dimensional 1T metallic MoS2, J. Mater. Chem. A, 2018, 6(47), 23932–23977 RSC.
- J. Aliaga, P. Vera, J. Araya, L. Ballesteros, J. Urzúa, M. Farías and E. Benavente, Electrochemical hydrogen evolution over hydrothermally synthesized Re-doped MoS2 flower-like microspheres, Molecules, 2019, 24(24), 4631 CrossRef CAS PubMed.
- R. Rahman, D. Samanta, A. Pathak and T. K. Nath, Tuning of structural and optical properties with enhanced catalytic activity in chemically synthesized Co-doped MoS2 nanosheets, RSC Adv., 2021, 11(3), 1303–1319 RSC.
- P. Kour, S. Kour, A. L. Sharma and K. Yadav, Synergistic improvement in electrochemical performance of Cr-doped MoS2/CuCo2S4 binary composite for hybrid supercapacitors, Fuel, 2024, 358, 130173 CrossRef CAS.
- D. J. Lewis, A. A. Tedstone, X. Li Zhong, E. A. Lewis, A. Rooney, N. Savjani, J. R. Brent, S. J. Haigh, M. Grace Burke and C. A. Muryn, et al., Thin films of molybdenum disulfide doped with chromium by aerosol-assisted chemical vapor deposition AACVD, Chem. Mater., 2015, 27(4), 1367–1374 CrossRef CAS.
- M. M. Parish and P. B. Littlewood, Classical magnetotransport of inhomogeneous conductors, Phys. Rev. B, 2005, 72(9), 094417 CrossRef.
- S. Singh, J. Poojari, V. Bhat, R. Mallikarjun, A. K. Swetha, K. P. S. Shinde, J. S. Park, Y. Jo, P. S. Anil Kumar and R. S. Joshi, Evaluation of low magnetic field magnetocapacitance effect in Ni–NiO inhomogeneous medium, Appl. Phys. A, 2023, 129(10), 681 CrossRef CAS.
- R. Sha, N. Vishnu and S. Badhulika, Bimetallic pt-pd nanostructures supported on MoS2 as an ultra-high performance electrocatalyst for methanol oxidation and nonenzymatic determination of hydrogen peroxide, Microchim. Acta, 2018, 185, 1–11 CrossRef CAS PubMed.
- P. R. Jubu, O. S. Obaseki, A. Nathan-Abutu, F. K. Yam, Y. Yusof and M. B. Ochang, Results in optics, 2022, 9, 100273 CrossRef.
- J. Tauc, Optical properties and electronic structure of amorphous Ge and S i, Mater. Res. Bull., 1968, 3(1), 37–46 CrossRef CAS.
- P. R. Jubu, O. S. Obaseki, A. Nathan-Abutu, F. K. Yam, Y. Yusof and M. B. Ochang, Dispensability of the conventional tauc's plot for accurate bandgap determination from uv-vis optical diffuse reflectance data, Results in Optics, 2022, 9, 100273 CrossRef.
- J. K. Cooper, S. Gul, F. M. Toma, Le Chen, Yi-S. Liu, J. Guo, J. W. Ager, J. Yano and I. D. Sharp, Indirect bandgap and optical properties of monoclinic bismuth vanadate, J. Phys. Chem. C., 2015, 119(6), 2969–2974 CrossRef CAS.
- H. Tang, B. Neupane, S. Neupane, S. Ruan, N. K. Nepal and A. Ruzsinszky, Tunable band gaps and optical absorption properties of bent MoS2 nanoribbons, Sci. Rep., 2022, 12(1), 3008 CrossRef CAS PubMed.
- M. Wojdyr, Fityk: a general-purpose peak fitting program, J. Appl. Crystallogr., 2010, 43(5), 1126–1128 CrossRef CAS.
- X. Tong, Y. Qi, J. Chen, N. Wang and Q. Xu, Supercritical CO2-assisted reverse-micelle-induced solution-phase fabrication of twodimensional metallic 1T–MoS 2 and 1T − WS 2, ChemNanoMat, 2017, 3(7), 466–471 CrossRef CAS.
- C. Lee, H. Yan, L. E. Brus, T. F. Heinz, J. Hone and S. Ryu, Anomalous lattice vibrations of single-and few-layer MoS2, ACS Nano, 2010, 4(5), 2695–2700 CrossRef CAS PubMed.
- D. J. Late, C. S. Rout, D. Chakravarty and S. Ratha, Emerging energy applications of two-dimensional layered materials, Can. Chem. Trans., 2015, 3, 118–157 Search PubMed.
- R. Rahman, S. Chaudhuri, D. Samanta, A. Pathak and T. K. Nath, Insights into the multifunctional applications of strategically Co doped MoS2 nanoflakes, Mater. Adv., 2022, 3(23), 8740–8759 RSC.
- D. Qi, F. Meng, C. R. English, M. Caban-Acevedo, M. J. Shearer, D. Liang, A. S. Daniel, R. J. Hamers and S. Jin, Efficient photoelectrochemical hydrogen generation using heterostructures of si and chemically exfoliated metallic MoS2, J. Am. Chem. Soc., 2014, 136(24), 8504–8507 CrossRef PubMed.
- P. Zhang, C. Gao, B. Xu, L. Qi, C. Jiang, M. Gao and D. Xue, Structural phase transition effect on resistive switching behavior of MoS2-polyvinylpyrrolidone nanocomposites films for flexible memory devices, Small, 2016, 12(15), 2077–2084 CrossRef CAS PubMed.
- M. R. Molas, K. Nogajewski, M. Potemski and A. Babinski, Raman scattering excitation spectroscopy of monolayer WS 2, Sci. Rep., 2017, 7(1), 5036 CrossRef PubMed.
- M.-M. Yang, H. Wu, Li Tan, Y. Ma, Ya-N. Zhao, Yi Liu, Fu-R. Yang, C.-L. Wu, X.-Lu Liu and B.-L. Liang, et al., Helicity-resolved raman scattering of MoS2 bulk crystal, Opt. Lett., 2023, 48(4), 888–891 CrossRef CAS PubMed.
- R. Saito, Y. Tatsumi, S. Huang, X. Ling and M. S. Dresselhaus, Raman spectroscopy of transition metal dichalcogenides, J. Phys.: Condens. Matter, 2016, 28(35), 353002 CrossRef CAS PubMed.
- C. H. Sharma, A. P. Surendran and A. Varghese, et al., Stable and scalable metallic To enable screen reader support, press Ctrl+Alt+Z To learn about keyboard shortcuts, press Ctrl+slash phase on MoS2 using forming-gas microwave plasma, arXiv, 2018, preprint arXiv:1801.07049 Search PubMed.
- Y. Guo, W. Zhang, H. Wu, J. Han, Y. Zhang, S. Lin, C. Liu, K. Xu, J. Qiao and W. Ji, et al., Discovering the forbidden raman modes at the edges of layered materials, Sci. Adv., 2018, 4(12), eaau6252 CrossRef CAS PubMed.
- A. P. Nayak, T. Pandey, D. Voiry, J. Liu, S. T. Moran, A. Sharma, C. Tan, C.-H. Chen, L.-J. Li and M. Chhowalla, et al., Pressure-dependent optical and vibrational properties of monolayer molybdenum disulfide, Nano Lett., 2015, 15(1), 346–353 CrossRef CAS PubMed.
- C. S. Park, Y. Kwon, Y. Kim, H. D. Cho, H. Kim, W. Yang and D. Y. Kim, Strong Room-Temperature Ferromagnetism of MoS2 Compound Produced by Defect Generation, Nanomaterials, 2024, 14(4), 334 CrossRef CAS PubMed.
- K. H. Choi, J. E. Park and D. H. Suh, Highly thermal-stable paramagnetism by rolling up MoS 2 nanosheets, Nanoscale, 2017, 9(2), 503–508 RSC.
- G. Sharma, A. J. Scott and A. Jha Fabrication and Characterization of Two-Dimensional Transition Metal Dichalcogenides for Applications in Nano Devices and Spintronics, in Emerging Applications of Low Dimensional Magnets, CRC Press, (pp. 33–47), 2022 Search PubMed.
- R. Zhang, Y. Du, G. Han and X. Gao, Ferromagnetism and microwave absorption properties of Cr-doped MoS 2 nanosheets, J. Mater. Sci., 2019, 54, 552–559 CrossRef CAS.
- R. Mishra, W. Zhou, S. J. Pennycook, S. T. Pantelides and J. C. Idrobo, Long-range ferromagnetic ordering in manganese-doped two-dimensional dichalcogenides, Phys. Rev. B Condens. Matter, 2013, 88(14), 144409 CrossRef.
- I. K. Schuller, R. Morales, X. Batlle, U. Nowak and G. Güntherodt, Role of the antiferromagnetic bulk spins in exchange bias, J. Magn. Magn. Mater., 2016, 416, 2–9 CrossRef CAS.
- Y. Zhang, E. Demler and S. Sachdev, Competing orders in a magnetic field: Spin and charge order in the cuprate superconductors, Phys. Rev. B, 2002, 66(9), 094501 CrossRef.
- X. J. Yu, S. H. Shi, L. Xu and Z. X. Li, Emergence of Competing Orders and Possible Quantum Spin Liquid in SU (N) Fermions, Phys. Rev. Lett., 2024, 132(3), 036704 CrossRef CAS PubMed.
- M. Ahmad, M. A. Rafiq, K. Rasool, Z. Imran and M. M. Hasan, Dielectric and transport properties of bismuth sulfide prepared by solid state reaction method, J. Appl. Phys., 2013, 113(4), 043704 CrossRef.
- M. M. Costa, G. F. M. Pires, A. J. Terezo, M. P. F. Graca and A. S. B. Sombra, Impedance and modulus studies of magnetic ceramic oxide Ba2Co2Fe12O22Co2Y doped with Bi2O3, J. Appl. Phys., 2011, 110(3), 034107 CrossRef.
- D. A. Smolyakov, A. S. Tarasov, I. A. Yakovlev, A. N. Masyugin, M. N. Volochaev, I. A. Bondarev, N. N. Kosyrev and N. V. Volkov, Influence of metal magnetic state and metal-insulator-semiconductor structure composition on magnetoimpedance effect caused by interface states, Thin Solid Films, 2019, 671, 18–21 CrossRef CAS.
- Y. P. Kalmykov, S. V. Titov, D. J. Byrne, W. T. Coffey, M. Zarifakis and M. H. Al Bayyari, Dipole-dipole and exchange interaction effects on the magnetization relaxation of two macrospins: Compared, J. Magn. Magn. Mater., 2020, 507, 166814 CrossRef CAS.
- D. Hou, Z. Qiu, J. Barker, K. Sato, K. Yamamoto, S. Velez, J. M. Gomez-Perez, L. E. Hueso, F. Casanova and E. Saitoh, Tunable sign change of spin hall magnetoresistance in pt/nio/yig structures, Phys. Rev. Lett., 2017, 118(14), 147202 CrossRef PubMed.
- K. Gupta, R. J. Wesselink, Z. Yuan and P. J. Kelly, Spin transport at finite temperatures: A first-principles study for ferromagnetic| nonmagnetic interfaces, Phys. Rev. B, 2021, 104(20), 205426 CrossRef CAS.
- W. Boonruesi, J. Chureemart, R. W. Chantrell and P. Chureemart, Temperature dependence of spin-transport properties and spin torque in a magnetic nanostructure, Phys. Rev. B, 2020, 102(13), 134427 CrossRef CAS.
- Y. Fang, X. Hu, W. Zhao, J. Pan, D. Wang, K. Bu, Y. Mao, S. Chu, P. Liu and T. Zhai, et al., Structural determination and nonlinear optical properties of new 1T”-type MoS2 compound, J. Am. Chem. Soc., 2019, 141(2), 790–793 CrossRef CAS PubMed.
- S. Kong, T. Wu, W. Zhuang, P. Jiang and X. Bao, Realizing p-type MoS2 with enhanced thermoelectric performance by embedding V Mo2S4 nanoinclusions, J. Phys. Chem. B, 2018, 122(2), 713–720 CrossRef CAS PubMed.
- R. J. Birgeneau, R. A. Cowley, G. Shirane, J. A. Tarvin and H. J. Guggenheim, Spin fluctuations in random magnetic-nonmagnetic two-dimensional antiferromagnets. II. Heisenberg percolation, Phys. Rev. B, 1980, 21(1), 317 CrossRef CAS.
- A. Singh, G. Sharma, B. P. Singh and P. Vasa, Charge-induced lattice compression in monolayer MoS2, J. Phys. Chem. C., 2019, 123(29), 17943–17950 CrossRef CAS.
- T. Schwartz, G. Bartal, S. Fishman and M. Segev, Transport and anderson localization in disordered two-dimensional photonic lattices, Nature, 2007, 446(7131), 52–55 CrossRef CAS PubMed.
- S. Gautam, V. Aggarwal, B. Singh, V. P. S. Awana, R. Ganesan and S. S. Kushvaha, Signature of weak-antilocalization in sputtered topological insulator Bi2S e3 thin films with varying thickness, Sci. Rep., 2022, 12(1), 9770 CrossRef CAS PubMed.
| This journal is © The Royal Society of Chemistry 2025 |