
 Open Access Article
 This Open Access Article is licensed under a Creative Commons Attribution-Non Commercial 3.0 Unported Licence
Efficient degradation of organic pollutants under solar irradiation using an n–p ZnO/NiO heterostructure†
B. Ben Salem *a,
W. Ltaiefa,
S. Ben Ameura,
H. Guermazia,
S. Guermazia,
B. Duponchelb and
G. Leroyb
*a,
W. Ltaiefa,
S. Ben Ameura,
H. Guermazia,
S. Guermazia,
B. Duponchelb and
G. Leroyb
aLaboratory of Materials for Energy and Environment, and Modelling, Faculty of Science, University of Sfax, Soukra Road km 4 PB, 1171-3038 Sfax, Tunisia. E-mail: basmabensalem1993@gmail.com
bUnity of Dynamic and Structure of Molecular Materials (UDSMM), University, Littoral Côte d'Opale (ULCO), Calais, France
First published on 6th May 2025
Abstract
In the present work, we have synthesized an n-ZnO/p-NiO (1![[thin space (1/6-em)]](https://www.rsc.org/images/entities/char_2009.gif) :1 molar ratio) heterostructure via the hydrothermal method, effectively coupling n- and p-type semiconductors. Raman spectroscopy and X-ray diffraction (XRD) analyses confirmed the successful synthesis of ZnO/NiO composite nanopowders. Based on UV-vis absorbance/reflectance data, the direct optical bandgap is estimated to be around 3.02 and 3.31 eV, attributed respectively to the ZnO and NiO phases. Additionally, the photoluminescence spectrum shows three broad emission bands in the visible range around 410, 453, and 507 nm, attributed to defects such as metal interstitials, anti-oxygen sites, and oxygen vacancies, respectively. These defects will contribute to enhancing the electrical conductivity of the ZnO/NiO nanocomposite. The electrical conductivity σdc is approximately 10−8 S cm−1 higher than that of pure NiO, confirming the improved conduction properties of the prepared nanocomposite. Additionally, the BET analysis revealed a significant specific surface area, which is favorable for catalytic applications. The photocatalytic activities of the ZnO/NiO heterojunction in the degradation of methylene blue (MB) and methyl orange (MO) dyes were investigated under natural solar irradiations. Photocatalytic degradation efficiencies were estimated through the evaluation of the decrease of the dye's characteristic absorbance bands (MB: 664 nm, MO: 464 nm). The nanocomposite shows good photocatalytic activity after 180 min, with a faster degradation rate of MB.
:1 molar ratio) heterostructure via the hydrothermal method, effectively coupling n- and p-type semiconductors. Raman spectroscopy and X-ray diffraction (XRD) analyses confirmed the successful synthesis of ZnO/NiO composite nanopowders. Based on UV-vis absorbance/reflectance data, the direct optical bandgap is estimated to be around 3.02 and 3.31 eV, attributed respectively to the ZnO and NiO phases. Additionally, the photoluminescence spectrum shows three broad emission bands in the visible range around 410, 453, and 507 nm, attributed to defects such as metal interstitials, anti-oxygen sites, and oxygen vacancies, respectively. These defects will contribute to enhancing the electrical conductivity of the ZnO/NiO nanocomposite. The electrical conductivity σdc is approximately 10−8 S cm−1 higher than that of pure NiO, confirming the improved conduction properties of the prepared nanocomposite. Additionally, the BET analysis revealed a significant specific surface area, which is favorable for catalytic applications. The photocatalytic activities of the ZnO/NiO heterojunction in the degradation of methylene blue (MB) and methyl orange (MO) dyes were investigated under natural solar irradiations. Photocatalytic degradation efficiencies were estimated through the evaluation of the decrease of the dye's characteristic absorbance bands (MB: 664 nm, MO: 464 nm). The nanocomposite shows good photocatalytic activity after 180 min, with a faster degradation rate of MB.
1. Introduction
Water decontamination and the degradation of hazardous organic pollutants are crucial for environmental remediation, helping to restore water quality and protect ecosystems. Recently, nanomaterials have gained significant attention from researchers due to their unique physical and chemical properties. These properties make them highly effective in various applications, particularly in environmental protection, where they play a key role in water purification and the removal of toxic organic pollutants.1,2 On the other hand, many chemical, physical, and biological treatment techniques have been used to purify contaminated water.3 Among these different procedures, the use of photocatalytic treatment with nanocatalysts has been considered a promising approach to degrade organic environmental pollutants. Incidentally, organic dyes are responsible for the most severe water pollution among various pollutants and are challenging to decompose. In particular, methylene blue (MB) is a hazardous organic substance frequently used in textile industries. Although it can undergo biological degradation under specific conditions, it is generally considered bio-recalcitrant and difficult to biodegrade. Moreover, its planar structure makes it highly soluble in water.4,5 Therefore, the photocatalytic process generates hydroxylated reactive species that completely mineralize organic compounds into harmless compounds such as CO2 and H2O.6,7 Furthermore, sunlight is considered the best excitation source for photocatalysis due to its free availability in the environment.8Various photocatalysts reported in the literature, such as ZnO and TiO2, have been widely studied and recognized due to their potential applications in environmental treatment fields.9–11 ZnO is an n-type semiconductor with a wide direct band gap (Eg = 3.37 eV) and electron binding energy (60 meV).12,13 It represents a promising solution to this environmental issue compared to other oxide semiconductor materials. Its applications are numerous in the fields of photocatalysis, chemical sensors, and gas sensors, presenting in particular advantages in the photodegradation of organic dyes.14 However, the rapid recombination of electron/hole pairs in ZnO significantly reduces the efficiency of the photocatalytic progression.15 During the past decades, several strategies have been investigated to improve the photocatalytic performance of ZnO, including doping, metal loading, and fabrication of heterostructured systems.16–18 Among these, the combination of ZnO with other types of semiconductors allows the formation of composites that are effective in breaking down organic pollutants. Indeed, the combination of two different semiconductors (n-type and p-type) in a nanocomposite can facilitate the separation of charge carriers (electrons/holes).19 Particular interest has been given to paired semiconductors, such as Fe3O4, Mn2O3, CuO, and NiO nanoparticles, with ZnO to construct a binary nanocomposite.20–24 Among the various metal oxides, nickel oxide (NiO) is proposed as a possible candidate to form a composite with ZnO for photocatalytic applications, owing to its interesting properties.25,26 In fact, NiO is a remarkable p-type semiconductor with a wide band gap (3.6–4.0 eV). It has excellent properties, including high carrier concentration, superior stability, and light absorption in the visible region.27–29 In addition, it has a unique electronic structure that allows for rapid charge carrier mobility.30 Several studies have been reported on ZnO/NiO nanocomposites and have shown their effectiveness in the degradation of organic compounds by photocatalysis. Many physical and chemical synthesis methods for the preparation of this binary nanocomposite are also used. X. San et al.31 successfully synthesized a NiO-coupled ZnO nanocomposite using a hydrothermal method, which effectively reduced the recombination of electrons and holes during the photocatalytic process and promoted the active substances (O2˙− and OH−). E. E. El-Katori et al.32 synthesized a NiO-modified ZnO nanocomposite with the sol–gel method, which showed strong photocatalytic activity. J. Wu et al.33 successfully synthesized a hetero-structured ZnO/NiO nanocomposite using a nonsolvent method, which promoted the separation of photogenerated carriers.
From above all well-known techniques, the hydrothermal is an interesting method to prepare nano-powders with high crystallinity from aqueous solutions at high temperature and pressure. Furthermore, the hydrothermal method allows refining the physical characteristics such as morphology and size; the implementation of this method is easy, treatable, inexpensive, and environmentally friendly.34,35
This study presents a comprehensive characterization of the ZnO/NiO (molar ratio 1:1) nanocomposite, including its structural, optical and electrical properties. The material's specific surface area, optical absorption properties and electrical conductivity are carefully analyzed to understand their role in enhancing the photocatalytic degradation of organic dyes, such as methylene blue (BM) and methyl orange (MO). By reducing the band gaps of ZnO and NiO, the composite is expected to exhibit better absorption in the visible region of the solar spectrum, thereby increasing its photocatalytic efficiency.
2. Materials and methods
2.1. Synthesis of ZnO/NiO
All chemical reagents, ZnCl2 and (NiSO4·6H2O) precursors, sodium hydroxide (NaOH), distilled water, acetone, and ethanol were supplied by Sigma Aldrich (purity > 99%) and used without any further purification.Nanosized ZnO/NiO composite was successfully synthesized by hydrothermal route. First, ZnCl2 and (NiSO4·6H2O), with a molar ratio of 1:1, were dissolved in distilled water under magnetic stirring at room temperature for 30 min. In the short time, an appropriate amount of aqueous sodium hydroxide (NaOH) solution was added dropwise to the initial solution every 10 min. The resulting solution was placed in a Teflon-lined autoclave and kept at 110 °C for 24 hours. After a filtering step, the precipitate was washed several times with ethanol, acetone, and distilled water to remove residues and unwanted impurities. Then, it was dried at 80 °C for 12 hours. Finally, the as-synthesized powder was annealed at 500 °C for 5 hours to remove organic compounds.36
2.2. Characterization details
The structural properties of ZnO/NiO nanostructures were analyzed using an X-ray diffraction pattern obtained by a Phillips powder diffractometer operating with a copper Kα radiation source (λ = 1.54060 Å). The morphological properties of the nanocomposite were investigated using a JEOL JSM7100F Scanning Electron Microscope (SEM). Then, to estimate the average grain size, we used the ImageJ software.37 Specific surface area measurements were performed using the BET (Brunauer–Emmett–Teller) method on a gas adsorption analyzer. Raman measurements were conducted at room temperature (200–700 cm−1) using a HORIBA “Labram HR 800” spectrometer equipped with a 532 nm green laser. Optical properties were studied using a diffuse reflectance UV-Vis PerkinElmer 365 spectrophotometer. Photoluminescence (PL) characterization was done by Jobin Yvon HR 250 spectrometer at room temperature with an excitation wavelength of 266 nm. Dielectric measurements were performed by a Hewlett Packard 4284A impedance meter in the frequency range of 20–106 Hz at room temperature.2.3. Photocatalytic degradation process
The photocatalytic efficiency of the ZnO/NiO heterostructure was investigated using both methylene blue (MB) and methyl orange (MO) as model organic dyes in aqueous solutions. Initially, 50 mg of ZnO/NiO powders was dispersed in 60 ml of simulated pollutant solution containing either MB or MO at a concentration of 5 mg L−1. The mixture was stirred magnetically in darkness for 60 minutes to establish adsorption/desorption equilibrium between the catalyst and the respective organic dye. Following this, the solution was exposed to direct sunlight between 11:00 AM and 2:00 PM in Sfax, Tunisia, during July, when solar intensity is at its peak. The average solar intensity in this region during summer reaches approximately 800–1000 W m−2. Samples (approximately 2 ml each) were collected at 30 minute intervals, centrifuged at 6000 rpm for 20 minutes to separate the catalytic precipitate from the dye solution, and then filtered. The concentration of MB or MO in the resulting aqueous samples was determined by monitoring the change in absorbance peak intensity at their respective wavelengths (664 nm for MB and 464 nm for MO) using a UV-vis spectrophotometer (Shimadzu UV-1800).
3. Results and discussion
3.1. Structural analysis
The phase identification and crystal structure of ZnO/NiO powder were investigated using X-ray diffraction analysis. The XRD pattern (Fig. 1a) shows the presence of ZnO and NiO peaks with high crystallinity, which confirms the formation of the ZnO/NiO composite. Peaks at 2θ of 31.689, 34.363, 36.255, 47.445, 56.514, 62.789, 67.865, and 69.037° are assigned to hexagonal wurtzite ZnO, space group P63mc (JCPDS card number 01-080-0074). On the other hand, the peaks at 2θ: 37.197, 43.232, and 62.706° are attributed to the cubic NiO, space group Fm![[3 with combining macron]](https://www.rsc.org/images/entities/char_0033_0304.gif) m (JCPDS card number 01-073-1523) phase. It is observed that no additional peaks due to impurities were produced, demonstrating that the developed samples have high purity and crystallinity. Thus, the correlated XRD and EDS characterizations highlight the high purity and crystallinity of the synthesized ZnO/NiO nanocomposite.
m (JCPDS card number 01-073-1523) phase. It is observed that no additional peaks due to impurities were produced, demonstrating that the developed samples have high purity and crystallinity. Thus, the correlated XRD and EDS characterizations highlight the high purity and crystallinity of the synthesized ZnO/NiO nanocomposite.
 | ||
| Fig. 1 (a) XRD diffractograms of powders along with the inset shows the enlarged diffraction peak in the range 2θ = 62°–63° and (b) Raman analysis. | ||
The Scherrer equation is the general method to estimate the average crystallite size (D) from X-ray diffraction peaks:38
 | (1) |
| Phase | ZnO | NiO |
|---|---|---|
| Space group | P63mc | Fmm |
| Lattice constant a (Å) | 3.2581 | 4.1683 |
| Lattice constant c (Å) | 5.2038 | |
| D (nm) | 18 | 14 |
| Micro-strain ε (×10−4) | 11.4 | 13.3 |
| δ (×10−3 nm−2) | 3.19 | 5.1 |
| α (×10−2) | 1.45 | 3.83 |
| Relative intensity ratio W (%) | 48.24 | 51.76 |
Lattice parameters of each phase of ZnO and NiO in the nanocomposite were calculated with the help of Bragg's law and using the formula of d-spacing:
For the ZnO phase:
 | (2) |
For the NiO phase:
 | (3) |
Moreover, the micro-strain (ε) can be calculated using the following equation:39
 | (4) |
Additionally, we have evaluated the crystal irregularity of each phase (ZnO or NiO), caused by the interactions between the phases, using the dislocation density:40
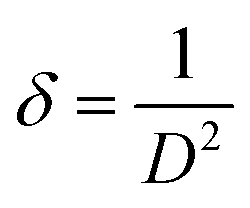 | (5) |
Furthermore, we calculated the stacking fault probability (α) for prominent diffraction peaks by the Warren and Warekois model:
 | (6) |
Additionally, the relative intensity ratio of the characteristic peaks of ZnO (WZnO) and NiO (WNiO) can be obtained using the following expressions:41,42
 | (7) |
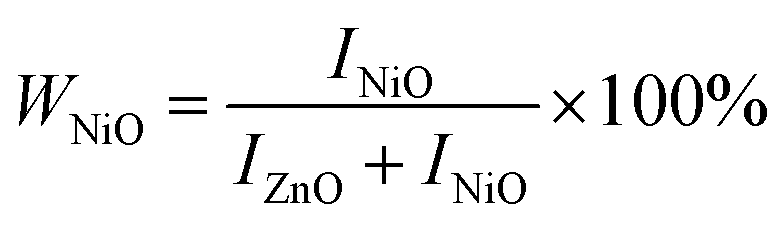 | (8) |
The calculated values of the relative intensity ratio for WZnO and WNiO are 48.24% and 51.76%, respectively. Additionally, the crystallite size of ZnO (18 nm) is slightly larger than that of NiO (14 nm). These values are lower than those reported in literature for powders prepared by other methods43,44 proving the importance of the hydrothermal technique. The micro-strain, the dislocation density, and the stacking fault probability have low values, which prove the good crystallinity of the synthesized powder.
Spectroscopic Raman analyses have been crucial for gaining a deeper understanding of the structure of ZnO/NiO samples. Raman spectra obtained at room temperature (Fig. 1b) revealed eight characteristic peaks, indicative of vibrations from both ZnO and NiO phases within the composite. Among these peaks, the E2(high) mode of ZnO is identified at 455 cm−1, while the E2(low) mode is associated with the peak at 320 cm−1, confirming a high-quality crystalline wurtzite structure. Significantly, the peak at 374 cm−1 is attributed to the A1 mode of ZnO, and the one at 596 cm−1 to the E1 mode of ZnO, demonstrating the distinctive presence of these modes in the composite. Additionally, additional peaks at 200 cm−1, 414 cm−1, and 526 cm−1 were observed, corresponding respectively to the A1g, Eg, and A1g modes, characteristic of the NiO phase. Notably, the value of 526 cm−1 for the Ni–O stretching mode indicates a perfect stoichiometry of the nickel oxide. This coexistence of Raman modes from both ZnO and NiO conclusively confirms the composite nature of the material. Thus, the Raman analysis confirmed the presence of two distinct crystalline phases in a binary ZnO/NiO heterostructure, which correlates well with the XRD data.
3.2. Morphology analysis
The morphology of the synthesized powders was observed using scanning electron microscopy (SEM). The SEM image obtained for ZnO/NiO (Fig. 2a) reveals heterogeneously shaped particles, including both spherical and rod-shaped structures. This morphological diversity was further analyzed using ImageJ software, with a 3D representation showing particle agglomeration (Fig. 2b). The nanometric size of these particles confers a significant advantage for photocatalytic performance, as nanomaterials offer a larger active surface area, improving adsorption of organic pollutants and overall photocatalytic efficiency. The morphological diversity observed in the ZnO/NiO heterojunction sample could have important implications for its photocatalytic performance. Spherical and rod-shaped structures offer distinct surface characteristics, which could influence their ability to adsorb organic pollutants and promote photocatalytic reactions. For example, spherical particles have a uniform specific surface area that favors efficient adsorption of contaminants, while rod-shaped particles could have a geometry that favors efficient charge carrier separation during the photocatalytic reaction.45,46 | ||
| Fig. 2 Characterization of synthesized powders: (a) SEM morphology (b) 3D representation of the surface obtained from the SEM image analysis using Image J software. | ||
3.3. BET
The pore structure and specific surface area of the prepared ZnO/NiO heterojunction were analyzed by N2 adsorption–desorption, as shown in Fig. 3. According to the IUPAC classification, type IV isotherms with H3-type hysteresis loops were observed. Type IV isotherms indicate mesoporous materials, characterized by capillary condensation at high P/P0 relative pressures and rapid isotherm increase. Hysteresis loops extending almost to P/P0 = 1 suggest complete mesopore filling.47,48. The linearized model curve shown in Fig. 3a can be used to determine the volume of gas adsorbed in a monolayer from the experimental points. This makes it possible to deduce the specific surface area available for adsorption. The BET specific surface area of ZnO/NiO is 11.385 m2 g−1. According to previous results obtained by Thommes M et al. on pure ZnO prepared by the hydrothermal method, the specific surface areas were 8.5 m2 g−1.47 In comparison, the higher specific surface area of our ZnO/NiO heterojunction (11.385 m2 g−1) demonstrates the efficiency of our synthesis method. This high surface area presents an advantage for photocatalytic applications, as it enhances the interaction between active sites and pollutants, showing promising potential for the degradation of organic pollutants under UV-visible irradiation. It is generally expected that nanocatalytic materials with a high surface area and numerous crystal faces, edges, and corners, which are conventionally regarded as active sites for adsorption of reagents, will generate better catalytic efficiencies.49 | ||
| Fig. 3 (a) N2 adsorption–desorption isotherms and BET surface area plot, (b): BJH pore size distribution (desorption). | ||
In order to evaluate the pore size distribution of this product, the Barrett–Joyner–Halenda (BJH) model using the desorption branch of the N2 isotherm was used. The BJH plot presented in Fig. 3b reveals that the average pore diameter is found to be around 30.17 nm.
3.4. Optical analysis
Combining two metal oxides of different types with different energy band gaps improves photocatalytic performance by optimizing sunlight absorption and reducing charge carrier recombination.50The optical absorption properties of the prepared composite were analyzed by UV-vis diffuse reflectance spectroscopy (DRS). The data obtained were transformed into an equivalent absorption spectrum using the Kubelka–Munk equation F(R), as shown in eqn (9).50,51
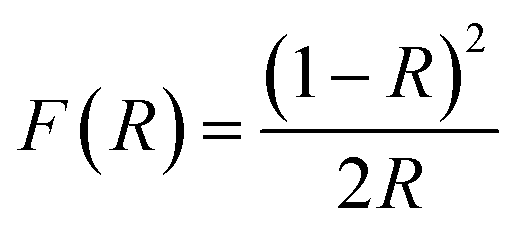 | (9) |
It was noticed the presence of two absorption edges: the first marked by an inflection point around 350 nm related to the NiO phase and the second at 405 nm related to the ZnO phase of the ZnO/NiO nanocomposite. In fact, these results are in agreement with the literature, in which the absorption edges of NiO and ZnO are located at 340 and 400 nm, respectively.52,53
To determine the gap energy (Eg) of the prepared nanoparticles, we used the Tauc's low (eqn (10)).53
| (αhν) = β(hν − Eg)p | (10) |
 , t = 1 mm represents the thickness of the pellet, β is a constant independent of energy or band tailing parameter, h is the Planck's constant, ν is the incident light frequency, and p is the power factor. The p-value is governed by the optic transition type; it can take the following values: 1/2, 3/2, 2, or 3 for direct allowed, direct forbidden, indirect allowed, or indirect forbidden transition, respectively. In our case, p is equal to 1/2, since ZnO and NiO have a direct band gap, according to literature.54,55
Indeed, for a precise estimation of the band gap energy, we computed the first derivative of the logarithmic expression (eqn (11)), as it approaches its maximum value for photon energy near Eg. Thus, we employed the following equation:
 | (11) |
The value of Eg is determined from the fitted plot of d[ln(αhν)]/d[hv] versus hν (Fig. 4a). Discontinuities in the line provide insights into optical transitions, pinpointed at specific maximum energy values where particular transitions, corresponding to specific “m” values, may occur. Additionally, the plot of [ln(αhν)] versus [ln(hν – Eg)], as depicted in Fig. 4b, allowed us to determine the slope (m) of the linear segment. These analyses revealed that the slope (m) equaled 1/2, indicating a direct-type fundamental bandgap transition.
 | ||
| Fig. 4 Plot of (a) d[ln(αhν)]/d[hv] versus hν and (b) [ln(αhν)] versus [ln(hν – Eg)]. | ||
The values of energy gaps “Eg” for ZnO and NiO are 3.099 and 3.2029 eV, respectively. These values are lower than those reported in other works for both phases.56,57 This reduction in Eg would significantly improve the absorption of visible light, which is a positive point for photocatalytic activities under sunlight.
The extinction coefficient (k) and the refractive index (n) are calculated using the following relations:58
 | (12) |
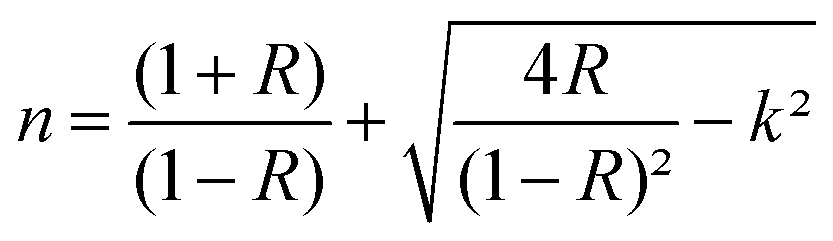 | (13) |
Fig. 5a shows the extinction coefficient and the refractive index variations versus wavelength in the UV and visible range. The nanocomposite exhibits a low optical loss in the UV domain, then increases in the visible range. Whereas n is found to vary from 2.52 to 2.9. It increases with the wavelength increase in the UV range, then decreases as the wavelength increases in the visible domain.
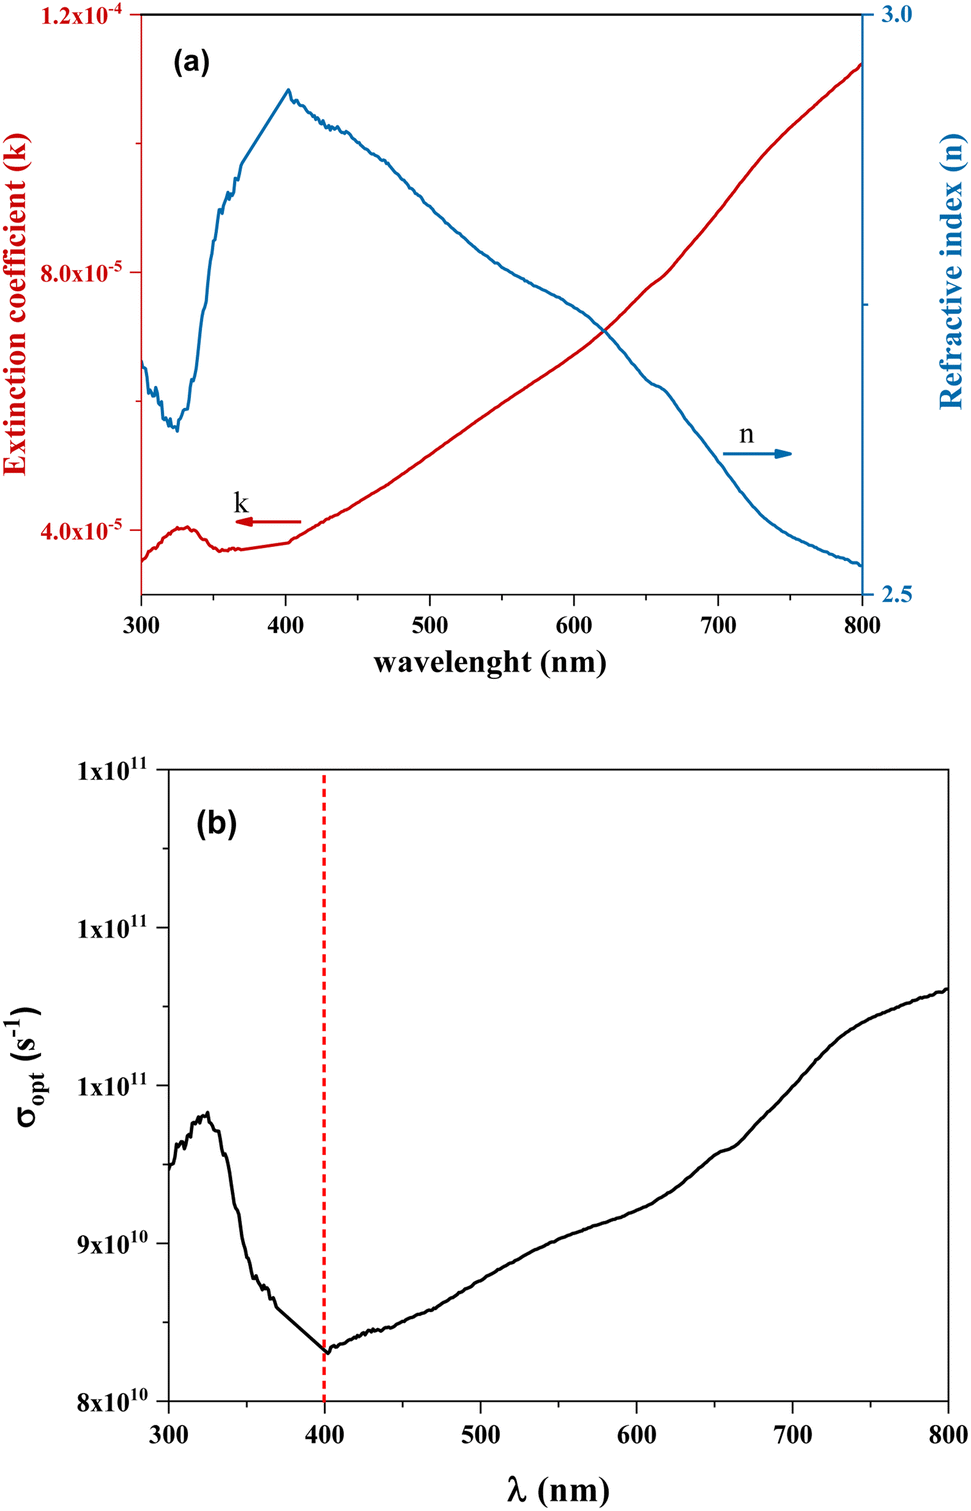 | ||
| Fig. 5 (a) Variations of extinction coefficient and refractive index with wavelength (b) variation of optical conductivity (σopt) vs. wavelength. | ||
Furthermore, the optical conductivity (σopt) can be calculated as a function of absorption coefficient and refractive index as follows:59
 | (14) |
Fig. 5b shows that in the UV region, σopt reaches a high value of about 9.7 × 10¹⁰ s−1, then it decreases and reaches a minimum value of about 8.3 × 10¹⁰ s−1 at 400 nm. Conversely, in the visible region, it increases with wavelength increase. Similar values are found by Yasmeen, S. et al..60
3.5. Photoluminescence analysis
To investigate recombination phenomena in semiconductors, photoluminescence (PL) spectra were recorded, providing data on the bandgap and relative energy position of defect states beneath it. The diversity of defects in materials can vary depending on factors such as synthesis conditions, morphology, and crystallite dimensions. Fig. 6 presents the PL spectrum at room temperature of the NiO/ZnO composite. Using an excitation wavelength of 266 nm, different emission bands were analyzed. The presence of a broad and intense peak at maximum emission intensity in the UV region of the spectrum may be due to the rapid recombination of photo-induced electron–hole pairs in this region, while the broad PL peak located in the visible domain indicates efficient separation of electrons and holes, confirming good crystallinity of the sample. The Gaussian adjustment of PL emission peaks of ZnO/NiO suggests the presence of several individual emissions. The emission peaks in the UV region at 326 and 382 nm are assigned to the emission from the wide-bandgap metal oxide (NBE). Interface traps at grain boundaries may contribute to violet emission peaks (410 nm), while blue emission (453 nm) may be associated with interface traps rich in electrons between the conduction and valence bands, depleted in oxygen. As for green emission (500 nm), it likely results from two types of defects: radiative recombination of a photo-generated hole with an electron in an ionized oxygen vacancy and recombination of surface defects.61 | ||
| Fig. 6 PL emission spectrum of ZnO/NiO heterostructure: experimental and individual Gaussian decomposition. | ||
3.6. Dielectric study
The permittivity, an essential property of materials, determines their ability to polarize under the influence of an external electric field. It is often represented in a complex form, with its real part (ε′) corresponding to stored electrical energy and its imaginary part (ε'') representing dissipated energy (eqn (15)).| ε* = ε′ − iε″ | (15) |
The variation of permittivity as a function of frequency for the ZnO/NiO heterostructure is shown in Fig. 7a. At low frequencies, high values of ε′ are observed, attributed to the polarization effect at interfaces, leading to substantial dielectric losses, as illustrated by ε''(ω = 2πf). The interface between different material phases can generate free charges, thus contributing to this polarization. The high dielectric constant suggests its potential in various applications such as ambient temperature charge storage and photocatalysis. The fitting of experimental data using the Cole–Cole model (eqn (8)) for the ZnO/NiO heterostructure demonstrates satisfactory convergence, providing essential characteristic parameters such as the polarization relaxation time (τ) and the relaxation time distribution factor (α). The obtained characteristic values are as follows: the polarization relaxation time (τ) is 1.06 × 10⁻³, indicating the time required for polarizations in the material to recover after perturbation, while the relaxation time distribution factor (α) is 0.653, suggesting a distribution of polarization relaxation times. These values highlight the unique properties of the ZnO/NiO heterostructure and their importance in understanding its dielectric behaviors. Furthermore, the good conformity between experimental and theoretical data proves the validity of the Cole–Cole model. From this adjustment, the permittivity's values are found to be εs = 39.03 and ε∞ = 5.65. It should be noted that the ε′ value of the prepared nanocomposite is lower than that of pure ZnO and NiO.62,63 This may be due to the interactions at the interfaces, which reduce the mobility of the charge carriers and thus the polarization of the charge due to inhomogeneous dielectric structure.64
 | (16) |
 | ||
| Fig. 7 (a) Variation of the dielectric constant as a function of frequency (b) variations of tanδ vs. frequency at room temperature (c) conductivity analysis: frequency-dependent behavior and relaxation processes. | ||
The dielectric loss factor (tanδ) is a parameter used to measure energy losses in a dielectric material subjected to an alternating electric field. For the ZnO/NiO heterostructure, the tangent of the dielectric loss (tanδ) is calculated by relating the imaginary part of the dielectric constant (ε′′) to its real part (ε′) according to the relationship (eqn (17)).
 | (17) |
Variations of tanδ with frequency at room temperature are presented in Fig. 7b. The analysis reveals that the ZnO/NiO heterostructure exhibits frequency-dependent dielectric losses, with relatively high losses at low frequencies, attributed to the interface polarization effect. Furthermore, the decrease in tanδ with increasing frequency suggests a reduction in energy losses at higher frequencies. However, beyond a certain frequency, tanδ increases, reaching a maximum at higher frequencies, due to faster charge dynamics. This behavior is primarily attributed to interface polarization at low frequencies, while at high frequencies, it is dominated by the dipole relaxation phenomenon, where the mobility of charge carriers increases with frequency.
Moreover, the analysis of conductivity reveals intriguing behaviors. In the plotted data shown in Fig. 7c, it becomes apparent that the alternating current conductivity of the ZnO/NiO composite remains practically constant across low frequencies, forming a plateau. However, as the frequency increases beyond a specific threshold for this composite, the conductivity starts to exhibit frequency dependence, following the Jonscher law. This observation suggests the presence of distinct relaxation processes within the ZnO/NiO composite. At lower frequencies, the conductivity behavior indicates interfacial relaxation, primarily attributed to grain boundary polarization. This emphasizes the significant role played by grain interfaces in governing the electrical properties of the composite at lower frequencies. At higher frequencies, a different relaxation process, known as dipole relaxation, becomes dominant, highlighting the dipolar characteristics of the grains. Understanding these conductivity mechanisms within the ZnO/NiO heterostructure provides valuable insights into its electrical behavior, crucial for various applications requiring tailored conductivity properties. The estimated value of σdc conductivity of the prepared ZnO/NiO nanocomposite is found to be about 10−8 S cm−1, higher than that of pure NiO as reported by J. M. McKay et al. σdc 10−13 S cm−1.65 So, this result confirms the improvement of the conduction properties of the nanocomposite.
3.7. Photocatalytic performance of the ZnO/NiO heterostructure photocatalyst
The research focused on the photocatalytic activity of a ZnO/NiO nanocomposite by testing its ability to degrade two dyes, methylene blue (MB) and methylene orange (MO), under solar irradiation. The choice of MB and MO is based on their high stability and saturation capacity during the adsorption phase, ensuring the precision of the tests. The absorption spectra of the MB and MO solutions as a function of wavelength are shown in Fig. 8. It is clearly observed that the intensity of the characteristic absorption peak of the dyes (at λmax = 664 nm for MB and at λmax = 464 nm for MO) decreases progressively with illumination time in the presence of the ZnO/NiO photocatalyst. This indicates the successful degradation of both MB and MO dyes. | ||
| Fig. 8 UV-vis adsorption spectra as a function of degradation reaction time of (a) MB, and (b) MO aqueous solutions, catalyzed by the ZnO/NiO powders under sunlight irradiation. | ||
In addition, the dye degradation rate (D) is calculated by the following relation:
 | (18) |
The degradation rate of both dyes, MB and MO, is depicted in Fig. 9 as a function of illumination time. The ZnO/NiO nanocomposite demonstrates high degradation efficiency, reaching approximately 64% for MB and 62% for MO after 180 minutes. Both dyes exhibit two characteristic absorption peaks: MB at 664 nm and 292 nm, and MO at 464 nm and 272 nm. The decrease in intensity of these peaks over time confirms the progressive degradation of the dyes under sunlight irradiation.This good degradation efficiency is attributed to the existence of reactive radicals, such as superoxide (O2˙−), hydroxyl (OH−), and hole (h+). In fact, the photocatalytic process is based on the absorption of photons of appropriate energy by the ZnO/NiO nanocomposite in order to generate electron e−/hole h+ pairs in the conduction (CB), and valence (VB) bands, respectively. The electron can react with adsorbed molecular oxygen to form radical ions (O2˙−) and with H2O molecules to form OH− radicals. These highly oxidizing free radicals disrupt the combination of adsorbed MB molecules and thus break down the MB molecules into colorless fragments.
 | ||
| Fig. 9 Degradation efficiency of ZnO/NiO heterostructure against MB and MO dye solutions, as a function of irradiation time. | ||
The possible photocatalytic mechanism for the ZnO/NiO photocatalyst is proposed and presented in Fig. 10. It is known that ZnO is an n-type semiconductor, while NiO is a p-type one. Consequently, ZnO and NiO interfaces form nano-heterojunctions. In this way, the photogenerated carriers can be efficiently separated at the heterojunctions, which improves the photocatalytic performance.66,67 In our case and according to the optical study, the band gap of NiO is 3.24 eV (λ = 374 nm) and of ZnO is 3.02 eV (λ = 411 nm). When the nanocomposite is activated under sunlight irradiation, both semiconductors are excited, and electron (e−)–hole (h+) pairs are generated into the conduction and valence bands, respectively of ZnO and NiO. Moreover, the electrons (e−) excited into the conduction band (CB) in NiO would be transferred to the conduction band of ZnO. Electrons promoted in the conduction band (CB) of NiO are transferred to the CB of ZnO. This effectively prevented e− and h+ recombination and extended the carrier lifetime. The photocatalytic mechanism occurs in three steps:1,68
 | ||
| Fig. 10 The possible photocatalytic mechanism for ZnO/NiO photocatalyst. | ||
• Oxidation:
| ZnO/NiO + hv → ZnO (e− + h+)/NiO (e− + h+) |
| n-type ZnO/p-type NiO + hν → (e−)ZnO + (h+)NiO |
| (h+)NiO + OH− → OH˙ |
| (h+)NiO + H2O → OH˙ + H+ |
• Reduction:
| (e−)ZnO + O2 →O2˙− | (I) |
| O2˙− + H+ → HO2˙ | (II) |
| 2HO2˙ → H2O2 + O2 | (III) |
| H2O2 + O2˙− → OH˙ + O2 + OH− | (IV) |
• Pollutant degradation:
During the degradation process, dyes undergo initial oxidation, either through successive attacks by hydroxyl radicals (OH˙)69 or via hole transfer (eqn (V)). Following oxidation, the resulting intermediates either degrade spontaneously or are further broken down by reactive oxygen species (ROS) into final products.70
| Dye + (OH˙ or h+) → dye+ | (V) |
| Dye+ + intermediates + ROS → degradation products | (VI) |
Conclusion
In summary, a sunlight-activated ZnO/NiO nanocatalyst has been successfully prepared by a low-cost, environmentally friendly hydrothermal method. XRD and Raman data confirm the chemical purity of the prepared binary nanocomposite powder. In addition, DRS-UV-vis analysis using the Kubelka–Munk model enabled two optical bandgap energies to be estimated: Eg = 3.02 eV and Eg = 3.31 eV for ZnO and NiO, respectively. BET analysis revealed a large specific surface area, favorable for catalytic applications. Defects highlighted by photoluminescence, such as metallic interstitials, oxygen anti-sites, and oxygen vacancies, contribute to the improved electrical conductivity of ZnO/NiO.The ZnO/NiO nanocomposite demonstrated significant photocatalytic efficiency in degrading MB and MO dyes under solar irradiation, confirming its potential for environmental applications, particularly in water purification. The promising results obtained in this study pave the way for further research. In particular, the introduction of reducing agents and precise pH control, using compounds such as H2O2 or NaBH4, could further enhance the photocatalytic efficiency. Additionally, integrating ZnO/NiO with other photocatalytic materials, such as noble metals (Ag, Au) or carbon-based structures (graphene, carbon nanotubes), could improve charge carrier separation and extend light absorption into the visible region, further optimizing performance.
To guarantee their industrial usability, the question of photocatalysts' recyclability is still vital. Therefore, to have a better understanding of their long-term durability and efficiency, future research should concentrate on evaluating their stability after multiple cycles of use.
Data availability
The data of this article cannot be available, due to confidentiality requirements. However, further information about the data is available from the corresponding author upon reasonable request.Conflicts of interest
There are no conflicts to declare.References
- J. Zhang and J. Li, The Oxygen vacancy defect of ZnO/NiO nanomaterials improves photocatalytic performance and ammonia sensing performance, Nanomaterials, 2022, 12, 433 CrossRef CAS PubMed.
- X. Feng, Z. Yu, Y. Sun, R. Long, M. Shan, X. Li, Y. Liu and J. Liu, Review MXenes as a new type of nanomaterial for environmental applications in the photocatalytic degradation of water pollutants, Ceram. Int., 2021, 47, 7321–7343 CrossRef CAS.
- I. A. Saleh, N. Zouari and M. A. Al-Ghouti, Removal of pesticides from water and wastewater: chemical, physical and biological treatment approaches, Environ. Technol. Innov., 2020, 19, 101026 CrossRef.
- I. Khan, K. Saeed, I. Zekker, B. Zhang, A. H. Hendi, A. Ahmad, S. Ahmad, N. Zada, H. Ahmad, L. A. Shah and T. Shah, Review on Methylene Blue: Its Properties, Uses, Toxicity and Photodegradation, Water, 2022, 14, 242 CrossRef CAS.
- H. N. Hamad and S. Idrus, Recent Developments in the Application of Bio-Waste-Derived Adsorbents for the Removal of Methylene Blue from Wastewater: A Review, Polymer, 2022, 14, 783 CAS.
- P. K. Pandis, C. Kalogirou, E. Kanellou, C. Vaitsis, M. G. Savvidou, G. Sourkouni, A. A. Zorpas and C. Argirusis, Key Points of Advanced Oxidation Processes (AOPs) for Wastewater, Organic Pollutants and Pharmaceutical Waste Treatment: A Mini Review, Chem. Eng., 2022, 6, 8 CAS.
- L. Wang, P. R. Cai and Z. Z. Liu, Role of carbon quantum dots on nickel titanate to promote water oxidation reaction under visible light illumination, J. Colloid Interface Sci., 2022, 607, 203–209 CrossRef CAS PubMed.
- H. Park, Solar remediation of wastewater and saline water with concurrent production of value-added chemicals, J. Environ. Chem. Eng., 2022, 10, 106919 Search PubMed.
- I. J. Ani, U. G. Akpan, M. A. Olutoye and B. H. Hameed, Photocatalytic degradation of pollutants in petroleum refinery wastewater by TiO2-and ZnO-based photocatalysts: recent development, J. Clean. Prod., 2018, 205, 930–954 CrossRef CAS.
- C. B. Ong, L. Y. Ng and A. W. Mohammad, A review of ZnO nanoparticles as solar photocatalysts: synthesis, mechanisms and applications, Renew. Sustain. Energy Rev., 2018, 81, 536–551 CrossRef CAS.
- R. A. Gonçalves, R. P. Toledo, N. Joshi and O. M. Berengue, Green synthesis and applications of ZnO and TiO2 nanostructures, Molecules, 2021, 26, 2236 Search PubMed.
- J. A. Spencer, A. L. Mock, A. G. Jacobs, M. Schubert, Y. Zhang and M. J. A. Tadjer, review of band structure and material properties of transparent conducting and semiconducting oxides: Ga2O3, Al2O3, In2O3, ZnO, SnO2, CdO, NiO, CuO, and Sc2O3, Appl. Phys. Rev., 2022, 9, 011315 CAS.
- J. Wang, R. Chen, L. Xiang and S. Komarneni, Synthesis, properties and applications of ZnO nanomaterials with oxygen vacancies: a review, Ceram. Int., 2018, 44, 7357–7377 CrossRef CAS.
- G. K. Weldegebrieal, Synthesis method, antibacterial and photocatalytic activity of ZnO nanoparticles for azo dyes in wastewater treatment: a review, Inorg. Chem. Commun., 2020, 120, 108140 CrossRef CAS.
- J. Fang, H. Fan, Y. Ma, Z. Wang and Q. Chang, Surface defects control for ZnO nanorods synthesized by quenching and their anti-recombination in photocatalysis, Appl. Surf. Sci., 2015, 332, 47–54 Search PubMed.
- S. G. Kumar and K. K. Rao, Comparison of modification strategies towards enhanced charge carrier separation and photocatalytic degradation activity of metal oxide semiconductors (TiO2, WO3 and ZnO), Appl. Surf. Sci., 2017, 391, 124–148 Search PubMed.
- K. Qi, B. Cheng, J. Yu and W. Ho, Review on the improvement of the photocatalytic and antibacterial activities of ZnO, J. Alloys Compd., 2017, 727, 792–820 CrossRef CAS.
- S. G. Kumar and K. K. Rao, Comparison of modification strategies towards enhanced charge carrier separation and photocatalytic degradation activity of metal oxide semiconductors (TiO2, WO3 and ZnO), Appl. Surf. Sci., 2017, 391, 124–148 CrossRef CAS.
- S. Wannapop, A. Khawsaad, A. Supanpong, Y. Janorat, Y. Chuminjak, A. Tuantranont and A. Somdee, Photocatalytic study of metal oxide enhanced ZnO synthesized by a one-step cyclic-microwave method: the role of the pn heterostructure, Inorg. Chem. Commun., 2022, 138, 109210 Search PubMed.
- Y. S. Nagaraju, H. Ganesh, S. Veeresh, H. Vijeth, M. Basappa, M. Vandana and H. Devendrappa, Single-step hydrothermal synthesis of ZnO/NiO hexagonal nanorods for high-performance supercapacitor application, Mater. Sci. Semicond. Process., 2022, 142, 106429 CrossRef.
- L. Fernández, M. Gamallo, M. A. González-Gómez, C. Vázquez-Vázquez, J. Rivas, M. Pintado and M. T. Moreira, Insight into antibiotics removal: exploring the photocatalytic performance of a Fe3O4/ZnO nanocomposite in a novel magnetic sequential batch reactor, J. Environ. Manage., 2019, 237, 595–608 Search PubMed.
- R. Saravanan, M. M. Khan, V. K. Gupta, E. Mosquera, F. Gracia, V. Narayanan and A. J. R. A. Stephen, ZnO/Ag/Mn2O3 nanocomposite for visible light-induced industrial textile effluent degradation, uric acid and ascorbic acid sensing and antimicrobial activity, RSC Adv., 2015, 5, 34645–34651 Search PubMed.
- M. Hassanpour, H. Safardoust-Hojaghan and M. Salavati-Niasari, Rapid and eco-friendly synthesis of NiO/ZnO nanocomposite and its application in decolorization of dye, J. Mater. Sci.: Mater. Electron., 2017, 28, 10830–10837 Search PubMed.
- M. Hassanpour, H. Safardoust-Hojaghan and M. Salavati-Niasari, Nano-sized CuO/ZnO hollow spheres: synthesis, characterization and photocatalytic performance, J. Mater. Sci.: Mater. Electron., 2017, 28, 14678–14684 Search PubMed.
- E. E. El-Katori, E. A. Kasim and D. A. Ali, Sol–gel synthesis of mesoporous NiO/ZnO heterostructure nanocomposite for photocatalytic and anticorrosive applications in aqueous media, Colloids Surf. A Physicochem. Eng. Asp., 2022, 636, 128153 Search PubMed.
- Z. Zhang, C. Shao, X. Li, C. Wang, M. Zhang and Y. Liu, Electrospun nanofibers of p-type NiO/n-type ZnO heterojunctions with enhanced photocatalytic activity, ACS Appl. Mater. Interfaces, 2010, 2, 2915–2923 Search PubMed.
- A. J. Haider, R. Al Anbari, H. M. Sami and M. J. Haider, Photocatalytic Activity of Nickel Oxide, J. Mater. Res. Technol., 2019, 8, 2802–2808 CrossRef CAS.
- H. Abbas, K. Nadeem, A. Hafeez, A. Hassan, N. Saeed and H. Krenn, A comparative study of magnetic, photocatalytic and dielectric properties of NiO nanoparticles synthesized by sol-gel and composite hydroxide mediated method, Ceram. Int., 2019, 45, 17289–17297 CrossRef CAS.
- A. Akbari, Z. Sabouri, H. A. Hosseini, A. Hashemzadeh, M. Khatami and M. Darroudi, Effect of nickel oxide nanoparticles as a photocatalyst in dyes degradation and evaluation of effective parameters in their removal from aqueous environments, Inorg. Chem. Commun., 2020, 115, 107867 CrossRef CAS.
- J. Liu, Y. Li, J. Ke, S. Wang, L. Wang and H. Xiao, Black NiO-TiO2 nanorods for solar photocatalysis: recognition of electronic structure and reaction mechanism, Appl. Catal., B, 2018, 224, 705–714 CrossRef CAS.
- X. San, M. Li, D. Liu, G. Wang, Y. Shen, D. Meng and F. Meng, A facile one-step hydrothermal synthesis of NiO/ZnO heterojunction microflowers for the enhanced formaldehyde sensing properties, J. Alloys Compd., 2018, 739, 260–269 CrossRef CAS.
- E. E. El-Katori, E. A. Kasim and D. A. Ali, Sol–gel synthesis of mesoporous NiO/ZnO heterostructure nanocomposite for photocatalytic and anticorrosive applications in aqueous media, Colloids Surf. A Physicochem. Eng. Asp., 2022, 636, 128153 CrossRef CAS.
- J. Wu, C. Luo, D. Li, Q. Fu and C. Pan, Preparation of Au nanoparticle-decorated ZnO/NiO heterostructure via nonsolvent method for high-performance photocatalysis, J. Mater. Sci., 2017, 52, 1285–1295 CrossRef CAS.
- Z. Li, B. Hou, Y. Xu, D. Wu, Y. Sun, W. Hu and F. Deng, Comparative study of sol–gel-hydrothermal and sol–gel synthesis of titania–silica composite nanoparticles, J. Solid State Chem., 2005, 178, 1395–1405 CrossRef CAS.
- N. Bai, X. Liu, Z. Li, X. Ke, K. Zhang and Q. Wu, High-efficiency TiO2/ZnO nanocomposites photocatalysts by sol–gel and hydrothermal methods, J. Sol-Gel Sci. Technol., 2021, 99, 92–100 CrossRef CAS.
- B. B. Salem, G. Essalah, S. B. Ameur, B. Duponchel, H. Guermazi, S. Guermazi and G. Leroy, Synthesis and comparative study of the structural and optical properties of binary ZnO-based composites for environmental applications, RSC Adv., 2023, 13(9), 6287–6303 RSC.
- C. A. Schneider, W. S. Rasband and K. W. Eliceiri, NIH Image to ImageJ: 25 years of image analysis, Nat. Methods, 2012, 9, 671–675 CrossRef CAS PubMed.
- M. M. B. Mohagheghi, N. Shahtahmasebi and M. R. Alinejad, The Scherrer formula for X-ray particle size determination, Phys. Rev., 1939, 56, 978–982 CrossRef.
- S. Sachdeva, N. Budhiraja, V. Kumar and S. K. Singh, X-ray analysis of NiFe2O4 nanoparticles by Williamson–Hall and size–strain plot method, J. Adv. Phys., 2017, 6, 492–495 CrossRef.
- J. E. Ayers, The measurement of threading dislocation densities in semiconductor crystals by X-ray diffraction, J. Cryst. Growth, 1994, 135, 71–77 CrossRef CAS.
- Y. Wang, L. Cai, Y. Li, Y. Tang and C. Xie, Structural and photoelectrocatalytic characteristic of ZnO/ZnWO4/WO3 nanocomposites with double heterojunctions, Phys. E Low-dimens. Syst. Nanostruct., 2010, 43, 503–509 Search PubMed.
- A. O. Juma, E. A. A. Arbab, C. M. Muiva, L. M. Lepodise and G. T. Mola, Synthesis and characterization of CuO-NiO-ZnO mixed metal oxide nanocomposite, J. Alloys Compd., 2017, 723, 866–872 CrossRef CAS.
- T. Tangcharoen, W. Klysubun and C. Kongmark, Synthesis of nanocrystalline NiO/ZnO heterostructured composite powders by sol-gel auto combustion method and their characterizations, J. Mol. Struct., 2018, 1156, 524–533 Search PubMed.
- A. O. Juma and A. Matibini, Synthesis and structural analysis of ZnO-NiO mixed oxide nanocomposite prepared by homogeneous precipitation, Ceram. Int., 2017, 43, 15424–15430 CrossRef CAS.
- N. R. Reddy, P. M. Reddy, J. H. Jung and S. W. Joo, Construction of various morphological ZnO-NiO S-scheme nanocomposites for photocatalytic dye degradation, Inorg. Chem. Commun., 2022, 146, 110107 CrossRef.
- J. Xie, H. Wang, M. Duan and L. Zhang, Synthesis and photocatalysis properties of ZnO structures with different morphologies via hydrothermal method, Appl. Surf. Sci., 2011, 257(15), 6358–6363 CrossRef CAS.
- M. Thommes, K. Kaneko and A. V. Neimark, et al., Physisorption of gases, with special reference to the evaluation of surface area and pore size distribution (IUPAC Technical Report), Pure Appl. Chem., 2015, 87, 1051–1069 Search PubMed.
- B. Zhao, J. Song, T. Fang, P. Liu, Z. Jiao, H. Zhang and Y. Jiang, Hydrothermal method to prepare porous NiO nanosheet, Mater. Lett., 2012, 67(1), 24–27 Search PubMed.
- Y. Ren, Z. Ma, L. Qian, S. Dai, H. He and P. G. Bruce, Ordered crystalline mesoporous oxides as catalysts for CO oxidation, Catalysis Lett., 2009, 131, 146–154 Search PubMed.
- J. C. Ragain Jr and W. M. Johnston, Accuracy of Kubelka-Munk reflectance theory applied to human dentin and enamel, J. Dent. Res., 2001, 80, 449–452 Search PubMed.
- J. Tauc, R. Grigorovici and A. Vancu, Optical properties and electronic structure of amorphous germanium, Phys. Stat., 1966, 15, 627–637 CrossRef CAS.
- J. Al Boukhari, L. Zeidan, A. Khalaf and R. Awad, Synthesis, characterization, optical and magnetic properties of pure and Mn, Fe and Zn doped NiO nanoparticles, Chem. Phys., 2019, 516, 116–124 CrossRef CAS.
- R. Javed, M. Usman, S. Tabassum and M. Zia, Effect of capping agents: structural, optical and biological properties of ZnO nanoparticles, Appl. Surf. Sci., 2016, 386, 319–326 CrossRef CAS.
- S. Yasmeen, F. Iqbal, T. Munawar, M. A. Nawaz, M. Asghar and A. Hussain, Synthesis, structural and optical analysis of surfactant assisted ZnO–NiO nanocomposites prepared by homogeneous precipitation method, Ceram. Int., 2019, 45, 17859–17873 CrossRef CAS.
- M. M. Sabzehmeidani, H. Karimi and M. Ghaedi, Electrospinning preparation of NiO/ZnO composite nanofibers for photodegradation of binary mixture of rhodamine B and methylene blue in aqueous solution: central composite optimization, Appl. Organomet. Chem., 2018, 32, 4335 CrossRef.
- R. K. Sharma, D. Kumar and R. Ghose, Synthesis of nanocrystalline ZnO–NiO mixed metal oxide powder by homogeneous precipitation method, Ceram. Int., 2016, 42, 4090–4098 CrossRef CAS.
- T. Munawar, F. Iqbal, S. Yasmeen, K. Mahmood and A. Hussain, Multi metal oxide NiO-CdO-ZnO nanocomposite–synthesis, structural, optical, electrical properties and enhanced sunlight driven photocatalytic activity, Ceram. Int., 2019, 46, 2421–2437 CrossRef.
- J. I. Pankove, I. Jacques and A. David, Optical Processes in Semiconductors, J. Electrochem. Soc., 1972, 119, 156 CrossRef.
- S. A. Empedocles, R. Neuhauser, K. Shimizu and M. G. Bawendi, Photoluminescence from single semiconductor nanostructures, Adv. Mater., 1999, 11, 1243–1256 Search PubMed.
- M. Kahouli, N. Tounsi, N. Mzabi, H. Guermazi and S. Guermazi, Enhanced structural and optical properties of ZnO nanopowder with tailored visible luminescence as a function of sodium hydroxide to zinc sulfate mass ratio, Adv. Powder Technol., 2018, 29, 325–332 Search PubMed.
- Y. C. Zhang, Z. Li, L. Zhang, L. Pan, X. Zhang, L. Wang, A. Fazal and J. J. Zou, Role of oxygen vacancies in photocatalytic water oxidation on ceria oxide: experiment and DFT studies, Appl. Catal., B, 2018, 224, 101–108 CrossRef CAS.
- Y. Gao, L. Bai, X. Zhang and F. Yang, Non‐Parallel photo‐assisted electrocatalysis mechanism of SnS2/NiO heterojunction for efficient electrocatalytic oxygen evolution Reaction, Chem. Electro. Chem., 2021, 8, 2087–2093 Search PubMed.
- P. Zhu, X. Yin and X. Gao, Enhanced photocatalytic NO removal and toxic NO2 production inhibition over ZIF-8-derived ZnO nanoparticles with controllable amount of oxygen vacancies, Chin. J. Catal., 2021, 42, 175–183 CrossRef CAS.
- R. Zamiri, A. Kaushal, A. Rebelo and J. M. F. Ferreira, Er doped ZnO nanoplates: synthesis, optical and dielectric properties, Ceram. Int., 2014, 40, 1635–1639 CrossRef CAS.
- J. M. McKay and V. E. Henrich, Structure of valence and conduction levels in NiO, Phys. Rev. Lett., 1984, 53, 2343 Search PubMed.
- J. P. Shubha, S. F. Adil, M. Khan, M. R. Hatshan and A. Khan, Facile Fabrication of a ZnO/Eu2O3/NiO-Based Ternary Heterostructure Nanophotocatalyst and Its Application for the Degradation of Methylene Blue, ACS Omega, 2021, 6, 3866–3874 CrossRef CAS PubMed.
- A. Das, P. Mathan Kumar, M. Bhagavathiachari and R. G. Nair, Hierarchical ZnO-TiO2 nanoheterojunction: a strategy driven approach to boost the photocatalytic performance through the synergy of improved surface area and interfacial charge transport, Appl. Surf. Sci., 2020, 534, 147321 Search PubMed.
- C. Luo, D. Li, W. Wu, Y. Zhang and C. Pan, Preparation of porous micro–nano-structure NiO/ZnO heterojunction and its photocatalytic property, RSC Adv., 2014, 4, 3090–3095 Search PubMed.
- A. Houas, H. Lachheb, M. Ksibi, E. Elaloui, C. Guillard and J.-M. Herrmann, Photocatalytic degradation pathway of methylene blue in water, Appl. Catal., B, 2001, 31, 145–157 CrossRef CAS.
- V. V. Shvalagin, A. L. Stroyuk and S. Y. Kuchmii, Photochemical synthesis of ZnO/Ag nanocomposites, J. Nanopart. Res., 2006, 9, 427–440 CrossRef.
- S. Sharma, V. Dutta, P. Singh, P. Raizada, A. Rahmani-Sani, A. Hosseini-Bandegharaei and V. K. Thakur, Carbon quantum dot supported semiconductor photocatalysts for efficient degradation of organic pollutants in water: a review, J. Clean. Prod., 2019, 228, 755–769 CrossRef CAS.
- J. Khan, S. Ilyas, B. Akram, K. Ahmad, M. Hafeez, M. Siddiq and M. A. Ashraf, ZnO/NiO coated multi-walled carbon nanotubes for textile dyes degradation, Arab. J. Chem., 2017, 11, 880–896 CrossRef.
Footnote |
| † Electronic supplementary information (ESI) available. See DOI: https://doi.org/10.1039/d5ra00756a |
| This journal is © The Royal Society of Chemistry 2025 |