
 Open Access Article
 This Open Access Article is licensed under a Creative Commons Attribution-Non Commercial 3.0 Unported Licence
Study on the microscopic mechanism of CO2 flooding in deep high-temperature, high pressure, ultra-high water-cut reservoirs: a case study of the X-1 reservoir
Haiying Liao
SINOPEC Petroleum Exploration & Production Research Institute, Beijing 100083, China. E-mail: liaohy.syky@sinopec.com
First published on 9th May 2025
Abstract
Deep high-temperature, high-pressure, ultra-high water-cut reservoirs face a series of problems, such as rapid production decline, fast water invasion rate, and low sweep efficiency. Therefore, it is urgent to change the development mode and further improve recovery efficiency. In this work, a novel micro-visualization experimental method was developed to elucidate the micro-displacement mechanisms in CO2 injection reservoirs. In situ nuclear magnetic resonance experiments were employed to assess micro-scale sweep efficiency. The results showed that CO2 could effectively expand microscopic sweep efficiency, significantly improve crude oil mobilization in medium and large pores, and slightly mobilize previously unrecoverable oil in small pores, thereby effectively reducing remaining oil saturation and increasing displacement efficiency by 12.8%.
1 Introduction
Deep oil and gas resources refer to those located at depths exceeding 3500 meters.1–4 In recent years, onshore development in China has been advancing steadily into deep oil and gas reservoirs.5,6 However, deep high-temperature, high-pressure reservoirs with an oil–water volume ratio greater than 100 during the ultra-high water cut period face a series of challenges, such as rapid production decline, fast water invasion rate, low sweep efficiency, and scattered distribution of remaining oil.7–9 Enhancing recovery from deep high-temperature, high-pressure reservoirs during the ultra-high water cut period has emerged as a major challenge due to its complexity and severity.Xu et al.,10 using the Tazhong 402 CIII reservoir as an example, investigated the micro-mechanism of EOR by gas injection through slim tube, long core displacement, and micro-visual displacement experiments. The results showed that miscible flooding could not be achieved by natural gas injection under the current formation conditions. However, natural gas flooding following light hydrocarbon flooding could significantly improve oil recovery. The oil displacement mechanisms of CO2 injection primarily involve viscosity reduction and interfacial tension (IFT) lowering to enhance fluid mobility, oil swelling through dissolution, and mass transfer-driven extraction of light hydrocarbon components from crude oil.11,12 Displacement efficiency fundamentally depends on CO2–crude oil interaction dynamics, particularly the diffusion, dispersion, and dissolution capabilities of CO2 in hydrocarbon systems.
Experimental investigations using nuclear magnetic resonance (NMR) by Zhao13 and Chen14 demonstrated that miscible CO2 flooding reduced the oil mobilization threshold pressure while improving phase permeability. Their work revealed that the CO2 front created a localized “oil bank” effect, effectively suppressing CO2 viscous fingering and channeling while enhancing CO2 sweep efficiency in microporous networks. Wei15 identified two critical pressure thresholds governing component extraction: light fractions (C2–C10) at P1, intermediate components (C10–C19) between P1 and P2, and heavy constituents (C20–C29) above P2. Seyyedsar16 et al. observed through heavy oil experiments that CO2 preferentially extracted light fractions, forming a low-viscosity CO2-rich oil phase that improved flow dynamics. Molecular dynamics simulations by Liu17 et al. identified nanoconfinement effects that inhibited CO2 self-aggregation, enhancing oil compatibility and reducing the minimum miscibility pressure (MMP) by 22.94% compared to bulk conditions. Complementary numerical modeling by Song18 et al. demonstrated that nanoscale confinement promoted CO2 penetration into micropores, significantly improving dissolution and extraction capacities during water-alternating-gas (WAG) processes. Di19 et al. developed a novel parallel CO2 geological storage simulator, and also investigated the advantages of the compositional fluid model in simulating gas-brine systems, including the efficiency of phase equilibrium calculations and the diversity of injection gas species.
Hao et al.20 proposed a stable N2 foam to assist the CO2 displacement process, established a three-dimensional heterogeneous model, and conducted N2 foam-assisted CO2 flooding experiments after edge water injection. The results showed that this method can effectively improve the recovery efficiency of edge-water heterogeneous reservoirs. Wang et al.21 proved that in heterogeneous oil reservoirs with bottom water, the intrinsic mechanism of enhanced oil recovery is to change the pressure distribution in the formation to effectively utilize the energy of the bottom water. Although the above methods can effectively solve the problem of low oil recovery in the ultra-high water cut period, the realization of engineering technology will be challenging in deep reservoirs, and the development cost will be greatly increased. However, when CO2 is in supercritical state, it has strong solubility and extraction, and forms a miscible state with the oil phase, reducing the interfacial tension and viscosity of crude oil, and thus efficiently improving oil recovery.22–25 In addition, high temperature and high-pressure systems in deep reservoirs provide an excellent miscible environment for CO2, and high salinity formation water can effectively sequester CO2.
CO2 flooding is a crucial technology for enhancing oil recovery and is applicable to a wide range of reservoir types. However, there are limited studies on CO2 injection in sandstone reservoirs with deep burial, high temperature and salinity, and strong bottom water. The experimental mechanisms and displacement effects of CO2 injection in these reservoirs remain unclear. Therefore, this paper takes the X-1 reservoir as an example to carry out a series of researches on the mechanism of CO2 micro-displacement in deep high-temperature high-pressure ultra-high water cut reservoirs. Firstly, the minimum miscible pressure of CO2 and crude oil under formation temperature and pressure is calculated by a long and thin tube experiment. Interfacial tension measurements are conducted to investigate the interfacial properties between distinct phases under high-temperature, high-pressure (HTHP) conditions, and to assess the technical feasibility of implementing CO2 flooding in deep reservoir formations characterized by extreme thermobaric conditions and ultra-high water saturation. Finally, based on the microscopic visualization experiment and nuclear magnetic resonance experiment, the mechanism of CO2 micro-displacement in a deep high-temperature and high-pressure ultra-high water cut reservoir is revealed.
2 Experimental design
2.1 Experimental instruments and samples
Experimental instruments: high temperature and high pressure interfacial tensiometer (working temperature 0–200 °C, maximum working pressure 70 MPa), long and thin tube sand filling model (diameter 4.4 mm, length 15 m, permeability 860 mD, porosity 27.7%), experimental equipment for CO2 dissolution and diffusion in porous media (including a physical model of porous media sand filling, constant pressure injection pump, intermediate vessel, heating system, gas–liquid separator, and gas chromatograph), and high temperature and high pressure microscopic visualization device (working temperature is 0–200 °C, maximum working pressure is 70 MPa).Experimental materials: petroleum ether, CO2 with a purity of 99.9%, CH4 with a purity of 99%, and toluene. The experimental oil is composed of the dewatered and degassed crude oil in the X-1 reservoir with a density of 1.025 g cm−3 and a viscosity of 3.04 mPa s under formation temperature (108.5 °C) and pressure (21.2 MPa). The water used in the experiment is simulated formation water, belonging to high salinity CaCl2 type water, with a total salinity of 210![[thin space (1/6-em)]](https://www.rsc.org/images/entities/char_2009.gif) 000 mg L−1.
000 mg L−1.
2.2 Experimental methods
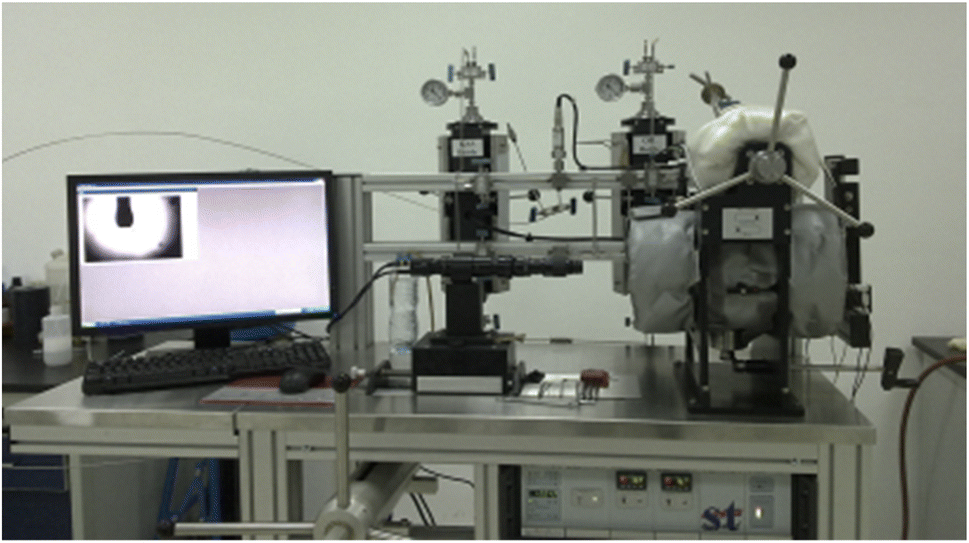 | ||
| Fig. 1 High-temperature and high-pressure interfacial tensiometer device. | ||
The specific experimental steps are as follows:26 ① the entire experimental system is cleaned with petroleum ether. After cleaning, the remaining petroleum ether is purged with hot nitrogen gas, and then the system is evacuated; ② the crude oil manual sample transfer pump is used to transfer the oil sample to the crude oil injection pump at constant pressure, and the pressure is kept above the bubble point pressure to prevent crude oil degassing; ③ CO2 is injected into the system and vented three times to remove the remaining nitrogen, and then heating is started; ④ when the temperature reaches 108.5 °C, CO2 gas is slowly introduced into the hanging drop chamber and pressed to the required pressure with a manual pump, and the valve is closed until the pressure in the hanging drop chamber is stable; ⑤ the crude oil injection pump is used to slowly press the crude oil into the hanging drop chamber, and small oil droplets form at the probe, and are kept for a period of time. The image of oil droplets is taken by using a magnifying camera system. The retention time of each oil drop is not less than 15 min, and at least 3 oil droplets are photographed. The equilibrium interfacial tension is calculated using software. ⑥ The experimental conditions are replaced and steps ①–⑤ are repeated until all experimental schemes are completed and the experiment is over.
 | ||
| Fig. 2 Minimum miscible pressure measurement instrument. | ||
The specific experimental steps are as follows: ① the long and thin tube sand filling model is heated to the formation temperature of 108.5 °C and then vacuumed; ② the prepared oil sample is injected into the long and thin tube sand filling model, and the amount of saturated oil in the model is recorded after saturation balance; ③ the back pressure is raised to the predetermined pressure through the manual pump, the pump is opened to carry out CO2 flooding under constant pressure, and the outlet valve of the thin tube is opened; ④ during the displacement process, oil production, gas production and gas injection should be measured regularly. When the cumulative gas injection is greater than 1.2 PV, the displacement should be stopped; ⑤ after the displacement, toluene and petroleum ether are directly injected into the long and thin tube, the thin tube is cleaned, and then the pipeline is blow-dried with high pressure air. Steps ①–④ are repeated to carry out the long and thin tube sand filling model experiment at the next pressure point.
 | ||
| Fig. 3 Schematic of porous media models: (a) single-pore model; (b) parallel channel model. | ||
 | ||
| Fig. 4 High-temperature and high-pressure micro-oil displacement experimental device: ((a) temperature control system, (b) piston pump, (c) intermediate container, (d) water bath, (e) digital video camera, (f) microscope, (g) filling model, (h) light source, (i) microscopic model holder, (j) back-pressure valve, (k) collector). | ||
The specific experimental steps are as follows:27 ① the model is loaded into a high-pressure gripper, and the annular space and the model are both evacuated at the same time; ② the spontaneous imbibition method is used to saturate the annular space first. After it becomes stable, water is pumped into both the annular space and the model at a low pressure using a pump until liquid comes out of the model; ③ the oil sample is connected with the model for oil saturation. ④ CO2 flooding: firstly, the injection ends of the model and the annular space are closed. Then, the original fluid in the pipeline is emptied. Subsequently, the pressure at the injection end is raised to 21 MPa. At the same time, the injection ends of the model and the annular space are opened to carry out gas displacement. ⑤ Model pressure release: after the experiment is completed, the back pressure is first gradually released. Meanwhile, the vent valve at the injection end is opened and the pressure is released synchronously until it reaches the normal pressure. ⑥ The experimental model is replaced and the experimental steps ①–⑤ are repeated until the displacement of both models is completed. Then the experiment is finished.
 | (1) |
 is the surface relaxation,
  is the volume relaxation, and
  is the diffusion relaxation. Due to the large surface relaxation rate, diffusion relaxation and volume relaxation are particularly small and can be ignored. The correlation between the T2 spectral curve and the pore radius r can be calculated from the transverse relaxation rate ρ and the shape factor F.32–34 The surface relaxivity (ρ) can be determined by correlating pore diameter distributions obtained from mercury intrusion porosimetry (MIP) or gas adsorption methods with NMR T2 relaxation spectra. The key formula linking these parameters is derived as follows:
 | (2) |
Combined with the above formula, the calculated relationship between transverse relaxation time and pore radius is shown in formula (4):
 | (3) |
3 Results and discussion
3.1 Study on the characteristic mechanism of the CO2–crude oil interface under high temperature and high pressure
In order to clarify the variation of interfacial tension between CO2 and crude oil under formation pressure, the minimum CO2 miscible pressure under formation pressure of the target reservoir is measured. A plot of displacement efficiency versus displacement pressure at 1.2 pore volume injected is constructed. The pressure corresponding to the intersection of the curves in the immiscible and miscible segments is identified as the minimum miscibility pressure (MMP).The variation curve of the recovery degree of long and thin pipes under different pressure conditions is shown in Fig. 5. As can be seen from the figure, with the gradual increase of CO2 injection pressure, the recovery degree gradually increases, and when the injection pressure is greater than a certain value, the increase rate of the cumulative recovery slows down.
 | ||
| Fig. 5 Minimum miscible pressure test curve. The blue triangles represent the non-miscible zones, indicating the oil displacement efficiency under displacement pressure. The purple circles represent the miscible zones, indicating the oil displacement efficiency under displacement pressure. | ||
In order to clarify the influence of pressure variation on the interface characteristics between CO2 and crude oil, the interfacial tension between CO2 and crude oil under different pressure conditions is measured, and the experimental results are shown in Fig. 6 and 7. As can be seen from the figure, with the increase of system pressure, the interaction process between CO2 and crude oil gradually intensifies, resulting in that the interface between CO2 and crude oil is no longer stable. When the pressure reaches 17 MPa (close to the minimum miscible pressure), the mutual extraction between CO2 and crude oil becomes obvious, and the light components in crude oil are extracted away. To validate the accuracy of the slim-tube experiment results, a one-dimensional displacement slim-tube model is established using reservoir simulation software to simulate the slim-tube experiment process. Alternatively, relevant empirical formulas can be used for verification. In this paper, the empirical formula method is adopted, and the MMP is calculated as follows:35
| pmm = 1.5832 + 0.19038T − 0.00031986T2 | (4) |
 | ||
| Fig. 6 Interface relationship between CO2 and crude oil under different pressure conditions. | ||
 | ||
| Fig. 7 Curve of interfacial tension between CO2 and crude oil as a function of pressure. | ||
The calculation result of the empirical formula is 18.5 MPa. The two sets of results are basically in good agreement.
When the pressure reaches 21 MPa (exceeding the minimum miscible pressure), the interface between CO2 and crude oil becomes blurred, and most of the light components in the crude oil are extracted. Further analysis shows that the high-temperature and high-pressure reservoir in the target area can provide a higher pressure between the CO2 and crude oil system, thus improving the extraction efficiency of CO2 to the crude oil, promoting the dissolution of CO2 in the crude oil, and making the crude oil quickly reach the miscible state, thus greatly improving the oil washing efficiency.
In addition, as CO2 continues to extract light components from crude oil, CO2 will also continue to diffuse and dissolve into crude oil, and this process will lead to continuous variation in the interfacial tension between CO2 and crude oil. Therefore, the variation curve of the interfacial tension between CO2 and crude oil over time under the condition of 23 MPa is drawn, as shown in Fig. 8. It can be seen from the figure that the interfacial tension between CO2 and crude oil is large at the initial contact stage, and the interface between CO2 and crude oil is obvious. With the extension of the contact time, the interfacial tension gradually decreases, and CO2 continuously extracts the light components in the crude oil and diffuses and dissolves into the crude oil. After several times of extraction and dissolution, the interface between CO2 and crude oil finally reaches a dynamic equilibrium state (i.e. miscible state).
 | ||
| Fig. 8 Relationship between interfacial tension of CO2 and crude oil with time at 23 MPa. | ||
Since oil, gas, and water phases coexist in the actual CO2 flooding process in the reservoir, it is so important to clarify the characteristics of interfacial tension of the multiphase system. The values of interfacial tension of different systems are shown in Fig. 9. As can be seen from the figure, the interfacial tension of oil and gas in the multiphase system is the lowest (1.515 mN m−1), followed by the gas–water interfacial tension (12.795 mN m−1), and the largest is the oil–water interfacial tension (19.97 mN m−1). The oil samples in the target work area are mainly non-polar hydrocarbons with similar molecular polarity to CO2, and the intermolecular interactions are weak. After injecting CO2, the solubility of CO2 molecules in the oil phase is high. With the increase of pressure, the solubility of CO2 molecules in the oil phase increases, and the interfacial tension gradually decreases. The lower interfacial tension enhances the fluidity of CO2 in the oil phase, reduces flow resistance, and improves the oil displacement efficiency of CO2. When the pressure is higher than the minimum mixing pressure (MMP), the interfacial tension of the oil–gas system can be reduced to zero, achieving mixing.
 | ||
| Fig. 9 Interfacial tension values under different system conditions. | ||
Water is a highly polar molecule with a significant difference in polarity compared to oil or gas, resulting in stronger intermolecular forces. Therefore, the interfacial tension of oil–water and gas–water systems is higher; in the gas–water system, the interaction force between water molecules is weak, but the polarity of water molecules is strong, resulting in a higher interfacial tension between gas and water, which is lower than the interfacial tension between oil and water. The high interfacial tension results in poor fluidity of CO2 in the aqueous phase, making it easy to form bubbles or oil droplets, leading to increased flow resistance.
After CO2 injection into the reservoir, due to the difference in interfacial tension field, the injected CO2 will preferentially dissolve with the oil, thus effectively solving the problem that the remaining oil in the reservoir cannot be used again during the ultra-high water cut period.
3.2 Study on the characteristics of CO2 microscopic mobilization of crude oil under high temperature and high-pressure conditions
 | ||
| Fig. 10 Displacement process of CO2 and crude oil in a single-pore model: (a) the initial stage of CO2 injection, (b) CO2 dissolution and diffusion, (c) CO2 dispersed phase, (d) CO2 quasi-continuous phase, (e) CO2 continuous phase, (f) the end of CO2 injection. | ||
The microscopic CO2 flooding process in the parallel channel model is shown in Fig. 11. It can be seen from Fig. 11(a–c) that at the initial stage of displacement, CO2 is dissolved in crude oil, and the color of crude oil changes significantly, indicating that CO2 and crude oil are dissolved and extracted. When the amount of CO2 injected further increases, the dissolved CO2 of the crude oil reaches the saturated state, and the crude oil is a continuous phase while the CO2 is a dispersed phase. In the process, the CO2 is gradually dissolved in the crude oil, which is dominated by dissolution and extraction. As can be seen from Fig. 11(d), with the further increase of CO2 injection amount, CO2 first displaces the crude oil in the large pore size and finally breaks through, thus forming a continuous CO2 phase in the large pore size. At the same time, CO2 is gradually dissolved in the crude oil with a small pore size, and in this process, the displacement effect is dominant, with the dissolution and extraction being supplementary. It can be seen from Fig. 11(e–f) that the remaining oil in the large pore is attached to the wall in the form of oil film in the late displacement period, and there is more remaining oil in the small pore. Under the action of CO2 dissolution, the viscosity of the crude oil in the small pore gradually decreases, and the viscous resistance decreases and the oil is finally displaced. Meanwhile, the remaining oil on the wall of the large pore is further displaced out under the action of CO2 dissolution and extraction. During the whole displacement process, the color of the crude oil becomes obviously lighter, indicating that under this pressure, CO2 and crude oil reach a miscible state. Before the breakthrough, the dissolution and extraction are dominant, and after the breakthrough, the displacement is dominant, and the dissolution and extraction are supplementary.
 | ||
| Fig. 11 Displacement process of CO2 and crude oil in the parallel channel model: (a) the initial stage of CO2 injection, (b) CO2 dissolution and diffusion, (c) CO2 dispersed phase, (d) CO2 quasi-continuous phase, (e) CO2 continuous phase, (f) the end of CO2 injection. | ||
 | ||
| Fig. 12 Pore size distribution curves of water flooding at different times. | ||
Fig. 13 illustrates the variation in T2 signal intensity during CO2 injection at the ultra-high water-cut stage. The T2 signal intensity for medium, large, and small pores declines progressively as CO2 drainage continues. Movable oil in medium and large pores is significantly reduced, and immovable oil in small pores also decreases to some extent. Monitoring the residual oil saturation in the core reveals that the initial crude oil saturation is 78%. Following water flooding to a water cut of 98%, residual oil saturation decreases to 44%, and further declines to 34% after CO2 flooding. The application of CO2 flooding not only enhances oil displacement efficiency but also improves micro-sweep efficiency, displacing residual oil in small pore spaces.
 | ||
| Fig. 13 Pore size distribution curves of CO2 flooding at different times. | ||
4 Conclusions
(1) Through visual experiments, we revealed the mechanism by which CO2 flooding enhances oil recovery under CO2–crude oil miscible conditions. CO2 preferentially dissolves into the crude oil within the pores, causing the oil to expand and generate elastic potential energy, which drives the oil outflow. As CO2 injection continues, it overflows from the oil in the pores, nucleates, and aggregates into slugs; simultaneously, it extracts light components from the oil and, under the driving force of pressure difference, promotes oil displacement. In the later stages of CO2 injection, CO2 continuously strips and carries residual oil adhering to the pore walls through extraction and displacement, thereby improving recovery rates.(2) Reducing pore radius lowers the minimum miscibility pressure (MMP) between CO2 and crude oil. Moreover, smaller pore radius enhances the solubility of CO2 in crude oil and intensifies the elastic expansion energy generated during initial contact. In heterogeneous pore structures, CO2 flooding in the later stages mainly produces oil from small pores through continuous extraction effects.
(3) Adsorption of crude oil on pore walls results in residual oil, forming an oil film on the pore surfaces. Nuclear magnetic resonance (NMR) experiments demonstrated that CO2 flooding mobilizes crude oil less effectively in small pores (0.1–1.6 μm), confirming that as the pore radius decreases, the pore-specific surface area increases oil adsorption.
Data availability
This research is supported by the National Key R&D Program of China, “The potential and demonstration feasibility of bioenergy with carbon capture and storage”. This project is currently in the confidential stage. Data for the article cannot be made available due to legal confidentiality requirements.Conflicts of interest
The authors declare no competing financial interests.Acknowledgements
This research was supported by the National Key R&D Program of China, “The potential and demonstration feasibility of bioenergy with carbon capture and storage” (2022YFE0115800). The authors thank Dr Rui Wang and Maolei Cui of the SINOPEC Petroleum Exploration & Production Research Institute in Beijing, China, for their valuable cooperation in this study.References
- H. Fang, Acta Geol. Sin. (Engl. Ed.), 2022, 96, 15 Search PubMed.
- S. Li, H. Ji, Z. Wan, X. Pang, H. Zhang, T. Xu and Y. Zhou, J. Pet. Sci. Eng., 2021, 203, 108669 CrossRef CAS.
- X. Zhang, Z. Qi, B. Wang, Y. Zhou, C. Wang, C. Xi and P. Liu, Front. Energy Res., 2024, 12, 1375108 CrossRef.
- S. Yuan and Q. Wang, Petrol. Explor. Dev., 2018, 45, 698–711 CrossRef.
- R. Qiao and Z. Chen, Fuel, 2022, 326, 124978 CrossRef CAS.
- X. Zhou, Energy Explor. Exploit., 2023, 31, 429–457 CrossRef.
- Q. Lei, X. U. Yun, Z. Yang, B. Cai and S. Li, Petrol. Explor. Dev., 2021, 48, 221–231 CrossRef.
- L. Sun, C. Zou, R. Zhu, Y. Zhang, S. Zhang and B. Zhang, Pet. Explor. Dev., 2013, 40, 641–649 Search PubMed.
- A. N. Junior, G. N. Queiroz and M. G. Godoy, Geoenergy Sci. Eng., 2023, 223, 211508 CrossRef CAS.
- Y. Xu, R. Wang, L. Chang, D. Zhou, Z. Wu, Z. Yan, G. Shao and Y. Li, Pet. Sci. Technol., 2024, 42, 1638–1655 CrossRef CAS.
- N. Kumar, M. A. Sampaio, K. Ojha, H. Hoteit and A. Mandal, Fuel, 2022, 330, 125633 CrossRef CAS.
- J. M. Ekundayo and S. G. Ghedan, SPE Reservoir Characterization and Simulation Conference and Exhibition, 2013, DOI:10.2118/165966-MS.
- Y. Zhao, Y. Zhang, X. Lei, Y. Zhang and Y. Song, Energy, 2020, 117878 CrossRef CAS.
- H. Chen, X. Liu, C. Zhang, X. Tan, R. Yang, S. Yang and J. Yang, Energy, 2022, 239, 122287 CrossRef CAS.
- B. Wei, H. Gao, W. Pu, F. Zhao, Y. Li, F. Jin, L. Sun and K. Li, J. Mol. Liq., 2017, 232, 277–284 CrossRef CAS.
- S. M. Seyyedsar and M. Sohrabi, J. Mol. Liq., 2017, 241, 199–210 CrossRef CAS.
- B. Liu, X. Lei, D. Feng, M. Ahmadi, Z. Wei, Z. Chen and L. Jiang, Sep. Purif. Technol., 2025, 356, 129826 CrossRef CAS.
- Y. Song, Z. Song, Y. Meng, Z. Chen, X. Han and D. Feng, Chem. Eng. J., 2024, 484, 149679 CrossRef CAS.
- C. Di, Y. Wei, K. Wang, B. Liu, P. Deng, Z. Sun, X. Lei and Z. Chen, Sci. Total Environ., 2024, 177065 CrossRef CAS.
- H. Hao, J. Hou, F. Zhao, H. Huang and H. Liu, RSC Adv., 2021, 11, 1134–1146 RSC.
- Y. Jiao, J. Wang, H. Liu, Y. Liu and G. Yong, J. Pet. Sci. Eng., 2016, 10, 971–982 Search PubMed.
- W. Sun, J. Li, Q. Liu, B. Liang, J. Liu and Y. Lei, Fuel, 2024, 369, 131798 CrossRef CAS.
- H. Xu, F. Wang, Y. Liu, X. Meng and L. Liu, Fuel, 2024, 376, 132695 CrossRef CAS.
- Q. Liu, J. Li, B. Liang, W. Sun, J. Liu and Y. Lei, Sustainability, 2023, 15, 12959 CrossRef CAS.
- F. Wang, X. Meng, H. Xu, Y. Liu and L. Liu, Fuel, 2025, 381, 133592 CrossRef CAS.
- Q. Liu, J. Liu, G. Pei, Z. Zhu and Y. Lei, Adv. Civ. Eng., 2020, 12, 1–10 Search PubMed.
- S. Wu, Petrol. Explor. Dev., 2002, 29, 66–68 Search PubMed.
- Q. Liu, J. Liu, B. Liang, W. Sun, J. He and Y. Lei, Lithosphere, 2022, 1, 6245345 CrossRef.
- Q. Liu, R. Song, J. Liu, G. Pei and Y. Lei, Energy Rep., 2020, 6, 3067–3079 CrossRef.
- D. Lang, Z. Lun, C. Lv, H. Wang and Q. Zhao, Petrol. Explor. Dev., 2021, 48, 703–712 Search PubMed.
- Q. Liu, J. Li, B. Liang, J. Liu, W. Sun, J. He and Y. Lei, Energy, 2023, 275, 127434 CrossRef.
- M. Li, V. W. S. Lim, S. Z. A. Ghafri, N. Ling, A. R. Adebayo, E. F. May and M. L. Johns, J. Pet. Sci. Eng., 2022, 214, 110515 CrossRef CAS.
- M. Yang, S. Huang, F. Zhao, H. Sun and X. Chen, Energy, 2024, 130781 CrossRef CAS.
- Q. Liu, R. Song, J. Liu, Y. Lei and X. Zhu, Energy Sci. Eng., 2020, 8, 1840–1856 CrossRef CAS.
- W. F. Yellig and R. S. Metcalfe, J. Pet. Technol., 1980, 32, 160–168 CrossRef CAS.
| This journal is © The Royal Society of Chemistry 2025 |