DOI:
10.1039/D5RA00067J
(Paper)
RSC Adv., 2025,
15, 10442-10452
Disodium EDTA-capped AuNP-engineered cotton pad as a colorimetric probe for formalin detection†
Received
4th January 2025
, Accepted 28th March 2025
First published on 7th April 2025
Abstract
Formalin, an organic chemical containing a mixture of carbon, hydrogen, and oxygen, is a formaldehyde solution in water that is widely used as a preservative because of its antibacterial qualities. Despite being used to extend the shelf life and conceal product deterioration, it may be harmful to customers. In light of these factors, a portable, sensitive, accurate, and user-friendly platform for formalin detection is suggested here. The present study utilizes a colorimetric approach that involves the use of disodium ethylenediaminetetraacetic acid (EDTA)-capped gold nanoparticles (AuNPs) and a smartphone. A cotton pad with AuNa2EDTA integrated served as the substrate for formalin adsorption. The colorimetric image is then converted into RGB values using the graphical editor software, GNU Image Manipulation Program (GIMP), to detect formalin. A noticeable color shift was seen during the detection process: the hue changed from red-wine to purplish-blue as the formalin content rose, indicating the development of the AuNa2EDTA–HCHO complex. This result provides a low detection limit of 0.11 μM and a sensitive linear correlation between 1/R values and various formalin concentrations, with a linear fit coefficient of 0.99607. The present study represents the first attempt, to the best of our knowledge, to report on the experimental activation energy of gold nanoparticles capped with Na2EDTA as well as the application of this nanostructure as a formalin detection platform. The developed system has a great potential of being used in clinical settings for the detection of formalin.
1. Introduction
Formalin, a term widely used by vendors worldwide, is an aqueous solution of formaldehyde with a concentration of 37%.1 With a global production of more than 52 million tons annually, formalin (FA) is one of the most commonly utilized chemicals in the chemical industry.2 Formalin was gradually used illegally as a preserving agent by the food industries such as fisheries. There have been reports of a thriving fish trade treated with formalin.3 Previous research shows that formalin treatment reduces the quality of protein in fish tissue even while it can prevent bacterial invasion.4,5 The majority of formalin produced is used to make resins based on formalin for pressed wood goods like particleboard, panels, and furniture. Because of its antimicrobial and preservation qualities, formalin is also frequently utilized in mortuaries, medical labs, and several personal care and consumer products. Because it is a by-product of the burning of organic molecules, it can also be found in outdoor air at lesser concentrations due to combustion sources including woodstoves and refineries, as well as vehicle exhaust and tobacco smoke. Nonetheless, the environments where formalin is generated or used have the highest concentration levels.6 Owing to the toxicity of formalin, the World Health Organization (WHO) has also set restrictions on formalin exposure, with a maximum of 0.08 ppm averaged over 30 minutes. Additionally, an 8 hour workday's admissible formalin exposure limit of 0.75 ppm has been established by the Occupational Safety and Health Administration (OSHA).7 While exposure to 25–100 ppm for 5–10 min may result in significant harm to the lower respiratory tract, recovery from these brief effects is rapid.8 Furthermore, formalin was added to the list of substances known to cause cancer in humans by the US National Toxicology Program in 2011.9 Carcinogenesis and sensitization are the main issues associated with repeated exposure to formalin (FA). FA can trigger contact dermatitis and asthma in individuals who are susceptible to it. Long-term inhalation of low-level FA is unlikely to cause chronic lung harm in non-sensitized individuals. Long-term exposure has been linked to negative effects on the central nervous system, including an increased risk of headache, depression, mood swings, sleeplessness, irritability, attention deficiency, and memory, dexterity, and balance problems. Human FA exposure has been linked to a higher incidence of nasopharyngeal carcinoma.10,11
The common methods used to detect formalin are spectrophotometry,12 high performance liquid chromatography,13 laser-induced fluorescence spectroscopy,14 capillary electrophoresis,15 conductometry,16–18 and enzyme-based biosensors.19–21 Despite the great sensitivity and accuracy of these approaches, the cost of analysis is considerable due to the need for complex lab facilities and lengthy processing times. Additionally, there are several drawbacks such as poor selectivity and dependability when interference is present, complicated operations, immobility, or challenges with continuously monitoring. Furthermore, it is not possible to take extremely sophisticated instruments to an area for on-site sampling, such as a local market. In this situation, portable instruments could be a useful way to solve the issue. As they can quickly generate findings from on-site sampling, portable equipment is becoming increasingly intriguing. Electrochemical sensing, colorimetry, and fluorometry are common analytical techniques used for on-site testing. Various kinds of nanoparticles, either functionalized or not, are employed in the detecting process. AgNPs are employed in Cu2+ and Mn2+ detection.22 Nevertheless, a lot of pertinent questions remain unanswered in spite of their growing influence on the market. The lack of standardized techniques and materials, the physicochemical parameters underpinning AgNPs' toxicity to prokaryotes, the molecular mechanisms controlling AgNPs–bacteria interactions, and the uncertainty surrounding the definition of general strategies to develop intelligent antibacterial medications and devices based on nano silver are some of these.23 ZnNPs have been employed in modified screen-printed carbon electrodes as a promising insulin detection sensor.24 One of the most detrimental impacts of zinc nanoparticles is their tendency to accumulate in aquatic environments. It enters the food chain and lowers the reproductive rate of the animals. The aquatic ecology is harmed by the heavy metals released as the zinc nanoparticles break down. Additionally, it significantly hinders aquatic plants' ability to photosynthesise.25 Literature revealed that glutathione was rapidly detected using colorimetric analysis with magnetic FeNPs that exhibited peroxidase-like activity.26 Dispersed FeNPs, however, frequently result in unstable suspensions in culture media; hence, altering their surface chemistry—for instance, by adding rhodium citrate—can amplify their unfavorable effects, cytotoxicity, and absorption in cell cultures of breast cancer.27
The primary cause of the color shift in the colorimetric process is the significant surface plasmon resonance (SPR) activity of AuNPs, the most potent metal nanoparticle among the others.28 The exceptional qualities of this material, including its high surface-to-volume ratio, simple synthesis, high stability, distinct optical, catalytic, tunable size, biocompatibility, and electrical capabilities, make it a popular choice for the detection process.29–34 Colorimetric detection assisted by a smartphone has emerged as a promising solution for rapid and portable chemical analysis, including volatile organic compounds such as formalin. Colorimetric detection aided by a smartphone has emerged as a promising solution for rapid and portable chemical analysis, including volatile organic compounds such as formalin. Using the computer capability and photographic prowess of smartphones, this method generates quantitative and qualitative analyses based on color shifts generated by chemical interactions. With the technology that smartphones provide, color variations can be captured and analyzed, furthermore solutions for basic quantification can be acquired. Although gold nanoparticles present intriguing therapeutic prospects, oxidative stress, inflammation, and organ-specific toxicity may result from their interactions with human biological systems.35
EDTA is frequently used as a capping agent and to reduce Au3+ to Au0.36–39 When EDTA is added to water, it usually becomes inactive unless it is heated. Na2EDTA is more ionizable in Na2EDTA is more ionizable in water than EDTA. When used in small amounts as a food additive or in cosmetic compositions, disodium EDTA is safe. However, excessive exposure to Na2EDTA can result in a number of negative side effects, such as fever, low blood pressure, diarrhea, nausea, and skin problems. Nephrotoxicity may result when EDTA combines with heavy metals in the bloodstream and the kidneys filter the complexes out. Hypocalcemia results from a drop in the blood's serum calcium levels caused by Na2EDTA.40 In particular, Na2EDTA-capped AuNPs are synthesized and characterized in this work for smartphone-assisted formalin detection. One can rapidly and affordably identify changes in the characteristics of nanoparticles by taking pictures with the smartphone's built-in digital camera and using GIMP software to analyze the data. In this work, gold nanoparticles (AuNPs) encapsulated with disodium ethylenediaminetetraacetic acid (Na2EDTA) are combined with smartphone-assisted readout capabilities to propose a novel method for formalin detection. The present study represents the first attempt, to the best of our knowledge, to report on the experimental activation energy of gold nanoparticles capped with Na2EDTA as well as the application of this nanostructure as a formalin detection platform.
2. Experimental
2.1 Instrumentation and chemicals
All employed substances were of the highest purity or analytical grade. In this investigation, all of the solutions were prepared with distilled water. Chloroauric acid (HAuCl4·3H2O), 37% formalin and disodium EDTA (Na2EDTA) were obtained from Sigma Aldrich (St. Louis, USA). NaOH was purchased from Loba Chemie Pvt Ltd (India). After properly cleaning all glassware with freshly made aqua regia (3![[thin space (1/6-em)]](https://www.rsc.org/images/entities/char_2009.gif) :1 (v/v) HCl/HNO3), they were thoroughly washed with distilled water. The pH level was maintained by using a pH meter (model, company, city and country). The measurements of liquid sample were taken by using single channel digital micropipettes. The electronic absorption spectra were recorded on UV-vis Spectrometer (UV-19001 spectrophotometer, Shimadzu, Japan). For FT-IR studies, disodium EDTA-capped AuNPs were measured under the attenuated total reflectance mode (Model-IRSPRIT-T, Shimadzu, Japan). The morphology of the AuNPs was determined by using Scanning Electron Microscope, SEM machine (Model-JSM-IT100).
:1 (v/v) HCl/HNO3), they were thoroughly washed with distilled water. The pH level was maintained by using a pH meter (model, company, city and country). The measurements of liquid sample were taken by using single channel digital micropipettes. The electronic absorption spectra were recorded on UV-vis Spectrometer (UV-19001 spectrophotometer, Shimadzu, Japan). For FT-IR studies, disodium EDTA-capped AuNPs were measured under the attenuated total reflectance mode (Model-IRSPRIT-T, Shimadzu, Japan). The morphology of the AuNPs was determined by using Scanning Electron Microscope, SEM machine (Model-JSM-IT100).
2.2 Synthesis of AuNa2EDTA and fabrication of cotton-sensor
First AuNPs were synthesized by following the modified Frens method41 described in ESI.† Fig. S1† shows the synthesis process. Activation energy in the formation of AuNa2EDTA is deduced and illustrated in ESI.† Fig. S2† represents the time dependent UV-visible absorption spectra at different temperatures. To estimate the rate constant for different temperatures lnA as a function of time (T) were plotted displayed in Fig. S3.† Using Arrhenius equation, a plot of lnk vs. 1/T was plotted and slope was calculated to find the activation energy shown in Fig. S4.† Stability of the synthesized AuNa2EDTA was checked displayed in Fig. S5.† Even after six months stability of AuNa2EDTA retains. Silk cotton was used for the detection process of formalin. Approximately 1 g of dry cotton was taken for the process of sensing. Empty strip of medicine was taken as a holder of cotton so that it could give a definite shape of cotton. The dry cotton was kept in the empty strip of medicine. Then, about 200 μL of AuNPs was added on the cotton using a micropipette. The AuNPs was spread uniformly on the cotton. Next, 100 μL of formalin solution was added (dropwise) on that cotton-sensor. Optical image of cotton was taken shown in Fig. S6.†
2.3 The procedure for FA assay using colorimetric method
37% formalin was taken as the sample. For the detection process of formalin 5 different concentrations were prepared (10, 500, 600, 800 and 2 mM). Each of the concentrations was prepared in 50 mL stuck. The used volume of AuNPs and formalin solutions were 3 mL and 200 μL, respectively, in a sample cuvette for the spectroscopic analysis. For the colorimetric detection work, the volume of AuNPs and formalin solutions were 1 mL and 100 μL, respectively, on the cotton-sensor. One test of the detecting procedure employed a set of six cotton-sensor components. One end of the cotton side of the sensor piece was attached to an empty strip, and the other end with the sensor spot was submerged in the analyte solution (standard or sample) in order to expose the analyte solution.42 Digital pictures of the sensor components were captured with a smartphone (RMX3395, Realme UI 5.0). Each of the image was captured from the same distance so that the regulation of each image be same. The images were prepared for the RGB color system using GIMP Software. Each of the six pieces of the sensor give a linear fit correlation.
2.4 Density functional theory (DFT)
The adsorption characteristics of formalin on Au/Na2EDTA were assessed. All structures have been optimized using DFT within the Gaussian 16 software and visualized by GaussView 16, employing the B3LYP/LANL2DZ functional/basis set. With precise and closely align results with experimental observations, the B3LYP functional has been extensively utilized to assess the stability, electrical, and magnetic properties of nanomaterials. According to the frequency calculations, the structures were deemed fully optimized when no imaginary frequency was detected. Density of states (DOS) graphs were generated using Gauss sum.
3. Results and discussion
3.1 Characterization of AuNa2EDTA
The UV-visible absorption spectra of the produced AuNa2EDTA in water is displayed in Fig. 1(a). The characteristic SPR peak appeared at 524 nm, thus indicating the formation of AuNa2EDTA. A fluorescence emission peak was seen at 638 nm upon the excitation of AuNa2EDTA at 532 nm, as shown in Fig. 1(b). XRD spectra shows the presence of four characteristic intense peaks at 77°, 65°, 44°, and 38°, and, which correspond to the miller indices (311), (220), (200), and (111) in lattice planes, respectively, as displayed in Fig. 1(c). The relative intensities and sharpness of the peaks suggest a well-defined crystalline structure of the AuNa2EDTA. The presence of intense peaks of nanoparticles confirms that the AuNPs were crystallized in a natural way and also suggests that AuNPs are stable and well aggregated.43 The average crystallinity of the AuNPs was found to be 19.71. One drop of AuNa2EDTA dispersed solution was taken for ATR analysis and the results are represented in Fig. 1(d). The ATR spectrum shows the C![[double bond, length as m-dash]](https://www.rsc.org/images/entities/char_e001.gif) O with a stretching at a wavelength of 630 cm−1 and the O–H stretching at 3400 cm−1 signifies the presence of disodium EDTA on the AuNP cluster surface. Significant Raman peak nearby a wavelength of 478 nm confirms the formation of AuNa2EDTA as seen in Fig. 1(e). AFM image displays the morphological study of the synthesized AuNa2EDTA in Fig. 1(f). One can see that AuNa2EDTA have spherical shape with an average diameter of ∼26 nm. Fig. 1(g) displays the SEM image of AuNa2EDTA. From the data extracted from the SEM image analysis presented in the diameter distribution graph, it can be seen that AuNPs has an average diameter of 25.67 ± 0.30011 nm, as shown in Fig. 1(h). According to the EDX analysis shown in Fig. 1(i), it is evident that as the Au3+ was reduced by Na2EDTA, Na, H, C, O and Au were present. Au hits the higher percentage of about 91.37 signifies the well formation of the desired AuNa2EDTA.
O with a stretching at a wavelength of 630 cm−1 and the O–H stretching at 3400 cm−1 signifies the presence of disodium EDTA on the AuNP cluster surface. Significant Raman peak nearby a wavelength of 478 nm confirms the formation of AuNa2EDTA as seen in Fig. 1(e). AFM image displays the morphological study of the synthesized AuNa2EDTA in Fig. 1(f). One can see that AuNa2EDTA have spherical shape with an average diameter of ∼26 nm. Fig. 1(g) displays the SEM image of AuNa2EDTA. From the data extracted from the SEM image analysis presented in the diameter distribution graph, it can be seen that AuNPs has an average diameter of 25.67 ± 0.30011 nm, as shown in Fig. 1(h). According to the EDX analysis shown in Fig. 1(i), it is evident that as the Au3+ was reduced by Na2EDTA, Na, H, C, O and Au were present. Au hits the higher percentage of about 91.37 signifies the well formation of the desired AuNa2EDTA.
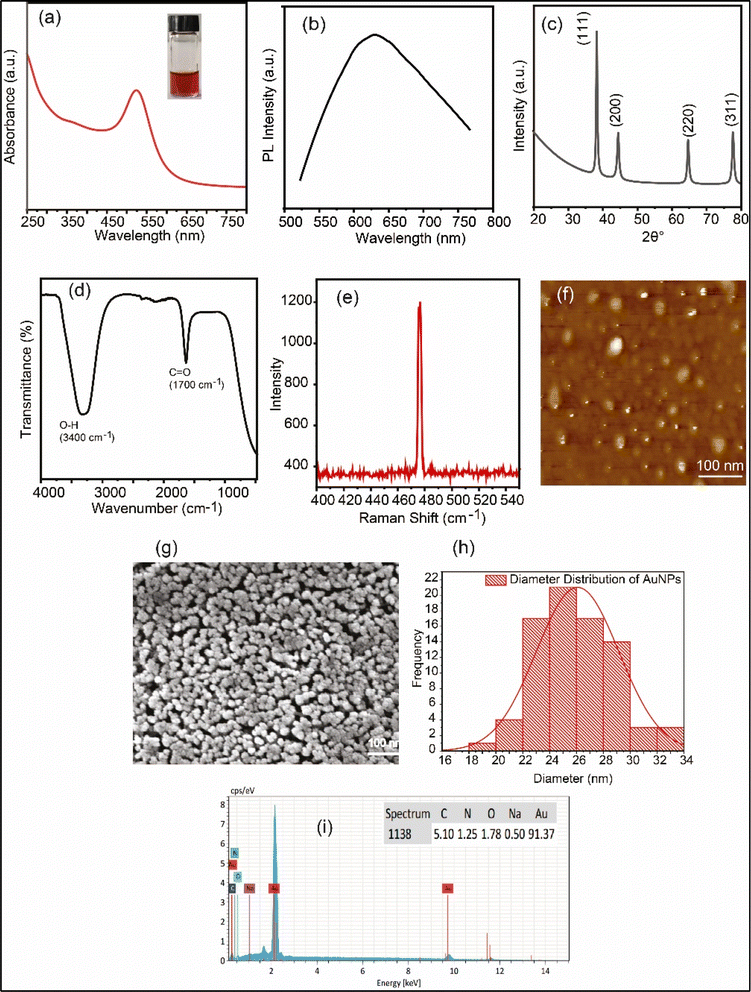 |
| | Fig. 1 (a) The UV-vis absorption spectrum of AuNa2EDTA. Inset shows the solution color; (b) photoluminescence spectrum of AuNa2EDTA; (c) the XRD analysis of the AuNPs (d) ATR spectrum of AuNa2EDTA (e) the Raman Spectrum of AuNPs; (f) AFM image of the synthesized AuNa2EDTA; (g) SEM image of AuNa2EDTA; (h) diameter distribution bar chart using ImageJ software; (i) EDX spectrum of AuNa2EDTA. Inset shows the elemental composition of AuNa2EDTA. | |
3.2 Characterization of AuNa2EDTA–HCHO
Fig. 2(a) shows the UV-visible absorption spectrum of AuNa2EDTA–HCHO. A broad SPR shoulder peak appears at a wavelength of ∼660 nm which signifies the aggregation of AuNa2EDTA after the addition of HCHO. The inset represents the solution color as blue while only AuNa2EDTA solution was red. Arrow represents the corresponding absorption maximum and test tube. Fig. 2(b) depicts the ATR data, which shows that although AuNa2EDTA and AuNa2EDTA–HCHO have the same functional groups (O–H, C–H, and CO), formalin introduces more vibrational modes at around 1100 cm−1. This mostly suggests that AuNa2EDTA and formalin chemically interacted, thus modifying the chemistry of the nanoparticles' surface, forming new facial chemical species. The XRD study of the AuNPs shows that their structure is face-centered cubic (FCC), as shown in Fig. 2(c). This structure is ideal for gold nanoparticles, as indicated by the peaks that appear at 2θ values corresponding to (111), (200), (220), and (311).43 Peak positions remained unchanged following the addition of formalin with AuNPs, although peak intensities and sharpness were altered. In contrast to the AuNa2EDTA peak displayed in Fig. 1(c), this peak is marginally less sharp. This observation suggests that AuNa2EDTA may experience a loss in crystallinity or an increase in size distribution. Fig. 2(d) shows the SEM image of the synthesized AuNa2EDTA, indicating an increase in particle size after the interaction with HCHO. According to the diameter distribution graph displayed in Fig. 2(e), after the aggregation of formalin on the surface of AuNa2EDTA, the average size increases and was found to be 35.25663 ± 0.25963 nm. Using a SEM image of AuNa2EDTA–HCHO, 80–90 randomly selected particles were examined to create the diameter distribution curve. Using the scale measurement function built in the ImageJ software, the diameter was manually chosen. Fig. 2(f) displays the EDX spectrum of AuNa2EDTA–HCHO. According to the EDX analysis, as the AuNa2EDTA was aggregated by formalin, the previous amount (%) of the Au on the surface of AuNa2EDTA was reduced. The unaggregated AuNa2EDTA contained 91% of Au while the aggregated AuNa2EDTA has 52.44%. The presence of Na, C, N, O, Au is evident as shown in inset. Red shift, or the shift toward longer wavelengths, was the outcome of increasing the diameter of spherical AuNa2EDTA.44 Due to the aggregation, the AuNPs changes color from wine-red to purplish-blue.45 Numerous AuNP-based colorimetric tests have been built on the substantial red shift (i.e., from ∼520 to ∼656 nm) and notable color change from red to blue/purplish-blue that results from AuNa2EDTA aggregation.46,47
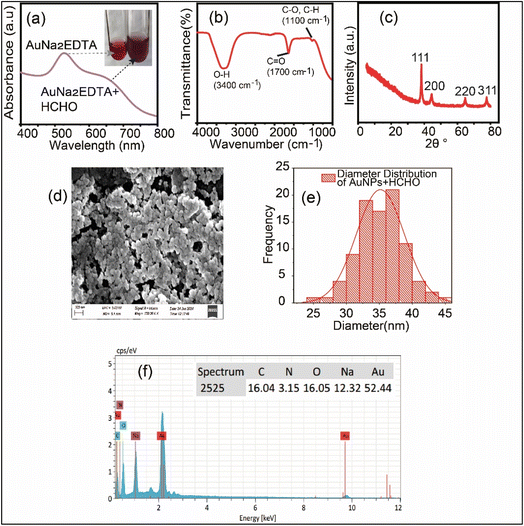 |
| | Fig. 2 (a). The UV-vis absorption spectrum of AuNa2EDTA–HCHO. Inset shows the solution color after HCHO addition; (b) ATR spectrum of AuNa2EDTA–HCHO; (c) the XRD analysis of the AuNPs; (d) SEM image of AuNa2EDTA–HCHO; (e) diameter distribution bar chart using ImageJ software; (f) EDX spectrum of AuNa2EDTA–HCHO. Inset shows the elemental composition of AuNa2EDTA–HCHO. | |
3.3 Thermodynamic study and adsorption mechanism by DFT
The adsorption characteristics of formalin on Au/Na2EDTA were assessed. All structures have been optimized using DFT within the Gaussian 16 software and visualized by GaussView 6, employing the B3LYP/LANL2DZ functional/basis set. The B3LYP functional has been extensively utilized to assess the stability, electrical, and magnetic properties of nanomaterials, as its results are precise and closely align with experimental observations. The structures were deemed fully optimized when no imaginary frequency was detected, according to frequency calculations. Density of states (DOS) graphs were generated using Gauss sum. First the structure of Au32 clusters were modelled and optimized by DFT methods as shown in Fig. 3(a). Second the structure of Na2EDTA ligands and Au clusters were modelled and optimized by DFT as seen in Fig. 3(b). Finally, the AuNa2EDTA–HCHO was modelled and optimized seen in Fig. 3(c). The binding energy between formalin and AuNa2EDTA is computed using eqn (1):| | |
ΔEads = Ecomplex − (Eadsorbate + Eadsorbent)
| (1) |
Eads denotes binding energy, Ecomplex indicates the total energy of the formalin complex on AuNa2EDTA, Eadsorbate represents the total energy of formalin, and Eadsorbent refers to the total energy of AuNa2EDTA. The following were used to calculate entropy changes (ΔS), Gibbs free energy changes (ΔG), and enthalpy changes (ΔH):| | |
ΔH = Hcomplex − (Hadsorbate + Hadsorbent)
| (2) |
| | |
ΔG = Gcomplex − (Gadsorbate + Gadsorbent)
| (3) |
| | |
ΔS = (ΔH − ΔG)/T, T = 298.15 K
| (4) |
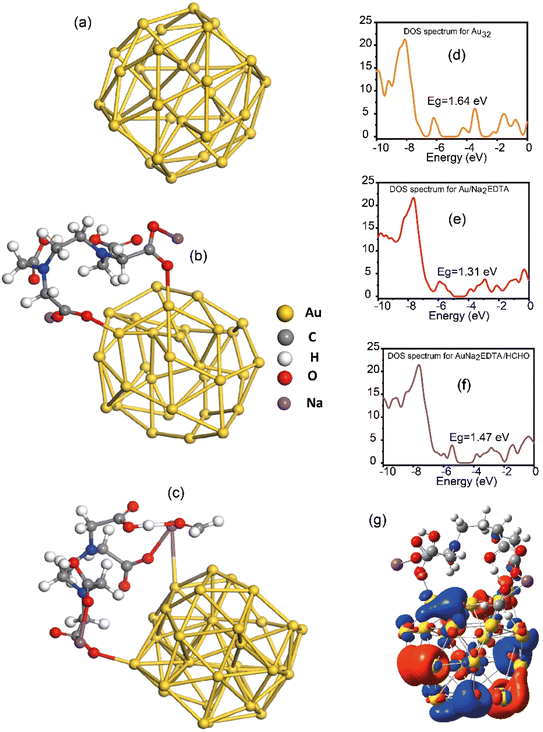 |
| | Fig. 3 Optimized structures of (a) golden fullerene Au32, (b) AuNa2EDTA, (c) AuNa2EDTA–HCHO, and DOS of (d) golden fullerene Au32, (e) AuNa2EDTA and (f) AuNa2EDTA–HCHO, (g) MEP map of AuNa2EDTA–HCHO. | |
The minimal distances between the O atom in formalin and the Na atom, as well as the H atom in AuNa2EDTA, indicate a more efficient contact between the adsorbate and adsorbent, measuring 2.28 Å and 1.6 Å, respectively. The adsorption energy of formalin on AuNa2EDTA is −0.5122 eV. The dipole moment of the formalin@AuNa2EDTA complex increased relative to the pure AuNa2EDTA due to alterations in electron density on the AuNa2EDTA. The dipole moments of formalin@AuNa2EDTA and AuNa2EDTA are 14.610886 Debye and 13.507168 Debye, respectively. The current data suggest that formalin adsorption on AuNa2EDTA is primarily categorized as physisorption. The charge transfer from formalin to the AuNa2EDTA combination has resulted in an enhanced dipole moment of formalin within the complex. The energies of the HOMO and LUMO are determined by the DOS spectrum for the investigation of electron orbitals, as shown in Fig. 3(d)–(f). The HOMO and LUMO energies of formalin@AuNa2EDTA are −5.30 eV and −3.83 eV, respectively. The Eg in the combination exhibited a modest alteration in comparison to AuNa2EDTA. Molecular electrostatic potential (MEP) analysis helps identify the optimal site for effective adsorption of formalin on AuNa2EDTA, as shown in Fig. 3(g). Blue and red areas stand for positive and negative charge densities, respectively. Based on the MEP map, the adsorption energy of formalin on AuNa2EDTA is expected to be favorable due to the presence of negative (red) and positive (blue) regions. The ionization potential, electron affinity, hardness and chemical potential for formalin@AuNa2EDTA complex were found to be 5.30 eV, 3.83 eV, 0.735 eV, and −4.565 eV, respectively. All the data combined confirm the physisorption of the formalin on AuNa2EDTA. Thermodynamic calculations for formalin@AuNa2EDTA were conducted at standard temperature (T = 298.15 K) and pressure (1 atm). The variations in entropy (ΔS), Gibbs free energy (ΔG), and enthalpy (ΔH) were assessed utilizing vibrational frequencies. The thermodynamic analysis indicates that the adsorption reaction of formalin on AuNa2EDTA is exothermic, with ΔH, ΔG, and ΔS values of −52.811, 7.199, and −0.201 kJ mol−1, respectively, for the production of the formalin@AuNa2EDTA complex.
3.4 Colorimetric detection of formalin
3.4.1 Integration of AuNa2EDTA with formalin and determination of LOD. The decision to employ a cotton pad platform for quantification was motivated by the notable color change of AuNa2EDTA caused by aggregation in the presence of formalin. The cotton pad functionalized by AuNa2EDTA was connected to a smartphone in order to monitor the changes in RGB values when the wine-red color of the AuNPs turns purple. The overall design for a color filter that consists of RGB (red, green, and blue) filters with individual pixel resolutions is called a Bayer mosaic.48 Each pixel has a combination of the RGB color filters, each of which has a distinct wavelength between 600 and 700 nm (R), 500 and 600 nm (G), and 400 and 500 nm (B). An absolute scale ranging from 0 to 255 represents the intensity of every color.49 All three colors—Red, Green, and Blue (RGB)—have standard RGB values ranging from 0 to 255. With [255,255,255] representing pure white and [0,0,0] representing absolute black, respectively, is the scale's number.50 A smartphone application known as GIMP software was installed in order to use the smartphone assisted RGB detection. The color contrast (R) and color change monitoring were made easier by the software. A functionalized cotton pad was loaded with various concentrations of formalin; Fig. 4(a) displays images of the functional formalin concentration. A depiction of smartphone is shown in Fig. 4(b). A retort stand with clamp was used to fix the smartphone for maintaining the same distant click for every sample represented in Fig. 4(c). The formalin concentrations shown in Fig. 4(d) were used to plot a calibration curve as 1/R. From the graph it is seen that, a good linearity range within 200 to 1000 μM was obtained with the R2 = 0.99358. The 1/R values vs. concentration of HCHO graph provided a slope of 1.40 × 10⁻⁴ and standard error of 5.04 × 10⁻⁶. Using a limit of detection of 3α/slope, the LOD was estimated in this case, using the IUPAC standard. Where α is the standard error, slope denotes the slope of the fitted straight line. Therefore, the LOD value for formalin was calculated as following:
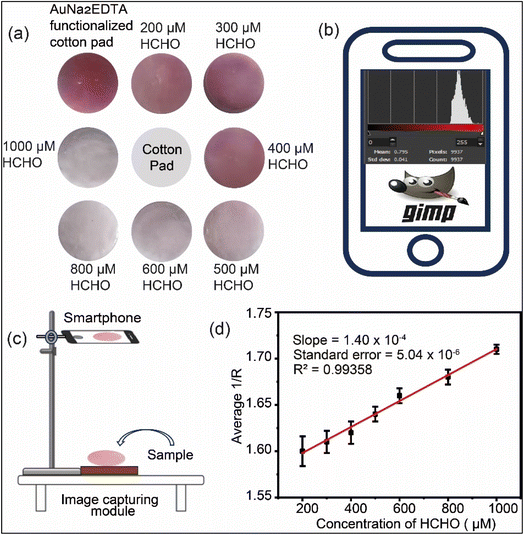 |
| | Fig. 4 (a) Photos taken by smartphone of cotton pad, cotton pad functionalized by AuNa2EDTA and incorporation of various concentrations of formalin on the AuNa2EDTA functionalized cotton pad; (b) illustration of a GIMP software supported smartphone; (c) process of taking photos; (d) a calibration curve of average 1/R as a function of formaldehyde concentrations. | |
3.4.2 Real sample analysis. The developed cotton-based sensor was imposed on a real sample to verify the feasibility for real time application. Banana (locally known as Sagar banana) fruit collected from local market located in Khulna, Bangladesh, was selected as the candidate for real sample. Fig. 5(a) describes the process of extraction formalin from the banana. Before being dried using tissue paper, the sample was cleaned with distilled water. During the first stage, the second banana was sliced. In order to achieve a light crimson tint, four 27 gram banana slices were submerged in 30 mL of water in a beaker for 30 minutes during the second step. The sample was filtered using Whatman 45 filter paper in step 3, and the filtrate was stored for later use. Next, 2 mL of AuNa2EDTA solution was taken in a vial in which a few drops of banana extract were added dropwise. When standard formalin was added to the AuNa2EDTA solution, as depicted in Fig. 5(b), the color of the solution changed to a purplish-blue hue. So, it is evident that the banana extract contains formaldehyde. Here the interaction between oxygen atom of formalin, and sodium and hydrogen atoms of EDTA are zoomed in, as shown in Fig. 5(b). However, the presence of formaldehyde in banana extract and its aggregation effect on AuNa2EDTA were confirmed by the ATR and UV-visible spectroscopy shown in Fig. 5(c) and (d), respectively. The ATR data shows that formalin adds extra vibrational modes at about 1100 cm−1 compared to the AuNa2EDTA, thus signifying the successful adsorption of formalin. Furthermore, a UV-visible absorption peak at ∼660 nm was observed similar to the peak present in Fig. 2(a), which further confirm the adsorption of formalin on the AuNa2EDTA surface.
 |
| | Fig. 5 (a) Stepwise banana extract extraction process; (b) addition of banana extract into AuNa2EDTA changed solution color from wine red to purplish-blue. Responsible main ingredients for the corresponding color are shown; (c) absorption spectrum of synthesized AuNa2EDTA (black), standard formaldehyde (blue), banana extract (purple), after addition of banana extract in AuNa2EDTA (green); (d) ATR spectrum of banana extract. | |
AuNa2EDTA engineered cotton pad was implied to quantify the formaldehyde found in the banana extract. Adding a 100 μL of banana extract resulted in the change of the cotton pad color from red to purplish-blue as displayed in Fig. 6(a). The 1/R value for the banana extract incorporated AuNa2EDTA was estimated to be 1.62 by GIMP software. Using this 1/R value, the corresponding concentration was determined to be 330 μM or 9.9 ppm from the previously plotted calibration curve displayed in Fig. 6(b). The present finding seems consistent with the previously reported work where banana (AAB genome of Musa spp.) was investigated and formaldehyde was estimated to be 14.8 ± 1.1 by spectroscopic method.51
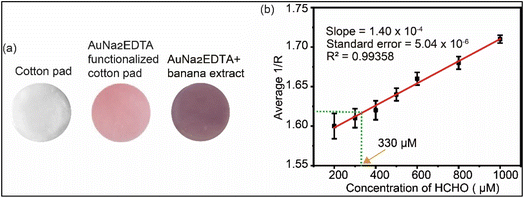 |
| | Fig. 6 (a) Photographs taken by smartphone of cotton pad, cotton pad functionalized by AuNa2EDTA and incorporation of banana extract on the AuNa2EDTA functionalized cotton pad; (b) a calibration curve of average 1/R as a function of formaldehyde concentrations showing the concentration of formaldehyde in banana extract. | |
Table 1 presents a comparison of colorimetric formaldehyde sensing with previously published research work. The developed platform adheres to the earlier methods. However, there are still certain limitations such as: (i) the cotton fiber distribution was not uniform; (ii) the cotton pad's surface locations for AuNa2EDTA adsorption were not uniform; and (iii) all of the pictures were shot during the day. More research and future work are necessary to overcome the aforementioned constraints. This can pave the way for the introduced cotton-pad-based platform for more advanced detection methods within clinical settings.
Table 1 A comparison of the LOD's of various formalin sensing methods
| Methods |
Materials |
Limit of detection (LOD) (ppb) |
References |
| Colorimetric |
Chromotropic acid |
2.00 |
52 |
| Sulfuric acid salt of hydroxylamine |
10 |
53 |
| 4-Amino-3-penten-2-one |
40 |
19 |
| AgNCs |
840 |
54 |
| Netting (ESN) nylon 6 nano-fiber |
50 |
55 |
| Thiols, polyamines, silica nanoparticles, squaraine dye |
36 |
56 |
| Biodegradable film made with tapioca starch |
46–78 |
57 |
| Gold nanoparticles (AuNPs) coupled with Tollens reagent |
1.5 |
58 |
| Films that decompose using chitosan and starch |
5 |
59 |
| Na2EDTA capped AuNPs |
3.3 |
This work |
In terms of cost, the price of the HAuCl4·3H2O is $300 per g from sigma Aldrich. About 4 mg of HAuCl4·3H2O was used to prepare 50 mL of AuNPs solution after synthesis. For each of the cotton-pad only 1 mL gold solution was used for the colorimetric formaldehyde detection which costs only about $0.024. On the other hand, Na2EDTA (ethylenediaminetetraacetic acid disodium salt) is inexpensive and widely available chelating agent which is cost <$1 per gram. As it is water-based synthesis process that minimizes expensive organic solvents. Na2EDTA enables a simple, one-pot synthesis, reducing labor and processing costs. Besides, Na2EDTA offers enhanced stability, reducing the need for additional stabilizers.
4. Conclusions
A straightforward, affordable, swift, and portable detection method is urgently needed to measure and regulate the amount of formalin present in various food products. In order to accomplish this, a sensitive and straightforward sensor based on the Na2EDTA@AuNPs nanostructure is suggested for the both qualitative and quantitative colorimetric identification of formalin in aqueous solution. Due to the complex-induced aggregation of nanoparticles, Na2EDTA capped AuNPs exhibit a high selectivity towards formalin, as seen by a color change that is visible to the naked eye, which shifts from red to purplish-blue. This allows for the detection of formalin with a developed cotton-pad based colorimetric approach, with a limit of detection of 3.3 ppb. Furthermore, to the best of our knowledge, the present study represents the first attempt to report on the experimental activation energy of gold nanoparticles capped with Na2EDTA as well as the application of this nanostructure as a formalin detection platform.
Data availability
Data that support the findings of this study are available from the corresponding author upon reasonable request.
Author contributions
Evana Sultana: conceptualization, data curation, formal analysis, writing original draft; Md. Zewel Rana: data curation, formal analysis; Muhammad Shamim Al Mamun: conceptualization, formal analysis, methodology, supervision, writing and reviewing original draft; Mohamed Aly Saad Aly: conceptualization, writing and reviewing original draft; Ghada E. Khedr: software, reviewing original draft; Md Nasiruddin: data curation, reviewing original draft; Md. Zaved Hossain Khan: writing and reviewing original draft.
Conflicts of interest
There is no conflict of interest regarding the work.
Acknowledgements
Authors love to acknowledge Chemistry Discipline, Khulna University for the facilities and lab support to pursue this research. Also authors show sincere thanks to the Bibliotheca Alexandrina on its High-Performance Computing (HPC) infrastructure to support us.
References
- R. Thavarajah, V. K. Mudimbaimannar, J. Elizabeth, U. K. Rao and K. Ranganathan, Int. J. Oral Maxillofac. Pathol., 2012, 16, 400–405 CrossRef PubMed.
- I. C. Ehrhart, P. E. Parker, W. J. Weidner, J. M. Dabney, J. B. Scott and F. J. Haddy, Am. J. Physiol., 1975, 229, 754–760 CrossRef CAS PubMed.
- S. Sanyal, K. Sinha, S. Saha and S. Banerjee, Arch. Pol. Fish., 2017, 25, 43–50 CrossRef CAS.
- M. L. Schwabbauer, Am. J. Med. Technol., 1975, 41, 457–462 CAS.
- J. M. Stein, Biochem. Pharmacol., 1975, 24, 1659–1662 CrossRef CAS PubMed.
- C. Martínez-Aquino, A. M. Costero, S. Gil and P. Gaviña, Molecules, 2018, 23, 2646 CrossRef PubMed.
- O. Bunkoed, F. Davis, P. Kanatharana, P. Thavarungkul and S. P. Higson, Anal. Chim. Acta, 2010, 659, 251–257 CrossRef CAS PubMed.
- M. Easwaran, J. D. Martinez, D. J. Ramirez, P. A. Gall and E. Erickson-DiRenzo, Toxicol Rep, 2021, 8, 920–937 CrossRef CAS PubMed.
- Lyon, IARC Monogr. Eval. Carcinog. Risks Hum., 2012, 100, 9–562 Search PubMed.
- P. G. Barbieri, C. Pezzotti, C. Bertocchi and S. Lombardi, Med. Lav., 2007, 98, 18–24 Search PubMed.
- M. R. Azari, P. Asadi, M. J. Jafari, H. Soori and V. Hosseini, Tanaffos, 2012, 11, 36–41 Search PubMed.
- W. Luo, H. Li, Y. Zhang and C. Y. Ang, J. Chromatogr. B:Biomed. Sci. Appl., 2001, 753, 253–257 Search PubMed.
- F. R. Rocha, L. H. Coelho, M. L. Lopes, L. R. Carvalho, J. A. da Silva, C. L. do Lago and I. G. Gutz, Talanta, 2008, 76, 271–275 Search PubMed.
- Y. I. Korpan, M. V. Gonchar, A. A. Sibirny, C. Martelet, A. V. El'skaya, T. D. Gibson and A. P. Soldatkin, Biosens. Bioelectron., 2000, 15, 77–83 CrossRef CAS PubMed.
- S. Dong and P. K. Dasgupta, Environ. Sci. Technol., 1986, 20, 637–640 Search PubMed.
- K. Mitsubayashi, G. Nishio, M. Sawai, T. Saito, H. Kudo, H. Saito, K. Otsuka, T. Noguer and J.-L. Marty, Sens. Actuators, B, 2008, 130, 32–37 Search PubMed.
- O. Demkiv, O. Smutok, S. Paryzhak, G. Gayda, Y. Sultanov, D. Guschin, H. Shkil, W. Schuhmann and M. Gonchar, Talanta, 2008, 76, 837–846 Search PubMed.
- M. J. Dennison, J. M. Hall and A. P. F. Turner, Analyst, 1996, 121, 1769–1773 Search PubMed.
- X. Wang, Y. Si, X. Mao, Y. Li, J. Yu, H. Wang and B. Ding, Analyst, 2013, 138, 5129–5136 RSC.
- H. L. C. Pinheiro, M. V. de Andrade, P. A. de Paula Pereira and J. B. de Andrade, Microchem. J., 2004, 78, 15–20 Search PubMed.
- S. Antwi-Boampong, J. S. Peng, J. Carlan and J. J. BelBruno, IEEE Sens. J., 2014, 14, 1490–1498 Search PubMed.
- G. Wu, C. Dong, Y. Li, Z. Wang, Y. Gao, Z. Shen and A. Wu, RSC Adv., 2015, 5, 20595–20602 CAS.
- L. Rizzello and P. P. Pompa, Chem. Soc. Rev., 2014, 43, 1501–1518 RSC.
- I. Šišoláková, J. Hovancová, F. Chovancová, R. Oriňaková, I. Maskaľová, A. Oriňak and J. Radoňak, Electroanalysis, 2021, 33, 627–634 Search PubMed.
- S. Sharma, P. Joshi, K. Aggarwal, K. K. Chaubey, A. K. Pal, D. K. Verma, R. Tripathi and A. Bachheti, in Metal and Metal-Oxide Based Nanomaterials: Synthesis, Agricultural, Biomedical and Environmental Interventions, ed. R. K. Bachheti, A. Bachheti and A. Husen, Springer Nature Singapore, Singapore, 2024, pp. 333–349, DOI:10.1007/978-981-99-7673-7_16.
- L. Zhang, J. Wang, C. Zhao, F. Zhou, C. Yao and C. Song, Sens. Actuators, B, 2022, 361, 131750 CrossRef CAS.
- N. L. Chaves, I. Estrela-Lopis, J. Böttner, C. A. Lopes, B. C. Guido, A. R. de Sousa and S. N. Báo, Int. J. Nanomed., 2017, 12, 5511–5523 CrossRef CAS PubMed.
- Z. Sadiq, S. H. Safiabadi Tali, H. Hajimiri, M. Al-Kassawneh and S. Jahanshahi-Anbuhi, Crit. Rev. Anal. Chem., 2023, 1–36, DOI:10.1080/10408347.2022.2162331.
- J. Feng, L. Chen, Y. Xia, J. Xing, Z. Li, Q. Qian, Y. Wang, A. Wu, L. Zeng and Y. Zhou, ACS Biomater. Sci. Eng., 2017, 3, 608–618 Search PubMed.
- P. L. Venugopalan, B. Esteban-Fernández de Ávila, M. Pal, A. Ghosh and J. Wang, ACS Nano, 2020, 14, 9423–9439 Search PubMed.
- W. A. Ameku, W. R. de Araujo, C. J. Rangel, R. A. Ando and T. R. L. C. Paixão, ACS Appl. Nano Mater., 2019, 2, 5460–5468 CrossRef CAS.
- Z. Hua, T. Yu, D. Liu and Y. Xianyu, Biosens. Bioelectron., 2021, 179, 113076 CAS.
- R. Wilson, Chem. Soc. Rev., 2008, 37, 2028–2045 Search PubMed.
- M. S. Draz and H. Shafiee, Theranostics, 2018, 8, 1985–2017 CAS.
- A. Sani, C. Cao and D. Cui, Biochem. Biophys. Rep., 2021, 26, 100991 CAS.
- S. Diamai and D. P. S. Negi, Mater. Res. Express, 2016, 3, 115002 Search PubMed.
- E. Saputra, Sens. Int., 2024, 100286, DOI:10.1016/j.sintl.2024.100286.
- H. Erdoğan, M. G. Bacanlı, B. Karayavuz, Ö. Eşim, M. Sarper, O. Erdem and Y. Özkan, J. Drug Delivery Sci. Technol., 2024, 97, 105794 Search PubMed.
- J. Venkatas and M. Singh, Adv. Nat. Sci.:Nanosci. Nanotechnol., 2024, 15, 015009 CAS.
- R. S. Lanigan and T. A. Yamarik, Internet J. Toxicol., 2002, 21(2), 95–142 CAS.
- H. Xia, Y. Xiahou, P. Zhang, W. Ding and D. Wang, Langmuir, 2016, 32, 5870–5880 CAS.
- S. R. Fahnestock, Biochemistry, 1975, 14, 5321–5327 CAS.
- S. Krishnamurthy, A. Esterle, N. C. Sharma and S. V. Sahi, Nanoscale Res. Lett., 2014, 9, 627 CrossRef PubMed.
- P. N. Njoki, I. I. S. Lim, D. Mott, H.-Y. Park, B. Khan, S. Mishra, R. Sujakumar, J. Luo and C.-J. Zhong, J. Phys. Chem. C, 2007, 111, 14664–14669 Search PubMed.
- Z. Huang, H. Wang and W. Yang, ACS Appl. Mater. Interfaces, 2015, 7, 8990–8998 Search PubMed.
- K. Saha, S. S. Agasti, C. Kim, X. Li and V. M. Rotello, Chem. Rev., 2012, 112, 2739–2779 CrossRef CAS PubMed.
- A. R. Esfahani, Z. Sadiq, O. D. Oyewunmi, S. H. Safiabadi Tali, N. Usen, D. C. Boffito and S. Jahanshahi-Anbuhi, Analyst, 2021, 146, 3697–3708 RSC.
- R. Lukac, K. N. Plataniotis and D. Hatzinakos, IEEE Trans. Circuits Syst., 2005, 15, 1475–1492 Search PubMed.
- N. Emmanuel, R. Haridas, S. Chelakkara, R. B. Nair, A. M. Gopi, M. Sajitha and K. Yoosaf, IEEE Sens. J., 2020, 20, 8512–8519 CAS.
- Y. Upadhyay, S. Bothra, R. Kumar and S. K. Sahoo, ChemistrySelect, 2018, 3, 6892–6896 CrossRef CAS.
- F. Nowshad, M. N. Islam and M. S. Khan, Agric. Food Secur., 2018, 7, 17 CrossRef.
- A. Pretto, M. R. Milani and A. A. Cardoso, J. Environ. Monit., 2000, 2, 566–570 RSC.
- C. Liao, M. Zhang, N. Gao, Q. Tian, J. Shi, S. Chen, C. Wang and L. Zang, Chemosensors, 2021, 9, 335 CrossRef CAS.
- K. Chaiendoo, S. Sooksin, S. Kulchat, V. Promarak, T. Tuntulani and W. Ngeontae, Food Chem., 2018, 255, 41–48 Search PubMed.
- X. Wang, Y. Si, J. Wang, B. Ding, J. Yu and S. S. Al-Deyab, Sens. Actuators, B, 2012, 163, 186–193 CrossRef CAS.
- S. El Sayed, L. s. Pascual, M. Licchelli, R. Martínez-Máñez, S. Gil, A. M. Costero and F. Sancenón, ACS Appl. Mater. Interfaces, 2016, 8, 14318–14322 Search PubMed.
- W. Wongniramaikul, W. Limsakul and A. Choodum, Food Chem., 2018, 249, 154–161 CrossRef CAS PubMed.
- J.-b. Zeng, S.-g. Fan, C.-y. Zhao, Q.-r. Wang, T.-y. Zhou, X. Chen, Z.-f. Yan, Y.-p. Li, W. Xing and X.-d. Wang, Chem. Commun., 2014, 50, 8121–8123 RSC.
- K. Rovina, J. M. Vonnie, S. N. Shaeera, S. X. Yi and N. F. A. Halid, Sens. Bio-Sens. Res., 2020, 27, 100310 CrossRef.
|
| This journal is © The Royal Society of Chemistry 2025 |
Click here to see how this site uses Cookies. View our privacy policy here. 
 Open Access Article
 This Open Access Article is licensed under a Creative Commons Attribution-Non Commercial 3.0 Unported Licence
 *ab,
Mohamed Aly Saad Aly
*ab,
Mohamed Aly Saad Aly


