DOI:
10.1039/D4RA08037H
(Paper)
RSC Adv., 2025,
15, 4657-4668
Exploring superior nonlinear optical properties of copper complexes with π-conjugated ligands: experimental and theoretical investigation†
Received
12th November 2024
, Accepted 14th January 2025
First published on 31st March 2025
Abstract
This study explores the nonlinear optical (NLO) properties of two synthesized copper complexes, {[Cu(dmp)2(H2O)]·(PA)2} (complex 1) and {[Cu(dmp)2]·(PA)} (complex 2), where dmp represents 2,9-dimethyl-1,10-phenanthroline (neocuproine) and PA refers to picric acid. Employing both experimental and theoretical approaches, we comprehensively analyzed their NLO properties. Experimentally, third-order NLO parameters were determined using the Z-scan technique with a 520 nm continuous-wave diode laser, yielding values of nonlinear refractive index (n2), nonlinear absorption coefficient (β), and third-order nonlinear optical susceptibility (χ(3)) on the order of 10−7 cm2 W−1, 10−3 cm W−1, and 10−6 esu, respectively. These findings underscore their significant optical nonlinearity and suitability for intensity-dependent NLO applications, as evidenced by their high values of negative refractive index. Density Functional Theory (DFT) investigations were performed at the M062X/(6-31G(d,p)/LanL2DZ)) level to evaluate key reactivity descriptors, including polarizability, hyperpolarizability, and dipole moment, which align with the experimental results. Conceptual DFT analysis reveals that complex 1 is more stable, while complex 2 exhibits higher reactivity. The strong hyperpolarizability and remarkable third-order NLO properties of these copper complexes demonstrate their potential for advanced photonic and optoelectronic applications.
1 Introduction
Nonlinear optical (NLO) materials are gaining popularity due to their potential applications in optical computing, optical limiters, logical devices, and optical signal processing.1,2 Consequently, significant emphasis has been placed on the design and synthesis of new NLO materials.3 NLO chromophores with superior hyperpolarizability are ideal systems for waveguide switches, modulators, and polarization transformers, serving as the foundation for macroscopic and electro-optical device materials.4 To date, most inorganic-based metal complexes have been evaluated for their NLO properties.5–7 Specifically, copper complexes with π-conjugated ligands have demonstrated excellent NLO properties due to their ultrafast response time, thermal stability, and redox-switching ability.8,9 These complexes exhibit a wide range of molecular properties that can be tuned by ligand design and the choice of coordinated metal ions.10 The NLO characteristics of metal complexes can be improved by introducing low-energy charge-transfer transitions,11 such as metal-to-ligand and ligand-to-metal charge-transfer transitions.3,12,13 Moreover, coordination complexes with chiral space groups and π-conjugated ligands improve the NLO properties of metal complexes due to the delocalization of the π-electron cloud.14 Metal ions significantly influence NLO properties when they interact synergistically with ligands.15 Hence, both metal ions and organic ligands play critical roles in forming NLO materials.2,16,17 Furthermore, the ability to enhance the nonlinearity of metal complexes by improving microscopic properties, such as polarizability and hyperpolarizability, along with macroscopic properties like nonlinear susceptibility and thermal stability, makes them highly appealing as NLO materials.18,19
In the past few decades, significant research interest has been directed toward designing various nonlinear optical response materials for potential applications in optical modulation, switching, and signal processing.20 These properties often originate from intramolecular charge transfer (ICT) from donor to acceptor moieties through π-conjugation.21 The investigation of response electric properties, specifically hyperpolarizability (γ), is a crucial parameter for assessing the nonlinearity of a molecule. Computational studies on coordination compounds have rapidly expanded in recent years, allowing researchers to correlate structural and functional characteristics, which offers many possibilities for designing NLO materials.22–24 The introduction of metal ions into chromophore ligands alters their shape to fulfill the metal coordination number, resulting in enhanced optoelectronic properties compared to the free ligands.7,25 For example, the nitro groups of picric acid bond with metal ions in the crystal lattice via a conjugated donor–acceptor system, resulting in high-performance optical nonlinear materials.4,26 Theoretical studies employing conceptual density functional theory (CDFT) have complemented experimental findings. Theoretical calculations were performed at the M062X-D3/(LanL2DZ+6-31G(d,p)) level of theory using the DFT method to elucidate the structural, electronic, and NLO properties of the complexes.
The goal of this research is to understand the relationship between the chemical structures of copper complexes with π-conjugated ligands and their molecular NLO behaviors for use in photonics.27 The synthesized complexes (1 and 2) offer significant advantages in NLO applications due to the electron-rich nature of the dmp ligand and the polarizing effect of picric acid (PA). The dmp ligand stabilizes Cu2+ ions, enhancing electron delocalization and contributing to the rigidity of the complexes, which benefits NLO performance. The electronegativity of the PA ligand increases the polarizability of the system, boosting the second-order NLO response. The variation in oxidation states of copper metal ions and their coordination behaviors makes these complexes more tunable compared to noble metal-based materials, making them ideal for practical NLO applications.
To investigate the NLO properties, we approximated the dipole moment (D), first-order hyperpolarizability (∑), and second-order hyperpolarizability (γ) values of the examined complexes. Furthermore, global reactivity descriptors such as chemical potential (μ), chemical hardness (η), and electrophilicity index (ω0) were evaluated to assess the stability and reactivity of the complexes.28 Molecular electrostatic potential (MEP) analysis was also performed to identify the electrophilic and nucleophilic sites of the complexes. We propose design strategies for previously reported copper(II) and copper(I) coordination complexes with efficient electro-optical and NLO properties. Although conventional characterization instruments have inherent limitations, quantum chemical investigations provide additional insights into the structure–property relationship of these materials. We also examined the nonlinear optical absorption and refractive index values of these complexes using the Z-Scan technique. Additionally, the variation of n2 and β with different concentrations was investigated for complexes 1 and 2. Interestingly, these nonlinear parameters suggest that these complexes are suitable for NLO application.
2 Experimental section
2.1. Materials
Reagent grade 1,10-dimethyl-2,9-phenanthroline (dmp) and picric acid (PA) were purchased from Sigma Aldrich. Solvents, K2CO3, potassium iodide, NaOH and Cu(NO3)2·3H2O were procured from Thermo Fisher scientific, India.
2.2. Physical measurements
Fourier transform infrared (FTIR) spectra of complexes 1 and 2 were recorded (KBr pellet, 4000–400 cm−1) using Thermo Scientific NICOLET model (iS50) FTIR spectrometer. UV-visible spectra were carried out with Thermo Scientific Evolution 201 UV-visible spectrophotometer. Thermogravimetric analysis (TGA) were performed under nitrogen atmosphere from room temperature to 800 °C at a heating rate of 10 °C min−1, using Shimadzu TGA-50H analyzer. The powder X-ray diffraction (PXRD) data were collected on MiniFlex II X-ray diffractometer at 50 kV using wavelength of 1.5418 Å (Cu-Kα radiation). Electron paramagnetic resonance (EPR) spectrum of complex 1 was recorded in methanol (MeOH) solvent at 77 K in the X band using a Bruker ELEXSYS E500 spectrometer.
2.3. Synthesis of complexes 1 and 2
Complexes 1 and 2 were synthesized according to the earlier reported procedure with slight modifications.29 The detailed synthetic procedure of complexes 1 and 2 have been provided in ESI file (Scheme S1†).
2.4. Computational studies
All the quantum chemical calculations were performed on complexes 1 and 2 by utilizing the dispersion-corrected DFT method implemented in Gaussian 09 software. Geometry optimization and frequency calculations were performed in the vacuum on isolated geometries of both complexes by using dispersion-corrected hybrid exchange-correlation functional M062X-D330 and the LanL2DZ+6-31G(d,p) basis set.31–33 The crystallographic information file (CIF) was used to obtain the coordinates for the input geometry.34 The EPR spectra were recorded as a first derivative and the main parameter such as g-factor values were calculated according to Weil et al.35
2.5. Experimental NLO measurements
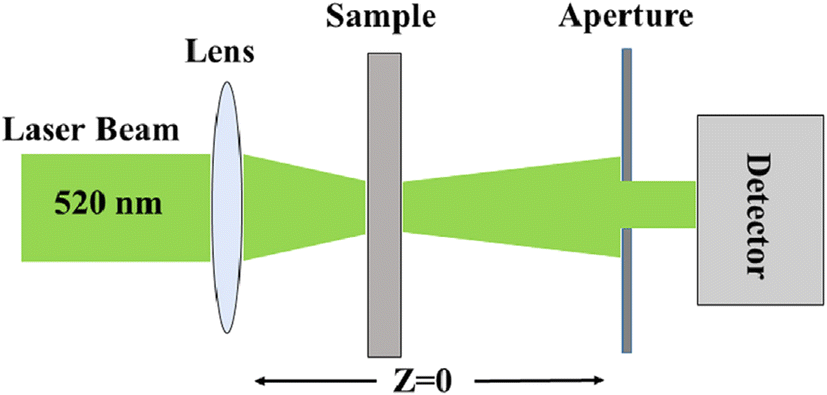
The experimental setup is based on the single-beam Z-scan technique developed by Sheikh Bahae et al.36 This approach, which revolves around spatial beam distortion, allows for the investigation of the nonlinear absorption coefficient (β) and the nonlinear refractive index (n2) of the samples. While this technique is straightforward to use and highly sensitive. Notably, it offers significant advantages over previous nonlinear optical (NLO) methods, as it provides not only the magnitudes of the third-order nonlinear susceptibility (χ(3)) but also the real part of χ(3).37 For the NLO measurements, a continuous wave (CW) diode laser with a Gaussian beam profile was employed, operating at a wavelength of 520 nm with a power output of 50 mW. The measurement was conducted by focusing the laser beam using a convex lens (with a focal length of 50 mm), onto a rectangular quartz cuvette with a thickness of 1 mm, aligned perpendicular to the beam propagation axis.
The samples were dissolved in DMSO solvent to produce solutions of various concentrations. A motorized translation stage, labeled LTS150/M, was utilized to move a cuvette filled with the sample solutions along the z-axis from +z to −z at a speed of 1 mm s−1 around the focal point. To measure the transmitted energy passing through the nonlinear optical (NLO) medium, a photomultiplier tube (Thorlabs, PMM01-1) was positioned in the far field behind a circular aperture. The detected signal was digitized and saved to a computer using an analog-to-digital (A/D) converter. The sample's NLO activity was measured using closed and open-aperture Z-scan methods. In the open-aperture (OA) configuration, the diaphragm was fully open, while in the closed-aperture (CA) configuration, it was set to 1.5 mm. Our experiment's linear aperture transmittance (S) values were 0.627 for the closed aperture and 1 for the open aperture. The Rayleigh diffraction length (ZR) was 5.81 mm, with a beam waist radius (Ω0) of 31.02 mm. Depending on the nonlinearity of the materials, the laser beam was either focused or defocused in the CA configuration, and the sample behaved like a thin lens, meeting the essential condition that its thickness should be smaller than the Rayleigh diffraction length ZR = kΩ02/2 where k = 2π/λ.36
2.6. Theoretical NLO analysis
In this work, we have calculated the hyperpolarizability (1st and 2nd order) of the studied complexes in vacuum and solution (DMSO) phases to explore the NLO potentials using DFT employing Gaussian 09 software. The Polarizable Continuum Model (PCM) using the integral equation formalism variant (IEFPCM) was employed for solution phase calculations. For this purpose, synthesized copper complexes were optimized using the M062X functional and effective core potential LanL2DZ basis set for the Cu atom and 6-31G(d,p) basis set for the remaining C, H, N, and O atoms. The M062X functional was selected for our DFT calculations as it is a global hybrid functional with 54% Hartree–Fock exchange, making it well-suited for studying systems involving non-covalent interactions and charge-transfer excitations, which are crucial in nonlinear optical (NLO) property calculations. Furthermore, the LanL2DZ (Los Alamos National Laboratory 2 Double-Zeta) basis set, widely used for heavy elements and transition metals, incorporates an effective core potential (ECP), enabling efficient and accurate treatment of relativistic effects. Urea was chosen as a reference standard for comparison because of its well-defined first-order hyperpolarizability and simple molecular structure, making it an ideal benchmark for comparative studies. The total static dipole moment (D), the anisotropy of the polarizability (Δσ), the mean first-order hyperpolarizability (∑), and second-order hyperpolarizability (γ) were calculated using the equations reported in the literature.38
2.7. CDFT analysis
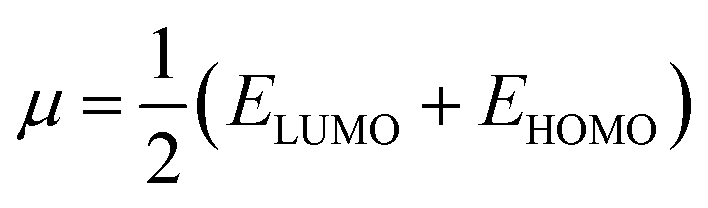
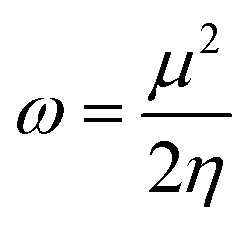
Conceptual Density Functional Theory (CDFT) provides several reactivity descriptors that quantitatively predict chemical reactivity39,40 of molecules based on reactivity parameters such as chemical hardness (η), chemical potential (μ), and electrophilicity index (ω0). These descriptors were calculated using M062X-D3/(LanL2DZ+6-31G (d,p)) level of theory.41| |
 | (2) |
Parr et al.42 reported estimation of the global electrophilicity index (ω0) using the following eqn (3);
| |
 | (3) |
where
ELUMO and
EHOMO are the energy of LUMO and HOMO.
3 Results and discussion
3.1. Structural characterization
The FTIR spectra of complexes 1 and 2 were explained on the basis of observed main frequency bands at ∼3410 and 3380 cm−1 could be assigned to the phenolic group v(O–H) of lattice picric acid and bonded water molecules.43 The C–H stretching bands could be responsible for the strong stretching bands around ∼3254 and 3070 cm−1. The stretching vibration bands observed at ∼705 and 710 cm−1 correspond to Cu–O bonds, while Cu–N bonds were observed at ∼540 and 555 cm−1 (Fig. S1a and b†).44 The electronic spectra of complexes 1 and 2 exhibit characteristic absorption bands that provide insights into their optical properties. A sharp absorption band at 378 nm in complex 1 and an intense band at 380 nm in complex 2 were observed (Fig. S2a and b†). These bands are attributed to an intra-ligand π–π* transition and ligand-to-metal charge transfer (LMCT) transition, respectively. The intra-ligand π–π* transition originates from the excitation of electrons within the conjugated ligand framework, indicative of its strong delocalization and electronic transition.45,46 The intense nature of this band suggests efficient electron transfer, which could significantly influence the photophysical properties of the complexes, such as their luminescence behavior and nonlinear optical (NLO) properties.47 Thermograms of the complexes 1 and 2 were recorded in the nitrogen atmosphere. Complex 1 showed initial weight loss due to removal of the coordinated water molecule. Gradual weight loss patterns were observed in the complexes 1 and 2 (Fig. S3a and b†). The as-synthesized PXRD pattern of the crystalline materials of complexes 1 and 2 seems approximately identical to the simulated PXRD pattern, which confirms the bulk phase purity of the crystal samples of both complexes (Fig. S4†). EPR spectrum can be used to study the structure and reactivity of both complexes, but complex 2 is undetectable because they have no unpaired electrons. Complex 1 has a d9 electronic configuration, which makes it paramagnetic and detectable by EPR.48,49 The EPR spectrum of complex 1 displays seven hyperfine lines in the parallel region, associated to the coupling of an electron with spin multiplicity (S = 3/2) and four absorption-like peaks corresponding to g‖ and an asymmetric derivative peak corresponding to g⊥ (Fig. S5†). The g-shifts in a spectrum of complex 1 are caused by the interaction of the dmp ligating atoms with the unpaired electron of complex 1.50,51
3.2. Experimental NLO results
3.2.1. Nonlinear refraction and nonlinear absorption. The Z-scan method was utilized to perform third-order nonlinear optical measurements on two newly synthesized copper complexes 1 and 2 (Fig. 1). We performed both closed-aperture (CA) and open-aperture (OA) Z-scans using a 520 nm continuous wave (CW) diode laser to determine the nonlinear refractive index and nonlinear absorption coefficient of complexes 1 and 2. The measurements were carried out at various concentrations (1.25, 2.5, 5, and 10 mM) and a laser power of 50 mW. The CA normalized transmittance traces, recorded as a function of the sample position (Z) along the laser beam direction, exhibit a characteristic pre-focal peak, which is indicative of the inherent self-defocusing behavior of the samples. This self-defocusing is likely caused by local changes in the refractive index due to thermal effects, compounded by the high absorption intensity of the 520 nm laser radiation.52 The sample acts as a thermal lens, where the heat generated by laser irradiation leads to temperature-induced variations in the refractive index.53 This thermal lensing effect is governed by the thermo-optic coefficient (dn/dT).54
 |
| | Fig. 1 The proposed diagram of a Z-scan setup for measuring NLO parameters. | |
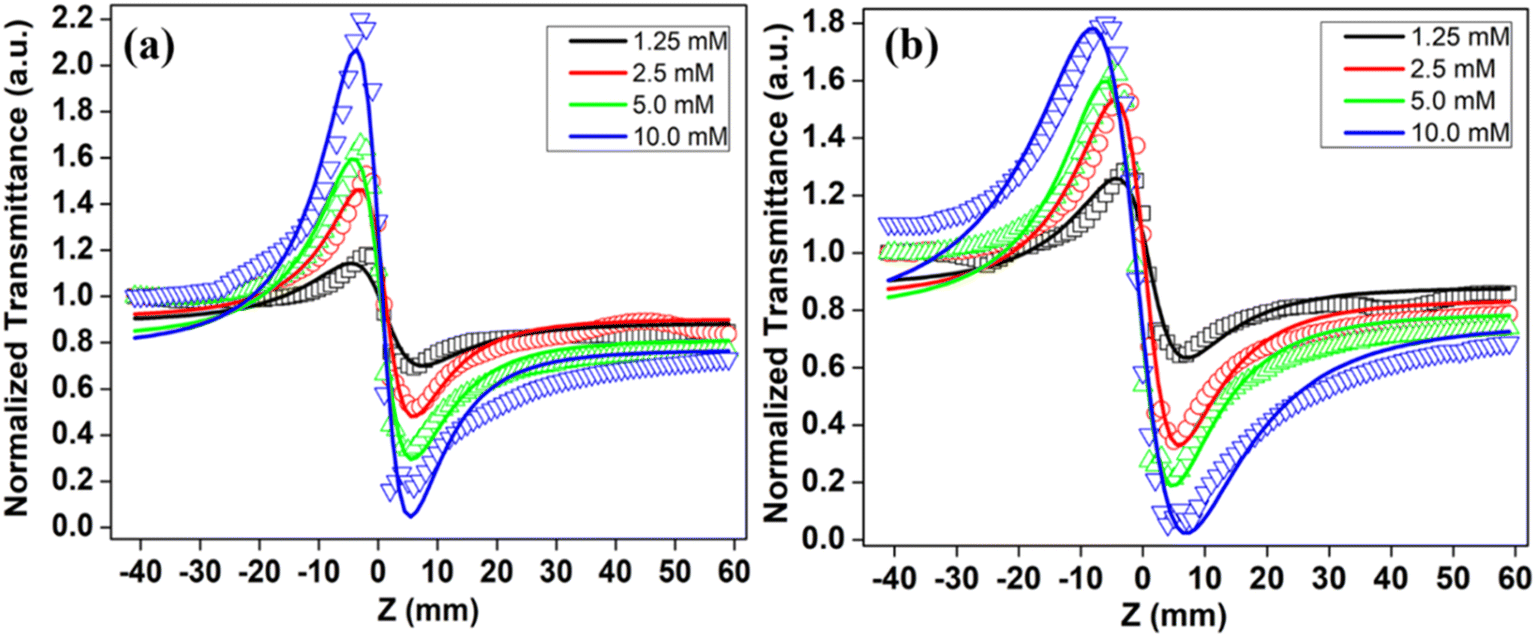
In the closed-aperture (CA) Z-scan, the sample exhibits both nonlinear refraction (NLR) and nonlinear absorption (NLA) modes concurrently. To isolate the nonlinear refraction contribution, we normalized the CA Z-scan data by dividing it by the corresponding OA Z-scan data.55 This division produces a symmetrical Z-scan transmittance around Z = 0 and effectively removes the contribution of NLA from the CA Z-scan.56 Fig. 2a and b illustrate the nonlinear refraction behavior of complexes 1 and 2, with open symbols representing the experimental data and solid lines representing the theoretical fits.
 |
| | Fig. 2 (a and b) Z-scan closed aperture normalized transmittance of complexes 1 and 2 at a fixed laser power of 50 mW. | |
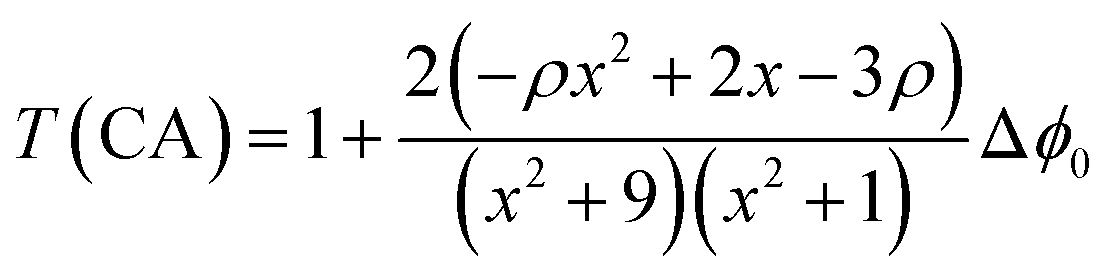
The amplitude and sign of the nonlinear refractive index (n2) of compounds were determined by theoretically fitting the CA Z-scan experimental normalized transmittance data with the following equation.
| |
 | (4) |
where
x =
Z/
ZR is the ratio of the position of the sample and Rayleigh diffraction length, and
ρ = Δ
ψ/Δ
ϕ0, is the ratio of axial phase shift due to nonlinear refraction (Δ
ψ) and absorption (Δ
ϕ0).
57 The obtained values of the NLR index (
n2) are shown in
Table 1 at different concentrations.
Table 1 NLO parameters of complexes 1 and 2 at a fixed laser power of 50 mW
| Sample |
Complex 1 |
Complex 2 |
| C (mM) |
n2 × 10−7 (cm2 W−1) |
β × 10−3 (cm W−1) |
χ(3) × 10−6 (esu) |
n2 × 10−7 (cm2 W−1) |
β × 10−3 (cm W−1) |
χ(3) × 10−6 (esu) |
| 1.25 |
−0.51 |
−0.95 |
0.93 |
−0.69 |
−1.67 |
1.27 |
| 2.5 |
−1.14 |
−1.77 |
2.06 |
−1.73 |
−3.05 |
3.13 |
| 5 |
−2.94 |
−6.79 |
5.24 |
−3.67 |
−5.96 |
6.63 |
| 10 |
−8.45 |
−27.49 |
16.26 |
−12.63 |
−25.84 |
23.10 |
Fig. 3a and b display the open-aperture (OA) normalized transmittance traces of complexes 1 and 2 at various solution concentrations. Both complexes show peaks at the focus (Z = 0), indicating a negative nonlinear absorption coefficient (β < 0) due to the saturable absorption (SA) effect. The presence of saturable absorption in both complexes suggests that they are suitable for applications in mode-locking lasers, Q-switching, and optical switching/modulation.
 |
| | Fig. 3 (a and b) Z-scan open aperture normalized transmittance of complexes 1 and 2 at a fixed laser power of 50 mW. | |
The transmittance is symmetric well about focus (Z = 0) and the absorption effect is concentration-dependent (as the sample concentrations increase results in a greater number of molecules participating in laser interaction, leading to heightened thermal agitation and consequently, an increase in thermal nonlinearity). Table 1 summarizes the CA and OA Z-scan results, showing approximately linear relation between the concentration and nonlinear optical parameters (n2, β, χ(3)). The values of NLO parameters for the existing complexes have a negative nonlinear refractive index for such a concentration range perceived at a fixed laser power (50 mW). The negative nonlinear refraction was obtained due to the thermal lensing effect (Kerr nonlinearity). The nonlinear medium dispersion in response to the intense laser radiation causes the negative nonlinear refractive index. The medium dispersion decreases its intensity and refractive index. As a result, the optical medium has a nonlinear refractive index that is negative. The change in refractive index (Δn0)gives rise to the thermally induced nonlinear refractive index (n2), which is defined as (Δn0 = n2I).36
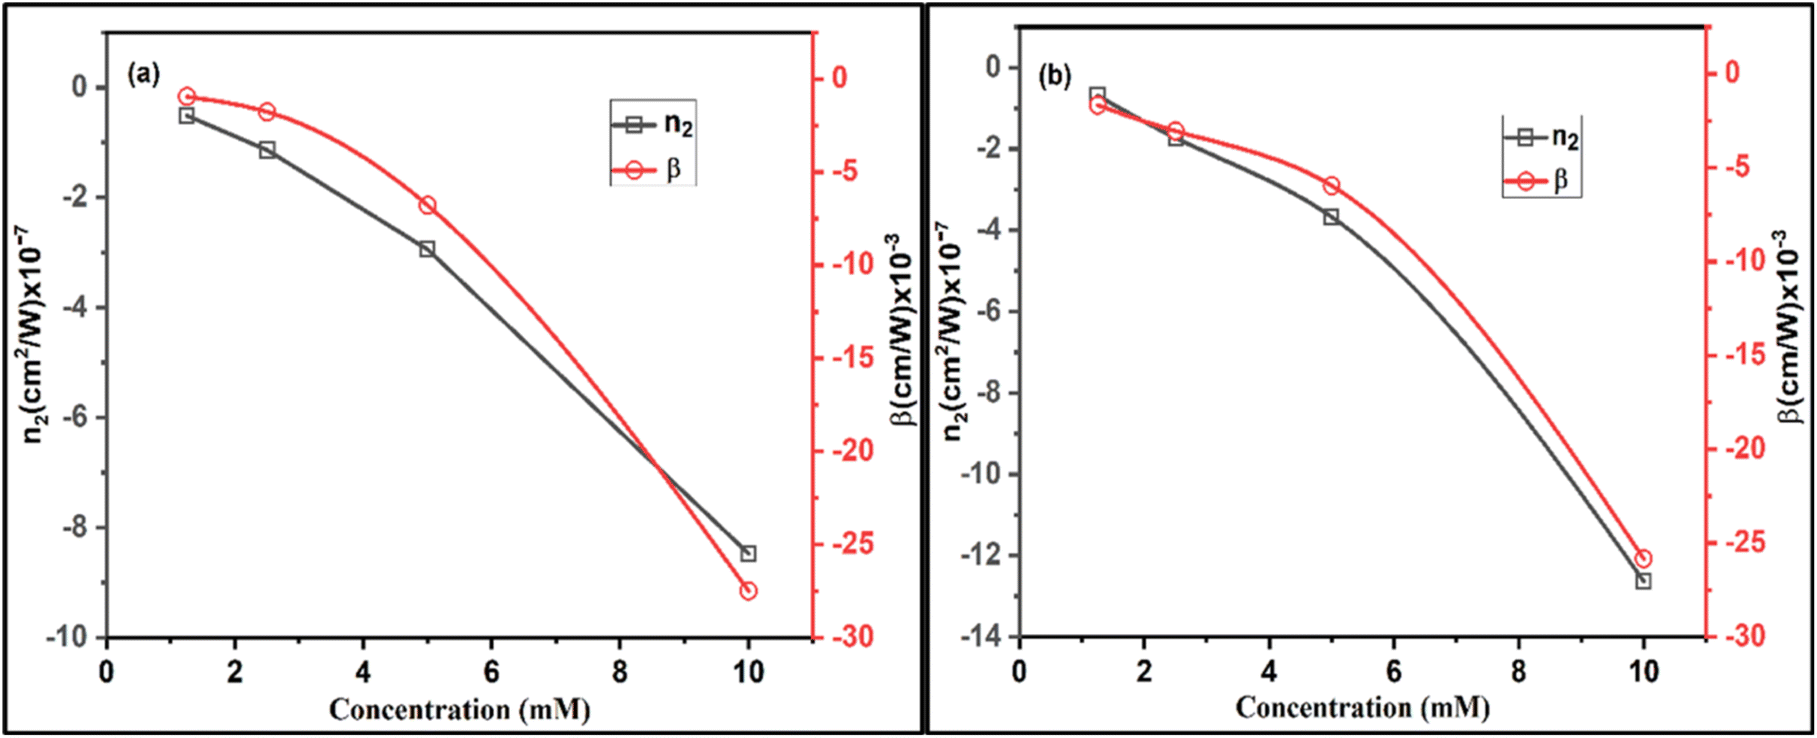
Fig. 4a depicts the variation in n2 and β as a function of the concentration for complexes 1 and 2. The value (absolute) is negative and increases as concentration increases. The intensity-dependent nonlinear refraction and absorption of materials are denoted by n(I) = n0 + n2I and α(I) = α0 + βI respectively, where the symbols possess their usual meanings.38 The nonlinear absorption properties of the material are influenced by factors such as the excitation wavelength, absorption cross-section, excited-state lifetime, and laser pump intensity. Fig. 4b shows the variation of n2 and β solution concentrations of complexes 1 and 2.
 |
| | Fig. 4 (a and b) Variation of n2 and β with concentrations of complexes 1 and 2. | |
The third-order NLO susceptibility χ(3) of the complexes could be expressed as;
| | |
χ(3) = χR(3) + iχI(3)
| (5) |
The values of χR(3), and χI(3) are related to the nonlinear refraction and absorption respectively, and expressed by the following relations;58
| |
 | (6) |
| |
 | (7) |
where the symbol
ε0,
c, and
n0 have their usual meanings. The value of |
χ(3)| has been expressed by the following relation.
| |
 | (8) |
The measured values of χ(3) at several concentrations of 1 and 2 are provided in Table 1, confirming that χ(3) increases at higher concentrations. Fig. 5 depicts the variation of the absolute value of χ(3) with different concentrations, showing that the third-order susceptibility increases almost linearly with concentration.
 |
| | Fig. 5 Variation of χ(3) with concentrations (χ1(3): complex 1, χ2(3): complex 2). | |
The structure of the molecules determines the cubic NLO properties of the materials. The donor and acceptor groups, as well as the ICT axis, play critical roles in determining the NLO characteristics. Table 1 clearly shows that the magnitude of n2, β, and |χ(3)| is greater for complex 2 than for complex 1. Furthermore, it can be observed that the maximum value of |χ(3)| for complexes 1 and 2 is 16.25 × 10⁻⁶ esu and 23.10 × 10⁻⁶ esu, respectively. These values are relatively high compared to previously reported organic dyes studied under the CW regime. For cyanine dye, El-Shishtawy et al.59 reported the highest value of |χ(3)| on the order of 10−5 esu. For the pyrazoline derivative, Papagiannouli et al.60 reported a |χ(3)| value on the order of 10−13 esu. For a few bipodal D–π–A molecules, Vineetha et al.61 reported the highest value of |χ(3)| on the order of 10−11 esu.62 The NLO parameters of complexes 1 and 2 are comparable to or higher than those of previously reported complexes, as shown in Table 2. Based on the comparison in Table 2, complexes 1 and 2 could be considered good NLO active materials.
Table 2 Comparison of NLO parameters of complexes 1 and 2 with other reported NLO active complexes
| Molecule |
λ (nm) |
n2 (cm2 W−1) |
β (cm W−1) |
Reference |
| Porphyrin-based SURMOFs |
400 |
— |
∼−1 × 10⁻³ |
63 |
| Gu-MOF |
532 |
−0.81 × 10⁻⁷ |
−0.74 × 10⁻⁴ |
64 |
| Ni-MOF |
800 |
−0.43 × 10⁻⁷ |
−3.0 × 10⁻¹¹ |
65 |
| ZSTU-10 |
532 |
−1.26 × 10⁻⁷ |
4.47 × 10⁻⁴ |
66 |
| Complex 1 |
520 |
−8.45 × 10⁻⁷ |
−2.74 × 10⁻² |
Present work |
| Complex 2 |
520 |
−12.63 × 10⁻⁷ |
−2.58 × 10⁻² |
Present work |
3.3. Theoretical NLO results
In the theoretical NLO study, we utilized Density Functional Theory (DFT) in Gaussian 09 software with the M062X/6-31G(d,p)/LanL2DZ method to calculate the NLO parameters such as total dipole moment (D), dipole polarizability (σ), first-order hyperpolarizability (∑), and second-order hyperpolarizability (γ) in both vacuum and solution (DMSO) phases. Table 3 summarizes the static (ω = 0) values for these parameters in complexes 1 and 2. Urea was used as the reference standard, as experimental NLO values for the studied complexes were not available. The calculated dipole moment values for complexes 1 and 2 were 22.396 and 21.934 debye, respectively, which are approximately 6 and 5.88 times higher than those of urea (μurea = 3.73 Debye). The hyperpolarizability and strong ICT properties of molecules are key factors in understanding how molecular geometry influences the NLO response.67 Hyperpolarizabilities provide insights into the degree of optical nonlinearity, which is associated with charge transfer from donor to acceptor units through π-conjugated bonds. These bonds are key in the ICT, contributing to a low HOMO–LUMO gap.68 Average NLO parameter values were computed using equations from the literature.69 In the vacuum phase, static values of (∑tot) and <γ> (isotropic) for complex 1 are 19.874 × 10⁻³⁰ esu and 48.337 × 10−36 esu respectively, while for complex 2, they are 23.648 × 10⁻³⁰ esu and 34.836 × 10−36 esu. In the solvent (DMSO) phase, static values of (∑tot) and <γ> (isotropic) for complex 1 are 27.646 × 10⁻³⁰ esu and 183.019 × 10−36 esu respectively, while for complex 2, they are 55.775 × 10⁻³⁰ esu and 142.95 × 10−36 esu.
Table 3 Static NLO parameters such as dipole moment, static linear polarizability (σ (0;0)), first-order hyperpolarizability (∑ (0;0,0)), and second-order hyperpolarizability (γ (0;0,0,0)) computed at ω = 0 using M062X/6-31G(d,p)/LanL2DZ method
| |
Complex 1 |
Complex 2 |
Urea |
| (Vacuum) |
(DMSO) |
(Vacuum) |
(DMSO) |
(Vacuum) |
| Dipole moment (Debye) |
15.935 |
22.396 |
15.480 |
21.934 |
3.73 |
![[thin space (1/6-em)]](https://www.rsc.org/images/entities/char_2009.gif) |
| σ (0;0) (× 10−24 esu) |
| <σ> (isotropic) |
82.703 |
117.870 |
64.756 |
92.959 |
4.57 |
| Δσ (anisotropic) |
44.066 |
61.201 |
25.555 |
44.078 |
2.33 |
|
| ∑ (0;0,0) (× 10−30 esu) |
| ∑tot |
19.874 |
27.646 |
23.648 |
55.775 |
0.66 |
|
| γ (0;0,0,0) (× 10−36 esu) |
| <γ> (isotropic) |
48.337 |
183.019 |
34.836 |
142.953 |
1.35 |
The linear polarizability (σ) and first (∑)– and second order (γ) hyperpolarizabilities of complexes 1 and 2 were also calculated, considering the dynamic effects of an applied electric field with a frequency of ω = 0.087 a.u. (atomic units) and a wavelength of 520 nm, as shown in Table 4. The obtained dynamic values were higher than the static values due to the influence of the applied electric field. In the dynamic notations (σ, ∑, and γ), the first frequency with a negative sign corresponds to the emitted radiation frequency, while the positive frequencies are associated with the absorbed radiation, as detailed in Table 4.
Table 4 The dynamic frequency-dependent linear polarizability (σ(−ω;ω)); first-order hyperpolarizability (∑(−ω;ω,0) and ∑(−2ω;ω,ω)); and second-order hyperpolarizability (γ(−ω;ω,0,0) and γ(−2ω;ω,ω,0)); calculated at ω = 0.087622 a.u. (λ = 520 nm) using M062X/6-311G(d,p) method
| |
Complex 1 |
Complex 2 |
Urea |
| (Vacuum) |
(DMSO) |
(Vacuum) |
(DMSO) |
(Vacuum) |
| Where electro-optical Pockels effect. Second harmonic generation (SHG). Quadratic electro-optic Kerr effect. DC second-harmonic generation (DC-SHG). |
| σ(−ω;ω) (× 10−24 esu) |
| <σ> (isotropic) |
90.667 |
104.692 |
71.200 |
82.806 |
4.60 |
| Δσ (anisotropic) |
49.300 |
59.500 |
29.472 |
37.404 |
2.36 |
|
| ∑(−ω; ω,0)a (× 10−30 esu) |
| ∑tot |
29.464 |
34.198 |
42.453 |
60.655 |
0.69 |
|
| ∑(−2ω; ω,ω)b (× 10−30 esu) |
| ∑tot |
3080.131 |
2241.627 |
2295.322 |
1944.88 |
0.79 |
|
| γ(−ω; ω,0,0)c (× 10−36 esu) |
| <γ> (isotropic) |
93.598 |
291.915 |
72.629 |
194.651 |
0.145 |
|
| γ(−2ω; ω,ω,0)d (× 10−36 esu) |
| <γ> (isotropic) |
20943.7 |
11555.8 |
1836.3 |
1856.89 |
0.16 |
The second-order hyperpolarizability (γ) is influenced by the extent of electron conjugation, molecular size, and nature of the substituents.70 The significant charge delocalization within complexes 1 and 2 results in high static and dynamic hyperpolarizability values, leading to enhanced nonlinear optical (NLO) properties. Consequently, these complexes exhibit improved second- and third-order NLO responses, making them promising candidates for NLO applications.
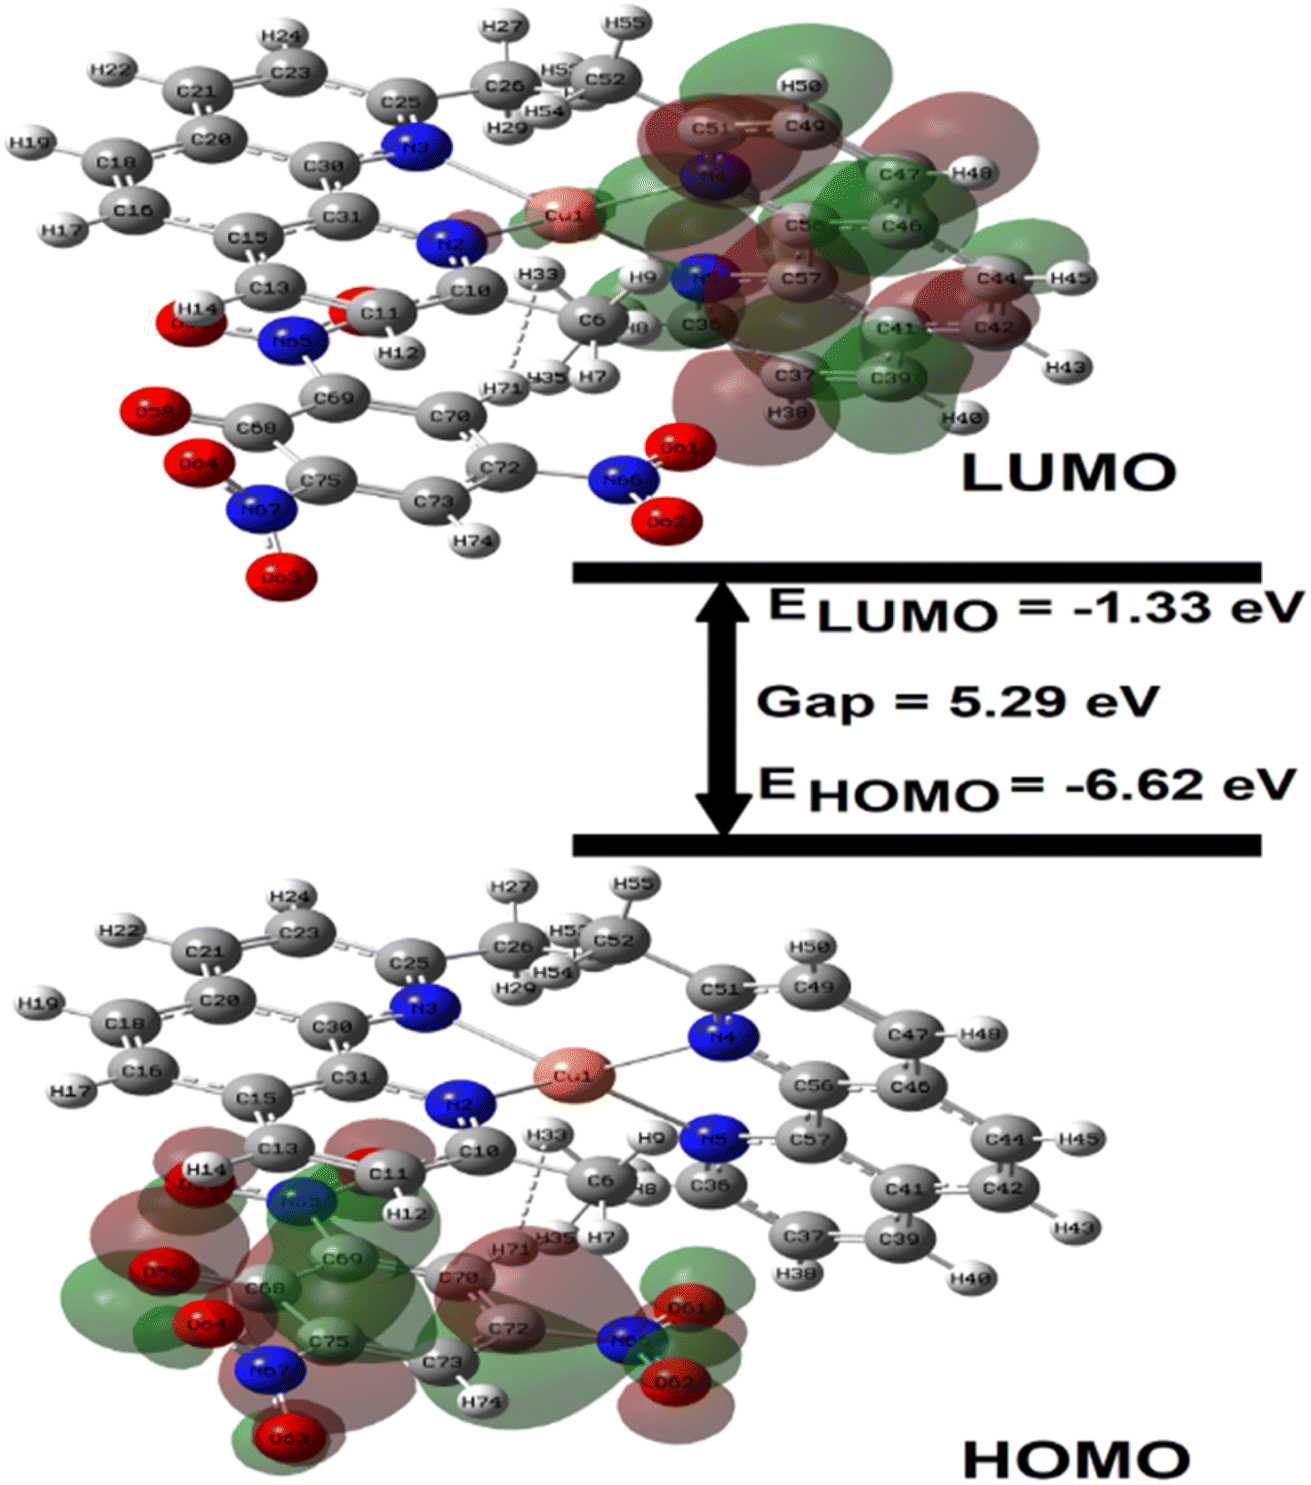
3.3.1. CDFT analysis. We computed the conceptual density functional theory (CDFT) based global reactivity descriptors to understand the reactivity of the synthesized copper complexes. The calculated chemical hardness (η), chemical potential (μ), and electrophilicity index (ω0) values for complexes 1 and 2 are tabulated in Table 5. The energies of LUMO (EL), and HOMO (EH), along with their energy gap (ΔE) determine the intrinsic hard-soft characteristics of a chemical species. A reasonably high ΔE indicates greater electronic stability and reduced chemical reactivity of the chemical species. The calculated ΔE values of complex 1 (5.60 eV) are found to be higher than complex 2 (5.29 eV), indicating that complex 1 possesses greater electronic stability and a harder nature compared to complex 2. Again, the greater chemical hardness (η) value refers to the increased resistance of a chemical species to charge transfer, indicating higher stability and reduced reactivity. Therefore, the computed chemical hardness values suggest that complex 1 is more stable than complex 2. The electrophilicity index (ω0), on the other hand, reflects the tendency of an electrophile to accept additional electron density. According to the CDFT analysis, complex 1 exhibits a higher electrophilicity value (2.02 eV). Consequently, complex 1 is more reactive toward nucleophilic substitution reactions.
Table 5 HOMO and LUMO energies (EH and EL in eV), chemical potential (μ in eV), chemical hardness (η in eV), and electrophilicity index (ω0 in eV) of complexes 1 and 2
| Complex |
EH |
EL |
ΔE |
μ |
η |
ω0 |
| 1 |
−7.56 |
−1.96 |
5.60 |
−4.76 |
5.60 |
2.02 |
| 2 |
−6.62 |
−1.33 |
5.29 |
−3.97 |
5.29 |
1.49 |
3.4. Frontier molecular orbitals (FMOs) analysis
The frontier molecular orbitals (i.e., HOMO and LUMO) data were obtained from geometry optimization results at the M062X-D3/(LanL2DZ+6-31G (d,p)) basis set. Spatial plots of Frontier molecular orbitals (alpha) along with energy eigenvalues and gaps related to complexes 1 and 2 are presented in Fig. 6 and 7. The theoretical calculation of 1 was carried out by using the M062X-D3 method. HOMO–LUMO gaps are found to be 5.60 and 5.29 eV of 1 and 2 respectively.
 |
| | Fig. 6 The frontier molecular orbitals (alpha) of complex 1. | |
These orbitals play an important role in monitoring the reactivity, ionization, electron affinity, and other chemical reactivity descriptors. The energy values of HOMO and LUMO are generally used to obtain global reactivity descriptors.71 In Fig. 6, HOMOs are localized predominantly over the picric acid moieties. In the same figure, LUMO is spread over the region of one of the neocuproine ligands. In the case of 2, HOMO is localized mainly on Cu–N and partially on neocuproine ligands while LUMO is present mainly over one of the neocuproine ligands (Fig. 7). Thus, the activity associated with the present complexes may be attributed to the regions where the HOMO and LUMO are localized. The HOMO and LUMO have electron-donating and electron-accepting abilities respectively. The calculated HOMO/LUMO gap of the complex explains the charge transfer between donating and accepting units.
 |
| | Fig. 7 The frontier molecular orbitals of complex 2. | |
4 Conclusions
This study comprehensively examines the nonlinear optical (NLO) properties of two synthesized copper complexes, employing both experimental and theoretical methods. Experimental results indicate that both complexes exhibit significant nonlinear refraction and absorption behaviors, with notable self-defocusing effects attributed to thermal lensing. The nonlinear refractive index (n2) and nonlinear absorption coefficient (β) increase with concentration, demonstrating the materials' potential for intensity-dependent NLO applications. The third-order nonlinear optical susceptibility (χ(3)) values of the complexes are considerably high, suggesting their suitability for advanced optical applications. Furthermore, DFT analysis aligns with experimental findings, emphasizing strong hyperpolarizability and dipole moments, which confirm the NLO potential of these complexes. Additionally, CDFT analysis reveals distinct stability and reactivity profiles, with complex 1 demonstrating greater stability, while complex 2 shows higher reactivity. This investigation was restricted to a single wavelength (520 nm) and continuous-wave laser, leaving scope for studying their wavelength-dependent NLO responses and behavior under pulsed lasers. Additionally, the impact of substituents on ligand structures and their role in tuning NLO properties were not explored, presenting an avenue for future studies. Extending the computational analysis to include more advanced methods and solvent effects could further refine the understanding of these complexes.
Data availability
The data supporting this article have been included as part of the ESI.†
Author contributions
Mohd Muslim: data curation, writing – original draft, validation, formal analysis, project administration, and revision. Liyaqat Ali Kamran: formal analysis, software. Basree: data curation, formal analysis, review & editing. Amit Kumar Pradhan: formal analysis, software. Mohammad Jane Alam: formal analysis, software. Sultan & S. M. Afzal: data curation, writing – reviewing & editing of NLO study, formal analysis, and revision. Musheer Ahmad: supervision and project administration. Mohd Afzal: formal analysis and project administration.
Conflicts of interest
There are no conflicts of interest.
Acknowledgements
The authors acknowledge financial assistance from UGC Start-Up grant & TEQIP-III, ZHCET, Aligarh Muslim University, Aligarh, Uttar Pradesh, India. Basree thanks to the DST/INSPIRE Fellowship/2021/IF210635. Dr Mohd Afzal extends his appreciation to Researchers Supporting Project number (RSPD2025R979), King Saud University, Riyadh, Saudi Arabia, for financial assistance.
References
- H. Hou, Y. Wei, Y. Song, L. Mi, M. Tang, L. Li and Y. Fan, Angew. Chem., 2005, 117, 6221–6228 Search PubMed.
- M. Zaidi, D. Hannachi and H. Chermette, Inorg. Chem., 2021, 60, 6616–6632 CAS.
- Y. Zhang, Q. Gan, S. Wang and G. Yang, J. Inorg. Organomet. Polym. Mater., 2012, 22, 48–53 Search PubMed.
- M. Thangaraj, G. Vinitha, T. C. Sabari Girisun, P. Anandan and G. Ravi, Opt. Laser Technol., 2015, 73, 130–134 CAS.
- S. A. Abdel-Latif and A. A. Mohamed, J. Mol. Struct., 2018, 1153, 248–261 CAS.
- S. A. Abdel-Latif and H. Moustafa, Appl. Organomet. Chem., 2018, 32, e4269 Search PubMed.
- L. H. Abdel-Rahman, A. M. Abu-Dief, H. Moustafa and A. A. H. Abdel-Mawgoud, Arabian J. Chem., 2020, 13, 649–670 CAS.
- A. Trujillo, M. Fuentealba, D. Carrillo, C. Manzur, I. Ledoux-Rak, J.-R. Hamon and J.-Y. Saillard, Inorg. Chem., 2010, 49, 2750–2764 CAS.
- L. Rigamonti, A. Forni, E. Cariati, G. Malavasi and A. Pasini, Materials, 2019, 12, 3595 CAS.
- S. Samiee and S. Taghvaeian, Appl. Organomet. Chem., 2019, 33, e4626 Search PubMed.
- P. Aswathy, I. H. Joe, S. Samshuddin, B. Narayana and J. C. Monicka, J. Mol. Struct., 2021, 1246, 131169 CrossRef CAS.
- N. J. Long, Angew. Chem., Int. Ed. Engl., 1995, 34, 21–38 CrossRef CAS.
- C. E. Powell, J. P. Morrall, S. A. Ward, M. P. Cifuentes, E. G. A. Notaras, M. Samoc and M. G. Humphrey, J. Am. Chem. Soc., 2004, 126, 12234–12235 CrossRef CAS PubMed.
- M. Fontani, A. Colombo, C. Dragonetti, S. Righetto, D. Roberto and D. Marinotto, Inorganics, 2020, 8, 36 CrossRef CAS.
- H. Hou, Y. Wei, Y. Song, L. Mi, M. Tang, L. Li and Y. Fan, Angew. Chem., 2005, 44, 6067–6074 CrossRef CAS PubMed.
- O. Maury, L. Viau, K. Sénéchal, B. Corre, J.-P. Guégan, T. Renouard, I. Ledoux, J. Zyss and H. Le Bozec, Chem.–Eur. J., 2004, 10, 4454–4466 CrossRef CAS PubMed.
- A. Migalska-Zalas, K. EL Korchi and T. Chtouki, Opt. Quantum Electron., 2018, 50, 389 CrossRef.
- O. Margeat, P. G. Lacroix, J. P. Costes, B. Donnadieu, C. Lepetit and K. Nakatani, Inorg. Chem., 2004, 43, 4743–4750 CrossRef CAS PubMed.
- O. Maury and H. Le Bozec, Acc. Chem. Res., 2005, 38, 691–704 CrossRef CAS PubMed.
- A. Wojciechowski, K. Ozga, A. H. Reshak, R. Miedzinski, I. V. Kityk, J. Berdowski and Z. Tylczyński, Mater. Lett., 2010, 64, 1957–1959 CrossRef CAS.
- S. J. Chung, K. S. Kim, T. C. Lin, G. S. He, J. Swiatkiewicz and P. N. Prasad, J. Phys. Chem. B, 1999, 103, 10741–10745 CrossRef CAS.
- N. Novoa, C. Manzur, T. Roisnel, V. Dorcet, N. Cabon, F. Robin-Le Guen, I. Ledoux-Rak, S. Kahlal, J.-Y. Saillard, D. Carrillo and J.-R. Hamon, New J. Chem., 2019, 43, 10468–10481 RSC.
- L. Rigamonti, F. Demartin, A. Forni, S. Righetto and A. Pasini, Inorg. Chem., 2006, 45, 10976–10989 CrossRef CAS PubMed.
- F. Cariati, U. Caruso, R. Centore, W. Marcolli, A. De Maria, B. Panunzi, A. Roviello and A. Tuzi, Inorg. Chem., 2002, 41, 6597–6603 CrossRef CAS PubMed.
- K. Iliopoulos, I. Guezguez, A. P. Kerasidou, A. El-Ghayoury, D. Branzea, G. Nita, N. Avarvari, H. Belmabrouk, S. Couris and B. Sahraoui, Dyes Pigm., 2014, 101, 229–233 CrossRef CAS.
- A. Chandramohan, R. Bharathikannan, M. A. Kandhaswamy, J. Chandrasekaran and V. Kandavelu, Cryst. Res. Technol., 2008, 43, 93–98 CrossRef CAS.
- S. Kamaal, M. Mehkoom, M. Muslim, S. M. Afzal, A. Alarifi, M. Afzal, A. Alowais, M. Muddassir, A. N. Albalwi and M. Ahmad, Crystals, 2021, 11, 508 CrossRef CAS.
- L. Sanhueza, D. Cortés-Arriagada, I. Ledoux-Rak, I. Crivelli and B. Loeb, Synth. Met., 2017, 234, 9–17 CrossRef CAS.
- M. Muslim, S. Kamaal, M. Ahmad, M. Arish, M. Jane Alam, A. Kumar Pradhan, P. Mondal, A. Alarifi and M. Afzal, Polyhedron, 2022, 220, 115848 CrossRef CAS.
- M. J. Frisch, G. W. Trucks, H. B. Schlegel, G. E. Scuseria, M. A. Robb, J. R. Cheeseman, G. Scalmani, V. Barone, B. Mennucci, G. A. Petersson, H. Nakatsuji, M. Caricato, X. Li, H. P. Hratchian, A. F. Izmaylov, J. Bloino, G. Zheng, J. L. Sonnenberg, M. Hada, M. Ehara, K. Toyota, R. Fukuda, J. Hasegawa, M. Ishida, T. Nakajima, Y. Honda, O. Kitao, H. Nakai, T. Vreven, J. A. Montgomery Jr, J. E. Peralta, F. Ogliaro, M. Bearpark, J. J. Heyd, E. Brothers, K. N. Kudin, V. N. Staroverov, R. Kobayashi, J. Normand, K. Raghavachari, A. Rendell, J. C. Burant, S. S. Iyengar, J. Tomasi, M. Cossi, N. Rega, J. M. Millam, M. Klene, J. E. Knox, J. B. Cross, V. Bakken, C. Adamo, J. Jaramillo, R. Gomperts, R. E. Stratmann, O. Yazyev, A. J. Austin, R. Cammi, C. Pomelli, J. W. Ochterski, R. L. Martin, K. Morokuma, V. G. Zakrzewski, G. A. Voth, P. Salvador, J. J. Dannenberg, S. Dapprich, A. D. Daniels, O. Farkas, J. B. Foresman, J. V. Ortiz, J. Cioslowski and D. J. Fox, Gaussian 09, Revision D.01, Gaussian Inc, Wallingford CT, 2009 Search PubMed.
- S. Grimme, J. Antony, S. Ehrlich and H. Krieg, J. Chem. Phys., 2010, 132, 154104 CrossRef PubMed.
- P. J. Hay and W. R. Wadt, J. Chem. Phys., 1998, 82, 299 Search PubMed.
- C. Lee, W. Yang and R. G. Parr, Phys. Rev. B, 1988, 37, 785 CrossRef CAS PubMed.
- E. Monzani, G. Battaini, A. Perotti, L. Casella, M. Gullotti, L. Santagostini, G. Nardin, L. Randaccio, S. Geremia, P. Zanello and G. Opromolla, Inorg. Chem., 1999, 38, 5359–5369 CrossRef CAS.
- J. A. Weil and J. R. Bolton, Electron Paramagnetic Resonance: Elementary Theory and Practical Applications, John Wiley & Sons, 2006 Search PubMed.
- M. Sheik-bahae, E. W. Van Stryland and A. A. Said, Opt. Lett., 1989, 14(17), 955–957 CrossRef CAS PubMed.
- M. Sheik-Bahae, A. A. Said, T. H. Wei, D. J. Hagan and E. W. Van Stryland, IEEE J. Quantum Electron., 1990, 26, 760–769 CrossRef CAS.
- K. Kamada, M. Ueda, K. Ohta, T. Sakaguchi and T. Fukumi, J. Opt. Soc. Am. B, 1998, 15(2), 838–845 CrossRef CAS.
- M. Berkowitz, R. G. Parr and S. K. Ghosh, J. Am. Chem. Soc., 1985, 107, 6811–6814 CrossRef CAS.
- D. Nazarian, J. S. Camp, Y. G. Chung, R. Q. Snurr and D. S. Sholl, Chem. Mater., 2017, 29, 2521–2528 CrossRef CAS.
- P. Geerlings, F. De Proft and W. Langenaeker, Chem. Rev., 2003, 103, 1793–1874 CrossRef CAS PubMed.
- P. K. Chattaraj, G. H. Liu and R. G. Parr, Chem. Phys. Lett., 1995, 237(1–2), 171–176 CrossRef CAS.
- M. Muslim, F. Naz, A. Alarifi, M. Afzal, N. Sepay and M. Ahmad, Appl. Biochem. Biotechnol., 2023, 195, 871–888 CrossRef CAS PubMed.
- A. A. A. Al-Riyahee, H. H. Hadadd and B. H. Jaaz, Orient. J. Chem., 2018, 34, 2927–2941 CAS.
- M. Muslim, M. Ahmad, M. J. Alam and S. Ahmad, Sep. Purif. Technol., 2023, 315, 123598 CrossRef CAS.
- A. Qureshi, M. Muslim, C. Chauhan, S. A. Muthu, Gulafsha, M. Ahmad, S. Parvez and B. Ahmad, J. Mol. Struct., 2025, 1322, 140345 CAS.
- M. Muslim, M. Ahmad, M. Arish, M. J. Alam, A. Alarifi, M. Afzal, N. Sepay and S. Ahmad, J. Mol. Struct., 2022, 1270, 133879 CAS.
- H. J. Forman, M. Maiorino and F. Ursini, Biochemistry, 2010, 49, 835–842 CrossRef CAS PubMed.
- O. Augusto, D. R. Truzzi and E. Linares, Redox Biochem. Chem., 2023, 5–6, 100009 Search PubMed.
- J. Adhikary, P. Chakraborty, S. Das, T. Chattopadhyay, A. Bauzá, S. K. Chattopadhyay, B. Ghosh, F. A. Mautner, A. Frontera and D. Das, Inorg. Chem., 2013, 52, 13442–13452 CAS.
- J. Adhikary, A. Chakraborty, S. Dasgupta, S.
K. Chattopadhyay, R. Kruszynski, A. Trzesowska-Kruszynska, S. Stepanović, M. Gruden-Pavlović, M. Swart and D. Das, Dalton Trans., 2016, 45, 12409–12422 CAS.
- S. Arun Kumar, J. Senthilselvan and G. Vinitha, Opt. Laser Technol., 2019, 109, 561–568 CAS.
- D. Dini, M. J. F. Calvete and M. Hanack, Chem. Rev., 2016, 116, 13043–13233 CAS.
- R. Li, N. Dong, C. Cheng, F. Ren, R. Hübner, J. Wang, S. Zhou and F. Chen, ACS Omega, 2017, 2, 1279–1286 CrossRef CAS PubMed.
- Z. Dehghani, F. Ostovari and S. Sharifi, Optik, 2023, 274, 170551 CrossRef CAS.
- M. Muslim, S. Kamaal, M. Mehkoom, M. Jane Alam, S. M. Afzal and M. Ahmad, ChemistrySelect, 2021, 6, 10201–10207 CrossRef CAS.
- B. Derkowska-Zielinska, M. Barwiolek, C. Cassagne and G. Boudebs, Opt. Laser Technol., 2020, 124, 105968 CrossRef CAS.
- S. A. Khan, M. A. N. Razvi, A. H. Bakry, S. M. Afzal, A. M. Asiri and S. A. El-Daly, Spectrochim. Acta, Part A, 2015, 137, 1100–1105 CrossRef CAS PubMed.
- R. M. El-Shishtawy and P. Almeida, Tetrahedron, 2006, 62(33), 7793–7798 CrossRef CAS.
- I. Papagiannouli, A. Szukalski, K. Iliopoulos, J. Mysliwiec, S. Couris and B. Sahraoui, RSC Adv., 2015, 5, 48363–48367 RSC.
- P. K. Vineetha, A. Aswathy, E. Shiju, K. Chandrasekharan and N. Manoj, New J. Chem., 2020, 44, 6142–6150 RSC.
- H. W. Lee, H. Lim, H.-D. Nguyen, K. Kim, J. Lee, F. Rotermund, J. K. Anthony and S. Mho, Opt. Express, 2009, 17(21), 19093–19101 CrossRef CAS PubMed.
- V. Siva, A. Shameem, A. Murugan, S. Athimoolam, G. Vinitha and S. A. Bahadur, Chin. J. Phys., 2020, 68, 764–777 CrossRef CAS.
- X. Jiang, L. Zhang, S. Liu, Y. Zhang, Z. He, W. Li, F. Zhang, Y. Shi, L. Wei, Y. Li, Q. Wen, J. Li, J. Feng, S. Ruan, Y. J. Zeng, X. Zhu, Y. Lu and H. Zhang, Adv. Opt. Mater., 2018, 6, 1800561 CrossRef.
- R. Abazari, E. Yazdani, M. Nadafan, A. M. Kirillov, J. Gao, A. M. Z. Slawin and C. L. Carpenter-Warren, Inorg. Chem., 2021, 60, 9700–9708 CrossRef CAS PubMed.
- S. Kamaal, M. Mehkoom, A. Ali, S. M. Afzal, M. J. Alam, S. Ahmad and M. Ahmad, ACS Omega, 2021, 6, 6185–6194 CrossRef CAS PubMed.
- C. U. Vite-Morales, M. Á. Amado-Briseño, R. A. Vázquez-García, J. E. Muñoz-Pérez, M. A. Veloz-Rodríguez, E. Rueda-Soriano, A. Espinosa-Roa and O. J. Hernández-Ortiz, Chem. Phys. Impact, 2024, 9, 100740 CrossRef.
- K. Kamada, K. Ohta, M. Ueda, T. Sakaguchi and T. Fukumi, J. Opt. Soc. Am. B, 1998, 15(2), 838–845 CrossRef CAS.
- C. Valverde, S. A. de Lima e Castro, G. R. Vaz, J. L. de Almeida Ferreira, B. Baseia and F. A. P. Osório, Acta Chim. Slov., 2018, 65, 739–749 CrossRef CAS PubMed.
- S. R. Maidur, P. S. Patil, S. V. Rao, M. Shkir and S. M. Dharmaprakash, Opt. Laser Technol., 2017, 97, 219–228 CrossRef CAS.
- A. Ali, A. Alarifi, M. Jane Alam, S. Ahmad, M. Afzal, S. Javed, M. Ahmad and N. Sepay, Comput. Theor. Chem., 2022, 1214, 113791 CAS.
Footnote |
| † Electronic supplementary information (ESI) available: It contains the synthesis procedure and scheme, spectroscopic characterization, geometry optimization, molecular electrostatic (MEP) plots of complexes 1 and 2. Table S1 for selected bond distances (Å) and bond angles (°) obtained from experimental and theoretical analysis for complexes 1 and 2. See DOI: https://doi.org/10.1039/d4ra08037h |
|
| This journal is © The Royal Society of Chemistry 2025 |
Click here to see how this site uses Cookies. View our privacy policy here. 
 Open Access Article
 This Open Access Article is licensed under a Creative Commons Attribution-Non Commercial 3.0 Unported Licence
 c,
Basreed,
Amit Kumar Pradhane,
Mohammad Jane Alamb,
S. M. Afzalb,
Musheer Ahmad
c,
Basreed,
Amit Kumar Pradhane,
Mohammad Jane Alamb,
S. M. Afzalb,
Musheer Ahmad