 Open Access Article
Creative Commons Attribution 3.0 Unported Licence
Synthesis, characterization, and anti-cancer activity evaluation of Ba-doped CuS nanostructures synthesized by the co-precipitation method
A. M. Abdulwahab*a,
Asma'a Ahmed AL-Adhreai *ab,
A. H. Al-Hammadib,
Arwa Al-Adhreaic,
Aeshah Salemd,
Faisal Katib Alanazie and
Mohammed ALSaeedy
 fc
fc
aDepartment of Physics, Faculty of Applied Science, Thamar University, Dhamar 87246, Yemen. E-mail: abduhabdulwahab@yahoo.com; Asma.AlAhreai@gmail.com
bDepartment of Physics, Faculty of Science, Sana'a University, Sana'a, Yemen
cDepartment of Chemistry, Faculty of Applied Science, Thamar University, Dhamar 87246, Yemen
dDepartment of Physics, Faculty of Science, Taibah University, Yanbu 46423, Saudi Arabia
eDepartment of Physics, College of Science, Northern Border University, Arar 73222, Saudi Arabia
fDepartment of Chemistry, Faculty of Education & Science, AlBaydha University, Al-Baydha, Yemen
First published on 12th February 2025
Abstract
Pure and barium (Ba)-doped copper sulfide nanostructures were synthesized by the chemical co-precipitation method at room temperature. The pure and Ba-doped CuS nanoparticles have been compared structurally, morphologically, and optically using X-ray diffraction (XRD), transmission electron microscopy (TEM), total reflection X-ray fluorescence (TXRF), diffuse reflectance spectroscopy (DRS) and photoluminescence (PL) spectroscopy. The results of X-ray diffraction (XRD) showed that the CuS nanostructures have a hexagonal structure with crystallite sizes ranging from 15.14 to 16.69 nm. TXRF was used to confirm the presence of Ba-doped CuS. Diffuse reflectance spectroscopy (DRS) analysis revealed that the bandgap energy of the CuS nanostructures increased with increasing Ba doping concentration (1.38 to 1.82 eV). Optical constants such as absorption coefficient, extinction coefficient, and refractive index were calculated. A photoluminescence study of CuS was carried out. One photoluminescence (PL) band was found at 826 nm (1.5 eV) at room temperature and was attributed to band-to-band (BB) and band-to-impurity recombination. The MTT assay was used to measure the cytotoxicity effect on human lung cancer cell lines (A549). The results showed that CuS nanostructure with 5% Ba doping exhibits more toxicity than other samples, with an IC50 of 8.46 g ml−1 being the most significant concentration, suggesting that it may be a promising cancer treatment agent.
1. Introduction
The unique chemical and physical properties of transition metal chalcogenide compounds, which depend on the morphology of the nanomaterials, have recently attracted a lot of study interest.1 A lot of research on metal sulfides semiconductors focuses on chalcogenides (group 12), particularly zinc and cadmium sulfide. However, the toxicity of these materials limits their potential uses, which is why copper sulfide nanocrystals have recently attracted attention for a variety of uses.2 CuS is more advantageous than other materials due to its nontoxic, abundant elemental composition, low cost, electronic conductivity, and chemical stability at ambient temperatures.3 Numerous studies have been carried out on copper sulfides because of their interesting optical, chemical, biological, and electrical properties, as well as their great potential in a variety of applications, including batteries, solar cells, cancer therapy, nonlinear optical materials, and heterogeneous catalysis.4 The optical band gap energy of CuS nanoparticles (NPs) varies depending on stoichiometry and is between 1.2 and 2.5 eV. Numerous studies have been carried out on copper sulfide nanoparticles (NPs) with various crystalline phases, including chalcocite (Cu2S), djurleite (Cu1.9S), digenite (Cu1.8S), anilite (Cu1.75S), and covellite (CuS).5 Researchers are particularly interested in the greenish-black solid covellite CuS because it possesses a conductivity similar to metal, can sense chemicals, and is capable of becoming a superconductor at a low temperature of 1.6 K.6Doping can successfully regulate phase composition and microstructure. Doping incorporation has enhanced the dielectric, morphological, electric, catalytic, and optical properties of CuS NPs. Several doping elements like vanadium, cobalt, gallium, indium, silver, and nickel have been reported as dopants in CuS.7 Ba is an element of the family of alkaline earth metals and consistently shows an oxidation state of +2. Ba is useful in a wide range of products, including guiding layers, liquid sensors, ceramics, fluorescent lighting, rubber, and optical glass. The ionic radius for the Ba2+ ion is 1.35 Å, while that for the Cu2+ ion is 0.73 Å.8 Barium (Ba) was used as a dopant in previous research to modify the characteristics of many semiconductors, including CdS,9 ZnS,10 CdO,11 and TiO2,12 for a number of applications. Therefore, the optical, structural, and electrical properties of the CuS nanoparticles can be significantly affected by the introduction of Ba into the CuS lattice.
To the best of our knowledge, only a few studies have been conducted on the synthesis and characterization of CuS doped with Ba. Many different techniques have been used to synthesize CuS nanoparticles, including chemical co-precipitation (CCP),13 sonochemical synthesis,14 the sol–gel method,15 hydrothermal,16 and irradiation techniques.17 The chemical co-precipitation method (CCP) stands out among these synthesis procedures since few of the others have required high temperatures, hazardous solvents, or several steps in the synthesis process. These additional benefits of the co-precipitation approach simple and inexpensive technology, easy control over particle size, and a lower temperature requirement (90 °C)—are all advantages of this method.18 The aim and novelty of this work is to report the effects of doping CuS with Ba on the structural and optical properties of the host CuS. Also, to the best of our knowledge, there is no previous study about the effect of Ba-doped CuS on the lung cancer cell, so CuS nanostructures will be biologically studied by examining the anticancer toxicity against human lung (A549) cancer cells using the MTT assay.
2. Materials and method
2.1 Materials
Copper chloride 2-hydrate (CuCl2·2H2O, ≥99%), barium chloride dehydrates (BaCl2·2H2O, ≥99%), and sodium sulfide hydrate (Na2S·xH2O, ≥65%). All of the chemicals in this work have been used without further purification. Distilled water was used for preparing all of the aqueous solutions.2.2 Preparation of pure and Ba doped CuS nanoparticles
Copper chloride 2-hydrate and sodium sulfide hydrate were employed as source precursors for the synthesis of CuS nanoparticle material using the co-precipitation method, which allowed for the growth of a pure CuS sample.In order to accomplish total dissolution in solution (A), 2 M of sodium sulfide hydrate was dissolved in 25 ml of distilled water and continuously stirred for 20 minutes at room temperature. In solution (B), 10 ml of distilled water was mixed with 2 M copper chloride 2-hydrate for 20 minutes. Drops of the homogenous solution (A) were added to the solution (B), which was then stirred using a magnetic stirrer for 1 hour at room temperature. The produced solution was aged for two hours, and the end product was filtered through filter paper and washed many times with distilled water and ethanol in order to remove impurities. To obtain the dark greenish powder sample, it was then dried for three hours at 100 °C in the oven. Before further characterization, it is gently ground in a mortar to produce the material in powder form. Barium chloride dehydrate, with x = 0.025, 0.05, 0.075, and 0.1, was added to a solution of copper chloride 2-hydrate (solution B), and the same process described above was then used to produce Cu1−xBaxS nanoparticles with various doping concentrations. As shown schematically in Fig. 1, the procedures followed to produce hexagonal copper sulfide nanoparticles.
 | ||
| Fig. 1 Schematic diagram of the steps used for the synthesis of pure and Ba-doped CuS nanoparticles. | ||
2.3 Characterizations
Various characterization investigations were performed on the obtained samples of nanoparticles. Utilizing an XD-2 X-ray diffractometer with CuK-1 radiation of λ = 0.154056 nm, the crystal structure and crystallite size of the materials were studied. The corresponding selected area electron diffraction (SAED) pattern and the high-resolution transmission electron micrograph (HR-TEM) were obtained by Transmission Electron Microscopy (JEM-2100, Japan). ImageJ 1.53e software was used to evaluate the size of TEM images. A total reflection X-ray fluorescence (TXRF) spectrometer (Bruker S8 TIGER) was used to do the elemental analysis. The reflectance spectra transformation was measured using an ultraviolet-visible-near infrared (UV-VIS-NIR) diffuse reflectance spectrophotometer (V-570). The photoluminescence measurements were performed on the spectrofluorometer FS5 (Edinburgh). Origin Pro 8 was used to plot the graphs.2.4 Anticancer activity of CuS nanoparticles
Each well was then filled with freshly produced MTT salt (5 mg ml−1; Sigma). After carefully removing the MTT solution, an equivalent volume of 200 μl DMSO was then added to each well and incubated for 60 minutes while shaking. To detect the growth of cells, the Multiskan® EX (Thermo Scientific, USA) MicroPlate Reader was used to measure the absorbance of each well at 590 nm. The experiment was carried out three times in parallel. IC50 values were calculated using GraphPad Prism and a non-linear fit of the dose–response curve.
3. Results and discussion
3.1 XRD analysis
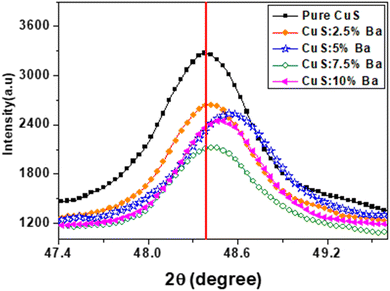
Fig. 2 shows the XRD pattern of CuS and Ba-doped CuS nanostructures at concentrations of 2.5%, 5%, 7.5%, and 10%. The peaks of the (101), (102), (006), (110), (108), and (116) planes in the diffraction spectra represent the hexagonal phase of pure covellite of CuS. The cell characteristics are a = 3.792 Å and c = 16.344 Å, and all of the measured peaks match the peaks in JCPDS card no. 06-0464. Except for the hexagonal phase, no other phase was seen. However, as Ba dopant concentrations increased, we noticed some new impurity peaks at locations 2θ = 24.3° and 43.5°, which demonstrates that Ba is present in the CuS lattice. By comparing their peaks with JCPDS cards, the existence of impurities was confirmed. JCPDS card no. 08-0454 for BaS and JCPDS card no. 50-0690 for BaCu4S3. It is evident that the (110) plane has a high intensity peak, indicating that nanocrystallites prefer to form on this plane as their preferred crystal plane. Furthermore, Table 1 lists the major peak position and full width at half maxima, clearly showing that Ba doping has little impact on CuS microstructure. As can be observed in Fig. 3, as the barium concentration in the CuS sample increases to 7.5%, the intensity decreases, followed by an increase in its value. The intensities of the peaks, however, significantly decreased when CuS was doped with 7.5 percentages of Ba impurities. Also, the position of the peaks of Ba-doped CuS shifted a little to higher 2θ angles. In actuality, the CuS lattice is distorted because of the substitution or interstitial of Ba atoms in the CuS structure.19| Samples | d (Å) | (2θ degree) | (β degree) | D (nm) | a (Å) | c (Å) | δ × 1015 (m−2) dislocation density | Vcell (Å)3 |
|---|---|---|---|---|---|---|---|---|
| Pure | 1.8776 | 48.38 | 0.575 | 15.14 | 3.755 | 16.369 | 4.36 | 199.912 |
| 2.5% Ba | 1.8784 | 48.42 | 0.535 | 16.28 | 3.757 | 16.224 | 3.77 | 198.308 |
| 5% Ba | 1.8725 | 48.58 | 0.562 | 15.51 | 3.745 | 16.331 | 4.16 | 198.354 |
| 7.5% Ba | 1.8791 | 48.42 | 0.522 | 16.69 | 3.758 | 16.235 | 3.59 | 198.580 |
| 10% Ba | 1.8769 | 48.48 | 0.532 | 16.37 | 3.754 | 16.438 | 3.73 | 200.598 |
Using the Scherer formula, the high intensity peak of the X-ray diffraction patterns was used to determine the crystallite size (D) of pure and Ba-doped CuS nanostructures:20
 | (1) |
The following equation determines the lattice constants a and c for a hexagonal-phase structure,21 and the obtained values are reported in Table 1.
 | (2) |
Table 1 displays the changing lattice constants with barium doping concentration on the CuS nanostructure. The following relation describes the dislocation density, which is the length of the dislocation lines in a unit volume of the crystal:22
 | (3) |
The volume of the unit cell of the hexagonal system was calculated. using equation.23
| V = 0.866 × a2 × C | (4) |
The dislocation density and volume of the unit cell in the hexagonal crystal structure are presented in Table 1. As can be seen from Table 1, dislocation density values decrease with Ba doping, leading to improved CuS crystallinity. Ba doping has improved the CuS crystal structure, which explains why the δ values have decreased. Additionally, doping until 7.5% of Ba-doping increases and reduces the volume of the unit cell. According to Vegard's law,24 doping can take place at interstitial locations, which helps to explain how the volume of the CuS matrix changes when Ba is incorporated into it.
3.2 TEM and SAED analysis
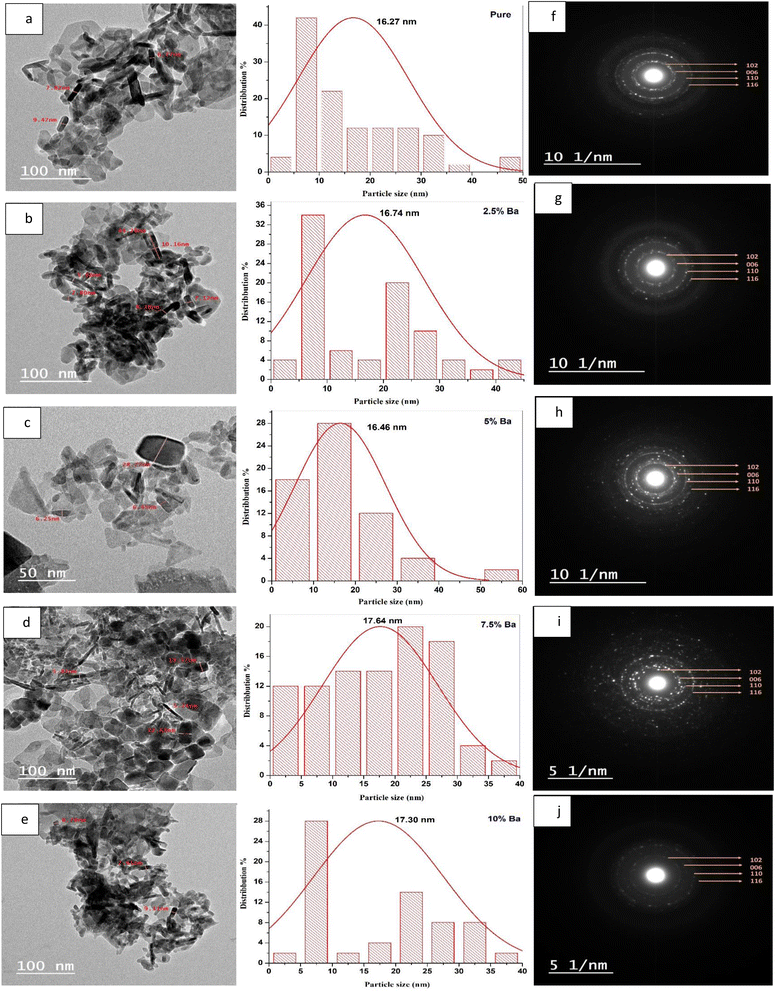
TEM images of the samples were examined to estimate the size of the produced nanoparticles and define their morphologies. Fig. 4(a–e) presents TEM images of CuS and Ba-doped CuS nanoparticles with their respective particle size distribution histograms. Agglomeration of the particles was observed, which resulted in a variation in the particle size. The morphology of pure CuS consists of nanorods and hexagonal with an average particle size of 16.27 nm, while 2.5% Ba-doped CuS nanoparticles are mostly nanorods with an average size of 16.74 nm. With an average size of 16.46 nm, the 5% Ba-doped CuS consists of a variety of nanoparticle shapes, including triangular, rectangular, and nanorod. Thin nanorods, rectangular, cubic, and irregular shapes (17.64 nm) were obtained with 7.5% Ba-doped CuS nanoparticles. 10% Ba nanoparticles most often have a nanorod shape, but near-spherical, irregular, and other shapes were also found (17.30 nm). The resultant (SAED) pattern of the copper sulfide nanoparticles (Fig. 4(f–j)) revealed the crystalline structure and may be indexed to the hexagonal Ba-doped CuS nanostructures' (102), (006), (110), and (116) planes. The sample's polycrystalline nature is indicated by well-defined diffraction rings in the SAED pattern, which is consistent with the XRD observation.3.3 Total reflection X-ray fluorescence (TXRF)
The quantitative analysis of each sample was determined using TXRF. Table 2 displays the elemental compositions of CuS and Ba-doped CuS nanoparticles. Cu and S are the major components in all samples, while Ba is the minor element. The results confirm the presence of Ba in the CuS nanoparticle structure. Other elements (Cl, P, and Ca) were detected as traces.| Samples | Cu, % | S, % | Ba, % | Cl, P, Ca (traces), % |
|---|---|---|---|---|
| Pure | 55.25 | 44.39 | — | 0.36 |
| 2.5% Ba | 53.40 | 44.23 | 2.05 | 0.32 |
| 5% Ba | 52.36 | 43.42 | 3.9 | 0.32 |
| 7.5% Ba | 51.01 | 42.20 | 6.45 | 0.34 |
| 10% Ba | 51.35 | 43.53 | 4.76 | 0.36 |
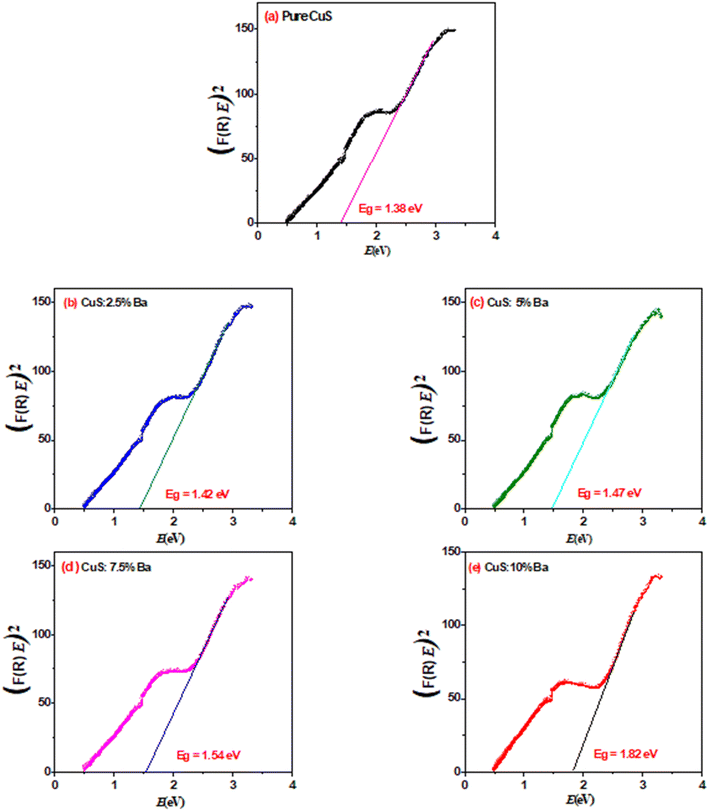
3.4 Optical analysis
 | (5) |
| (F(R)E) = (E − Eg)n | (6) |
| Sample | Eg (eV) |
|---|---|
| Pure | 1.38 |
| 2.5% Ba | 1.42 |
| 5% Ba | 1.47 |
| 7.5% Ba | 1.54 |
| 10% Ba | 1.82 |
 | (7) |
 | (8) |
 | (9a) |
 | (9b) |
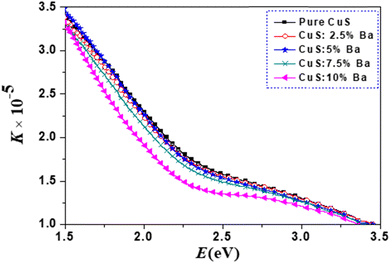
From Fig. 9, a trend in the change of the refractive index of the samples can be determined. It is clear that the refractive index increases with an increase in the photon energy (E), after which there is a decrease in higher photon energy. Additionally, as the amount of Ba dopants rises, the refractive index value does as well. Pure and Ba-doped CuS nanoparticles exhibit an increase in refractive index with increasing E (normal dispersion). Anomalous dispersion is the opposite type.26
3.5 Photoluminescence study
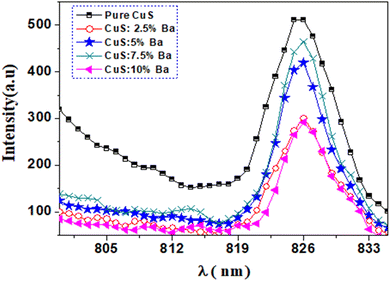
Fig. 10 shows photoluminescence (PL) spectra of pure and barium-doped copper sulfide (2.5%, 5%, 7.5%, and 10%) at room temperature. The measurements were performed at a wavelength of excitation of 535 nm. The spectra have a peak at 826 nm (E = 1.50 eV), observed from pure CuS and doped CuS nanoparticles. It is clear from Fig. 10 that pure CuS nanoparticles exhibit the maximum intensity of luminescence. The position of the band remains the same in the current study when Ba is added to the CuS matrix, but the intensity of the band changes in relation to the Ba concentration. A significant reduction in luminescence intensity is seen with the addition of Ba to the CuS host lattice. The reduced rate of electron and hole recombination causes the luminescence intensity to decrease, especially at 2.5 and 10% Ba doping concentrations. More photocatalytic activity in semiconductors is produced by lower recombination, which reduces photoluminescence intensity.33,34 The reduction of electron–hole recombination could therefore increase the photocatalytic activity of Ba-doped CuS.The decrease in semiconductor PL emission band intensities is inversely related to the rate of radiative recombination.35 The four state possibilities of electron–hole pairs in polycrystalline semiconductors with a high hole conductivity (p-type) include: (1) band-to-tail (BT), in which a free electron is displaced in the valence band tail with a cavity; (2) band-to-band (BB), which consists of an electron and a hole that are both free, (3) a band-to-impurity (BI) state is one in which the acceptor state is not sufficiently deep to overlap with the tail of the valence band, and (4) donor–acceptor pairs consist of an acceptor state and a donor state that are deep enough to avoid overlapping with their respective band tails.36 In the current work, the photoluminescence band at 826 nm (1.5 eV) results from band-to-band in addition to band-to-impurity recombination in CuS.
3.6 Biological activity
 | ||
| Fig. 11 Cell viability % versus logarithm of the concentration and IC50 values obtained for tested samples. | ||
These NPs easily penetrate the lung cells, producing ROS that induce cell death. The Ba–CuS NPs penetrate the cells and disrupt the function of the cancer cells. An important phenomenon is that materials with narrow energy band gaps absorb energy from sunlight and damage cancer cell membranes. The charge on the metal ions is another crucial characteristic for A549 cancer cell killing. It was shown that positive charges like Ba2+ and Cu2+ are produced by NPs to increase their effectiveness against cancer cells, and the cell membrane becomes negatively charged as a result of ionic interactions. The charge effect is responsible for both the position of attraction towards the negatively charged cell membrane and the attraction produced between the positive and negative charges. Cancerous cells die as a result of the aggressive interaction between Ba–CuS NPs and a surface with negative charges on cancer cell membranes.38
4. Conclusion
In the current study, we investigate how barium affects the structural, optical, and anticancer characteristics of copper sulfide (CuS) NPs prepared through a simple chemical co-precipitation technique. CuS-NPs were characterized using XRD and TEM to determine their structural characteristics. After doping by Ba, Scherrer's formula revealed an increase in crystallite size for the particles. With changing barium concentrations in CuS, the energy band gap shifted from 1.38 to 1.82 eV. The value of the refractive index of each sample was determined using the optical reflectance method, and the results show that the refractive index increases with increasing Ba dopants. Ba-doped CuS NPs have a positive impact on tumor toxicity in the A549 cancer cell line, suggesting that it may be an effective cancer treatment.Data availability
All data supporting the findings of this study are included in the manuscript.Conflicts of interest
There are no conflicts to declare.Acknowledgements
The authors extend their appreciation to the Deanship of Scientific Research at Northern Border University, Arar, KSA for funding this research work through the project number NBU-FFR-2025-310-01.References
- S. M. AL-Jawad, A. A. Taha and A. M. Redha, Studying the structural, morphological, and optical properties of CuS: Ni nanostructure prepared by a hydrothermal method for biological activity, J. Sol-Gel Sci. Technol., 2019, 91, 310–323 CrossRef CAS.
- S. M. H. Al-Jawad, A. A. Taha and M. M. Muhsen, Study the Structural, Morphological and Optical Properties of Copper Sulfide Prepared by Two-Phase Colloidal Method, J. Phys.: Conf. Ser., 2021, 1, 012046 CrossRef.
- K. Jeyabanu, P. Devendran, A. Manikandan, R. Packiaraj, K. Ramesh and N. Nallamuthu, Preparation and characterization studies of La doped CuS nanospheres by microwave irradiation for high performance supercapacitors, Phys. B, 2019, 573, 92–101 CrossRef CAS.
- M. Bekhit, A. O. Abo El Naga, M. El Saied and M. I. Abdel Maksoud, Radiation-induced synthesis of copper sulfide nanotubes with improved catalytic and antibacterial activities, Environ. Sci. Pollut. Res., 2021, 28, 44467–44478 CrossRef CAS PubMed.
- Y. Liu, M. Liu and M. T. Swihart, Plasmonic copper sulfide-based materials: a brief introduction to their synthesis, doping, alloying, and applications, J. Phys. Chem. C, 2017, 121(25), 13435–13447 CrossRef CAS.
- M. Pal, N. Mathews, E. Sanchez-Mora, U. Pal, F. Paraguay-Delgado and X. Mathew, Synthesis of CuS nanoparticles by a wet chemical route and their photocatalytic activity, J. Nanopart. Res., 2015, 17, 1–12 CrossRef CAS.
- N. Ahmad, A. Alshehri, I. Ahmad, M. Shkir, P. Hasan and A. A. Melaibari, In doping effect on the structural, morphological, optical and enhanced antimicrobial activity of facilely synthesized novel CuS nanostructures, Surf. Interfaces, 2021, 27, 101536 CrossRef CAS.
- A. M. Ahmed, E. M. Abdalla and M. Shaban, Simple and low-cost synthesis of Ba-doped CuO thin films for highly efficient solar generation of hydrogen, J. Phys. Chem. C, 2020, 124(41), 22347–22356 CrossRef CAS.
- A. Ur Rehman, M. Ikram, A. Haider, M. A. Raza, T. Shujah, M. Naz, A. Ul-Hamid, I. Shahzadi, S. Goumri-Said and M. B. Kanoun, Facile Synthesis of Barium-Doped Cadmium Sulfide Quantum Dots for the Treatment of Polluted Water: Experimental and Computational Investigations, ACS Omega, 2022, 7(50), 46325–46336 CrossRef CAS PubMed.
- C. Pathak, D. Mishra, V. Agarwala and M. Mandal, Blue light emission from barium doped zinc sulfide nanoparticles, Ceram. Int., 2012, 38(7), 5497–5500 CrossRef CAS.
- B. Sahin, Y. Gülen, F. Bayansal, H. Cetinkara and H. Güder, Structural and optical properties of Ba-doped CdO films prepared by SILAR method, Superlattices Microstruct., 2014, 65, 56–63 CrossRef CAS.
- K. Vijayalakshmi and D. Sivaraj, Synergistic antibacterial activity of barium doped TiO2 nanoclusters synthesized by microwave processing, RSC Adv., 2016, 6(12), 9663–9671 RSC.
- Y. Wang, F. Jiang, J. Chen, X. Sun, T. Xian and H. Yang, In situ construction of CNT/CuS hybrids and their application in photodegradation for removing organic dyes, Nanomaterials, 2020, 10(1), 178 CrossRef CAS PubMed.
- A. Singh, R. Manivannan and S. N. Victoria, Simple one-pot sonochemical synthesis of copper sulphide nanoparticles for solar cell applications, Arabian J. Chem., 2019, 12(8), 2439–2447 CrossRef CAS.
- S. Riyaz, A. Parveen and A. Azam, Microstructural and optical properties of CuS nanoparticles prepared by sol–gel route, Perspect. Sci., 2016, 8, 632–635 CrossRef.
- L. Zhang, Y. Guo, A. Iqbal, B. Li, D. Gong, W. Liu, K. Iqbal, W. Liu and W. Qin, One-step synthesis of the 3D flower-like heterostructure MoS2/CuS nanohybrid for electrocatalytic hydrogen evolution, Int. J. Hydrogen Energy, 2018, 43(3), 1251–1260 CrossRef CAS.
- Z. I. Ali, M. Bekhit, R. Sokary and T. A. Afify, Radiation synthesis of copper sulphide/poly (vinyl alcohol) nanocomposites films: an efficient and reusable catalyst for p-nitrophenol reduction, Int. J. Environ. Anal. Chem., 2019, 99(13), 1313–1324 CrossRef CAS.
- B. Pejjai, M. Reddivari and T. R. R. Kotte, Phase controllable synthesis of CuS nanoparticles by chemical co-precipitation method: effect of copper precursors on the properties of CuS, Mater. Chem. Phys., 2020, 239, 122030 CrossRef CAS.
- R. Zeinodin, F. Jamali-Sheini and M. Cheraghizade, Physical properties of Pb-doped CuS nanostructures for optoelectronic applications, Mater. Sci. Semicond. Process., 2021, 123, 105501 CrossRef CAS.
- M. S. Rathore, H. Verma, S. B. Akhani, J. Pathak, U. Joshi, A. Y. Joshi, C. Prakash, K. Kaur and A. Oza, Photoluminescence and Antibacterial Performance of Sol-Gel Synthesized ZnO Nanoparticles, Mater. Adv., 2024, 5(8), 3472–3481 RSC.
- S. Sivakumar, Y. Robinson and N. A. Mala, Studies on photocatalytic performance and supercapacitor applications of undoped and Cu-doped ZnO nanoparticles, Appl. Surf. Sci. Adv., 2022, 12, 100344 CrossRef.
- A. Khan, S. E. Mohamed, T. I. Al-Naggar, H. B. Albargi, J. S. Algethami and A. M. Abdalla, Influence of sintering temperature on structural and optical properties of pure and Cl-doped ZnO nanoparticles, J. Radiat. Res. Appl. Sci., 2024, 17(2), 100910 CAS.
- S. Podili, D. Geetha and P. Ramesh, One-pot synthesis of CTAB stabilized mesoporous cobalt doped CuS nano flower with enhanced pseudocapacitive behavior, J. Mater. Sci.: Mater. Electron., 2017, 28, 15387–15397 CrossRef CAS.
- A. Nakrela, N. Benramdane, A. Bouzidi, Z. Kebbab, M. Medles and C. Mathieu, Site location of Al-dopant in ZnO lattice by exploiting the structural and optical characterisation of ZnO: Al thin films, Results Phys., 2016, 6, 133–138 CrossRef.
- P. Makuła, M. Pacia, and W. Macyk, How to Correctly Determine the Band Gap Energy of Modified Semiconductor Photocatalysts Based on UV–Vis Spectra, ACS Publications, 2018, pp. 6814–6817 Search PubMed.
- C. Aydın, O. A. Al-Hartomy, A. Al-Ghamdi, F. Al-Hazmi, I. Yahia, F. El-Tantawy and F. Yakuphanoglu, Controlling of crystal size and optical band gap of CdO nanopowder semiconductors by low and high Fe contents, J. Electroceram., 2012, 29, 155–162 CrossRef.
- M. Shkir, Z. R. Khan, K. V. Chandekar, T. Alshahrani, A. Kumar and S. AlFaify, A facile microwave synthesis of Cr-doped CdS QDs and investigation of their physical properties for optoelectronic applications, Appl. Nanosci., 2020, 10, 3973–3985 CrossRef CAS.
- M. Saranya, C. Santhosh, R. Ramachandran, P. Kollu, P. Saravanan, M. Vinoba, S. K. Jeong and A. N. Grace, Hydrothermal growth of CuS nanostructures and its photocatalytic properties, Powder Technol., 2014, 252, 25–32 CrossRef CAS.
- S. B. Aziz, R. T. Abdulwahid, H. A. Rsaul and H. M. Ahmed, In situ synthesis of CuS nanoparticle with a distinguishable SPR peak in NIR region, J. Mater. Sci.: Mater. Electron., 2016, 27, 4163–4171 CrossRef CAS.
- D. Pal, G. Singh, Y. Goswami and V. Kumar, Synthesis of randomly oriented self assembled CuS nanorods by co-precipitation route, J. Mater. Sci.: Mater. Electron., 2019, 30, 15700–15704 CrossRef.
- A. Al-Hammadi and S. H. Khoreem, Investigations on Optical and Electrical Conductivity of Ba/Ni/Zn/Fe16O27 Ferrite Nanoparticles, Biointerface Res. Appl. Chem., 2022, 13, 168 Search PubMed.
- N. Dhineshbabu, V. Rajendran, N. Nithyavathy and R. Vetumperumal, Study of structural and optical properties of cupric oxide nanoparticles, Appl. Nanosci., 2016, 6, 933–939 CrossRef CAS.
- A. B. Lavand and Y. S. Malghe, Synthesis, characterization and visible light photocatalytic activity of carbon and iron modified ZnO, J. King Saud Univ., Sci., 2018, 30(1), 65–74 CrossRef.
- D. Wojcieszak, D. Kaczmarek, J. Domaradzki and M. Mazur, Correlation of photocatalysis and photoluminescence effect in relation to the surface properties of TiO2: Tb thin films, Int. J. Photoenergy, 2013,(1), 526140 Search PubMed.
- F. Jamali-Sheini, F. Niknia, M. Cheraghizade, R. Yousefi and M. R. Mahmoudian, Broad spectral response of Se-doped SnS nanorods synthesized through electrodeposition, ChemElectroChem, 2017, 4(6), 1478–1486 CrossRef CAS.
- M. Grossberg, J. Krustok, K. Timmo and M. Altosaar, Radiative recombination in Cu2ZnSnSe4 monograins studied by photoluminescence spectroscopy, Thin Solid Films, 2009, 517(7), 2489–2492 CrossRef CAS.
- M. M. El-Zayat, M. M. Eraqi, H. Alrefai, A. Y. El-Khateeb, M. A. Ibrahim, H. M. Aljohani, M. M. Aljohani and M. M. Elshaer, The antimicrobial, antioxidant, and anticancer activity of greenly synthesized selenium and zinc composite nanoparticles using Ephedra aphylla extract, Biomolecules, 2021, 11(3), 470 CrossRef CAS PubMed.
- A. Ullah, M. Saadullah, F. Alvi, L. Sherin, A. Ali, N. A. Shad, Y. Javed, M. M. Sajid, G. Yasin and W. Abbas, Synergistic effect of silver doped ZnO nanomaterials enhances the anticancer potential against A459 lung cancer cells, J. King Saud Univ., Sci., 2022, 34(1), 101724 CrossRef.
| This journal is © The Royal Society of Chemistry 2025 |


