DOI:
10.1039/D4RA07773C
(Paper)
RSC Adv., 2025,
15, 7004-7017
Supradecoration induced homogenous electrochemical sensing: development of Ru(II) half sandwich complex as isoniazid and rifampicin dual sensor†
Received
31st October 2024
, Accepted 9th February 2025
First published on 4th March 2025
Abstract
Homogenous electrochemical sensing using unmodified electrodes remove electrode fabrication challenges and prove effective for detecting sensitive bio-analytes without chances of surface degradation. This work envisages design and optimization of a ruthenium(II) half-sandwich complex as supradecorated homogeneous electrochemical sensor for simultaneous detection of rifampicin (RIF) and isoniazid (INH) as first-line anti-tuberculosis drugs in aqueous environments. The electrochemical profile of GCE/ruthenium(II) half-sandwich complex sensor was analyzed using cyclic voltammetry, differential pulse voltammetry and electrochemical impedance spectroscopy (EIS). The results indicate significant electrochemical parameters corroborating enhanced sensing propensity of GCE/ruthenium(II) half-sandwich complex over bare GCE for simultaneous estimation of RIF and INH binary mixture. The RIF and INZ analytical figure of merit has been corroborated with their relative supra interactional propensity. Supra interactional propensity has also been predicted to be the plausible mechanism of RIF and INZ electrochemical sensing. Under optimized conditions GCE/ruthenium(II) half-sandwich complex sensor depicted INH detection limits of 1.2 μM, and RIF detection limit of 32 nM. The comparative study of RIF and INZ analytes individually depicted high sensitivity of 24.57 μA μM−1 cm−2 and 1.69 μA μM−1 cm−2 under a linear response in the range of 0.29–3.72 μM and 4.9–82.22 μM for RIF and INH respectively. The analytical figure of merit of homogenous sensor has been compared to other GCE modified electrodes for RIF and INZ analytes. A significant antibiotic contaminant recovery of RIF and INZ drugs in pharmaceutical formulations, municipal water supplies and Dal lake water under spiked as well as unspiked conditions was observed portraying real time sensing application propensity. The homogenous GCE/ruthenium(II) half-sandwich complex expresses excellent stability and reproducibility. The GCE/ruthenium(II) half-sandwich complex in the presence of potential redox active biological interfering agents confirmed selectivity towards RIF and INZ analytes.
Introduction
Electrochemical sensing is a promising tool for real time monitoring of contaminant concentrations for safety assessment and sustainability. Increase in global use of antibiotics for commercial agriculture and for human medicine has developed these into non conventional contaminants with ecotoxicological concerns and adverse effects on human health.1–3 Their prevalence, risk assessment evaluation and natural attenuation rate has labeled antibiotics as major persistent contaminants challenging environmental sustainability.4–6 The cosmopolitan distribution of antibiotic residues in surface,7 waste-waters,8,9 sediments,10 crops,11 and drinking water12,13 lead to sustained exposure developing antibiotic-resistant bacteria (ARB) and antibiotic-resistant genes (ARG).8 World Health Organization (WHO), considers ARGs as major threats to human and animal health in the 21st century.14,15 A comprehensive analytical monitoring of antibiotics in environmental segments especially water bodies is crucial from sustainability, antibiotic resistance and water treatment point of view.16–18 Bacterial strains resistant to standard first-line TB treatment drugs isoniazid (INH) and rifampicin (RIF) represent practically incurable multidrug-resistant (MDR) TB. MDR-TB strains that are resistant to fluoroquinolones and second-line injectable drugs represent more fatal extensively drug-resistant (XDR) TB.19 Thus, real time antibiotic monitoring is crucial for resistance surveillance and extent of antibiotic resistance evaluation20 In addition, INH and RIF monitoring is also vital in tracking drug metabolism and dosage regulation in patient care as overdose can cause seizures, metabolic acidosis, coma, and injected doses of 80 mg per kg or more can be fatal.21
Among plethora of antibiotic monitoring techniques, electrochemical sensing methods standout to their advantages of real-time on spot analysis, feasibility of device fabrication, simple sampling, good sensitivity and detection limits mostly under affordable cost.22–24 Mostly electrochemical sensors involve a heterogeneous interface formed by immobilization of sensing material on a glassy carbon electrode surface, this approach although wide spread is laborious, require binders and solvents that can interfere activity of bioanalytes, and develop electrode reproducibility concerns. In continuation of our interests in electrochemical monitoring of environmental contaminants,25,26 a homogenous electrochemical sensing strategy has ability to overcome these concerns of traditional sensors, and is attracting attention for estimation of sensitive bioanalytes.27–29 Half-sandwich Ru(II) complexes show well behaved Ru(II)/Ru(III) redox behavior with a very low over potential desirable for electrochemical applications.30 Electrochemical sensors capable of simultaneous evaluation of isoniazid and rifampicin are scarce.31 Keeping view of the good electrochemical propensity of Ru(II) complexes, and need of simultaneous estimation of first-line TB treatment drugs, we envisaged the design and development of Ru(II) half-sandwich complex as homogenous electrochemical sensor. The electrochemical profiling of sensor was assessed from cyclic voltammetry (CV) data analysis and its analytical figure of merit for TB drug binary mixture was assessed using differential pulse voltammetry (DPV) technique. The electrochemical sensor exhibited excellent cyclic stability, low detection limit (LOD), high sensitivity and wide linear ranges for detection of RIF and INH. The simultaneous estimation of RIF and INZ drugs in test samples, pharmaceutical formulations, municipal water supplies and Dal lake water under spiked as well as unspiked conditions depicted more than 95% recovery confirming its real time sensing propensity. The computational studies were attempted for an insight to the observed changes in the CV plots and the difference in the analytical figure of merit of RIF and INH drugs. Computational studies based on frontier molecular orbital, molecular electrostatic potential and Hirshfeld surface analysis predicts mediator based mechanism of sensing. Diverse non covalent interactions developed by groups in isoniazid and rifampicin analytes with cymene ring, chloride and valine ligands in the Ru(II) half sandwich sensor explain observed differences in their analytical figure of merit. Taken together this case study of novel Ru(II) half-sandwich complex electrochemical sensing of RIF and INH drugs aims to invoke the concept of supradecoration induced homogenous electrochemical sensing, which can be of high value in engineering analyte specific sensors.
Experimental
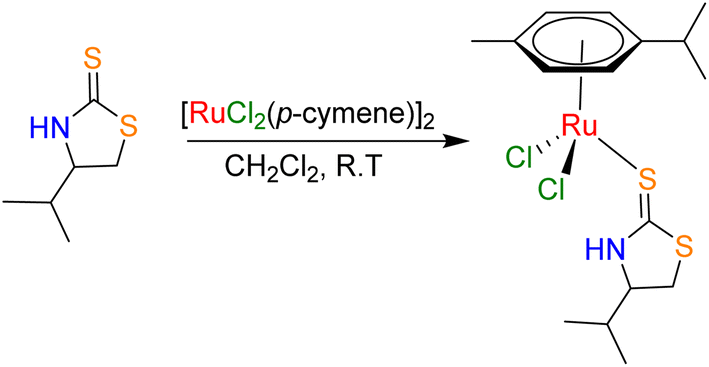
Synthesis of ruthenium(II) half sandwich complex
The ligand was synthesized following a reported method, involving the reduction of the amino acid valine to its corresponding amino alcohol, which was then cyclized to yield the thione (shown in Scheme S1†).32 The Ru(II) complex was synthesized using [Ru(p-cymene)Cl2]2 (0.16 mmol) as the starting material (Scheme 1). The dimeric Ru(II) precursor was dissolved in 20 mL of freshly dried dichloromethane under a nitrogen atmosphere in a two-neck round-bottom flask. To this solution, the ligand (0.33 mmol) was added, and the mixture was stirred at room temperature for one hour. The reaction mixture was concentrated to 2 mL using a rotary evaporator and 10 mL of petroleum ether was added to precipitate the product. The resulting red solid was filtered, washed with diethyl ether, and recrystallized from a 1![[thin space (1/6-em)]](https://www.rsc.org/images/entities/char_2009.gif) :1 mixture of dichloromethane and diethyl ether. The final product (yield: 80%) was characterized using 1H NMR spectroscopy (Fig. 1) and elemental analysis. 1H NMR spectrum was recorded on a Bruker AMX 400 MHz spectrometer. A solution of 15 mg (0.03 mmol) of the synthesized complex was dissolved in 0.5 mL of CDCl3, and transferred into a NMR for 1HNMR data. The chemical shifts are reported in ppm relative to the chloroform-d solvent peak at δ 7.26 (singlet). Elemental analysis was performed using a vario MICRO CUBE CHNS analyzer.
:1 mixture of dichloromethane and diethyl ether. The final product (yield: 80%) was characterized using 1H NMR spectroscopy (Fig. 1) and elemental analysis. 1H NMR spectrum was recorded on a Bruker AMX 400 MHz spectrometer. A solution of 15 mg (0.03 mmol) of the synthesized complex was dissolved in 0.5 mL of CDCl3, and transferred into a NMR for 1HNMR data. The chemical shifts are reported in ppm relative to the chloroform-d solvent peak at δ 7.26 (singlet). Elemental analysis was performed using a vario MICRO CUBE CHNS analyzer.
 |
| | Scheme 1 Solvothermal method of the ruthenium(II) half sandwich complex synthesis. | |
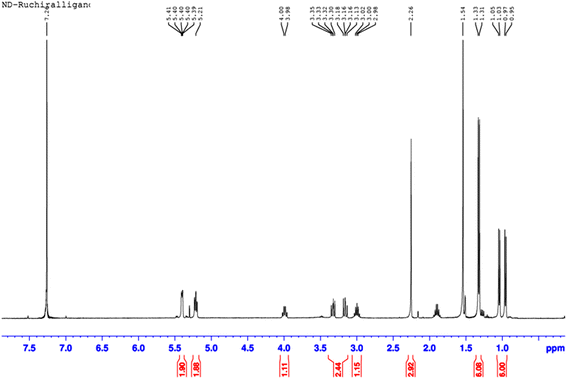 |
| | Fig. 1 1H NMR of synthesized ruthenium(II) half sandwich complex. | |
Electrochemical measurements
Electrochemical studies, including cyclic voltammetry (CV), electrochemical impedance spectroscopy (EIS) and differential pulse voltammetry (DPV), were conducted on Bio-Logic SAS potentiostat (Model SP 150) with a three-electrode set up consisting of glassy carbon electrode (GCE) as working electrode (WE), platinum wire as counter electrode (CE) and Ag/AgCl as reference electrode (RE). All electrochemical measurements were made at room temperature in acetonitrile solvent using NBu4PF6 (0.1 M) as supporting electrolyte. DPV experiments were carried out by sweeping the potential from −1.0 V to +1.0 V with a scan rate of 50 mV s−1. EIS measurements were performed over a frequency range of 10 kHz to 100 mHz.
To evaluate real time applicability of synthesised Ru(II) half sandwich complex sensor, dose dependent estimation of RIF and INZ in commercial tablets (75 mg and 100 mg) procured from local medical store were attempted. The real time analysis was also attempted by studying % recovery post spiking the water samples from municipal supply and Dal lake (34:18N, 74:91E; 1583 m above sea level). The RIF and INZ tablets were crushed to a fine powder and their 4 mM stock solutions (calculated from the claimed drug content of the tablet) were prepared in millipore water. The stock solutions were diluted (as required) for electro-chemical measurements and DPV analysis for their simultaneous estimation under optimized conditions.
In addition, analytical ability of ruthenium(II) half-sandwich complex sensor was investigated by spiking and recovery experiments of commercial tablets in municipal water supply (pH 7.7), Dal lake water (pH 7.9) and deionized water as selected real time samples. For DPV measurements, 7.0 mL of each water sample was mixed with NBu4PF6 (0.1 M dissolved in acetonitrile solvent as supporting electrolyte) in a 20 mL electrochemical cell spiked with known concentrations of RIF and INH. The simultaneous detection of RIF and INH in these samples was then analyzed using DPV technique. Recovery percentages were calculated using the formula33
here, added refers to the concentration of analyte spiked into the solution, and found represents the concentration determined through the analysis.
Results and discussion
The synthesis of the ruthenium(II) half sandwich complex from synthesized ligand is depicted in Scheme 1. The complex has familiar “three legged piano stool” geometry where Ru(II) binds two chloride ligands, one S atom, and an aromatic cymene ring.
The synthesized Ru(II) half sandwich complex was characterized using 1H NMR spectroscopy (Fig. 1) 1H NMR (CDCl3, 400 MHz, ppm) – δ = 0.95 (3H, d, J = 6.94 Hz, isopropyl), 1.03 (3H, d, J = 6.56 Hz, isopropyl), 1.31 (6H, d, J = 6.83 Hz, isopropyl), 1.85 (1H, m), 2.26 (3H, s, methyl), 2.98 (1H, m, isopropyl), 3.13 (1H, m), 3.30 (1H, m), 3.98 (1H, m), 5.21 (2H, m, cymene), 5.39 (2H, m, cymene). Elemental analysis for C16H25Cl2NRuS2, calcd (%) C, 41.11; H, 5.39; N, 3.00; S, 13.72; found: C, 40.94; H, 5.37; N, 3.05; S, 13.81. The detailed synthesis of the ligand with stepwise mechanism are reported in Schemes S1 and S2 (ESI†).
Electrochemical characterization of ruthenium(II) half sandwich complex
The electrochemical signatures of the Ru(II) half sandwich complex were evaluated by means of cyclic voltammetry (CV) and electrochemical impedance spectroscopy (EIS) in acetonitrile solvent using NBu4PF6 as supporting electrolyte. In the given potential window neat GCE showed absence of any faradaic event, while as GCE in presence of Ru(II) salt and Ru(II) half sandwich complex showed a well-defined redox behavior diagnostic to the redox features of Ru(II/III) redox couple.34–36 The cyclic voltammogram recorded with GCE in presence of Ru(II) half sandwich complex shows an reversible redox peaks at potential of 0.38 V and 0.33 V with ΔEP separation of 0.05 V, while as GCE in presence of Ru(II) salt displays irreversible redox peaks with ΔEP separation equal to 0.16 V (Fig. 2A). It is pertinent to highlight that the peak-to-peak separation (ΔEP), a key marker of electrochemical reversibility, gets significantly decreased at the GCE/Ru(II) half sandwich complex compared to GCE/Ru(II) salt. This indicates that synthesized Ru(II) half sandwich complex exhibits improved electrochemical performance (faster electron transfer kinetics and higher conductivity) in contrast to Ru(II) salt. Moreover, the comparative CV plots depict that redox events in Ru(II) half sandwich complex shift anodically compared to Ru(II) salt at the same scan rate (100 mV s−1). This is due to the coordination of ligand groups to ruthenium center creating a stronger ligand field, adding to the chemical activation barrier of the electron transfer (redox) process and hence requiring a higher energy (or more positive potential) to redox process.
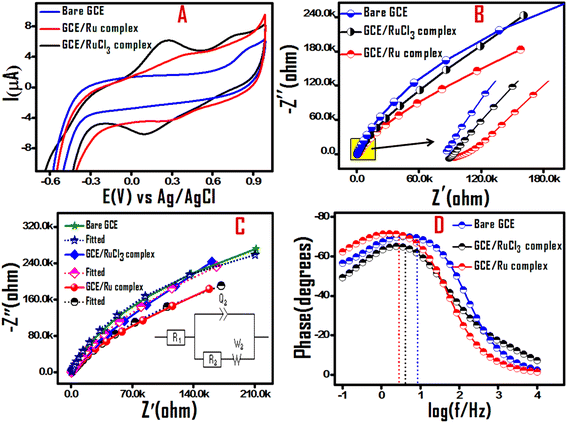 |
| | Fig. 2 (A) Comparative cyclic voltammograms recorded at scan rate of 100 mV s−1 of bare GCE, GCE/Ru(II) half sandwich complex and GCE/RuCl3, (B and C) Nyquist plots and equivalent circuit model for fitting EIS data, and (D) Bode phase plots of bare GCE, GCE/Ru salt and GCE/Ru(II) half sandwich complex obtained at a frequency range of 10 kHz to 100 mHz (all experiments were performed in acetonitrile solvent using NBu4PF6 as supporting electrolyte). | |
To understand the charge dynamics of the synthesized Ru(II) half sandwich complex, Electrochemical Impedance Spectroscopy (EIS) studies were performed. The Nyquist plots of electrodes: neat GCE, GCE/Ru(II) salt and GCE/Ru(II) half sandwich complex (recorded over 10 kHz to 100 mHz), at the corresponding redox potential depict different semicircular portions indicating varied resistance to charge transfer at high frequencies and a linear portion corresponding to diffusion process at low frequencies Fig. 2B. The obtained Nyquist curves were analyzed with an equivalent circuit model using the Z-fit method by EC-Lab V10.19 software, as shown in the Fig. 2C. The equivalent circuit consists of R1 (solution resistance), Q3 (constant phase element (CPE)), R3 (charge transfer resistance) and W3 (Warburg impedance). The charge transfer resistance (Rct) between the electrode and electrolyte is represented by the diameter of the semicircular region, resulting from the parallel combination of the resistor (R3) and the capacitor (C3). The fitted parameters are also summarized in the Table S1.† On comparing the diameter of semicircle part (Fig. 2B) as a measure of resistance to charge transfer, the homogenous solution of GCE/Ru(II) half sandwich complex was observed to give lower resistance to electron transfer (lower Rct value shown in supporting) and hence better charge transfer dynamics, and conductivity as compared to the GCE/Ru(II) salt and also neat GCE. In addition, lower impedance and enhanced conductivity of GCE/Ru(II) half sandwich complex corroborates its lower recombination of charge carriers. The predicted higher charge carrier and reduced recombination rate for GCE/Ru(II) half sandwich complex were further validated using Bode phase plot analysis. As shown in Fig. 2D, compared to GCE/Ru(II) salt and neat GCE the maximum frequency in the Bode phase plot of GCE/Ru(II) half sandwich complex shifts to lower values. This frequency shift confirms the extended carrier lifetime for GCE/Ru(II) half sandwich complex, resulting in lower recombination rate.16,37 The observed CV results and EIS inferences predict that the GCE in presence of Ru(II) half sandwich complex can be employed as a superior electrode system for electro analysis and electrochemical sensing applications.
Electrochemical behavior of GCE/Ru(II) half sandwich complex in presence of biological analytes: an attempt in simultaneous sensing of tuberculosis antibiotics rifampicin (RIF) and isoniazid (INH).
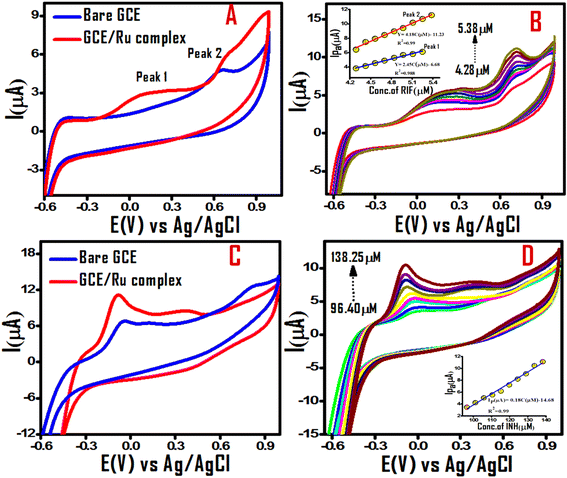
Electrochemical sensing of biological analytes is interesting for its high sensitivity, selectivity, miniaturization possibility and gadget formation for real time estimation. The observed CV and EIS results of GCE/Ru(II) half sandwich complex encouraged us to investigate selective sensing of biological analytes decorated with groups capable of non covalent interaction with the GCE/Ru(II) half sandwich electrode system. Towards this aim, rifampicin (RIF) and isoniazid (INH) as widely used tuberculosis drugs were selected as biological analytes for their simultaneous estimation in a binary mixture. In a mixed solvent system of aqueous acetonitrile with NBu4PF6 supporting electrolyte at 100 mV s−1 scan rate under argon environment at 298 K CV plots of RIF over neat GCE and GCE/Ru(II) half sandwich complex were compared (Fig. 3A).
 |
| | Fig. 3 Comparative cyclic voltammograms of rifampicin (RIF) and isoniazid (INH) antibiotics in aqueous acetonitrile solvent: (A) blue and red traces depicts RIF on bare GCE and GCE/Ru(II) half sandwich complex respectively (C) blue and red traces depicts INH on bare GCE and GCE/Ru(II) half sandwich complex respectively. (B and D) Cyclic voltammograms recorded with increasing concentrations of RIF and INH respectively, insets depict corresponding calibration plots between IP vs. concentration (μM) (all experiments have been attempted in acetonitrile solvent with NBu4PF6 as supporting electrolyte at 100 mV s−1 scan rate). | |
Fig. 3A represents CV for 4 μM RIF in absence (blue trace) and in presence of Ru(II) half sandwich complex (red trace). The electrochemical oxidation of rifampicin (RIF) in absence of Ru(II) half sandwich complex exhibits two weak oxidation peaks at approximately 0.19 V (peak 1) and 0.63 V(peak 2) vs. Ag/AgCl, suggesting the sluggish electron transfer at the bare electrode. The presence of Ru(II) half sandwich complex modifies the redox features for the RIF as is evident from the red trace in Fig. 3A. The baseline corrected current response suggests that the RIF sensing becomes possible in presence of Ru(II) half sandwich complex. This prediction was verified by recording CVs with increasing concentrations of RIF Fig. 3B with the inset of Fig. 3B showing the peak current as function of RIF concentration. The observed behavior of electrochemical response for RIF over GCE/Ru(II) half sandwich complex was seen in agreement to the literature with two well established redox peaks. The peak 1 is assigned to the oxidation of 6,9-dihydroxynapthalene moiety and peak 2 obtained is attributed to oxidation of phenolic hydroxyl group of the molecule (Scheme 2).38–40
 |
| | Scheme 2 Proposed redox events of Ru(II) half sandwich complex electrochemical sensor for RIF and INH sensing. | |
The observed RIF results encouraged us to extend our investigations to another first-line FDA-approved tuberculosis infection drug isoniazid (INH) for their simultaneous electrochemical sensing in a binary mixture. Under optimized conditions of RIF, INH also furnished its signature redox event ascribed to irreversible oxidation of amide group to iso-nicotinic acid (Scheme 2) as specified in literature41,42 (Fig. 3C and D). To validate non interfering behavior of two anti tuberculosis drug analytes in the binary mixture, we investigated their simultaneous electrochemical sensing as binary mixtures with GCE/Ru(II) half sandwich complex electrode system Fig. 4A and B. Fig. 4B represents CV response at various scan rates with signatures of both the analytes under appreciable potential gap of their corresponding redox features confirming the suitability of GCE/Ru(II) half sandwich complex electrode system as dual sensor for individual sensing of RIF and INH anti tuberculosis drugs as well as their simultaneous estimation in a binary mixture. The relative results of CV investigations performed in absence and presence of Ru(II) half sandwich complex Fig. 4A conclude that Ru(II) half sandwich complex is vital for the electroanalytical response of these biologically active analytes over GCE. The improved sensing of GCE/Ru(II) half sandwich complex over bare GCE can be assigned to the multitude of non covalent interactions of analyte moieties with the diverse chemical groups present in the Ru(II) half sandwich complex and also due to the larger accessible surface area of the designed Ru(II) half sandwich complex for the electrocatalysis.
 |
| | Fig. 4 Cyclic voltammograms recorded for mixture of 48 μM RIF and INH each on bare GCE (blue trace) and on GCE/Ru(II) half sandwich complex (red trace) (A) cyclic voltammograms recorded on GCE/Ru(II) half sandwich complex for mixture of 48 μM RIF and INH each with changing scan rates (20–120 mV s−1) (B) inset of (B) shows variation of diagnostic peak currents of RIF and INH (IP with ν) and its linear fit. (CV data was recorded in aqueous acetonitrile solvent with NBu4PF6 as supporting electrolyte at 100 mV s−1 scan rate). | |
To investigate the electrochemical kinetics of RIF and INZ oxidation on the GCE/Ru(II) half sandwich complex, the effect of scan rates ranging from 20–140 mV s−1 on the voltammetric response of RIF and INZ oxidation was studied and the results are presented in Fig. 5. As depicted in Fig. 5, the anodic peak current (Ipa) of both analytes increases notably with increasing scan rates. From the plot of the logarithm of the oxidation peak current versus the logarithm of the scan rate (Fig. 5B), the slopes for the peak 1 and peak 2 of RIF are 0.82 and 1.01 respectively. This suggests that the electrochemical process for the peak 2 is predominantly adsorption/surface controlled, while for the peak 1, both diffusion and adsorption contribute to the electrochemical process.23,43 The slope value of 0.62 for the linear relationship between the logarithm of oxidation peak current and the logarithm of the scan rate for INH (Fig. 5D), indicate the surface-diffusion controlled process with diffusion as the dominating process.44 It is also evident that a gradual shift in the anodic peak potential (Epa) is observed with increasing scan rates Fig. 5A and C, indicating kinetic limitations in the RIF and INZ oxidation process, which is characteristic of surface-controlled processes. Furthermore, it is observed that at intermediate scan rates, the appearance of the second oxidation peak centered at around 0.42 V in the cyclic voltammogram of INH is likely due to the oxidation of an intermediate species or radicals formed during the first oxidation process.42 The emergence of the second oxidation peak is further confirmed from the calibration plot of peak current versus INH concentration (Fig. 3D).
 |
| | Fig. 5 Cyclic voltammograms recorded on GCE/Ru(II) half sandwich complex with changing scan rates (20–140 mV s−1) (A) 5.4 μM RIF (C) 138 μM INH (B and D) linear fit plots between logIP vs. logν obtained for anodic peak currents of RIF and INH respectively (CV experiments were performed in aqueous acetonitrile solvent with NBu4PF6 as supporting electrolyte). | |
Based on Laviron's equation45 and using the slope of the E (V) vs. log (V s−1) plot, the number of electrons (n) involved in the electro-oxidation process were determined to be 2 for peak 1 and 1 for peak 2 for RIF and 2 in case of INH. The transfer of two-electron, two-proton (peak 1) and one-electron, one-proton (peak 2) for RIF and two-electron, two-proton in the electrochemical oxidation of RIF and INH respectively at GCE/Ru(II) half sandwich complex is consistent with the findings previously reported in the literature.39,46,47
Differential pulse voltammetric studies
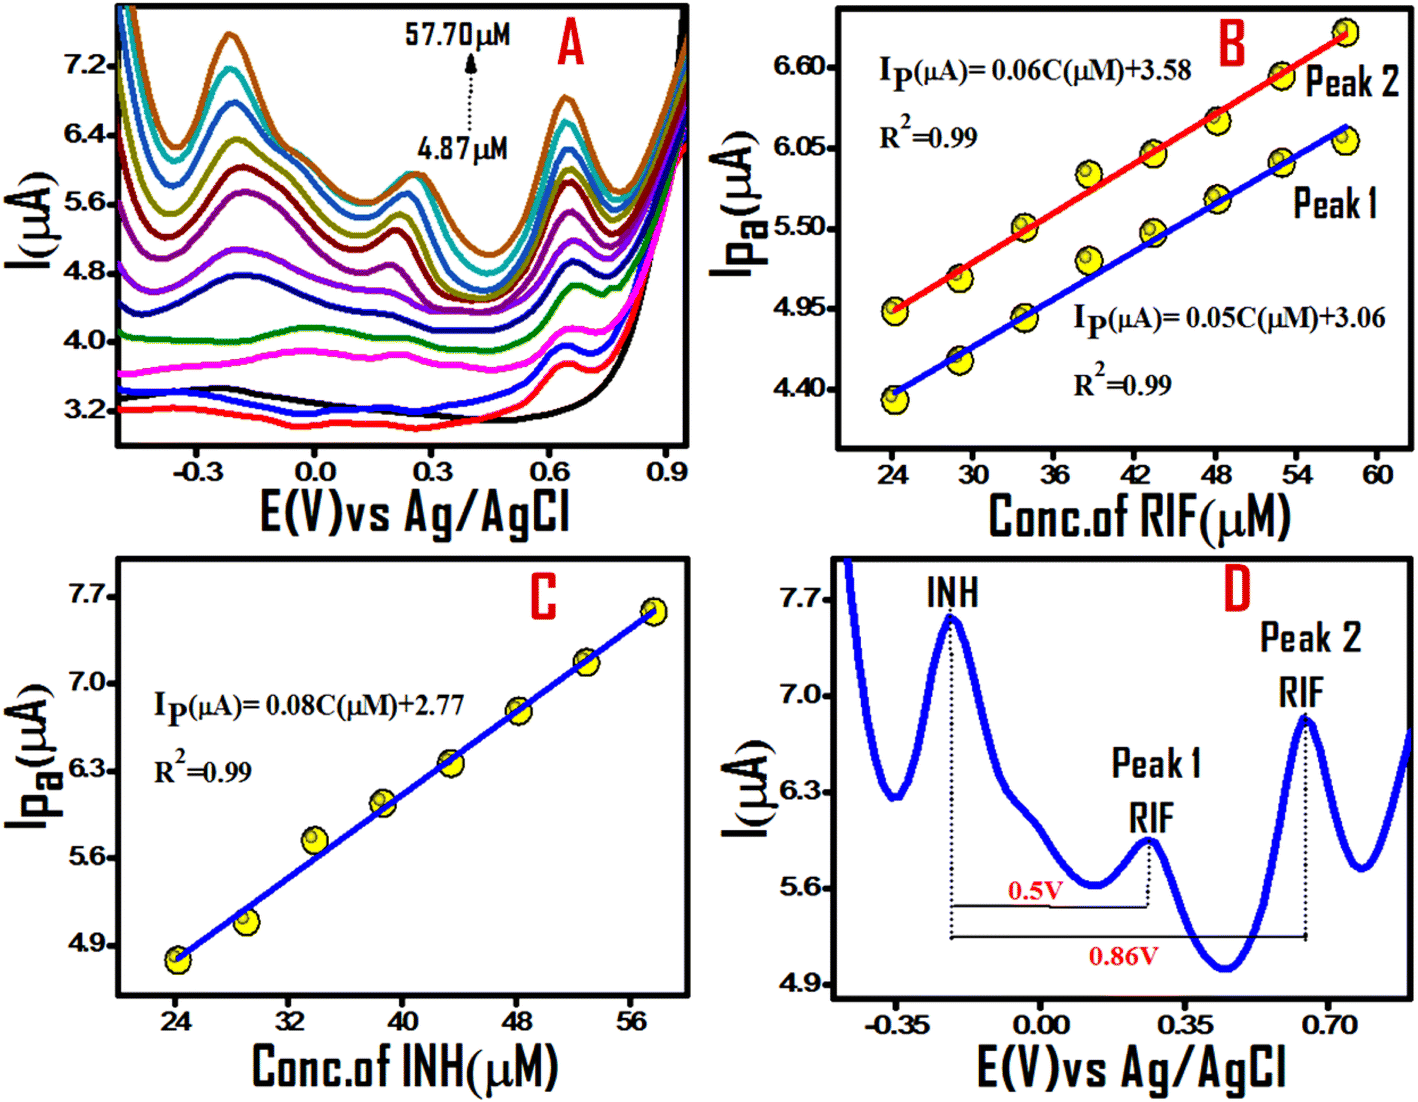
Differential Pulse Voltammetry (DPV) measurements eliminate capacitive/non faradaic currents resulting in improved analytical figure of merit. DPV measurements generate well defined, sharper signals with better resolution and high sensitivity vital for electrochemical sensing application. The DPV experiments of RIF and INH over GCE/Ru(II) half sandwich complex were carried in aqueous acetonitrile solvent using NBu4PF6 as supporting electrolyte at scan rate of 50 mV s−1. In the potential window of −0.9 V to 1.0 V, the effect of DPV parameters on peak current related to the electro-oxidation of analytes over Ru(II) half sandwich complex was examined. The optimized parameters for RIF and INH determination using DPV were: modulation time 100 ms, step potential 20 mV, and modulation amplitude 50 mV. The recorded DPVs show an increase in the oxidative current with the increase in the analyte concentration. The linear dependence of the peak current was observed over the concentration range of 0.29 μM to 3.72 μM and 4.9 μM to 82.22 μM for RIF and INH respectively Fig. 6A and C. From the calibration curves of the plot of peak current vs. concentration of analytes (Fig. 6B and D), the detection limit was calculated using 3S/m, where m is the slope of calibration curve and S is the standard deviation of error of intercept.48 The calculated detection limits were found to be equal to 7.1 × 10⁻⁸ M (peak 1), 3.2 × 10⁻⁸ M (peak 2) for RIF and 1.2 × 10⁻⁶ M for INH. The sensitivity of RIF and INH were estimated as 19.58 μA μM−1 cm−2 (peak 1), 24.57 μA μM−1 cm−2 (peak 2) and 1.69 μA μM−1 cm−2 respectively. The detection limits and linear response ranges were compared with the closely related heterogenous electrochemical sensors previously reported as we could not come across any homogenous sensor for the simultaneous RIF and INH sensing (Table 1).22,41,49–55 The Table 1 entries showed that the GCE/Ru(II) half sandwich complex has an efficient propensity towards simultaneous electrochemical sensing of both analytes. The increasing concentration effect of one drug analyte on electrochemical features of other drug kept at constant concentration are presented in Fig. 7A and B. Fig. 7A depicts the DPV curves with increasing concentrations of RIF ranging from 4.87–57.7 μM in presence of 50 μM of INH. The linear plots of peak current vs. concentration of analyte are given in inset of Fig. 7A. The DPV plots of increasing concentrations of INH (4.87–67.7 μM) in presence of fixed concentration (50 μM) of RIF are given in Fig. 7B with the inset depicting a linear dependence of peak current with the concentration of analyte. The increase in corresponding peak current of one drug while the peak current of another drug remained constant indicating that selected drug analytes do not interfere with each other for their simultaneous determination in binary mixture. The peak potential separations of 0.5 V between INH and peak 1 of RIF and 0.86 V between INH and peak 2 of RIF ensured their simultaneous estimation without interference in the binary mixture (Fig. 8D). In another parallel experiment, simultaneous determination of both first line antituberculosis drugs (INH and RIF) with increasing concentration of both drugs from 4.87–57.7 μM was achieved with the corresponding plots in Fig. 8A. From the calibration curves Fig. 8A and C, the detection limits were found to be equal to 2.04 × 10⁻⁶ M (with respect to peak 1), 1.6 × 10⁻⁶ M (with respect to peak 2) for RIF and 1.4 × 10⁻⁶ M for INH.
 |
| | Fig. 6 DPVs recorded for increasing concentrations of (A) RIF and (C) INH on GCE/Ru(II) half sandwich complex. Calibration plots (B and D) between IP vs. concentration (μM) of RIF and INH with linear behaviour in concentration range of 0.29–3.72 μM and 4.93–82.22 μM respectively (experiments were attempted in acetonitrile solvent using NBu4PF6 as supporting electrolyte). | |
Table 1 Analytical parameters of GCE/Ru(II) half sandwich electrochemical sensor towards simultaneous estimation of RIF and INH with related heterogenous GCE modified electrochemical sensor
| Electrode/material |
Technique |
Analyte |
Linear range (μM) |
LOD (μM) |
Sensitivity (μA μM−1 cm−2) |
References |
| Fe3O4NPs@MWCNTs/GCE |
DPV |
Rifampicin |
2–25 |
0.64 |
|
22 |
| Au/PVP-AgNPs/PANSA/EG-CYP2E1 |
DPV |
Rifampicin |
2–14 |
0.05 |
1.40 |
49 |
| β-Cyclodextrin/Ppyr/Pt |
Amperometry |
Rifampicin |
2.61–25.23 |
1.69 |
0.00252 |
50 |
| PMel-Au nano/preanodized GCE |
DPV |
Isoniazid |
0.3–170 |
0.08 |
|
51 |
| Rhodium modified electrode |
LSV |
Isoniazid |
70–1300 |
13 |
0.14 |
41 |
| Co en-q/Fe3O4NPs/MWCNTs/GCE |
CV, DPV |
Rifampicin |
2–20 |
0.032 (peak 1) and 0.413 (peak 2) |
|
52 |
| Mo2C@BMZIFs/GCE |
DPV |
Isoniazid |
10–3500 |
1.5 |
|
53 |
| PYZ/BPH/GO/PAG/GCE |
DPV |
Isoniazid |
20–1400 |
2.59 |
|
54 |
| SPIONs–CNTsf/GCE |
Amperometry |
Rifampicin |
0.02–0.06 |
1.178 |
|
55 |
| GCE/Ru(II) half sandwich complex |
DPV |
Rifampicin, isoniazid |
0.29–3.72, 4.93–82.22 |
0.071 (peak 1) and 0.032 (peak 2), 1.2 |
1.72, 0.12 |
This work |
 |
| | Fig. 7 DPVs recorded on GCE/Ru(II) half sandwich complex for (A) increasing RIF concentrations (4.87–57.7 μM) in presence of constant INH concentration (50 μM). (B) Increasing concentrations of INH (4.87–67.15 μM) in presence of constant RIF concentration (50 μM). Insets showing calibration plots of the peak current against concentrations of analytes. (All measurements were in aqueous acetonitrile solvent using NBu4PF6 as supporting electrolyte). | |
 |
| | Fig. 8 DPVs recorded on GCE/Ru(II) half sandwich complex (A) for simultaneous determination of increasing concentrations 4.87–57.69 μM of RIF and INH. Calibration plots of the peak current against concentration of analytes (B and C). Plot showing separations between the peak potentials of RIF and INH (D). (All measurements were in acetonitrile solvent using NBu4PF6 as supporting electrolyte at scan rate of 50 mV s−1). | |
Interference and stability studies
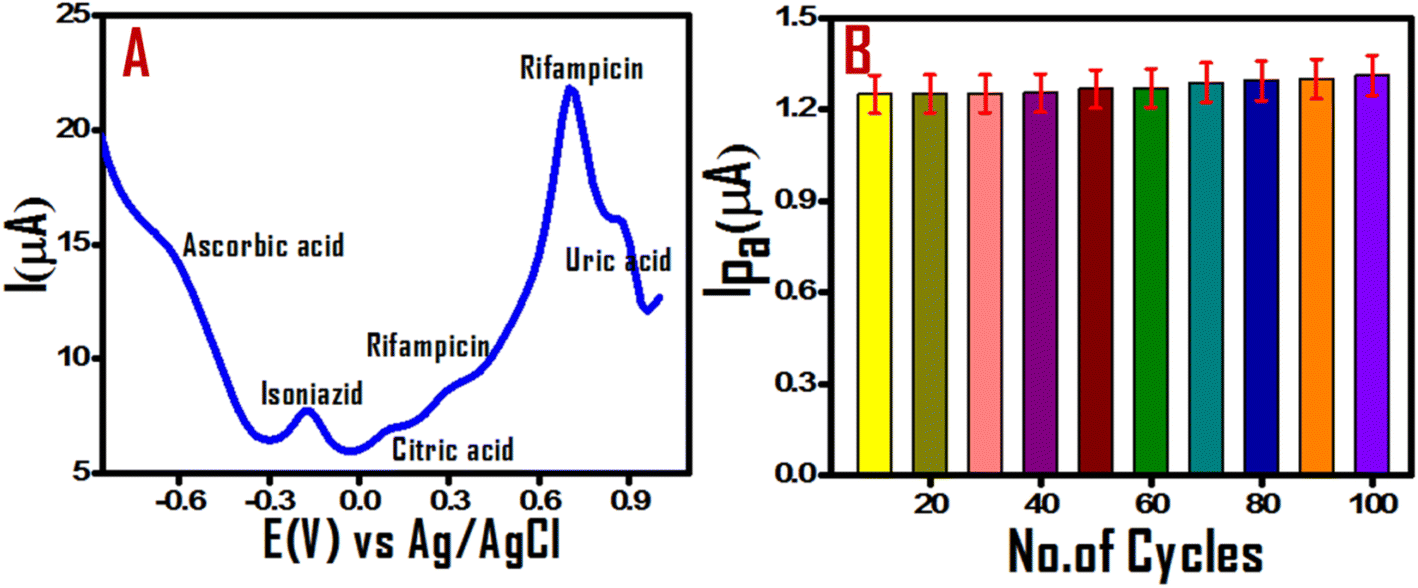
The non interfering ability of GCE/Ru(II) half sandwich electrochemical sensor towards simultaneous estimation of INH and RIF binary mixture was confirmed from control experiments with binary mixtures. The analytical parameters were observed to remain unaffected on increasing concentration of one analyte for a fixed concentration of other or simultaneous increase in concentration of both analytes corroborating non interfering behavior. Additionally, influence of potential redox active biological interfering agents (citric acid, ascorbic acid, uric acid) on the DPV responses of RIF and INH under optimized experimental conditions was also examined (Fig. 9A). DPV plot shows no substantial change in the peak potentials upon addition of selected interfering agents even at their concentrations higher to the analyte, suggesting non interfering behavior. The observed non interfering nature further adds to the analytical figure of merit of GCE/Ru(II) half sandwich complex as electrochemical sensor for simultaneous estimation of RIF and INH in binary mixture.
 |
| | Fig. 9 DPVs recorded on GCE/Ru(II) half sandwich complex (A) for RIF and INH (19.4 μM each) in presence of potential redox active biological interferents (B) stability test of GCE/Ru(II) half sandwich complex. Current measurements were made in aqueous acetonitrile solvent using NBu4PF6 as supporting electrolyte at scan rate of 50 mV s−1 in case of (A) and 100 mV s−1 in case of (B). | |
The stability of GCE/Ru(II) half sandwich complex as electrochemical sensor was confirmed from 100 successive cycles at scan rate of 100 mV s−1, no significant changes in cyclic voltammograms of homogenous solution containing 48 μM of Ru(II) half sandwich complex upto 100 cycles was observed. The oxidation peak current response upto 100 cycles shown in Fig. 9B at scan rate of 100 mV s−1 confirms good stability and durability of GCE/Ru(II) half sandwich complex as electrochemical sensor.
Real sample analysis
The real time performance of GCE/Ru(II) half sandwich complex electrochemical sensor, for simultaneous estimation of RIF and INH in commercial drug tablets and different water samples was validated using DPV technique under pre optimized methodology. The concentrations of RIF and INH in their optimum concentration range of method were prepared from their claimed content in commercial tablets and by spiking real water samples with known concentrations. A series of binary mixtures of the commercial tablets over the optimum concentration range of method were estimated using DPV measurements for real time application Fig. S1.† The results corroborate excellent sensitivity and reliability for real time applications in pharmaceuticals and real water samples, with recovery rates more than 95% (Table 2).
Table 2 Recovery rates of RIF and INH in water samples using GCE/Ru(II) half sandwich complex electrochemical sensor(post spike)
| Water sample |
Added (μM) |
Found (μM) |
% Recovery |
| RIF |
INH |
RIF |
INH |
RIF |
INH |
| Distilled water |
00 |
00 |
00 |
00 |
00 |
00 |
| Tap water |
3.90 |
3.90 |
3.75 |
3.73 |
96.15 |
95.64 |
| 7.80 |
7.80 |
7.65 |
7.63 |
98.07 |
97.82 |
| 11.00 |
11.00 |
10.85 |
10.83 |
98.64 |
98.45 |
| 15.00 |
15.00 |
14.85 |
14.83 |
99.00 |
98.86 |
| Lake water |
3.90 |
3.90 |
3.72 |
3.70 |
95.38 |
94.87 |
| 7.80 |
7.80 |
7.62 |
7.60 |
97.69 |
97.43 |
| 11.00 |
11.00 |
10.82 |
10.80 |
98.36 |
98.18 |
| 15.00 |
15.00 |
14.82 |
14.80 |
98.80 |
98.66 |
Computational insight of the electrochemical sensing
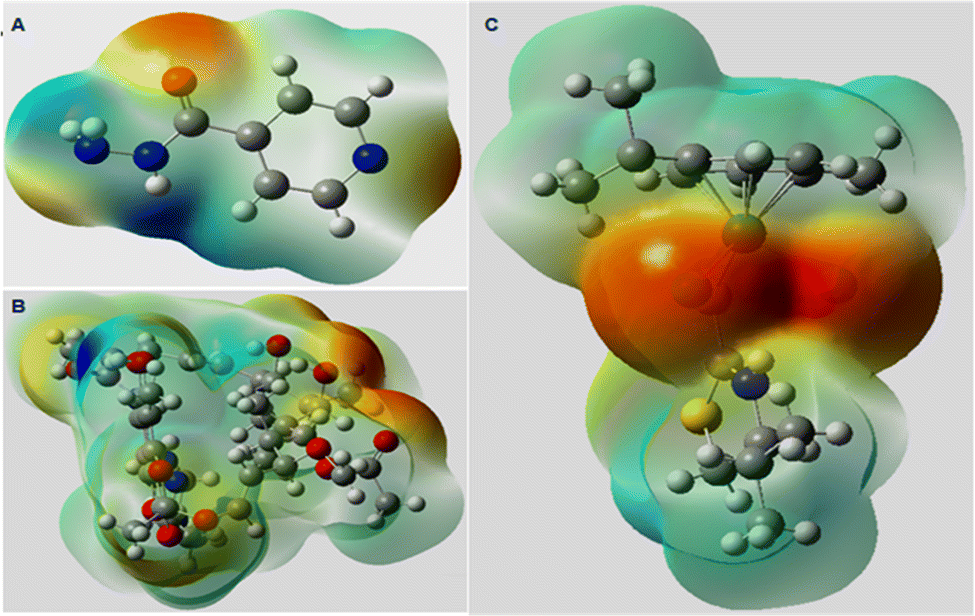
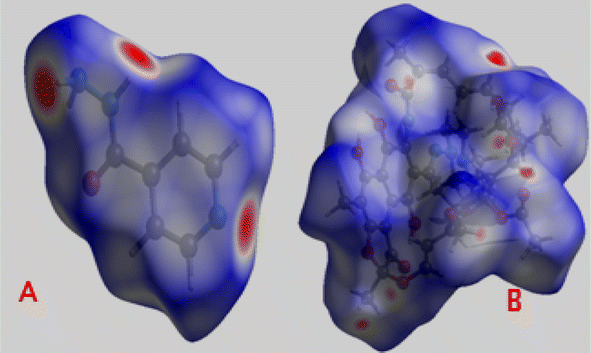
Quantum chemical calculations hold a special position for their step-by-step mechanistic insight56–58 and probing electronic and allied features guiding chemical processes.59 We attempted computational approach using density functional theory (DFT) for an insight of Ru(II) half sandwich electrochemical sensing process. Ru(II) half sandwich electrochemical sensor molecule was first optimized and its frontier molecular orbitals (FMO) were generated for prediction of possible supra interactions Fig. 10. The evaluated chemical descriptors indicated structure–activity based response for observed differences in rifampicin and isoniazid analytical figure of merit towards Ru(II) half sandwich electrochemical sensor. The charge distribution patterns on optimized structures (esp plots) of Ru(II) half sandwich sensor, rifampicin and isoniazid are shown in Fig. 11 with red and blue spots depicting electron rich and electron deficient centres respectively.
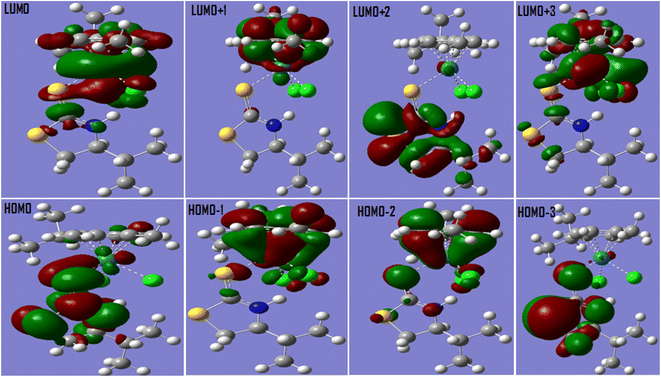 |
| | Fig. 10 Frontier molecular orbital (FMO) contours of Ru(II) half sandwich electrochemical sensor. | |
 |
| | Fig. 11 Optimized structure with calculated electrostatic potential of (A) isoniazid, (B) rifampicin and (C) Ru(II) half sandwich electrochemical sensor computed using DFT at B3LYP/6-311G(d,p) and B3LYP/LanL2DZ level of theory for analytes and sensor respectively. | |
The charge distribution in the electrostatic potential plots of RIF and INH corroborate with their dnorm surface Fig. 12. As can be seen from Fig. 10–12 that red spots are located on electronegative O,N,S and Cl centres, while as blue spots are located on hydrogen atoms of N–H and O–H groups in case of INH and RIF molecules indicating donor as well as acceptor type intermolecular hydrogen bonding interaction. Rifampicin molecule can be seen to be a nonplanar structure compared to isoniazid allowing for its weaker pi–pi stacking interactions compared to the isoniazid. In addition, C–H bonds of aromatic rings undergo a strong intermolecular C–H⋯pi intermolecular interaction.
 |
| | Fig. 12 Comparative d norm surface plots of: (A) isoniazid and (B) rifampicin. | |
The presence of red and blue spots indicate donor acceptor type intermolecular interaction, additional red spots in case of RIF Fig. 12B, predict its stronger hydrogen bonding affinity compared to INH. The quantification of different plausible intermolecular non covalent interactions that RIF and INH can develop with the Ru(II) half sandwich electrochemical sensor were also evaluated from their two-dimensional fingerprint plots of Hirshfeld surfaces analysis Fig. 13.
 |
| | Fig. 13 Comparative 2D finger print plots highlighting relative propensity of intermolecular contacts developed by analytes (isoniazid and rifampicin) with electrochemical sensor. | |
The analysis of observed fingerprint plots confirmed stronger hydrogen bonding ability of rifampicin (21%) over isoniazid (14%). The H—all interactions were observed to be higher in rifampicin (81.9%) than in isoniazid (60.9%). In addition isoniazid shows higher percentage of C–C and H–C type of intermolecular interaction compared to rifampicin predicting its propensity towards pi–pi stacking and C–H⋯pi type interactions with the Ru(II) half sandwich electrochemical sensor. The predicted interactions between isoniazid and electrochemical sensor were confirmed from their observed orientation, distance and angle measurements in the computationally optimized Ru(II) sensor and isoniazid adduct Fig. 14. Furthermore, Ru(II) half sandwich complex was able to sense naphthalene also which corroborates the development of pi–pi and C–H⋯pi interactions Fig. S2.† Based on FMO studies, 2D finger print and esp plot analysis, supra decoratory influence of substituents on Ru(II) half sandwich electrochemical sensor building diverse intermolecular non-covalent interactions can be invoked as the plausible explanation for its electrochemical sensing mechanism of TB drugs. Supradecoration induced electrochemical sensing refers to the development of customized supramolecular systems capable of complimentary interactions between electroanalyte and electrochemical sensor towards their desired sensing application.60 Our observations conclude that relatively higher hydrogen bonding ability of rifampicin allows for its better analytical figure of merit and higher sensitivity compared to the isoniazid drug. The pi–pi stacking and C–H⋯pi interaction in addition to hydrogen bonding are major interactions between isoniazid and Ru(II) electrochemical sensor Fig. 14.
 |
| | Fig. 14 Supra-interactions of isoniazid with Ru(II) electrochemical sensor: (A) C–H⋯pi (B) pi–pi stacking interaction in addition to hydrogen bonding between N–H⋯Cl. | |
Conclusions
The features of immobilization-free electrode, greater flexibility, ease of use with good reproducibility and stability make homogeneous electrochemical sensing desirable over heterogenous sensors for selective detection of sensitive analytes. This work describes design and optimization of novel Ru(II) half-sandwich complex as homogenous electrochemical sensor for simultaneous estimation of first-line TB drugs (isoniazid and rifampicin) in aqueous acetonitrile environments. The comparative electrochemical profiling of RuCl3 and Ru(II) half-sandwich complex using cyclic voltammetry, and electrochemical impedance spectroscopy (EIS) confirmed significant improvement in electrochemical parameters desirable for electrochemical application withstood analytical figure of merit for simultaneous estimation of binary TB drug mixture. Supra interactional propensity has been presented as plausible mechanism of homogenous electrochemical sensing, with relative supra interactional propensity in terms of hydrogen bonding, pi–pi stacking and van der Waals interaction as underlying reason for higher sensitivity and limit of detection for rifampicin compared to isoniazid observed from DPV analysis of their binary mixtures. The detection limit and sensitivity of synthesized Ru(II) sensor has been compared with satisfactory remarks to other GCE modified electrodes for selected antibiotic contaminants. The synthesized sensor besides expressing excellent stability and reproducibility depicted more than 95% recovery post spike in municipal water supplies, lake water and pharmaceutical formulations portraying real time sensing application. Computational studies corroborated supradecoratory mechanism of electrochemical sensing and highlighted diverse non covalent interactions developed by cymene ring, chloride and valine ligands in the Ru(II) half sandwich sensor with the isoniazid and rifampicin analytes. Taken together this case study aims to invoke the concept of supradecoration induced homogenous electrochemical sensing, which can be of high value in deigning homogeneous sensors for detection of sensitive analytes.
Data availability
Primary research results are presented for supradecoration induced homogenous electrochemical sensing: development of Ru(II) half sandwich complex as isoniazid and rifamipicin dual sensor. No software or code have been included and no new data were generated or analyzed as part of this submission.
Author contributions
Prof. M. A. Rizvi and Prof Noor U Din Reshi: conceptualization, design of the research work; Mohd Mustafa: experimental bench work, data curation, data analysis, hypothesis, Tabee Jan: electrochemical studies, data analysis manuscript draft, review. Mehdi Rohullah: data analysis, draft write-up formatting, Prof. M. A. Rizvi: manuscript reviews, editing, resources, and overall supervision.
Conflicts of interest
The authors declare that they have no known competing financial or any other interests.
Acknowledgements
MAR thankfully expresses his gratitude to the SERB, Government of India, New Delhi, for the provision of resources through DST-SERB SURE Programme (SUR/2022/004046) and DST FIST program to support research activity at Dept. of Chemistry University of Kashmir. Mohd Mustafa is thankful to UGC, India for the fellowship awarded through grant no. 196/CSIRUGC NET DEC 2018.
References
- W.-Y. Chen, Y.-F. Chen, J.-M. Tsai, H.-M. Huang and Y.-C. Su, Sci. Total Environ., 2023, 892, 164560 CrossRef CAS PubMed.
- Y. Liu, D. Cai, X. Li, Q. Wu, P. Ding, L. Shen, J. Yang, G. Hu, J. Wu and L. Zhang, PLoS One, 2023, 18, e0270945 CrossRef CAS PubMed.
- C. Fu, B. Xu, H. Chen, X. Zhao, G. Li, Y. Zheng, W. Qiu, C. Zheng, L. Duan and W. Wang, Sci. Total Environ., 2022, 807, 151011 CrossRef CAS PubMed.
- S. I. Polianciuc, A. E. Gurzău, B. Kiss, M. G. Ştefan and F. Loghin, Med. Pharm. Rep., 2020, 93, 231–240 Search PubMed.
- D. G. J. Larsson and C.-F. Flach, Nat. Rev. Microbiol., 2022, 20, 257–269 CrossRef CAS PubMed.
- M. A. Rizvi, S. K. Moosvi, T. Jan, S. Bashir, P. Kumar, W. D. Roos and H. C. Swart, Polymer, 2019, 163, 1–12 CrossRef CAS.
- A. Hossain, S. Nakamichi, M. H. Al-Mamun, K. Tani, S. Masunaga and H. Matsuda, Environ. Res., 2018, 165, 258–266 CrossRef CAS PubMed.
- G. Wang, S. Zhou, X. Han, L. Zhang, S. Ding, Y. Li, D. Zhang and K. Zarin, J. Hazard. Mater., 2020, 389, 122110 CrossRef CAS PubMed.
- Y. Chen, W. Shen, B. Wang, X. Zhao, L. Su, M. Kong, H. Li, S. Zhang and J. Li, Ecotoxicol. Environ. Saf., 2020, 206, 111371 CrossRef CAS.
- Y. Zhang, J. Lu, J. Wu, J. Wang and Y. Lin, Sci. Total Environ., 2020, 720, 137712 CrossRef CAS PubMed.
- M. M. Seyoum, R. Lichtenberg, E. Orlofsky and N. B. O. Gillor, Environ. Res., 2022, 211, 113021 CrossRef CAS PubMed.
- Y. Ben, M. Hu, X. Zhang, S. Wu, M. H. Wong, M. Wang and C. B. Andrews, Water Res., 2020, 175, 115699 CrossRef CAS PubMed.
- H. Wang, N. Wang, B. Wang, Q. Zhao, H. Fang, C. Fu, C. Tang, F. Jiang, Y. Zhou, Y. Chen and Q. Jiang, Environ. Sci. Technol., 2016, 50, 2692–2699 CrossRef CAS PubMed.
- U. Anand, A. Vaishnav, S. K. Sharma, J. Sahu, S. Ahmad, K. Sunita, S. S. A. Dey, E. Bontempi, A. K. Singh, J. Proćków and A. K. Shukla, Sci. Total Environ., 2022, 842, 156641 CrossRef CAS.
- WHO, Global Report on Surveillance 2014. WHO 2014 AMR Rep, WHO, 2014, pp. , pp. 1–8. Global http://www.who.int/drugresistance/documents/AMR_report_Web_slide_set.pdf Search PubMed.
- T. Jan, S. Raheem and M. A. Rizvi, Nanoscale Adv., 2024, 6, 5055–5068 RSC.
- T. Jan, S. Raheem, A. Hanif, G. Rydzek, G. M. Peerzada, K. Ariga, J. Shang and M. A. Rizvi, Phys. Chem. Chem. Phys., 2024, 26, 16802–16820 RSC.
- M. Mustafa, S. Bashir, S. K. Moosvi, M. H. Najar, M. H. Masoodi and M. A. Rizvi, Acta Chim. Slov., 2022, 69, 848–862 CrossRef CAS.
- K. J. Seung, S. Keshavjee and M. L. Rich, Multidrug-Resistant Tuberculosis and Extensively Drug-ResistantTuberculosis, Cold Spring Harb. Perspect. Med., 2015, 5, a017863 CrossRef.
- O. O. Diallo, S. A. Baron, C. Abat, P. Colson, H. Chaudet and J. M. Rolain, J. Glob. Antimicrob. Resist., 2020, 23, 430–438 CrossRef PubMed.
- L. E. Morrow, R. E. Wear, D. Schuller and M. Malesker, Pharmacotherapy, 2006, 26, 1529–1532 CrossRef PubMed.
- M. Alizadeh, P. N. Asrami, E. E. Altuner, F. Gulbagca, R. N. E. Tiri, A. Aygun, I. Kaynak, F. Sen and S. Cheraghi, Chemosphere, 2022, 309, 136566–136573 CrossRef CAS PubMed.
- F. Z. Moshfegh, F. Javanmardi and D. Nematollahi, Electrochim. Acta, 2023, 457, 142487–142501 CrossRef.
- W. D. Adane, B. S. Chandravanshi, N. Getachew and M. Tessema, Anal. Chim. Acta, 2024, 1312, 342746 CrossRef CAS.
- Z. Haq, F. A. Ganaie, S. A. Bhat, I. Nazir, A. Qureashi, A. Bashir and M. A. Rizvi, New J. Chem., 2024, 48, 16461–16474 RSC.
- Z. ulHaq, I. Nazir, A. Qureashi, F. A. Ganaie, A. Bashir, K. Fatima, W. A. Shah and M. A. Rizvi, New J. Chem., 2023, 47, 21067–21080 RSC.
- J. Zheng, H. Shi, M. J. Wang, C. J. Duan, Y. Huang, C. Li, Y. Xiang and G. X. Li, Anal. Chem., 2020, 92, 2194–2200 CrossRef CAS PubMed.
- S. B. Xie, W. Yuan, P. Wang, Y. Tang, L. M. Teng and Q. Peng, Sensor. Actuator. B Chem., 2019, 292, 64–69 CrossRef CAS.
- X. J. Liao, C. Y. Zhang, Z. Liu and F. L. Gao, Int. J. Biol. Macromol., 2021, 183, 2305–2313 CrossRef CAS PubMed.
- H. A. Younus, I. Yildiz, N. Ahmad, H. S. Mohamed, G. Khabiri, S. Zhang, F. Verpoort, P. Liu and Y. Zhang, Appl. Organomet. Chem., 2022, 36, e6538 CrossRef CAS.
- S. Shiri, N. Pajouheshpoor, H. Khoshsafar, S. Amidid and H. Bagheri, New J. Chem., 2017, 41, 15564–15573 RSC.
- N. D. Reshi, D. C. Senthurpandi and A. G. Samuelson, Appl. Organomet. Chem., 2019, 2019, e4885 CrossRef.
- M. Li, L. Jia, G. Shen, Y. Zhou, Z. Gong, S. An, X. Li and F. Zhang, Sens. Actuators, B, 2024, 418, 136225 CrossRef CAS.
- E. Kovalski, M. Korband and A. Hildebrandt, Eur. J. Inorg. Chem., 2018, 2018, 1547 CrossRef CAS.
- U. Pfaff, A. Hildebrandt, M. Korb, D. Schaarschmidt, M. Rosenkranz, A. Popov and H. Lang, Organometallics, 2015, 34, 2826–2840 CrossRef CAS.
- C. K. Margaret, S. M. Kagwanja and J. M. Gichumbi, IOSR J. Appl. Chem., 2018, 11, 6–11 Search PubMed.
- T. Jan, S. Raheem, S. V. Sawant, T. V. Manolikar, S. S. Sakate, S. K. Pardeshi, R. M. Jagtap and M. A. Rizvi, New J. Chem., 2024, 48, 5040 RSC.
- P. K. Sonkar, M. Yadav, K. Prakash, V. Ganesan, M. Sankar, D. K. Yadav and R. Gupta, J. Appl. Electrochem., 2018, 2018, 48937–48946 Search PubMed.
- S. Rastgar and S. Shahrokhian, Talanta, 2014, 119, 156–163 CrossRef CAS PubMed.
- K. A. -Zeynali and F. Mollarasouli, Biosens. Bioelectron., 2017, 92, 509–516 CrossRef PubMed.
- S. Cheemalapati, S. M. Chen, M. A. Ali and F. M. A. Al-Hemaid, Colloids Surf. B Biointerfaces, 2014, 121, 444–450 CrossRef CAS.
- L. Qian, A. R. Thiruppathi, J. van der Zalm and A. Chen, ACS Appl. Nano Mater., 2021, 4, 3696–3706 CrossRef CAS.
- Y. V. M. Reddy, B. Sravanib, T. Łuczakc, K. Mallikarjunad and G. Madhavi, Colloids Surf., A, 2021, 608, 125533 CrossRef.
- P. Balasubramanian, T. S. T. Balamurugan, S.-M. Chen, T.-W. Chen and P.-H. Lin, Sens. Actuators, B, 2019, 283, 613–620 CrossRef CAS.
- A. Mourya, B. Mazumdar and S. K. Sinha, J. Environ. Chem. Eng., 2019, 7, 103459 CrossRef CAS.
- V. Vinothkumar, A. Sangili, S. M. Chen and M. Abinaya, Colloids Surf. A Physicochem. Eng. Asp., 2021, 624, 126849 CrossRef CAS.
- B. G. Santos, J. M. Gonçalves, D. P. Rocha, G. S. Higino, T. P. Yadav, J. J. Pedrotti, P. M. Ajayan and L. Angnes, Sens. Actuators Rep., 2022, 4, 100073 CrossRef.
- D. P. Rocha, C. W. Foster, R. A. A. Munoz, G. A. Buller, E. M. Keefe and C. E. Banks, Analyst, 2020, 145, 3424–3430 RSC.
- R. F. Ajayi, U. Sidwaba, U. Feleni, S. F. Douman, O. Tovide, S. Botha, P. Baker, X. G. Fuku, S. Hamid, T. T. Waryo, S. Vilakazi, R. Tshihkudoc and E. I. Iwuoha, Electrochim. Acta, 2014, 128, 149–155 CrossRef CAS.
- M. A. A. Lomillo, O. D. Renedo and M. J. A. Martnez, Electrochim. Acta, 2005, 50, 1807–1811 CrossRef.
- Z. Sepehri, H. Bagheri, E. Ranjbari, M. A. -Aref, S. Amidi, M. R. Rouini and Y. Hosseinzadeh Ardakani, Ionics, 2017, 24, 1253–1263 CrossRef.
- R. Chokkareddy, N. K. Bhajanthri and G. G. Redhi, Int. J. Electrochem. Sci., 2017, 12, 9190–9203, DOI:10.20964/2017.10.13.
- W. Liang, H. Ren, Y. Li, H. Qiu and B.-C. Ye, Anal. Chim. Acta, 2020, 1136, 99–105 CrossRef CAS PubMed.
- B. Devadas, S. Cheemalapati, S.-M. Chen, M. A. Ali and F. M. A. Al-Hemaid, Ionics, 2015, 21, 547–555 CrossRef CAS.
- K. Bano, S. Z. Bajwa, A. Ihsan, I. Hussain, N. Jameel, A. Rehman, A. Taj, S. Younus, M. Zubair Iqbal, F. K. Butt and M. Saeed, J. Nanosci. Nanotechnol., 2020, 20, 2130–2137 CrossRef CAS PubMed.
- M. Kumar, A. Kumar, M. Rizvi, M. Mane, K. Vanka, S. C. Taneja and B. A. Shah, Eur. J. Org Chem., 2014, 2014, 5247–5255 CrossRef CAS.
- M. V. Mane, M. A. Rizvi and K. Vanka, J. Org. Chem., 2015, 80, 2081–2091 CrossRef CAS PubMed.
- A. Kumawat, S. Raheem, F. Ali, T. Ali Dar, S. Chakrabarty and M. A. Rizvi, J. Phys. Chem. B, 2021, 125, 1531–1541 CrossRef CAS.
- M. Kumar, M. K. Gupta, M. A. Rizvi and A. Ansari, Struct. Chem., 2023, 34, 1565–1575 CrossRef CAS.
- M. Mustafa, T. Jan, S. Raheem, J. Afzal, N. Nazir, M. H. Masoodi and M. A. Rizvi, Polyhedron, 2024, 264, 117253–117264 CrossRef CAS.
|
| This journal is © The Royal Society of Chemistry 2025 |
Click here to see how this site uses Cookies. View our privacy policy here. 
 Open Access Article
 This Open Access Article is licensed under a Creative Commons Attribution-Non Commercial 3.0 Unported Licence
 a,
Mehdi Rohullahb,
Mubashir Hussain Masoodic,
Noor U. Din Reshi
a,
Mehdi Rohullahb,
Mubashir Hussain Masoodic,
Noor U. Din Reshi