
 Open Access Article
 This Open Access Article is licensed under a Creative Commons Attribution-Non Commercial 3.0 Unported Licence
Study on the quantitative detection of SO2F2 based on spectral analysis combined with laser spectroscopy
Zhigang Cao ,
Bin Liu,
Yinghan Xiang,
Shuai Liang and
Xu Guo
,
Bin Liu,
Yinghan Xiang,
Shuai Liang and
Xu Guo
State Grid Tongliao Power Supply Company, Tongliao 028000, China
First published on 9th June 2025
Abstract
Accurate monitoring of insulation failure in SF6 gas-insulated equipment is essential for ensuring power grid reliability. In the early stages of equipment failure, the characteristic decomposition product SO2F2 is generated. By detecting its concentration and variation, insulation defects can be identified. In this paper, SO2F2 detection based on laser absorption spectroscopy was studied. The infrared spectral characteristics of SO2F2 and its coexisting gases were analyzed. It was found that SO2F2 exhibits a strong absorption peak at 2763 cm−1, which is not affected by interference from its coexisting gases. An ICL laser with a wavelength of 3619 nm was selected for SO2F2 detection. A laser absorption spectroscopy experimental platform was established to conduct quantitative research on trace levels of SO2F2. The detection performance of two methods—direct absorption spectroscopy and harmonic modulation—was compared. The results demonstrate that both methods can accurately detect SO2F2 within the 0–600 ppm concentration range, with the harmonic modulation method exhibiting significantly better sensitivity and repeatability. The response to the direct absorption spectroscopy system is 0.782 mV ppm−1, with a repeatability error of 2.525 ppm and a detection limit of 3.94 ppm. The harmonic modulation system shows a response of 11.433 mV ppm−1, which is about 15 times higher than that of the direct absorption spectroscopy. Its repeatability error is 0.937 ppm, which is only 0.37 times that of direct absorption spectroscopy, and the detection limit is 357.56 ppb, which is about 11 times lower than that of direct absorption spectroscopy.
1 Introduction
Since sulfur hexafluoride (SF6) gas has excellent insulation and arc-extinguishing properties, SF6 gas-insulated equipment has been widely used in power grids.1–4 With the rapid increase in the number of SF6 gas-insulated devices, higher reliability standards are increasingly required. However, owing to defects in manufacturing technology, loosening of parts caused by vibration during transportation, metal scraps generated during installation, and aging during use, the equipment may develop insulation defects. These defects gradually deteriorate during long-term operation and can cause partial discharge (PD). If PD is not detected in a timely manner, it can evolve into insulation breakdown, leading to equipment failure and threatening the safety of the power grid.5–8 Therefore, it is of great significance to carry out research on PD detection for SF6 gas-insulated equipment.The PD process in SF6 gas-insulated equipment is often accompanied by acoustic, optical, thermal, and electromagnetic radiation. Diagnostic methods based on these phenomena include the pulse current method, ultrasonic method and ultra-high frequency (UHF) method.9–12 However, multi-point grounding of equipment can cause the pulse current generated by PD to shunt, resulting in a very low signal-to-noise ratio that precludes accurate detection. The ultrasonic and UHF methods have strong anti-interference capabilities, but when the PD signal propagates inside the equipment, it will produce multiple refractions due to the complexity of the internal structure, which will greatly attenuate the signal.
At present, the detection of SF6 decomposition products has become an important technique for on-site monitoring of equipment in operation and has a significant effect on improving the defect diagnosis capabilities and operational reliability of the equipment.13–16 This method offers advantages of little interference from the external environment, high sensitivity, and good accuracy. Furthermore, since decomposition products increase with the number of PD times, on-site detection of these products can more effectively reflect the development of internal faults in equipment. The international standard IEC60480-2004 states that the low-fluorine sulfide produced in the early stages of SF6 gas discharge decomposition are highly unstable, and SO2F2 is commonly generated during the latent period of hidden defects or early-stage defects of the equipment.17 By detecting its concentration and variation, insulation defects in equipment can be identified.18–20 Therefore, the research and development of detection instruments with high measurement accuracy and good reliability for SO2F2 detection are key to the detection of SF6 decomposition products. In addition, SO2F2 is widely used for termite control in buildings, warehouses and containers. Given its toxicity, occupational safety regulations demand highly accurate detection of SO2F2.
The main methods for detecting SO2F2 in SF6 decomposition products are gas chromatography and nanosensors. However, gas chromatography suffers from limitations such as complex sampling pathways, long detection times, and poor portability, making it is difficult to meet the requirements for on-site detection. Alternatively, nanosensors face challenges such as easy poisoning and serious cross-interference between gases, making it difficult to accurately assess the concentration of SO2F2 gas during on-site application.21,22 Spectral detection technology leverages the unique spectral “fingerprints” of gases, allowing for the elimination of cross-interference effects, thereby achieving highly selective and sensitive detection.23
Yassine et al. conducted a series of studies on the application of SO2F2 as a fumigant insecticide and developed a miniaturized two-chamber photoacoustic spectroscopy detection device, which achieved good results and enabled accurate detection of SO2F2.24,25 Zhang et al. conducted preliminary analysis of the spectral characteristics of SO2F2 and proposed a relevant detection method,26 but they did not conduct an in-depth analysis of the impact of spectral cross-interference between gases and did not confirm whether the method could meet the requirements of real scenarios. In the specific scenario of SF6 decomposition product detection, there are many gas components (such as SOF2, CO2, HF, H2S and water vapor) within the equipment, and SF6 as a background gas exhibits strong infrared spectral absorption.27–31 Therefore, further research is needed. Through spectral analysis of various gases, the optimal detection band for SO2F2 can be identified, and the advantages of laser spectroscopy technology can be used to overcome the limitations of existing methods and achieve highly selective and sensitive detection of SO2F2.
In summary, in this paper, in response to the urgent need for quantitative detection of SO2F2, a trace gas detection method based on laser spectroscopy was studied. First, through theoretical simulation of the HITRAN database combined with Fourier transform infrared spectroscopy (FTIR) detection experiments, the infrared spectral characteristics of SO2F2 and its coexisting gases in a SF6 gas-insulated equipment were obtained, the spectral cross-interference between SO2F2 and other gases was analyzed, and the optimal SO2F2 detection band and corresponding laser were determined. Subsequently, a gas concentration detection platform based on direct absorption spectroscopy and harmonic modulation methods was established, enabling high-precision detection of SO2F2. Furthermore, detection performance of the two methods was compared. The findings of this study provide theoretical and technical support for the accurate detection of SO2F2.
2 Platform and method
2.1 Gas infrared spectrum detection
In order to analyze the potential spectral overlapping and interference between multiple gas components and SO2F2, it is first necessary to build a gas detection experimental platform based on long-path FTIR. Then, the infrared spectral information for SF6 background gas and typical trace-level SF6 decomposition products can be obtained, and the effective SO2F2 detection band is selected to lay the foundation for the selection of laser parameters. The long-path FTIR gas detection experimental platform is shown in Fig. 1. It mainly consists of an FTIR spectrometer (Hamamatsu Tracer-100), a long optical path gas cell (PIKE Technologies), a high-precision digital pressure gauge, a vacuum pump, and various standard gases. The gas cell is a variable-path White cell. Its optical path is composed of three reflectors (comprising two fixed mirrors and one movable mirror). The top moving mirror is connected to the top micrometer through a cylindrical positioning pin. By adjusting the top micrometer, the position of the moving mirror changes, thereby altering the number of light reflections within the cell and adjusting the optical path length. Based on experimental analysis, 8 m was selected as the optical path length. Detection experiments were carried out using trace standard gases. First, the standard gas was filled into a gas sampling bag and connected to the inlet of the gas cell. The gas cell was then evacuated. Once a vacuum state was achieved, the gas sampling bag valve was opened to fill the standard gas into the gas cell. | ||
| Fig. 1 The long optical path gas cell. | ||
The gas cell is used to ensure an appropriate absorption optical path length for accurately measuring the spectral information of trace gases. The background gas and target gas at a certain concentration were filled into the gas cell to obtain the infrared spectrum of the background signal and the absorption intensity and transmittance of the target gas as a function of wavenumber.
2.2 Laser spectroscopy gas detection platform
The laser spectroscopy gas detection platform is shown in Fig. 2, which is mainly composed of three parts: the gas path, the optical path, and the electronic circuit. The gas path includes the standard gas to be tested, the gas distribution instrument, a variable-path White cell, a pressure gauge and a vacuum pump. The standard gas is diluted to various concentrations using the gas distribution instrument and then introduced into the gas cell for detection. All measurements were conducted under ambient temperature and atmospheric pressure conditions. The optical path consists of an ICL laser, the gas cell and a photodetector. The circuit includes a laser current driver and temperature controller, a signal generator, a lock-in amplifier, a data acquisition module and a host computer. During the detection process, air in the gas cell was first evacuated using the vacuum pump, followed by introducing N2. Then, different concentrations of the gas were prepared using the gas distribution instrument and filled then introduced into the gas cell at a flow rate of 300 mL min−1. Data acquisition commenced once the system reached a steady state and the signal stabilized. | ||
| Fig. 2 The laser absorption spectroscopy gas detection platform. | ||
The basic detection principle is as follows: when a certain concentration of SO2F2 gas is introduced into the gas cell, the signal generator outputs a modulation signal that enables the laser to scan across the infrared absorption peak of SO2F2. Next, the interaction between the laser and the gas is increased after multiple reflections within the gas cell. Finally, the photodetector converts the transmitted optical signal into an electrical signal, which is processed by the lock-in amplifier and transmitted to the host computer for display and recording. In this study, direct absorption spectroscopy and harmonic modulation methods are employed to investigate the quantitative detection of SO2F2. The detection performance of these two methods is evaluated and compared in terms of sensitivity, signal stability, and detection limit.
3 Results and discussion
3.1 Analysis of the spectral characteristics of SO2F2
To verify the reliability of the spectral results obtained from the experimental platform, the spectral information of SO2F2 from the HITRAN database was first compared with the spectral data measured using the experimental platform, and the results are shown in Fig. 3. As illustrated in Fig. 3(b), some absorption peaks appear saturated in the actual measurement, resulting in slight distortions in the waveform of the absorption peak. A comprehensive comparison of Fig. 3(a) and (b) reveals that the absorption cross-section obtained from the HITRAN database is in the same wavelength band as the absorption peak of the measured absorption spectrum, which confirms the reliability of the experimental platform.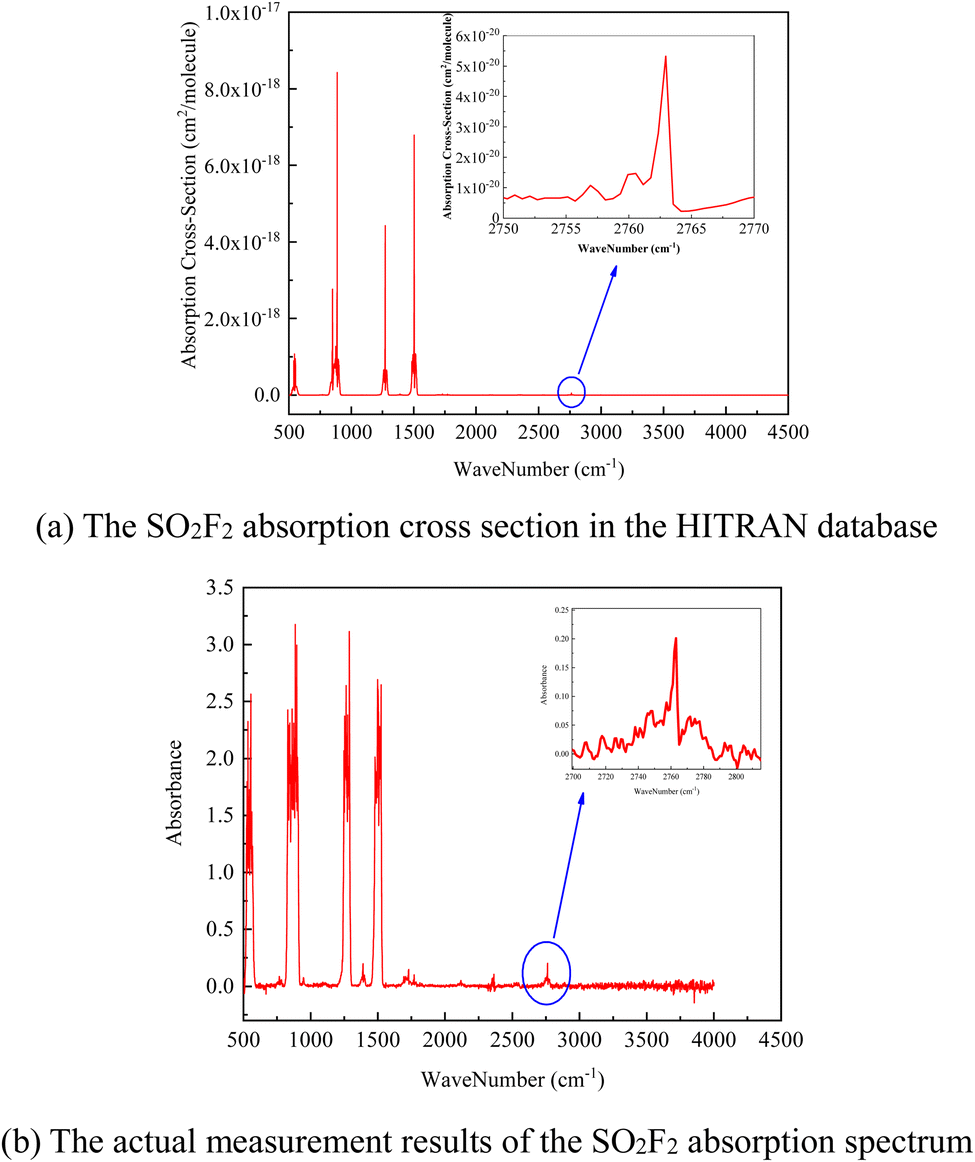 | ||
| Fig. 3 Theoretical and experimental analysis of the SO2F2 infrared spectrum. | ||
3.2 Analysis of the spectral interference of SO2F2 and its coexisting gases
Fig. 4 presents a comparison of the absorption cross sections of SO2F2 and its coexisting gases (SOF2, HF, H2S, H2O, CO, and CO2) across various spectral bands. The absorption spectrum of SOF2 (which is not available in the HITRAN database) was obtained through experimental measurements, while the absorption cross sections of SO2F2 and the other coexisting gases were sourced from the HITRAN database. As shown in Fig. 4, the absorption spectrum of SO2F2 gas is mainly concentrated in the 1200–3000 cm−1 range. Two prominent absorption peaks are observed at 1270.1 cm−1 and 1503.5 cm−1 with no significant cross-interference from other SF6 decomposition products. | ||
| Fig. 4 Spectral analysis of SO2F2 and its coexisting gases. | ||
Since SF6 is the background gas within the equipment, its interference with the infrared spectrum of SO2F2 must be considered. To assess this, SF6 absorption cross section was magnified 3000 times and compared with that of SO2F2, as shown in Fig. 5. It can be observed that the absorption spectrum of SO2F2 at 1270.1 cm−1 overlaps with that of SF6 and is effectively obscured. Although the absorption cross section at 1503.5 cm−1 for SO2F2 is very strong, it overlaps with the absorption spectrum of SF6.
 | ||
| Fig. 5 Infrared absorption cross section of SO2F2 and SF6. | ||
As shown in Fig. 3, a relatively weak absorption peak of SO2F2 appears in the 2500–3000 cm−1 region. When this is compared with the interference spectra of various SF6 decomposition products, it is evident that no significant interference from other gases occurs within this band. Therefore, to identify a SO2F2 gas detection band with minimal cross-interference, further analysis was conducted on the interference effect of SF6 background gas in this spectral region (Fig. 6). The results reveal that SO2F2 exhibits a distinct absorption peak at 2763 cm−1, which is largely unaffected by other coexisting gases and can thus be used as an optimal detection band.
 | ||
| Fig. 6 Analysis of cross-interference of infrared absorption cross sections of SO2F2 and SF6 in the 2700–2800 cm−1 region. | ||
3.3 SO2F2 detection laser selection
According to the above experiments and the HITRAN database analysis, as shown in Fig. 4, SO2F2 exhibits absorption within the 500–4500 cm−1 spectral range at the following wavenumbers: 544 cm−1, 886 cm−1, 1270 cm−1, 1503 cm−1, 1729 cm−1, 2120 cm−1, 2350 cm−1, 2533 cm−1, 2763 cm−1, 3000 cm−1, 3308 cm−1, 3609 cm−1, and 4013 cm−1. Among these, the absorption bands at 544 cm−1 and 886 cm−1 require costly laser sources, making them unsuitable for practical use. The six absorption peaks at 1270 cm−1, 1729 cm−1, 2120 cm−1, 2350 cm−1, 2533 cm−1, and 3000 cm−1 are subjected to interference from coexisting gases. The absorption peaks at 3308 cm−1, 3609 cm−1, and 4013 cm−1 are relatively weak, resulting in low signal-to-noise ratio and sensitivity, which render them unsuitable. Additionally, the absorption cross section of SO2F2 at 1503 cm−1 is significantly affected by SF6 interference. Therefore, the absorption band at 2763 cm−1 (corresponding wavelength: 3619 nm) offers the best detection performance for SO2F2 in the presence of SF6 decomposition products.This infrared spectral analysis confirms the feasibility of using laser spectroscopy for the selective and quantitative detection of SO2F2 in the presence of SF6 decomposition products. Accordingly, as shown in Fig. 7, a short-wavelength mid-infrared ICL laser (Nanoplus, 3619 nm) was selected for SO2F2 detection in subsequent experiments.
 | ||
| Fig. 7 Cross-interference between SO2F2 and other gases in the band around 2763 cm−1 (3619 nm). | ||
3.4 SO2F2 detection based on ICL laser absorption spectroscopy
 | ||
| Fig. 8 SO2F2 absorption spectra of laser at different working temperatures. | ||
As mentioned in the previous section, when the operating temperature of the ICL laser is maintained at 35 °C and the driving current is within the range of 40–120 mA, the laser tuning range fully covers the absorption spectrum of SO2F2. The direct absorption method was employed for the experiments owing to its intuitive nature and simple system configuration. The working temperature of the ICL laser is set to 35 °C, and the center current of the current driver is set to 80 mA. A 10 Hz low-frequency sawtooth wave with a 400 mV amplitude was applied via the signal generator. The optical path length of the White long optical path cell was set to 8 m. The laser beam emitted by the ICL laser was collimated and directed into the gas cell, where it underwent multiple reflections. After interacting with the target gas, the transmitted beam was collected by a photodetector. A gas distribution system was used to prepare and introduce SO2F2 at specified concentrations into the gas cell for detection.
The average of 100 sets of data was taken as the signal value. First, the spectrum of N2 was recorded to serve as the background spectrum. Subsequently, 600 ppm SO2F2 was introduced into the gas cell, and its direct absorption signal was recorded (Fig. 9). A pronounced signal depression was observed compared with the background signal. As the gas concentration decreased, this depression significantly reduced. Therefore, it can be suggested that this is the SO2F2 absorption signal. According to the Lambert–Beer law, taking the logarithm of the ratio of the background signal to the absorption signal can eliminate background noise and yield an absorbance value containing the concentration information. Fig. 10 shows the result obtained by subtracting the background from the absorption signal presented in Fig. 9.
 | ||
| Fig. 9 The background gas and 600 ppm SO2F2 absorption signal. | ||
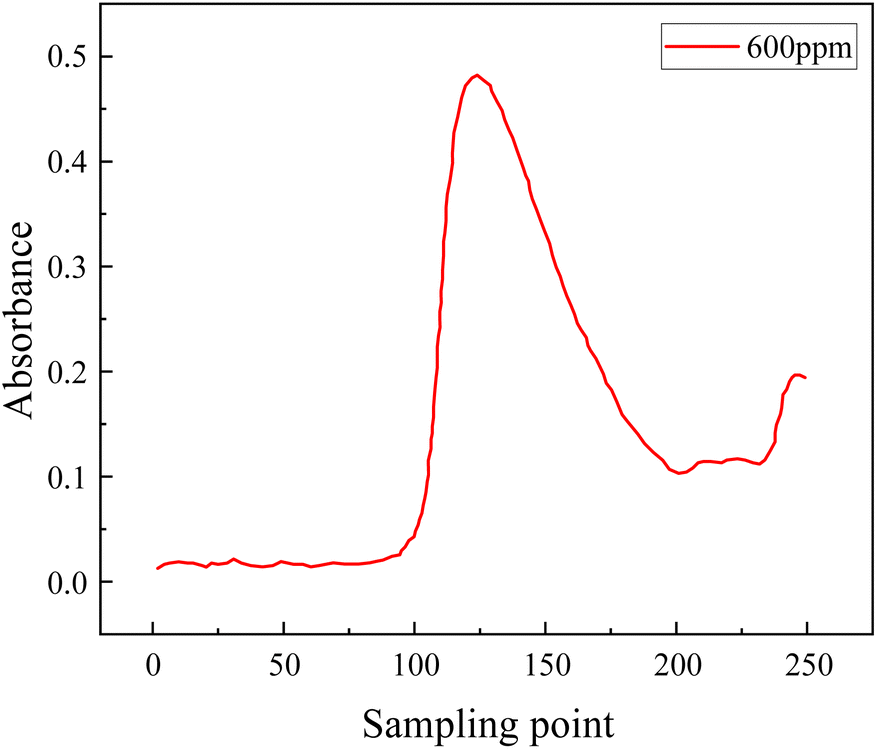 | ||
| Fig. 10 Absorption spectrum of 600 ppm SO2F2 after background subtraction. | ||
The gas distribution instrument was used to prepare SO2F2 gas mixtures at concentrations of 100 ppm, 200 ppm, 300 ppm, 400 ppm, 500 ppm and 600 ppm with N2 as the buffer gas, and the absorbance values of SO2F2 at different concentrations were obtained according to the above steps of average filtering and background subtraction. Fig. 11 presents the direct absorption spectra of SO2F2 at six different concentrations. The experimental results demonstrate that as the SO2F2 gas concentration increased, the absorption intensity gradually increased, indicating a good positive correlation between gas concentration and signal intensity.
 | ||
| Fig. 11 Direct absorption spectra of SO2F2 at different concentrations. | ||
According to Fig. 11, the signal intensity amplitudes at different sampling points within the absorption spectrum at the same concentration vary. To facilitate a more intuitive inversion of the SO2F2 concentration, the signal intensity at the absorption peak is selected for concentration estimation. The peak signal intensities corresponding to different SO2F2 concentrations were extracted from Fig. 11. A linear fit was performed using gas concentration as the horizontal axis and peak signal intensity as the vertical axis, as shown in Fig. 12. The resulting linear correlation coefficient (R2) was 0.997, indicating a good linear relationship between gas concentration and signal intensity. The response of the direct absorption spectroscopy detection system was 0.782 mV ppm−1.
 | ||
| Fig. 12 Linear fitting of the direct absorption spectroscopy. | ||
Repeatability refers to the consistency of multiple measurement results for the same measured target and is a key parameter for evaluating the reliability of an instrument. The standard deviation is used to describe repeatability. A 100 ppm SO2F2 gas mixture was prepared, and multiple consecutive measurements were conducted using direct absorption spectroscopy. The results are shown in Table 1, with the calculated repeatability error to be 2.525 ppm.
| Number of measurements | 1 | 2 | 3 | 4 | 5 | 6 |
| Inversion concentration (ppm) | 102.31 | 103.06 | 101.60 | 98.77 | 99.42 | 96.37 |
The detection limit is a key parameter for evaluating the performance of an instrument and the sensitivity of a measurement method. The detection limit is determined on the basis of the signal-to-noise ratio, defined as the sample concentration at which the signal amplitude is k times the standard deviation of baseline noise. Generally, a signal-to-noise ratio of 3![[thin space (1/6-em)]](https://www.rsc.org/images/entities/char_2009.gif) :1 is used, meaning the detection limit corresponds to the concentration at which the signal equals three times the noise level. The detection limit was calculated using the following equation:
:1 is used, meaning the detection limit corresponds to the concentration at which the signal equals three times the noise level. The detection limit was calculated using the following equation:
 | (1) |
As shown in Fig. 13, the signal amplitude and standard deviation over 20 measurement cycles for 100 ppm SO2F2 are presented. The peak signal is 0.09414, and the corresponding standard deviation is 0.00124, yielding a signal-to-noise ratio of 76. Based on this, the detection limit was calculated to be 3.94 ppm.
 | ||
| Fig. 13 100 ppm SO2F2 signal amplitude and standard deviation based on direct absorption spectroscopy. | ||
To avoid the influence of phase drift on the detection quality, the system uses the R value (defined as the square root of the sum of the squares of the X and Y demodulated signals from the lock-in amplifier) as the concentration inversion waveform. Fig. 14(a) shows the second harmonic R value of the SO2F2 signal at 350 ppm, while Fig. 14(b) presents the corresponding X value.
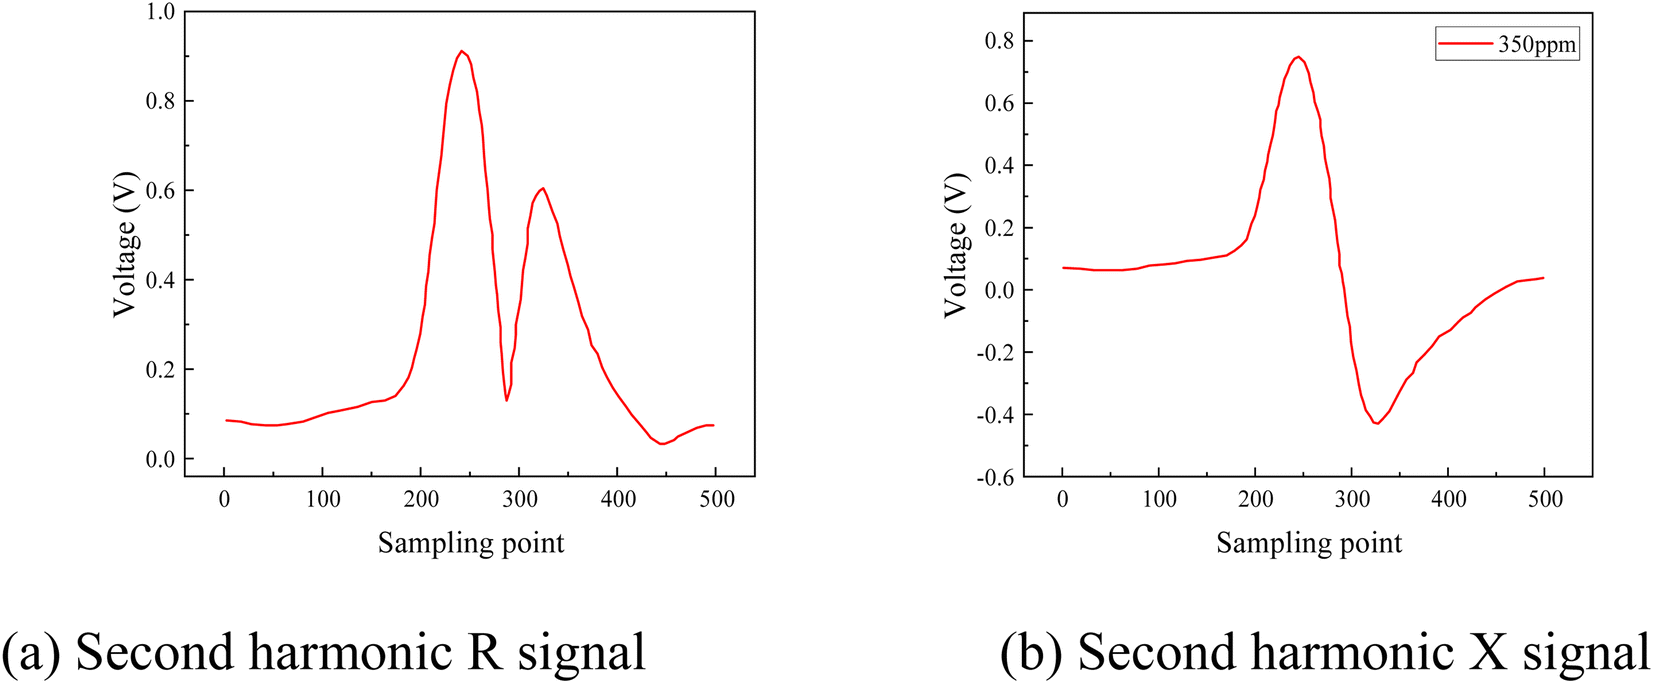 | ||
| Fig. 14 Second harmonic signal value of 350 ppm SO2F2. | ||
As demonstrated in the previous section, the absorption line of SO2F2 near 3619 nm is not a single, well-isolated absorption line but rather a complex composite absorption band formed by the superposition of multiple absorption lines. Compared with a standard single absorption line, this composite band exhibits broader linewidth and stronger absorbance. Therefore, the second harmonic signal demodulated by the lock-in amplifier significantly differs from the typical second harmonic waveform associated with a single line. The second harmonic signal of SO2F2 is a superposition of the second harmonic signals corresponding to the multiple overlapping absorption lines at this wavelength region.
The second harmonic absorption spectra of SO2F2 at six different concentrations are shown in Fig. 15. The experimental results show that, as the SO2F2 concentration increased, the second harmonic signal amplitude rises, demonstrating a clear positive correlation between concentration and signal intensity.
 | ||
| Fig. 15 Second harmonic spectrum of SO2F2 at different concentrations. | ||
The gas concentration and corresponding second harmonic signal peak intensity were subjected to linear fitting, as shown in Fig. 16. The linear correlation R2 for the linear fit is 0.997, indicating an excellent linear relationship between the gas concentration and the second harmonic signal amplitude. The harmonic modulation detection system response was calculated to be 11.433 mV ppm−1. The second harmonic method yielded a stronger signal intensity and the response increased by about 15 times compared with the direct absorption spectroscopy method. This is more conducive to the detection of weak signals and can effectively improve the gas detection limit.
 | ||
| Fig. 16 The linear fitting of the second harmonic method. | ||
The repeatability of the second harmonic method was calculated according to the method described in the previous section. As shown in Table 2, the calculated repeatability error was 0.937 ppm, which was only 0.37 times that of the direct absorption spectroscopy method. The calculated peak signal-to-noise ratio for 20 measurements of 100 ppm SO2F2 signal was 839.1, as shown in Fig. 17. Accordingly, the detection limit was calculated to be 357.56 ppb. This demonstrates detection limit was significantly reduced by about 11 times compared with the direct absorption spectroscopy method.
| Number of measurements | 1 | 2 | 3 | 4 | 5 | 6 |
| Inversion concentration (ppm) | 99.74 | 101.03 | 98.97 | 101.42 | 100.86 | 99.23 |
 | ||
| Fig. 17 100 ppm SO2F2 signal amplitude and standard deviation based on the harmonic modulation method. | ||
The above findings demonstrate that using a 3619 nm ICL laser in combination with laser absorption spectroscopy enables highly selective and sensitive quantitative detection of SO2F2. Compared with traditional detection methods employing broadband light sources and optical filters, laser spectroscopy offers superior selectivity and effectively avoid interference from complex gas components in the SF6 decomposition product detection scenario. Moreover, in contrast to the approach reported in the study by Zhang et al.,19 the ICL laser used in this study is more cost-effective and maintains high detection accuracy. Laser absorption spectroscopy is considered an online monitoring technology with good application potential and significant advantages in terms of portability and reliability.32 The findings of this study provide a practical and efficient solution for the online detection of abnormal gases within SF6 gas-insulated equipment.
4 Conclusion
To enable accurate detection of trace SO2F2 gas within SF6 gas-insulated equipment, this study investigated gas detection methods based on laser absorption spectroscopy, built an FTIR gas spectrum analysis platform and a laser absorption spectroscopy gas detection platform, obtained the infrared spectral characteristics of SO2F2 and its coexisting gases, and then selected the most suitable laser for SO2F2 detection. Subsequently, laser absorption spectroscopy was employed to achieve high-precision SO2F2 detection. The conclusions are as follows:(1) Infrared spectral analysis of SO2F2 and its coexisting gases show that SO2F2 exhibits a strong absorption peak at 2763 cm−1, which is not affected by the interference from its coexisting gases. The corresponding 3619 nm wavelength ICL laser is suitable for SO2F2 detection.
(2) ICL laser direct absorption spectroscopy enables accurate detection of SO2F2 gas. Within the concentration range of 0–600 ppm, the gas concentration shows a good linear relationship with signal peak intensity (R2 = 0.997). The system response is 0.782 mV ppm−1, the repeatability error is 2.525 ppm, and the detection limit is 3.94 ppm.
(3) The ICL laser harmonic modulation method further enhances SO2F2 gas detection performance. In the concentration range of 0–600 ppm, a good linear relationship (R2 = 0.997) is maintained between concentration and signal peak intensity. The system response is 11.433 mV ppm−1, which is about 15 times higher than that of direct absorption spectroscopy. The repeatability error is 0.937 ppm, which is only 0.37 times that of direct absorption spectroscopy. The detection limit is 357.56 ppb, which is about 11 times lower than that of direct absorption spectroscopy.
Data availability
The data supporting this article has been included as part of the article.Conflicts of interest
There are no conflicts to declare.References
- P. Widger and A. M. Haddad, Evaluation of SF6 leakage from gas insulated equipment on electricity networks in Great Britain, Energies, 2018, 11(8), 2037 CrossRef.
- H. Cui, X. Zhang, Z. Jun and Z. Ying, Nanomaterials-based gas sensors of SF6 decomposed species for evaluating the operation status of high-voltage insulation devices, High Volt., 2019, 4(4), 242–258 CrossRef.
- H. Koch, F. Goll and T. Magier, et al., Technical aspects of gas insulated transmission lines and application of new insulating gases, IEEE Trans. Dielectr. Electr. Insul., 2018, 25(4), 1448–1453 CAS.
- Y. Zhuang, X. Hu and B. Tang, et al., Effects of SF6 decomposition components and concentrations on the discharge faults and insulation defects in GIS equipment, Sci. Rep., 2020, 10(1), 15039 CrossRef PubMed.
- X. Zhang, L. Yu, X. Wu and W. Hu, Experimental sensing and density functional theory study of H2S and SOF2 adsorption on Au-modified graphene, Adv. Sci., 2015, 2(11), 1500101 CrossRef.
- G. Wang, H. E. Jo and S. J. Kim, et al., Measurement and analysis of partial discharges in SF6 gas under HVDC, Measurement, 2016, 91, 351–359 CrossRef.
- S. Okabe, T. Ohno and S. Yamauchi, et al., Development of Gas Sensors for Detecting SF6 Decomposition Products and Locating Faults in GIS Amperometric Solid State Ionic Sensor, IEEJ Trans. Sensors Micromachines, 1997, 117(10), 526–531 CrossRef.
- P. Kaur and T. Choudhury, Early Detection of SF6 Gas in Gas Insulated Switchgear[C]//2016 7th India International Conference on Power Electronics (IICPE), IEEE, 2016, pp. , pp. 1–6 Search PubMed.
- J. Li, X. Zhang and X. Han, et al., A partial discharge detection method for SF6 insulated inverted current transformers adopting inner shield case as UHF sensor, IEEE Trans. Power Deliv., 2018, 33(6), 3237–3239 Search PubMed.
- A. S. Mahdi, Z. Abdul-Malek and R. N. Arshad, SF6 decomposed component analysis for partial discharge diagnosis in GIS: A review, IEEE Access, 2022, 10, 27270–27288 Search PubMed.
- C. Toigo, T. Vu-Cong and F. Jacquier, et al., Partial discharge behavior of protrusion on high voltage conductor in GIS/GIL under high voltage direct current: Comparison of SF6 and SF6 alternative gases, IEEE Trans. Dielectr. Electr. Insul., 2020, 27(1), 140–147 Search PubMed.
- X. Han, J. Li and L. Zhang, et al., A novel PD detection technique for use in GIS based on a combination of UHF and optical sensors, IEEE Trans. Instrum. Meas., 2018, 68(8), 2890–2897 Search PubMed.
- D. Chen, X. Zhang, H. Xiong, Y. Li, J. Tang, S. Xiao and D. Zhang, A First-Principles Study of the SF6 Decomposed Products Adsorbed Over Defective WS2 Monolayer as Promising Gas Sensing Device, IEEE Trans. Device Mater. Reliab., 2019, 19(3), 473–483 CAS.
- Y. Zhang, W. Yu and D. Wang, et al., Carbon monoxide detection based on the carbon nanotube-coated fiber gas sensor, Photonics, 2022, 9(12), 1001 CrossRef CAS.
- X. Zhang, J. Yan and Y. Zhang, et al., Infrared Spectrum Analysis and Quantitative Detection of SF6 Characteristic Decomposition Components SO2F2 and SOF2, IEEE Trans. Dielectr. Electr. Insul., 2022, 29(4), 1316–1323 CAS.
- D. Wang, R. Zhuo and Y. Zhang, et al., An All-Fiber FLRD System for SO2 Detection Based on Graphene-Coated Microfiber, Photonics, 2023, 10(8), 863 CrossRef CAS.
- IEC60480-2004, Guidelines for the Checking and Treatment of Sulfur Hexafluoride (SF6) Taken from Electrical Equipment and Specification for its Re-use, 2004 Search PubMed.
- Y. Fu, M. Rong and K. Yang, et al., Calculated rate constants of the chemical reactions involving the main byproducts SO2F, SOF2, SO2F2 of SF6 decomposition in power equipment, J. Phys. D: Appl. Phys., 2016, 49(15), 155502 CrossRef.
- X. Zhang, Z. Zhu and Y. Zhang, et al., The detection of SF6 decomposition components SO2F2, SOF2 using mid-infrared TDLAS at 6.635 μm and 7.462 μm, Vib. Spectrosc., 2022, 123, 103459 CrossRef CAS.
- W. T. Tsai, The decomposition products of sulfur hexafluoride (SF6): Reviews of environmental and health risk analysis, J. Fluorine Chem., 2007, 128(11), 1345–1352 CrossRef CAS.
- A. J. G. Fá, R. Faccio and I. López-Corral, Detection of SOF2 and SO2F2 through aluminium nitride nanosheets: A DFT study, Appl. Surf. Sci., 2021, 538, 147899 CrossRef.
- H. Cui, X. Zhang and J. Zhang, et al., Nanomaterials-based gas sensors of SF6 decomposed species for evaluating the operation status of high-voltage insulation devices, High Volt., 2019, 4(4), 242–258 CrossRef.
- X. Zhang, Y. Zhang and J. Tang, et al., Optical technology for detecting the decomposition products of SF6: a review, Opt. Eng., 2018, 57(11), 110901 CAS.
- H. Yassine, C. Weber and A. Eberhardt, et al., Detection of SO2F2 Using a Photoacoustic Two-Chamber Approach, Sensors, 2023, 24(1), 191 CrossRef PubMed.
- H. Yassine, C. Weber and N. Brugger, et al., Towards a miniaturized photoacoustic detector for the infrared spectroscopic analysis of SO2F2 and refrigerants, Sensors, 2022, 23(1), 180 CrossRef PubMed.
- X. Zhang, Z. Zhu and Y. Zhang, et al., The detection of SF6 decomposition components SO2F2, SOF2 using mid-infrared TDLAS at 6.635 μm and 7.462 μm, Vib. Spectrosc., 2022, 123, 103459 CrossRef CAS.
- M. Dong, C. Zhang and M. Ren, et al., Electrochemical and infrared absorption spectroscopy detection of SF6 decomposition products, Sensors, 2017, 17(11), 2627 CrossRef.
- J. Tang, F. Liu and X. Zhang, et al., Partial discharge recognition based on SF6 decomposition products and support vector machine, IET Sci. Meas. Technol., 2012, 6(4), 198–204 CrossRef CAS.
- H. Yuan, X. Wang and A. Yang, et al., Detection of decomposition products of SF6/air gas mixture by electron attachment mass spectrometry, High Volt., 2022, 7(3), 536–544 CrossRef.
- J. Tang, F. Zeng and X. Zhang, et al., Relationship between decomposition gas ratios and partial discharge energy in GIS, and the influence of residual water and oxygen, IEEE Trans. Dielectr. Electr. Insul., 2014, 21(3), 1226–1234 CAS.
- W. Yuanyuan, W. Ning, J. Shengchang, et al., Study on SF6 Gas Decomposition Products of Typical GIS Defect Models by Infrared Detection[C]//2011 1st International Conference on Electric Power Equipment-Switching Technology, IEEE, 2011, pp. 496–499 Search PubMed.
- M. Gu, J. Chen and Y. Zhang, et al., Portable TDLAS sensor for online monitoring of CO2 and H2O using a miniaturized multi-pass cell, Sensors, 2023, 23(4), 2072 CrossRef CAS PubMed.
| This journal is © The Royal Society of Chemistry 2025 |