
 Open Access Article
 This Open Access Article is licensed under a Creative Commons Attribution-Non Commercial 3.0 Unported Licence
Improving the efficiency of Cr(VI) reduction and adsorption by Fe3O4 using ZSM-5 zeolite support prepared through various methods†
Nichapha Senamarta,
Worapol Yingyuena,
Waranya Obroma,
Tatchapol Nanmonga,
Surangkhana Budsombat a,
Jatuporn Wittayakunb,
Sanchai Prayoonpokarachb and
Sirinuch Loiha*a
a,
Jatuporn Wittayakunb,
Sanchai Prayoonpokarachb and
Sirinuch Loiha*a
aMaterials Chemistry Research Center, Department of Chemistry, Faculty of Science, Khon Kaen University, Khon Kaen 40002, Thailand. E-mail: sirilo@kku.ac.th
bSchool of Chemistry, Institute of Science, Suranaree University of Technology, Nakhon Ratchasima 30000, Thailand
First published on 20th February 2025
Abstract
The study involved the synthesis of magnetite (Fe3O4) and zeolite-supported Fe3O4 (Fe/Z) using co-precipitation (COP) and hydrothermal (HYD) methods which proved effective for removing Cr(VI) from contaminated water. X-ray diffraction (XRD) analysis showed that the Fe3O4 phase had a cubic crystal structure. The COP method resulted in lower crystallinity compared to the HYD method. The different preparation methods also led to variations in the morphologies and sizes of the Fe3O4 particles. The HYD-prepared sample exhibited a uniform spherical shape with sizes of 400–500 nm, while the COP-prepared samples showed rod-like and granule shapes with smaller particle sizes of 20–50 nm. The study also investigated the adsorption ability and reducibility of Cr(VI) on the Fe3O4 adsorbents. It was found that the crystallinity, shapes, and sizes of Fe3O4 significantly influenced the adsorption capacity and stability of the Cr-adsorbed species. Additionally, this work demonstrated that the zeolite supports enhanced the adsorption capabilities of Fe3O4, particularly in the HYD-prepared samples, achieving an adsorption capacity of 2.33 mg per g Fe by creating stable Cr-adsorbed species. X-ray photoelectron spectroscopy (XPS) and X-ray absorption spectroscopy (XAS) confirmed the Cr species adsorbed on Fe/Z_HYD, identifying ion-exchange lattice structures of Fe3−xCrxO4 and Fe1−xCrOOH as the most stable forms. This study provides insights into the potential of Fe3O4/ZSM-5 zeolite for Cr(VI) remediation.
1. Introduction
Chromium (Cr) is a primary metal pollutant that contaminates water and wastewater. In the environment, chromium exists in both the Cr(III) and Cr(VI) oxidation states. Cr(VI) is more toxic and carcinogenic,1,2 whereas Cr(III) is a main component of living organisms. Therefore, the reduction of Cr(VI) to Cr(III) has attracted great attention. Various methods have been employed for detoxifying Cr(VI), including ferrous reduction, electrochemical reduction, and bioreduction.3–5 However, these methods are complicated and require additional processes for further treatment. Additionally, electrochemical reduction and bioreduction are associated with high operating costs. As a result, researchers are seeking a method that is simple, low-cost, and readily available. One promising method of interest is adsorption using materials with redox properties.Magnetite (Fe3O4) containing both Fe(II) and Fe(III) is an interesting adsorbent due to its suitable redox potential and excellent magnetic properties, which affect separation, chemical stability, and non-toxicity.6,7 The adsorption of Cr(VI) by magnetite has received much attention from researchers for removing Cr(VI) from water.8–10 In the adsorption process, the surface area of the adsorbent is important. Magnetite nanoparticles synthesized via the co-precipitation method have a spherical shape and a particle size of 10–15 nm, with an adsorption capacity of 3.56 mg g−1.11 Mesoporous magnetite nanospheres with hollow interiors were synthesized by the solvothermal method, providing spherical shapes ranging from 150–250 nm in diameter and having an adsorption capacity of 6.64 mg g−1.12 Recently, the synthesis methods for Fe3O4 have been found to affect the size, shape, and adsorption capacity. However, the problem of coaggregation of the magnetic nanoparticles decreases the effective surface area of nanoparticles, thus reducing their reactivity. In addition, the Cr-adsorbed species created on the Fe3O4 adsorbent were reported as crucial rows in their adsorption ability. Senamart et al. reported that the formation of stable Cr3+ in Fe1−xCrxOOH and Fe3−xCrxO4, through the adsorption of Cr onto Fe3O4, improved the adsorption capacity.13 The stable form of Cr3+ on Fe3O4 is strongly attached to the surface, typically through chemical bonding. This robust bonding improves the adsorption efficiency by preventing Cr3+ from desorbing, ensuring long-term stability in the system.
To reduce coaggregation, the dispersion of Fe3O4 on zeolite porous material is important. Mai et al.14 developed a zeolite NaA/Fe3O4 composite derived from rice husk ash for the removal of Cr(VI) from water, achieving a maximum adsorption capacity of 69.23%. Additionally, the magnetic Fe3O4/zeolite composites were reported to have high performance in removing toxic compounds, including dyes and organic molecules.15,16 Zeolites are often used as supports or stabilizers for metal catalysts due to their unique microporous structures and ion-exchange properties.17 These characteristics can help to disperse metal nanoparticles and reduce aggregation, although this is not always guaranteed under certain conditions. The aggregation of metal particles, especially when dispersed in liquids or during catalytic reactions and adsorption, is influenced by several factors. These factors include the size of the metal particles, the surface chemistry, the porosity of the zeolite, and the interactions between the metal and the zeolite surface.18 Research indicates that certain design considerations are essential for zeolites to effectively stabilize metal dispersions and prevent aggregation, as discussed by Wang et al.19 Metal ions were initially grafted onto the zeolite surface using ultrasonication, followed by a seed-assisted secondary growth method. The results demonstrated good metal dispersion and stability during a catalytic reaction. Thus, zeolites have the potential to decrease aggregation in metal dispersions, their effectiveness depends on careful design and engineering of both the zeolite structure and the metal dispersion process. Incorporating Fe3O4 into the ZSM-5 zeolite framework is an effective strategy to enhance the catalytic properties of ZSM-5. This approach introduces magnetic properties and improves the dispersion and stabilization of metal species. Fe3O4 nanoparticles can be synthesized either within the ZSM-5 framework or on its surface, achieved through direct incorporation during the zeolite synthesis or through post-synthesis modification.20 The direct synthesis or in situ incorporation of Fe3O4 within the ZSM-5 framework can be achieved by adding iron precursors, such as iron salts, to the hydrothermal synthesis mixture of ZSM-5. During the crystallization process, Fe3+ ions are incorporated into the zeolite structure, leading to the formation of Fe3O4 nanoparticles embedded within the framework.21 The even shape and size distribution of metal oxide within the zeolite enhances stability and catalytic activity. It also reduces leaching or aggregation, which can occur during post-synthesis processes such as co-precipitation method.
This study focused on synthesizing magnetite (Fe3O4) and magnetite-supported ZSM-5 zeolite using co-precipitation (COP) and hydrothermal (HYD) methods. We investigated the adsorption performance of hexavalent chromium (Cr(VI)) and the capability of these adsorbents to reduce Cr(VI) into more stable forms. The experimental design aimed to explore the relationship between the structures and dispersion of Fe3O4 in the adsorbents, both in situ (HYD) and post-synthesis (COP), concerning their adsorption capacity and reduction ability. X-ray absorption spectroscopy (XAS) and X-ray photoelectron spectroscopy (XPS) were utilized to investigate the local structure of iron (Fe) in the materials and the surface characteristics of the adsorbents. The understanding of Fe3O4 interactions within the materials, and its influence in the adsorption and reduction processes for Cr(VI) were investigated.
2. Materials and methods
2.1. Materials
Silicon and aluminum sources were silica (SiO2) (Merck) and sodium aluminate (NaAlO2) (Sigma-Aldrich). Fe(II) and Fe(III) precursors were ferrous sulfate (FeSO4·7H2O, Carlo Erba) and iron(III) chloride (FeCl3, ACROS). Potassium dichromate (K2Cr2O7) and sodium acetate (NaOAc) were obtained from LOBA. Potassium hydroxide pellet (KOH), hydrochloric acid 38% (HCl) and ethylene glycol (EG) were purchased from QRëC™. 1,5-Diphenylcarbazide was purchased from Merck and sodium hydroxide (NaOH) was purchased from RCI Labscan.2.2. Synthesis of HZSM-5 zeolite by hydrothermal method
The NaZSM-5 zeolite was synthesized using a hydrothermal method. First, a sodium silicate (Na2SiO3) solution was prepared by dissolving 17.28 g of SiO2 in 11.87 g of NaOH in 40 mL DI water. Then, a solution of 0.74 g of NaAlO2 dissolved in 25 mL DI water was added dropwise to the Na2SiO3 solution while stirring magnetically. The pH of the mixture was adjusted to around 11 by adding 1 M H2SO4 (approximated volume 125–130 mL) to obtain zeolite gel. The gel was then crystallized in a Teflon-lined autoclave at 170 °C for 72 hours. The solid product was centrifuged and neutralized by washing with DI water. The as-synthesized powder was dried at 110 °C for 12 hours and then calcined at 550 °C for 5 hours to obtain NaZSM-5 zeolite. Subsequently, 1 gram of NaZSM-5 was ion-exchanged with 30 mL of 1.25 M ammonium carbonate ((NH4)2CO3) under reflux conditions at 80 °C for 6 hours. After the ion exchange procedure, the ammonium form (NH4-ZSM-5) was washed with DI water and dried at 110 °C for 12 hours. The proton form of ZSM-5 (HZSM-5) was obtained after calcination at 400 °C for 4 hours.2.3. Synthesis of Fe3O4 and Fe3O4/ZSM-5 via hydrothermal method
The hydrothermal Fe3O4, namely Fe_HYD, was synthesized using the following procedure reported in the literature.22 The 1.94 g of FeCl3 precursor was dissolved in a mixture of 40 mL ethylene glycol (EG) in a two-necked round-bottom flask under N2 atmosphere. The mixture was stirred for 30 min before adding 10 mL of 1.2 M sodium acetate and continuously stirred for 3 h. Then, the mixture was transferred to a Teflon-lined autoclave and crystallized at 190 °C for 24 h. The obtained product was washed with DI water and dried at 50 °C overnight.The synthesis of Fe3O4 supported on HZSM-5 zeolite using a hydrothermal method, namely Fe/Z_HYD, was performed using a similar procedure to Fe_HYD. The 0.5 g HZSM-5 powder was added to the FeCl3 solution before a crystallization step. To investigate the effect of Fe-loading on adsorption efficiency, appropriate amounts of iron precursors were utilized to prepare Fe/ZSM-5 with Si/Fe ratios of 1.1, 1.5, and 3.5.
2.4. Synthesis of Fe3O4 and Fe3O4/ZSM-5 via co-precipitation method
The co-precipitated Fe3O4 namely Fe_COP was synthesized following the methodology described below.23 The mixture of 0.4 M FeCl3 (20 mL) and 0.2 M FeSO4·7H2O (20 mL) were prepared. The Fe3O4 powder was obtained after adjusting the solution to a pH of about 10–11 by using NaOH and continuously stirring for 1 h to complete precipitation. The obtained powder was washed with DI water and dried at 50 °C overnight.The co-precipitated Fe3O4 supported on HZSM-5 labeled Fe/Z_COP was prepared similarly to the co-precipitation method of Fe_COP. The 0.5 g of HZSM-5 was added to the mixture of iron solution before adjusting pH. The obtained powder was washed and dried at 50 °C overnight.
2.5. Characterization
The crystalline structures of the synthesized materials were confirmed by the Powder X-ray Diffractometer (XRD), PANalytical, EMPYREAN. Structural confirmations of the materials were determined couple with using the Fourier-Transform Infrared Spectrometer (FT-IR), Bruker in TENSOR27 model. The morphologies and dispersion of the samples were investigated by Transmission Electron Microscope (TEM), Tecnai G2, FEI and Scanning Electron Microscope (SEM), QUANTA 450, FEI. The oxidation state and speciation of the iron species were determined by X-ray adsorption spectroscopy (XAS) and provided at BL1.1W, Synchrotron Light Research Institute (SLRI) in the intermediate photon energy range of 5.7–6.7 keV and 7.0–8.0 keV for Cr K-edge and Fe K-edge, respectively. The chemical states of Fe Cr and O were analyzed using X-ray photoelectron spectroscopy (XPS), PHI 5000 VersaProbe II, ULVAC-PHI, Japan at BL 5.3, the SUT-NANOTEC-SLRI Joint Research Facility, Synchrotron Light Research Institute, Thailand.2.6. Cr(VI) adsorption in water
The 100 ppm Cr(VI) stock solution was primarily prepared by dissolving 0.0282 g of K2Cr2O7 in 100 mL DI water. All working solutions at the desired concentration were prepared by diluting the stock solution with DI water. The adsorption experiments were carried out in a flask by introducing 0.02 g of adsorbent into 50 mL of Cr(VI) solution concentration of 1 ppm. The effects of pH, contact time and temperature were studied. The pH of the mixture was adjusted in the range 2–4 by 0.1 M HCl and 0.1 M NaOH to modulate the surface charge of adsorbents, the degree of ionization, and the species of adsorbate.24,25 The effect of contact time was carried out at 10, 30, 60 and 90 minutes. For the thermodynamic study, the temperature was varied at 30 °C, 45 °C, and 60 °C. The adsorbent was separated by an external magnet after the adsorption process. The filtrate solution was taken and Cr(VI) concentrations were determined by the colorimetric method.26,27 The complexation of Cr(VI) supernatant and 1,5-diphenylcarbazide ligand was performed under pH ∼ 2 adjusting by 10% (v/v) H2SO4. The solution was provided violet-red color then analyzed by UV-visible spectrometry at λ = 540 nm. The adsorption capacity of Cr (mg per g Fe) was calculated by the following equation.where C0 and Ce (mg L−1) are the initial and equilibrium metal concentration, respectively, V (L) is the solution volume and W (g) is adsorbent weight.

After adsorption experiment, the local structures and species of Fe and Cr on the adsorbent surfaces were investigated by using X-ray absorption (XAS) and X-ray photoelectron spectroscopy (XPS) techniques.
3. Results and discussion
3.1. Structural characterization by XRD
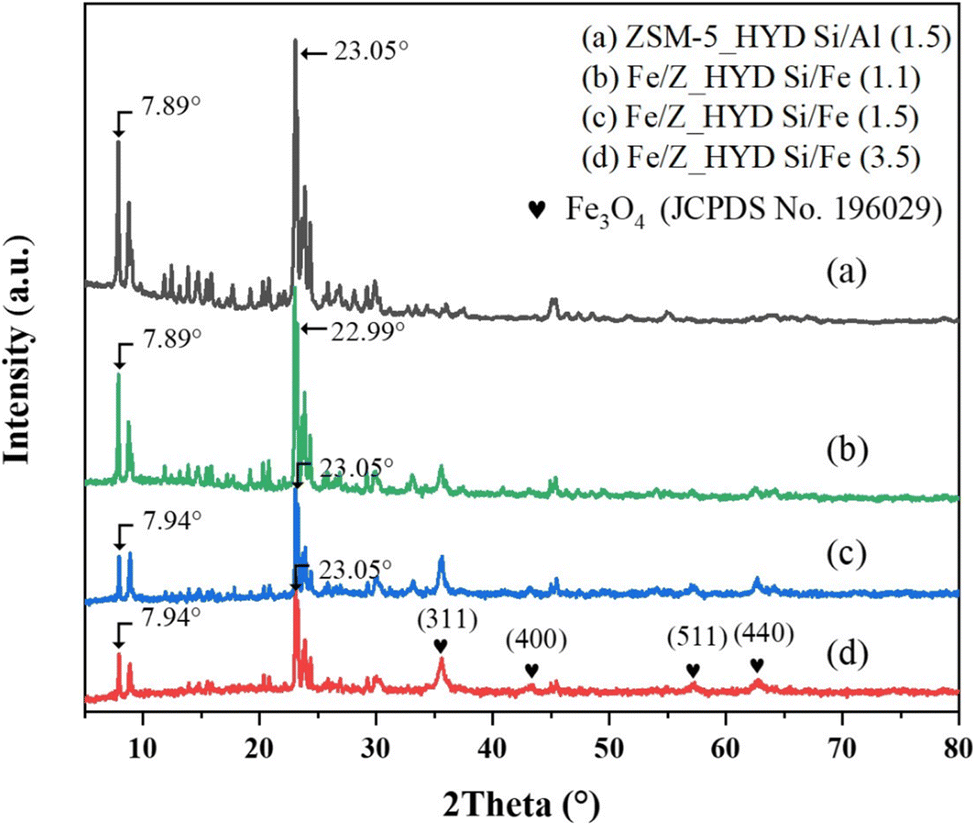
The XRD patterns of Fe3O4 crystalline prepared by hydrothermal and co-precipitation methods (Fig. 1a) show cubic structures corresponding to the JCPDS no. 19-0629 database.8 The characteristic plane of (220), (311), (400), (422), (511), (440) are observed at 2θ = 30.16°, 35.53°, 43.17°, 53.56°, 57.13°, 62.69°, respectively. However, the main peak positions of Fe_COP are systematically shifted to higher values and peak broadening than Fe_HYD. These results indicated the presence of lower crystallinity or short-range order phases of the FexOy nanoclusters on the Fe_COP sample. The samples of Fe/Z_HYD and Fe/Z_COP are plotted to compare with the pristine HZSM-5 as shown in Fig. 1b. The characteristic peaks of HZSM-5 (ref. 28 and 29) are observed after Fe3O4 supporting by two methods with no significant shift of the peak positions. The peak intensities of the Fe/Z_HYD zeolite were significantly lower than those of the pristine HZSM-5. This decrease may be attributed to the desilication of the zeolite framework that occurred during the precipitation of Fe3O4 in a strong alkaline solution, which resulted in partial deconstruction of the zeolite crystalline structure. | ||
| Fig. 1 XRD patterns of Fe_HYD, Fe_COP (a) and Fe/Z_HYD, Fe/Z_COP (b). | ||
The XRD patterns of Fe/ZSM-5_HYD with varying iron loadings are presented in Fig. 2. The crystal structure of ZSM-5 remained stable through all Fe loading amounts. The characteristic peaks corresponding to the Fe3O4 phase were observed on all samples. Notably, the iron loading impacted the structural distortion of the zeolite framework. In samples with low iron content, specifically those with Si/Fe ratios of 1.5 and 3.5, the reflection corresponding to the (101) plane at 7.94° shifted slightly to a higher 2θ compared to the bare ZSM-5. This shift suggests a contraction in the d-spacing, which may be attributed to the partial incorporation of Fe3+ into the zeolite framework.30 In contrast, the sample with high iron content, with a Si/Fe ratio of 1.1, showed a slight shift to a lower 2θ for the (501) plane at 22.09°, suggesting an expansion of the d-spacing in the ZSM-5 structure at high iron loading. These results are consistent with SEM mapping, which revealed the presence of large, separated iron oxide particles distinct from the ZSM-5 framework.
 | ||
| Fig. 2 XRD patterns of Fe/ZSM-5 with varying Fe loading compared with a bare ZSM-5. | ||
3.2. Morphologies and physical properties of the adsorbents
 | ||
| Fig. 3 SEM images of the Fe/Z_COP (a) include Fe3O4_COP (inset) and the Fe/Z_HYD (b) include Fe3O4_HYD (inset). | ||
 | ||
| Fig. 4 TEM images of the Fe/Z_COP (a) include Fe3O4_COP (inset) and the Fe/Z_HYD (b) include Fe3O4_HYD (inset). | ||
The particle sizes of Fe/ZSM-5_HYD remained consistent despite variations in iron (Fe) content. Energy Dispersive Spectroscopy (EDS) analysis revealed that the atomic percentage of Fe increased with higher iron loading. The average Si/Fe ratios determined by the SEM-EDS technique were 3.5, 1.5, and 1.1, as shown in Fig. 5a. An illustration of the iron distribution on the support is presented in Fig. 5b. The results demonstrated that particle aggregation occurred as Fe loading increased. A significant iron oxide particle was observed in the Fe/ZSM-5 sample with a Si/Fe ratio of 1.1.
 | ||
| Fig. 5 SEM images and element percentages (a) and element distribution (b) of Fe/ZSM-5_HYD with varying Fe loading. | ||
| Sample | Surface area (m2 g−1)** | Pore volume (cm3 g−1)* | Average pore diameter (nm)* | Fe content by AAS (g gsample−1) |
|---|---|---|---|---|
| a *Calculated by BJH, ** calculated by BET. | ||||
| Fe_COP | 85 | 0.42 | 11 | 0.78 |
| Fe_HYD | 34 | 0.35 | 9 | 0.89 |
| Fe/Z_COP | 165 | 0.39 | 25 | 0.50 |
| Fe/Z_HYD | 232 | 0.14 | 2 | 0.22 |
| Bare ZSM-5 | 239 | 0.11 | 3 | |
 | ||
| Fig. 6 N2 adsorption–desorption isotherms of the adsorbents. | ||
3.3. Cr(VI) adsorption ability
 | ||
| Fig. 7 Effect of pH to the adsorption capacity of all samples (condition: Cr(VI) initial concentration = 1 ppm, time = 30 min. and temperature 30 °C). | ||
 | ||
| Fig. 8 Effect of contact time to the adsorption capacity of all samples (condition: Cr(VI) initial concentration = 1 ppm, pH 2 for Fe/Z_HYD, pH 3 for F_HYD, Fe_COP, Fe/Z_COP and temperature 30 °C). | ||
 | ||
| Fig. 9 Effect of temperature to the adsorption capacity of all samples (condition: Cr(VI) initial concentration = 1 ppm, pH 2 for Fe/Z_HYD, pH 3 for F_HYD, Fe_COP, Fe/Z_COP and time 30 min). | ||
| Materials | ΔH° (kJ mol−1) | ΔS° (J mol−1 K−1) |
|
|
|
|---|---|---|---|---|---|
| Fe_COP | 23.99 | 87.29 | −2.46 | −3.77 | −5.08 |
| Fe_HYD | 31.18 | 113.40 | −3.18 | −4.88 | −6.58 |
| Fe/Z_COP | 15.97 | 59.59 | −2.08 | −2.98 | −3.87 |
| Fe/Z_HYD | 7.78 | 36.49 | −3.28 | −3.82 | −4.37 |


 | ||
| Fig. 10 Cr uptake over time for Fe/ZSM-5_HYD with varying Fe loading compared to bare ZSM-5 under conditions of 0.02 g adsorbent and 50 mL of 1 ppm Cr(VI) solution. | ||
3.4. Cr(VI) reduction on solid adsorbents
| H2CrO4 → HCrO4− + H+ | (1) |
| 2HCrO4− + 2Fe2+ + 10H+ → 2Fe3+ + 2Cr3+ + 6H2O + O2 | (2) |
| (1−x)Fe3+ + (x)Cr3+ + 2H2O → Fe(1−x)CrxOOH(s) + 3H+ | (3) |
| 2FeO + 4HCrO4− + 4H+ → 2Fe(3−x)CrxO4 + 4H2O + 3O2 | (4) |
 | ||
| Fig. 11 XPS Fe 2p (a) and O 1s (b) spectra of the bare and Cr-adsorbed samples. | ||
3.4.2.1 Fe K-edge XANES. The analysis of the bare and Cr-adsorbed materials was performed using XANES of Fe K-edge energy, as shown in Fig. 12a and c. The pre-edge and edge energies of Fe XANES spectra were not significantly shifted by Cr-adsorption. The proportions of Fe2+ and Fe3+ in the Fe3O4 samples were further investigated using a Linear Combination Fit (LCF) in the Athena program, comparing with Fe3O4 (Fe2+/Fe3+) and Fe2O3 (Fe3+) standards, as depicted in Fig. 12b and d. The Fe3O4 content in the samples of bare Fe_HYD, Fe/Z_COP, and Fe/Z_HYD ranged from 80% to 87%. In contrast, the Fe_COP sample showed approximately 62% Fe3O4 content. This indicates that the zeolite support enhances the formation of the Fe3O4 major phase through the co-precipitation method. After the adsorption of Cr(VI), there was a significant decrease in the Fe3O4 content of the adsorbed samples: Cr@Fe_COP, Cr@Fe_HYD, and Cr@Fe/Z_COP. These reductions were about 20–25% when compared to their bare counterparts. Additionally, the percentage of the Fe2O3 component showed an increase. These results confirm that Cr6+ was reduced to Cr3+ by Fe2+ within the Fe3O4 structure. Notably, the Fe3O4 content in Cr@Fe/Z_HYD decreased by approximately 31%, which aligns well with the maximum adsorption capacity of Cr(VI) reported in Section 4.3.
 | ||
| Fig. 12 Fe K-edge XANES spectra (a) and LCF (b) of Fe_HYD and Fe_COP and Fe K-edge XANES spectra (c) and LCF (d) Fe/Z_HYD and Fe/Z_COP, compared with Fe3O4 and Fe2O3 standards. | ||
3.4.2.2 Fe L-edge XANES. To investigate the phase transformation of iron, Fe L2,3-edge XANES spectroscopy was utilized. The speciation of iron could be elucidated by the shape of the Fe L3-edge peak, with further peak splitting resulting from the relation of crystal field splitting of Fe 3d orbitals and electronic interactions. In a standard Fe2O3, Fe ions occupy the same octahedral sites close to perfect Oh symmetry, resulting in a well-defined spectrum pattern with a clear splitting at the L3-edge. In contrast, Fe ions in Fe3O4 involve three different local structures: Fe(II) octahedral, Fe(III) octahedral, and Fe(III) tetrahedral. Consequently, the summation of these three different local components reduces the splitting resolution of peaks A and B in Fe3O4.42 Similar to the XANES spectra in Fig. 13, the A–B peak splitting in Fe_HYD and Fe/Z_HYD was less than that of Fe_COP and Fe/Z_COP. The results indicate a tendency to observe a higher Fe2O3 content using the COP method, which was not clearly defined in the Fe K-edge XANES analysis. The A–B splitting in Cr@Fe_COP and Cr@Fe/Z_COP showed a clear increase in the intensity of the A peak after Cr-adsorption compared to the bare absorbent. This indicates the transformation of Fe3O4 to Fe2O3 structure due to Cr-adsorption on the COP-prepared adsorbent. As a result, the Fe3O4 structure on Fe_HYD and Fe/Z_HYD was found to be slightly more stable.
 | ||
| Fig. 13 Fe L2,3-edge XANES spectra of (a) Fe_HYD and Fe_COP and (b) Fe/Z_HYD and Fe/Z_COP. | ||
3.4.2.3 Fe K-edge EXAFS.
EXAFS of the bare absorbents. EXAFS χ2 weight fitting of Fe K-edge was determined as shown in Fig. S2† and fitting parameters are in Table 3. The first shell of all samples revealed the short-distance Fe–O bonds in the range of 1.52–1.66 Å and the long-distance Fe–O bond of 1.93–1.97 Å presented in Fe_COP, Fe_HYD and Fe/Z_COP. The short Fe–O bond length corresponds to monomeric and dimeric ferric ion structures, including Fe(H2O)63+, Fe(OH)(H2O)52+, trans and cis Fe(OH)2(H2O)4+, [(H2O)4Fe(OH)2Fe(H2O)4]+, and [(H2O)5FeOFe(H2O)5]4+.43 On the other hand, longer Fe–O bond distances of Fe/Z_HYD were observed at 1.89 and 2.07 Å. The results indicate that there is an accumulation of oligomers, or small clusters, of iron oxides (Fe2O3 and Fe3O4).36 Consequently, the presence of these small clusters in Fe/Z_HYD may have significantly influenced the strong adsorption of Cr(VI) species, resulting in both a high adsorption capacity and enhanced structural stability. Meanwhile, the Fe–Fe bond in the second shell of all samples was in the range of 2.70–2.99 Å which corresponded to a typical Fe–Fe bond in Fe2O3 and Fe3O4 crystals.44 The Fe–Fe bond length of 2.70 Å in Fe_COP is attributed to the high agglomeration of iron oxide clusters.45
| Sample | Bond | R (Å) | CN | σ2 |
|---|---|---|---|---|
| Fe_COP | Fe–O | 1.60 | 1.10 | 0.018 |
| Fe–O | 1.97 | 3.10 | 0.002 | |
| Fe–Fe | 2.70 | 3.30 | 0.001 | |
| Fe–O | 3.37 | 2.40 | 0.014 | |
| Fe_HYD | Fe–O | 1.55 | 1.00 | 0.029 |
| Fe–O | 1.93 | 2.90 | 0.013 | |
| Fe–Fe | 2.99 | 1.00 | 0.007 | |
| Fe–O | 3.36 | 4.30 | 0.006 | |
| Fe/Z_COP | Fe–O | 1.52 | 1.10 | 0.026 |
| Fe–O | 1.95 | 3.10 | 0.017 | |
| Fe–Fe | 2.99 | 0.80 | 0.008 | |
| Fe–O | 3.39 | 2.20 | 0.002 | |
| Fe/Z_HYD | Fe–O | 1.89 | 2.90 | 0.006 |
| Fe–O | 2.07 | 1.20 | 0.012 | |
| Fe–Fe | 2.95 | 1.10 | 0.017 | |
| Fe–O | 3.44 | 5.90 | 0.009 |
EXAFS of the Cr-absorbed samples. The Fe K-edge EXAFS analysis and fitting parameters of the Cr-adsorbed samples are presented in Tables 4 and S2.† The Fe–O bond lengths in the six-fold coordination of Cr@Fe_HYD, Cr@Fe/Z_HYD, and Cr@Fe/Z_COP were in the range of 1.91–2.11 Å. This corresponds to the octahedral FeO6 geometry found in typical Fe2O3 structures, which correlated well to LCF analysis of Fe K-edge XANES. Only the Cr@Fe_COP adsorbent exhibited longer Fe–O bonds at 2.44 Å with tetrahedral geometry (FeO4). Additionally, the four-fold Fe–Fe bond distance was slightly longer in this sample compared to the others. These results may be attributed to the formation of an electrostatic attraction of the O4Fe3+–O–Cr6+O4 species on the pristine Fe_COP. However, the species were not observed on Cr@Fe/Z_COP, indicating that the zeolite support strongly interacts with iron oxide species and stabilizes them through phase transformation.
| Sample | Bond | R (Å) | CN | σ2 |
|---|---|---|---|---|
| Cr@Fe_HYD | Fe–O | 1.91 | 3.0 | 0.004 |
| Fe–O | 2.09 | 3.0 | 0.011 | |
| Fe–Fe | 3.01 | 3.0 | 0.007 | |
| Fe–O | 3.27 | 6.0 | 0.015 | |
| Cr@Fe_COP | Fe–O | 1.95 | 4.4 | 0.005 |
| Fe–O | 2.44 | 4.0 | 0.010 | |
| Fe–Fe | 3.11 | 3.0 | 0.003 | |
| Fe–Fe | 3.36 | 4.0 | 0.001 | |
| Cr@Fe/Z_HYD | Fe–O | 1.95 | 3.0 | 0.007 |
| Fe–O | 2.11 | 3.0 | 0.029 | |
| Fe–Fe | 3.01 | 3.0 | 0.011 | |
| Fe–Fe | 3.47 | 3.0 | 0.008 | |
| Cr@Fe/Z_COP | Fe–O | 1.96 | 3.0 | 0.008 |
| Fe–O | 2.10 | 3.0 | 0.037 | |
| Fe–Fe | 3.00 | 3.0 | 0.011 | |
| Fe–Fe | 3.49 | 3.0 | 0.007 |
3.4.2.4 Cr K-edge XANES. A simultaneous reduction of Cr(VI) in the adsorption process of all adsorbents has been proposed. The reduction of Cr was studied on the adsorbed solid using XAS. Variation of Cr valences was determined in the XANES region using Cr2O3 and CrO3 as standards for Cr3+ and Cr6+, respectively. On adsorbent surfaces, the reduction of Cr6+ to Cr3+ on the adsorbents was identified by reduction of the pre-edge intensities in Cr K-edge XANES spectra (Fig. 14a). XANES spectra of the CrO3 standard revealed sharp pre-edge character of the tetrahedral geometry Cr6+ at 5992.4 eV, while two pre-edge peaks with low intensity at 5989.3 and 5992.6 eV of octahedral Cr3+ were identified. Please take note of the following information:
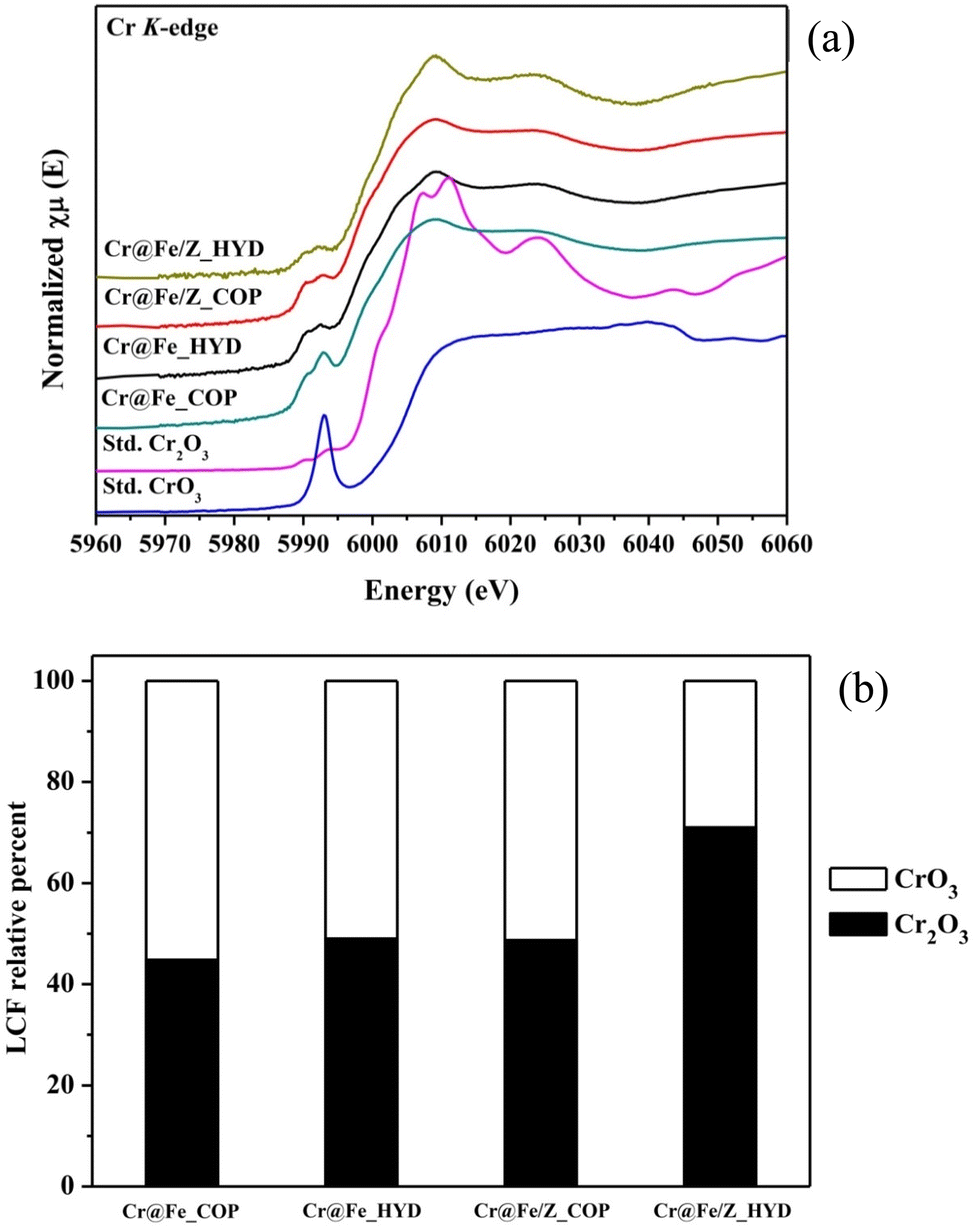 | ||
| Fig. 14 Cr K-edge XANES spectra (a) and LCF (b) of Cr(VI) adsorbed samples compared with CrO3 and Cr2O3 standards. | ||
All samples displayed two pre-edge positions related to Cr3+ with slightly higher intensity than the Cr2O3 standard, suggesting a partial reduction of Cr6+ to Cr3+ during the adsorption process. However, the pre-edge and XANES profiles of the samples did not align well with the Cr2O3 structure. To examine the components of Cr6+ and Cr3+ in the samples, LCF analysis of the XANES spectra was conducted, as illustrated in Fig. 14b.
The samples Cr@Fe_COP, Cr@Fe_HYD, and Cr@Fe/Z_COP contained approximately 50% Cr2O3. Among these, the Cr@Fe/Z_HYD demonstrated the highest reduction performance of about 70%. This enhanced activity could be attributed to the well-dispersed Fe3O4 adsorbed species on the zeolite surface. Consequently, Cr@Fe/Z_HYD exhibited superior reduction performance and adsorption ability during the Cr6+ adsorption process. When supported by zeolite, the Cr3+ content in Cr@Fe/Z_HYD was approximately 20% higher than in Cr@Fe_HYD. The study investigated the improved Cr-reduction achieved using zeolite-supported Fe3O4, which was synthesized through the hydrothermal method. It was proposed that the zeolite contributes to the dispersion and stabilization of the Fe3O4 species.
3.4.2.5 Cr K-edge EXAFS. The Cr–O bond distances ranging from 1.66 to 1.81 Å corresponded to the Cr6+–O, while the longer bond lengths at about 1.96–1.99 Å represented the Cr3+–O bonds. These observations were consistent across all samples, as detailed in Table 5. Additionally, the Cr–Cr bonds at 2.98–3.03 Å were found to be longer than those in Cr2O3. The bond lengths were well-suited to the oligomer and small cluster of CrOx.46 Based on the bond distances and coordination numbers, it was suggested that an oligomeric form of (Cr6+–O–Cr3+–O–Cr6+)x could be formed on the adsorbent surface, as indicated in a report by Zine et al. using EPR analysis.47 This suggested polymerization of Cr–O bonds may have been initiated by the formation of Cr3+ species on the surface. Notably, longer Cr–O and Cr–Cr bond distances, along with a slightly higher coordination number compared to other samples, were observed in the Cr@Fe/Z_HYD. These results suggest the formation of bonds within the CrOx clusters. This finding aligns well with the linear combination fitting (LCF) analysis of the Cr K-edge for the sample. The presence of CrOx clusters may enhance the adsorption stability on Cr@Fe/Z_HYD.
| Sample | Bond | R (Å) | CN | σ2 |
|---|---|---|---|---|
| Cr@Fe_COP | Cr–O | 1.75 | 2.0 | 0.032 |
| Cr–O | 1.97 | 2.1 | 0.005 | |
| Cr–Cr | 3.00 | 3.0 | 0.020 | |
| Cr–O | 3.11 | 3.0 | 0.013 | |
| Cr@Fe_HYD | Cr–O | 1.66 | 2.0 | 0.055 |
| Cr–O | 1.99 | 2.1 | 0.005 | |
| Cr–Cr | 3.03 | 3.0 | 0.012 | |
| Cr–O | 3.16 | 3.0 | 0.005 | |
| Cr@Fe/Z_COP | Cr–O | 1.78 | 2.0 | 0.041 |
| Cr–O | 1.97 | 2.0 | 0.004 | |
| Cr–Cr | 2.98 | 2.8 | 0.016 | |
| Cr–O | 3.09 | 2.3 | 0.002 | |
| Cr@Fe/Z_HYD | Cr–O | 1.81 | 2.4 | 0.018 |
| Cr–O | 1.96 | 2.6 | 0.001 | |
| Cr–Cr | 3.03 | 3.3 | 0.014 | |
| Cr–O | 3.81 | 3.7 | 0.011 |
Structural discussion. Based on the comprehensive analysis of Fe and Cr K-edge XAS, we discuss the potential structural changes of the adsorbents during Cr adsorption. Fe_COP, Fe_HYD, Fe/Z_COP, and Fe/Z_COP contain a primary phase of Fe3O4 and iron oxide clusters of Fe2O3 and FeOOH. However, Fe/Z_HYD has larger Fe3O4 particle sizes with a slightly higher content determined by the Fe L3 edge XANES, compared to the other samples. These species play a critical role in Cr-capacity and stabilization during the adsorption process. Mononuclear and binuclear species of ferric ions were found to be present in Fe_COP, Fe_HYD, and Fe/Z_COP during the adsorption process, providing an electrostatically adsorbed species of O4Fe3+–O–Cr6+O4. The presence of mono- and binuclear ferric species suggests an unstable iron oxide structure of the adsorbents. A partial reduction of Cr6+ to Cr3+ in the form of Fe1−xCrxOOH is determined in all samples. A significant cluster of CrOx was exclusively identified in the Fe/Z_HYD adsorbent, which indicates the formation of an ion-exchange lattice composed of Fe3−xCrxO4. This structure features tetrahedral CrO4 and octahedral CrO6 geometries, consistent with an average coordination number of 5 for the Cr–O bonds investigated in Cr K-edge EXAFS. The presence of ion-exchange lattice species such as Fe3−xCrxO4 and Fe1−xCrxOOH aligns with the observed increase in Cr3+ content on Cr@Fe/Z_HYD, as demonstrated by LCF Cr K-edge XANES analysis. Consequently, the Fe/Z_HYD adsorbent enhances adsorption capacity by fostering strong interactions between Cr and the Fe3O4 lattice, leading to the formation of stable clusters, Fe3−xCrxO4 and Fe1−xCrxOOH. This suggests that the zeolite-supported Fe3O4 structure prepared by the hydrothermal method improves both the Cr-adsorption capacity and stability.
3.5. Structural stability of Fe/ZSM-5_HYD after Cr-adsorption
After chromium adsorption, the crystallinity of Fe/ZSM-5 decreased, as evidenced by the lower intensity of the main peaks, as shown in Fig. S3(A).† A significant decrease in the crystallinity of both the ZSM-5 and Fe3O4 phases was observed in the sample with a Si/Fe ratio of 1.1. These results indicate that Fe/ZSM-5 with high iron loading is less stable during chromium adsorption.The FTIR spectra in Fig. S3(B)† of the Cr-adsorbed Fe/ZSM-5_HYD displayed low signal intensity due to the presence of Cr species covering the surfaces of ZSM-5, a phenomenon commonly observed in the literature regarding Cr adsorption.48 A shoulder peak at 1223 cm−1 and a strong adsorption band at 1100 cm−1 correspond to the antisymmetric stretching vibrations of the Si–O–Si bond in ZSM-5.49 These features were present in all samples, although a decrease in band intensities was noted, correlating well with the amounts of Cr uptake. The lowest band intensity was observed in the Fe/Z_HYD sample, which had a Si/Fe ratio of 1.1. These results were in strong agreement with the XRD intensity findings. The crystallinity of ZSM-5 significantly decreased during the chromium adsorption process in samples with high iron content. Therefore, optimal iron incorporation into the ZSM-5 structure is crucial for maintaining crystallinity during the adsorption process.
4. Conclusion
Magnetite (Fe3O4) and magnetite-supported ZSM-5 zeolite (Fe/Z) were successfully synthesized via co-precipitation and hydrothermal methods. Fe3O4 was observed as a major phase in all samples. The Fe3O4 particles prepared by different methods showed different shapes and sizes. The uniform spherical shape with large particle sizes of 400–500 nm was observed in Fe_HYD and Fe/Z_HYD. Meanwhile, rod-like and granule particle shapes with small sizes of 20–50 nm were exhibited on Fe_COP and Fe/Z_COP. The supporting zeolite could maximize the Cr-adsorption capacity of Fe3O4 in both preparation methods. Fe/Z_HYD adsorbent showed the most adsorption capacity of 2.33 mg per g Fe and the highest content of the reduced Cr3+ species over other adsorbent at 30 min and pH 2. A superior capacity of the Fe/Z_HYD was attributed to the homogenous dispersion of the Fe3O4 particles on zeolite and the presence of the stable Cr-adsorbed species. The stable forms of Fe3−xCrxO4 and Fe1−xCrxOOH, which are an ion-change Cr into Fe3O4 lattice, were investigated. Fe_COP, Fe/Z_COP, and Fe_HYD exhibited unstable electrostatic attraction of Cr through mono- and binuclear ferric oxides, resulting in low adsorption capacity due to weak interaction of Cr on the adsorbent surface.Conflicts of interest
There are no conflicts to declare.Acknowledgements
This work was supported by the Fundamental Fund of Khon Kaen University, the National Science Research and Innovation Fund (NSRF), Center for Innovation in Chemistry (PERCH-CIC), Materials Chemistry Research Center (MCRC), Khon Kaen University, Thailand. Synchrotron Light Research Institute (SLRI), Nakhon Ratchasima, Thailand (BL 1.1W and 5.3).References
- A. Gaffer, A. A. Al Kahlawy and D. Aman, Egypt. J. Pet., 2017, 26, 995–999 CrossRef.
- S. S. Pillai, M. D. Mullassery, N. B. Fernandez, N. Girija, P. Geetha and M. Koshy, Ecotoxicol. Environ. Saf., 2013, 92, 199–205 CrossRef CAS PubMed.
- L. N. Døssing, K. Dideriksen, S. L. S. Stipp and R. Frei, Chem. Geol., 2011, 285, 157–166 CrossRef.
- M. Sun, G. Zhang, Y. Qin, M. Cao, Y. Liu, J. Li, J. Qu and H. Liu, Environ. Sci. Technol., 2015, 49, 9289–9297 CrossRef CAS PubMed.
- H.-K. Zhang, H. Lu, J. Wang, J.-T. Zhou and M. Sui, Environ. Sci. Technol., 2014, 48, 12876–12885 CrossRef CAS PubMed.
- E. Saksornchai, J. Kavinchan, S. Thongtem and T. Thongtem, Mater. Lett., 2018, 213, 138–142 CrossRef CAS.
- R. Ianoş, C. Păcurariu, S. G. Muntean, E. Muntean, M. A. Nistor and D. Nižňanský, J. Alloys Compd., 2018, 741, 1235–1246 CrossRef.
- S. Rajput, C. U. Pittman and D. Mohan, J. Colloid Interface Sci., 2016, 468, 334–346 CrossRef CAS PubMed.
- K. S. Padmavathy, G. Madhu and P. V. Haseena, Proc. Technol., 2016, 24, 585–594 CrossRef.
- M. R. Lasheen, I. Y. El-Sherif, D. Y. Sabry, S. T. El-Wakeel and M. F. El-Shahat, Desalin. Water Treat., 2014, 52, 6464–6473 CrossRef CAS.
- Y. C. Sharma and V. Srivastava, J. Chem. Eng. Data, 2011, 56, 819–825 CrossRef CAS.
- M. Kumari, C. U. Pittman and D. Mohan, J. Colloid Interface Sci., 2015, 442, 120–132 CrossRef CAS PubMed.
- N. Senamart, K. Deekamwong, J. Wittayakun, S. Prayoonpokarach, N. Chanlek, Y. Poo-arporn, S. Wannapaiboon, P. Kidkhunthod and S. Loiha, RSC Adv., 2022, 12, 25578–25586 RSC.
- N. T. N. Mai, N. T. A. Thu, N. T. B. Trang, P. Q. Phu, D. V. H. Thien, L. H. V. Thanh and C. L. N. Hanh, IOP Conf. Ser.: Earth Environ. Sci., 2021, 947, 012012 CrossRef.
- F. Pirvu, C. I. C. Mierlă and G. A. Catrina, J. Nanomater., 2023, 13(11), 1745 CrossRef CAS PubMed.
- Q. Fang, J. W. Lin, Y. H. Zhan, M. J. Yang and W. J. Zheng, Huan Jing Ke Xue, 2014, 35(8), 2992–3001 CAS.
- N. Kordala and M. Wyszkowski, Molecules, 2024, 29, 1069 CrossRef CAS PubMed.
- H. Prats, G. Alonso, R. Sayós and P. Gamallo, Microporous Mesoporous Mater., 2020, 1104 Search PubMed.
- T. Wang, L. Liu, H. Wu, J. Zhang, Z. Feng, X. Yan, X. Wang, G. Han and X. Feng, Dalton Trans., 2024, 53, 5212 RSC.
- J. Zhang, X. Tang, H. Yi, Q. Yu, Y. Zhang, J. Wei and Y. Yuan, Appl. Catal., A, 2022, 630, 118467 CrossRef CAS.
- J. Cao, G. Chang, H. Guo and J. Chen, Trans. Tianjin Univ., 2013, 19, 326–331 CrossRef CAS.
- S. I. U. Madrid, U. Pal and F. S.-D. Jesus, Adv. Nan. Res., 2014, 2, 187–198 CrossRef.
- S. H. Gurlhosur, B. Sreekanth, N. Shashidhar, R. Desai, A. Bhusanur, C. Puranik and P. S. SaiTejaswini, Int. J. Curr. Res., 2018, 10(2), 65995–65999 Search PubMed.
- A. C. Zimmermann, A. Mecabô, T. Fagundes and C. A. Rodrigues, J. Hazard. Mater., 2010, 179, 192–196 CrossRef CAS PubMed.
- L. Li, Y. Li, L. Cao and C. Yang, Carbohydr. Polym., 2015, 125, 206–213 CrossRef CAS PubMed.
- G. Du, Z. Li, L. Liao, R. Hanson, S. Leick, N. Hoeppner and W.-T. Jiang, J. Hazard. Mater., 2012, 221–222, 118–123 CrossRef CAS PubMed.
- M. Kiyama, Bull. Chem. Soc. Jpn., 1974, 47, 1646–1650 CrossRef CAS.
- C. Li, J. Ma, Z. Xiao, S. B. Hector, R. Liu, S. Zuo, X. Xie, A. Zhang, H. Wu and Q. Liu, Fuel, 2018, 218, 59–66 CrossRef CAS.
- Database of Zeolite Structures, accessed September 21, 2024, https://www.iza-structure.org/databases/.
- B. Ma, A. F. Martinez, A. Mancini and B. Lothenbach, Cem. Concr. Res., 2021, 140, 106304 CrossRef CAS.
- Y. Yang, M. Huang, J. Qian, D. Gao and X. Liang, Sci. Rep., 2020, 10, 8331 CrossRef CAS PubMed.
- J. Zhang, S. Lin, M. Han, Q. Su, L. Xia and Z. Hui, Water, 2020, 12, 446 CrossRef CAS.
- G. Zolfaghari, A. Esmaili-Sari, M. Anbia, H. Younesi, S. Amirmahmoodi and A. Ghafari-Nazari, J. Hazard. Mater., 2011, 192, 1046–1055 CrossRef CAS PubMed.
- E. Darezereshki, A. k. Darban, M. Abdollahy and A. Jamshidi-Zanjani, Environ. Nanotechnol. Monit. Manag., 2018, 10, 51–62 Search PubMed.
- M. N. Sahmoune, Environ. Chem. Lett., 2019, 17, 697–704 CrossRef CAS.
- Z. Harrache, M. Abbas, T. Aksil and M. Trari, Microchem. J., 2019, 144, 180–189 CrossRef CAS.
- J. He, S. Hong, L. Zhang, F. Gan and Y.-S. Ho, Fresenius Environ. Bull., 2010, 19, 2651–2656 CAS.
- S. Nasanjargal, B. A. Munkhpurev, N. Kano, H. J. Kim and Y. Ganchimeg, J. Environ. Prot., 2021, 12, 654–675 CrossRef CAS.
- J. Baltrusaitis, D. M. Cwiertny and V. H. Grassian, Phys. Chem. Chem. Phys., 2007, 9, 5542–5554 RSC.
- A. P. Grosvenor, B. A. Kobe and N. S. McIntyre, Surf. Sci., 2004, 572, 217–227 CrossRef CAS.
- S. Wu, J. Lu, Z. Ding, N. Li, F. Fu and B. Tang, RSC Adv., 2016, 6, 82118–82130 RSC.
- J. Li, A. Balaji and T. K. Sham, J. Electron Spectrosc. Relat. Phenom., 2017, 220, 109–113 CrossRef CAS.
- M. Zhu, B. W. Puls, C. Frandsen, J. D. Kubicki, H. Zhang and G. A. Waychunas, Inorg. Chem., 2013, 52, 6788–6797 CrossRef CAS PubMed.
- Z. Y. Wu, S. Gota, F. Jollet, M. Pollak, M. Gautier-Soyer and C. R. Natoli, Phys. Rev. B:Condens. Matter Mater. Phys., 1997, 55, 2570–2577 CrossRef CAS.
- H. Okudera, A. Yoshiasa, K. Murai, M. Okube, T. Takeda and S. Kikkawa, J. Mineral. Petrol. Sci., 2012, 107, 127–132 CrossRef CAS.
- P. G. Harrison, N. C. Lloyd, W. Daniell, C. Bailey and W. Azelee, Chem. Mater., 1999, 11, 896–909 CrossRef CAS.
- S. Khaddar-Zine, A. Ghorbel and C. Naccache, J. Mol. Catal. Chem., 1999, 150, 223–231 CrossRef CAS.
- A. S. Gning, C. Gaye, A. B. Kama, P. A. Diaw, D. D. Thiare and M. Fall, J. Mater. Eng., 2024, 12, 84–103 CAS.
- S. M. Ebrahimi, J. S. Ghomi and M. A. Mutashar, Main Group Met. Chem., 2022, 45, 57–73 CrossRef CAS.
Footnote |
| † Electronic supplementary information (ESI) available. See DOI: https://doi.org/10.1039/d4ra06845a |
| This journal is © The Royal Society of Chemistry 2025 |