DOI:
10.1039/D4MA01078G
(Paper)
Mater. Adv., 2025,
6, 1330-1344
Optimization of photodegradation of crystal violet dye and biomedical applications of greenly synthesized NiO nanoparticles†
Received
25th October 2024
, Accepted 31st December 2024
First published on 31st December 2024
Abstract
Metal oxide nanoparticles (NPs) are considered suitable candidates for photocatalytic applications because of their large surface area, easy generation of electron–hole pairs for redox reactions and tunable optical properties. Additionally, the successful capping of NP surfaces by bioactive species of plant extracts can further improve their size, shape and bandgap. Inspired by the green synthesis approach, the first time synthesis of nickel oxide NPs (CMFE@NiO NPs) using an aqueous extract of C. macrocarpa fruit (natal plum) is reported herein for the photodegradation of crystal violet (CV) dye. The synthesized NPs were characterized by PXRD, UV-vis spectra, FTIR, HR-TEM, EDX, DLS, ZP and TGA. After characterization, CMFE@NiO NPs were evaluated for the degradation of CV dye under sunlight for 120 min. The effect of various reaction parameters, such as pH, temperature, catalyst dose and initial dye concentration, were studied, and reaction conditions were optimized by applying mathematical and statistical tools, i.e., RSM/BBD design. Maximum degradation (99%) of 10 ppm CV solution was observed at a catalyst dose of 50 mg, 358 K and pH 7 with a rate constant value of 3.81 × 10⁻² min−1. The effect of radical scavengers was studied to determine major ROS involved and propose a reaction mechanism. Moreover, the antibacterial activity of the NPs was evaluated against Gram-positive and Gram-negative strains. CMFE@NiO NPs showed good inhibition of all bacterial strains with inhibition diameters of 15 ± 1.5 mm, 14 ± 1.2 mm, 22 ± 2.0 mm and 24 ± 2.2 mm for S. aureus, B. subtilis, E. coli and P. multocida, respectively. CMFE@NiO NPs were found to be more noxious against Gram-negative bacterial strains. The antioxidant potential of CMFE@NiO NPs also showed good reduction potential to reduce DPPH˙ with an IC50 value of 32.9 ± 2.4 μg mL−1, which is better than that of the extract (IC50 = 39.3 ± 2.1 μg mL−1).
1. Introduction
Water pollution caused by azo dyes presents a significant environmental challenge that necessitates effective remediation strategies.1 Azo dyes are synthetic organic compounds characterized by the presence of one or more azo (–N![[double bond, length as m-dash]](https://www.rsc.org/images/entities/char_e001.gif) N–) groups. They are widely used in various industries, particularly textiles, plastics, and food, owing to their vibrant colors and stability. However, their extensive use has led to significant environmental challenges, particularly water pollution. By employing a combination of physical, chemical, and biological methods, it is possible to address the impacts of azo dyes and restore water quality. Continued research on novel materials and techniques, such as advanced nanomaterials and biotechnological approaches, holds promise for enhancing the efficiency and sustainability of azo dye remediation efforts.2
N–) groups. They are widely used in various industries, particularly textiles, plastics, and food, owing to their vibrant colors and stability. However, their extensive use has led to significant environmental challenges, particularly water pollution. By employing a combination of physical, chemical, and biological methods, it is possible to address the impacts of azo dyes and restore water quality. Continued research on novel materials and techniques, such as advanced nanomaterials and biotechnological approaches, holds promise for enhancing the efficiency and sustainability of azo dye remediation efforts.2
Nickel oxide (NiO) NPs have emerged as a focal point in nanotechnology owing to their distinctive electronic and optical properties. As a transition metal oxide, NiO NPs exhibit a wide range of applications, particularly in areas such as catalysis, sensors, and energy storage.3,4 One of the most intriguing aspects of NiO NPs is their energy band gap, which plays a crucial role in determining their optical behavior and functionality. The energy band gap of NiO is typically in the range of 3.6–4.0 eV depending on factors such as particle size, synthesis method, and environmental conditions. This wide energy band gap allows NiO NPs to exhibit semiconducting behavior, making them particularly suitable for applications in photocatalysis and solar energy conversion. The ability to absorb UV-visible light and facilitate charge carrier generation is a key feature that enhances its effectiveness in various photocatalytic processes, including the degradation of organic pollutants, such as azo dyes.3,5
The sensitivity of NiO NPs to changes in their surroundings, coupled with their tunable optical properties, makes them promising candidates for developing innovative photocatalysts.6 The surface modification of NiO NPs can be achieved by applying a green synthesis approach. It has been previously reported that greenly synthesized NiO NPs have diverse functional groups on their surface, highly stable, and tunable optical properties, i.e., energy bandgap. The phyto-functionalized NPs can serve as excellent photocatalysts for azo dye degradation by optimizing the reaction conditions.7 Owing to the miraculous advantages of green synthesis, various plant materials have been utilized to synthesize NPs, but the bioactive enriched C. macrocarpa fruit aqueous extract has never been used to synthesize NiO NPs.
C. macrocarpa belongs to one of the largest plant families, i.e., the Apocynaceae family. It is an evergreen shrub, also called natal plum, which is commonly found in the subtropical and tropical regions of Asia and Africa.8 Its ripened fruits, leaves and stems are enriched in various bioactives, such as alkaloids, flavonoids, saponins, triterpenoids, steroids, quinones, tannins, carbohydrates and phenols. The natal plum contains a considerable number of phytochemicals, such as phenolics (caffeic acid, catechin, quercetin-3-O-glucoside, coumaroylquinic acid, etc.), flavonoids, alkaloids, terpenoids, saponins, vitamins and minerals.8–10 Natal plum is commonly used in desserts, sauces, ice cream, jellies and jams. It is also used in traditional medicines to cure cough and diarrhea in livestock and to cure various microbial diseases.10 Owing to its phytochemical enriched nature, it can be hypothesized that the C. macrocarpa fruit aqueous extract can mediate the synthesis of NiO NPs with improved optical, catalytic and biological properties.
Response surface methodology (RSM) is a statistical and mathematical technique used to optimize processes and improve product quality. It is particularly useful when several variables influence a response variable, allowing researchers to analyze the interactions between these factors effectively.11 RSM employs various designs, among which the Box–Behnken design is one of the most popular because of its efficiency and practicality in exploring quadratic response surfaces. The Box–Behnken design is a specific type of RSM involving a three-level factorial design. It requires fewer experiments than full factorial designs and provides adequate information to model the complex relationships between variables. The effect of temperature, azo dye concentration, catalyst dose and pH of reaction can be optimized by applying the RSM/BBD model to obtain highly efficient results of photodegradation reactions.12
Nickel oxide (NiO) NPs have attracted considerable interest in recent years owing to their remarkable antibacterial and antioxidant properties. These characteristics not only highlight their potential in various applications, including biomedical and environmental fields but also contribute to addressing pressing health concerns related to microbial resistance and oxidative stress.13 NiO NPs exhibit effective antibacterial activity against a range of Gram-positive and Gram-negative bacteria. The primary mechanisms by which these nanoparticles exert their antibacterial effects include the generation of reactive oxygen species (ROS), disruption of bacterial membranes, and interference with cellular processes. Upon contact with bacteria, NiO nanoparticles can induce oxidative stress by generating ROS, leading to cellular damage, including lipid peroxidation and DNA fragmentation. This oxidative damage disrupts essential metabolic functions and ultimately results in bacterial cell death.14 Moreover, NiO NPs have also demonstrated significant antioxidant activity by scavenging free radicals and reducing oxidative stress. Their ability to donate electrons allows them to neutralize free radicals, thereby preventing cellular damage and maintaining the redox balance within biological systems.15
In the present study, NiO NPs are greenly synthesized using a bioactive-enriched aqueous extract of C. macrocarpa to degrade CV dye. These NPs are characterized by UV-visible spectroscopy, FTIR, PXRD, EDX, HR-TEM, DLS, ZP and TGA analyses. After successful characterization, the CMFE@NiO NPs are evaluated for their photocatalytic potential to degrade CV dyes under sunlight. The effects of various reaction conditions on the photodegradation capability of the catalysts were assessed, and the conditions were optimized using the RSM/BBD model. The effect of radical scavengers was studied to determine the major ROS involved in the reaction and to propose a degradation mechanism. CMFE@NiO NPs are also evaluated for antibacterial applications against Gram-positive and Gram-negative strains by a standard disc diffusion assay and for antioxidant potential by DPPH assay.
2. Experimental work
2.1. Materials and instruments used
High purity chemicals purchased from Sigma Aldrich and Merck, Germany, were used for experimental work. All the solutions were prepared in double-deionized water. Chromic acid solution was used to wash the glassware, followed by drying the glassware in an oven. C. macrocarpa fruit was collected from the plant nursery of the University of Sargodha, Pakistan.
Powder X-ray diffraction (PXRD) spectra were recorded on a JDX-3532 X-ray diffraction (XRD) instrument from JEOL, Japan. Functional group analysis was performed by recording FTIR spectra using the Shimadzu FTIR-8400S spectrophotometer (Japan), and absorbance spectra were obtained using the Shimadzu UV-1800 spectrophotometer (Japan). High-resolution transmission electron microscopy (HRTEM) analysis was performed using a JEM-ARM2000F instrument from JEOL, Japan. TGA graphs were obtained using a Discovery 650 SDT thermal analyzer (TA Instruments, USA) in the temperature range of 25–1000 °C. Mineralization of the dye was determined based on total organic carbon content measurements (TOC) using a total organic carbon analyzer, TOC-VCPN, Shimadzu, Japan, before and after the photocatalysis of the CV dye.
2.2. Preparation of CMFE
Aqueous extract of C. macrocarpa fruit (CMFE) was synthesized following the procedure reported earlier.16 The procedure involved washing, slicing, drying and grinding of natal plum. The powder obtained (10 g) was refluxed in DW (100 mL) at 90 °C for 3 h. The resulting liquid enriched with phytochemicals was filtered to discard the solid waste. Filtrate was evaporated in the oven (80 °C, 24 h), and powder (CMFE) was kept in a dried petri dish to synthesize NPs.
2.3. Green synthesis of NiO NPs
To synthesize CMFE@NiO NPs, separate aqueous solutions of Ni(NO3)2·6H2O (30 mM, 20 mL) and CFME (20 mg, 15 mL) were prepared in deionized water. Aqueous extract and salt solution were mixed at a constant stirring rate of 200 rpm and pH 9 for 30 min, followed by the addition of 10 mL of 0.1 M NaOH to adjust pH 9. Subsequently, the resulting mixture was stirred (200 rpm) for 30 min at 100 °C. The appearance of dark green precipitates indicated the synthesis of Ni(OH)2 powder. The synthesized powder was isolated from the mixture by centrifugation (8000 rpm, 30 min). The powder was rinsed three times with DW, dried in an oven (75 °C, 4 h), and subjected to calcination (350 °C, 2 h) in a muffle furnace. This thermal treatment was carried out to decompose the Ni(OH)2 to NiO NPs, and the temperature of 350 °C was selected due to the formation of small size NiO NPs at low temperatures in the range of 300–400 °C, as reported in the literature.17 The UV-vis spectrum of these CMFE@NiO NPs sonicated in distilled water showed the presence of a characteristic peak at 311 nm.
2.4. Photocatalytic degradation of CV
The photodegradation of CV was conducted on the surface of CMFE@NiO NPs under direct sunlight according to the described methodology.18 The solution of CV (10 ppm, 20 mL) was mixed with the specified quantity of CMFE@NiO NPs, and the resultant mixture was agitated in the dark for 20 min to establish adsorption–desorption equilibria on the surface of the CMFE@NiO NPs. Subsequently, the mixture was subjected to sunlight for 120 min, and the reduction in the solution's absorbance was recorded at 15-minute intervals. The mixture of the catalyst and dye solution was placed in a covered glass chamber and exposed directly to sunlight to avoid any exposure to humidity. Additionally, these experiments were carried out in the daytime (12:00–13:30 pm) on August 24, 2024 at 35 ± 2 °C. When performing each set of experiments, the same conditions were maintained. The progressive reduction in the characteristic absorbance of the solution (λmax = 599 nm) unequivocally signified the degradation of the CV dye. The percentage degradation of the solution was determined using eqn (1):19,20| |  | (1) |
where C0 and Cf denote the starting and final concentrations of the dye, respectively. The influence of various process parameters on degradation kinetics was examined. The factors encompass pH, catalyst dosage, initial concentration of CV, and temperature. The response surface approach, particularly the Box–Behnken design, was utilized to optimize these parameters.
2.5. Experimental design of RSM/BBD
For comparison of empirical models with experimental findings, RSM is a beneficial statistical and mathematical tool that provides access to the interactions of different reaction parameters on the degradation of dye.21,22 The Box–Behnken design (BBD) methodology was employed to establish the experimental protocols under defined reaction conditions. The influence of temperature, pH, catalyst dosage, and initial concentration of CV on the photodegradation process was examined. As shown in Table S1 (ESI†), these variables were analyzed at two levels: low (−1) and high (+1). To validate the BBD, 29 experimental runs for CV decomposition for four factors were conducted, and the outcomes were compared with the predicted values.
2.6. Total organic content (TOC) analysis
If azo dyes are not completely broken down, additional dangerous species might be produced that may further deteriorate water quality.22 The only indication for the color removal of the solution is not sufficient to achieve complete degradation. The breakdown of the diazenyl functional group of azo compounds causes the color to disappear, while mineralization is the whole conversion of compounds and intermediate species to carbon dioxide and water.23 Consequently, it is essential to estimate the TOC value at regular intervals to analyze the mineralization of CV. %Removal of TOC was calculated using eqn (2):24| |  | (2) |
where TOC0 and TOCt represent the initial concentration of organic content and the concentration of organic content after time ‘t’, respectively.
2.7. Reusability studies of catalysts
A reusability study was carried out over five consecutive cycles to evaluate the capability of CMFE@NiO NPs for the degradation of CV. Following each batch experiment, the CMFE@NiO NPs were regenerated by employing the method described in the literature.25 Upon the end of each cycle, the catalyst was extracted from the mixture via centrifugation (3000 rpm, 10 min). The catalyst was cleaned with DW after removing the upper liquid layer and subsequently activated by drying in an oven at (80 °C, 4 h). The CMFE@NiO NPs were effectively utilized for the subsequent cycle. After 5th cycle of use, the CMFE@NiO NPs were characterized by PXRD and FTIR analysis to access the physicochemical properties of NPs.
2.8. Disc diffusion assay
The bactericidal efficacy of CMFE and CMFE@NiO NPs was assessed utilizing the conventional disc diffusion method.26 Four bacterial colonies, specifically two Gram-negative strains (E. coli and P. multocida) and two Gram-positive strains (S. aureus and B. subtilis), were cultured in a nutritional agar solution (2.5 g/100 mL) for 24 h at 4 °C. The turbidity of the bacterial colonies was set to 108 CFU. Following autoclaving, sterilized paper discs containing 1 mL of CMFE (2 mg/5 mL), CMFE@NiO NPs (2 mg/5 mL) and rifampicin (2 mg/5 mL) were arranged on Petri dishes. After incubation of Petri dishes (24 h, 37 °C), the zone of inhibition for each sample was measured in millimeters. The zones of inhibition of the samples were compared with the rifampicin used as a positive control.
2.9. DPPH (2,2-diphenyl-1-picryl-hydrazyl-hydrate) assay
The antioxidant potential of CMFE@NiO NPs was assessed using a DPPH assay, which involved hydrogen donation or radical scavenging of DPPH radical.27 The DPPH radical was scavenged, and a pale-yellow solution appeared due to the stable DPPH molecule. In summary, a 0.1 mM solution of DPPH radical was prepared and stored in the dark for 2 h. The CMFE, NPs, and gallic acid solutions (1 mg mL−1) were prepared in methanol and diluted to prepare multiple aliquots in the range of 12.5–400 μg mL−1. 800 μL of each dilution was mixed with 1.2 mL of DPPH˙ solution in a test tube. After immediate mixing for 10 s, each test tube was placed in the dark at room temperature for 30 min. After 30 min, the absorbance of each solution was measured at 517 nm. The %DPPH radical scavenging (inhibition) and IC50 value were determined using eqn (3) and (4), respectively:| |  | (3) |
| |  | (4) |
where A0 and As represent the absorbance of the blank and sample solutions, respectively.
2.10. Statistical analysis
Each experiment was analyzed three times to assess its statistical significance using ANOVA. At a threshold of p < 0.05, statistical significance was acknowledged. The mean ± standard deviation was used to report all of the data.
3. Results and discussion
3.1. UV-vis and FTIR analyses
The UV-vis absorbance spectrum was recorded to identify the synthesis of NiO NPs and the energy bandgap (Eg) between the valence band (VB) and the conduction band (CB) by observing the characteristic peak and absorbance values. The sonicated sample of NPs (Fig. 1(a)) showed a characteristic peak of NiO NPs at 311 nm, attributed to surface plasmon resonance.28 Tauc plot (inset of Fig. 1(a)) between energy (eV) and (αhν)2 showed an Eg value of 3.18 eV. These band gap calculations are provided in ESI,† Section S1. The optical band gap of CMFE@NiO NPs reported in the current study is similar to the band gap reported in the literature. For example, the optical band gap of 2.88 eV was estimated for NiO NPs synthesized using polyvinylpyrrolidone (PVP) as a surfactant.29 In another study, the band gap energies of NiO NPs were found to be 3.44, 3.38, 3.25, and 2.86 eV at 300, 400, 500, and 600 °C, respectively.17 The optical band gaps of NiO NPs derived from four different organic precursors were also found to be 2.45, 2.82, 2.93, and 3.12 eV.30 This value of band gap also showed the sunlight/visible light responsiveness of NPs for charge transfer phenomenon in the lattice and generation of charge carriers in VB and CB.
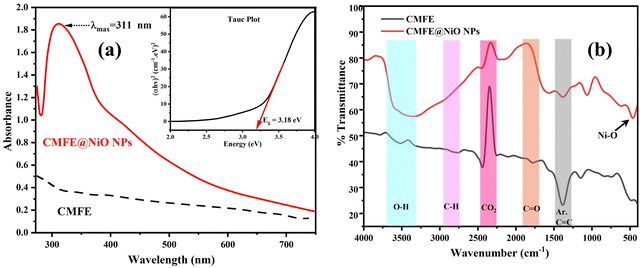 |
| | Fig. 1 (a) UV-vis spectra of CMFE and CMFE@NiO NPs and Tauc plot of CMFE@NiO (inset). (b) FTIR spectra of CMFE and CMFE@NiO NPs. | |
The FTIR spectra of CMFE and CMFE@NiO NPs were examined to determine the predominant functional groups present in the samples. Fig. 1(b) presents the comparative FTIR spectra of CMFE and CMFE@NiO NPs. The CMFE spectrum indicated the presence of many functional groups derived from the diverse bioactive compounds in the extract, including phenolics, alkaloids, and flavonoids. The principal absorbance peaks identified at around 1450 cm−1, 1700 cm−1, 2300 cm−1, 2900 cm−1, and 3250–3600 cm−1 were attributed to the aromatic rings (CC), carbonyl groups (CO), atmospheric CO2, alkyl groups (C–H), and hydroxyl groups (O–H) stretching's present in the CMFE samples, respectively.27 The attribution of peaks between 2300–2400 cm−1 is due to atmospheric CO2.31 Additionally, the CMFE@NiO NP spectra displayed these peaks, including a peak of about 510 cm−1 associated with the Ni–O bonds.17 Although finger print region in the FT-IR spectra is not much reliable, many peers have reported that metal–oxygen bonds are absorbed in the range of 400–700 cm−1.17,32 The detection of hydroxyl, carbonyl, and aromatic ring peaks in the CMFE@NiO NP spectrum indicated the effective capping of NiO NPs by bioactive species.
3.2. XRD, HR-TEM and EDX analyses
The PXRD spectrum of CMFE@NiO NPs is illustrated in Fig. 2(a) in the 2θ range of 20–80°. According to JCPDS file no. 04-0835, Bragg's reflections observed at 2θ values of 37.4°, 43.3°, 62.9°, 75.5° and 79.5° were assigned to crystal planes (111), (200), (220), (311) and (222), respectively. These strong Bragg's reflections correspond to diffraction lattice planes, confirming the face-centered cubic crystal structure of CMFE@NiO NPs with space group Fm![[3 with combining macron]](https://www.rsc.org/images/entities/char_0033_0304.gif) m. The Debye–Scherrer relation (eqn (5)), dislocation density (δ) formula (eqn (6)), micro strain formula (eqn (7)) and degree of crystallinity (eqn (8)) were used to compute the crystal parameters, which include crystallite size, dislocation density, micro strain and degree of crystallinity, respectively, as depicted in Table 1.
m. The Debye–Scherrer relation (eqn (5)), dislocation density (δ) formula (eqn (6)), micro strain formula (eqn (7)) and degree of crystallinity (eqn (8)) were used to compute the crystal parameters, which include crystallite size, dislocation density, micro strain and degree of crystallinity, respectively, as depicted in Table 1.| |  | (5) |
| |  | (6) |
| |  | (7) |
| |  | (8) |
where the average crystallite size, Scherer constant, X-ray wavelength, diffraction angle, and peak FWHM are represented by D, K, λ, θ, and β, respectively. Using non-linear fitting to the XRD pattern, FWHM values were calculated at 2θ values, and the average crystallite size was calculated to be 9.8 nm. All the relevant calculations are provided in Section S2 of the ESI.†
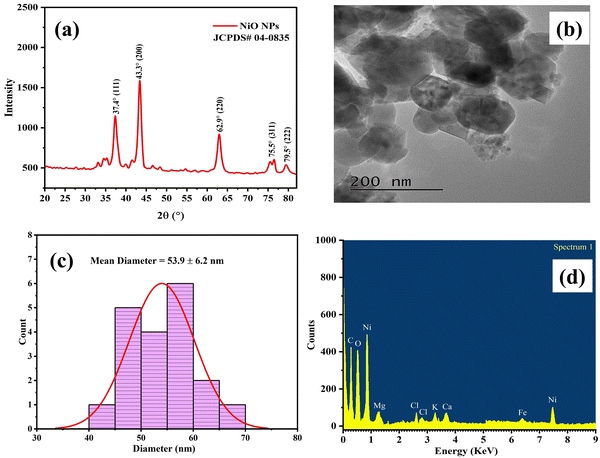 |
| | Fig. 2 (a) PXRD spectrum of CMFE@NiO NPs; (b) HR-TEM image of CMFE@NiO NPs; (c) histogram of the particle size of CMFE@NiO NPs and (d) EDX analysis of CMFE@NiO NPs. | |
Table 1 Crystal parameters of CMFE@NiO NPs
| Sample |
Average crystallite size ‘D’ (nm) |
Dislocation density δ × 10−3 (nm−2) |
Micro strain ε × 10−3 |
Degree of crystallinity (%) |
| CMFE@NiO NPs |
9.8 |
10.2 |
1.7 |
95.1 |
Analysis of the structural and elemental composition of the CMFE@NiO NPs was conducted using HR-TEM and EDX, respectively. An HR-TEM image of the CMFE@NiO NPs was obtained to examine the morphology and dimensions of the particles, as shown in Fig. 2(b). The TEM picture (Fig. 2(b)) indicated the presence of quasi spherical-shaped NPs. Analysis of the TEM image was conducted to determine the distribution of particle sizes and the average particle size, as depicted in the histogram in Fig. 2(b) and (c). The mean particle size of CMFE@NiO NPs was determined to be 53.9 ± 6.2 nm (Fig. 2(c)). Furthermore, the EDX spectra (Fig. 2(d)) of CMFE@NiO NPs exhibited prominent Lα and Kα peaks of Ni at 0.85 and 7.47 keV, respectively, and Lα lines of oxygen at 0.52 keV. In addition to these peaks, other peaks of different elements, including C, Zn, Al, Na, Cl and Si, were also observed due to the various bioactive compounds in the capping agent on the surface of CMFE@NiO NPs. These additional peaks are generally observed in the greenly synthesized NPs.14
3.3. Hydrodynamic diameter and stability of CMFE@NiO NPs
The greenly synthesized NPs have a cloud of water molecules attached to their surface in the aqueous media that provides them with colloidal stability and contributes to the total radius of NPs (hydrodynamic radius). To determine the hydrodynamic radius of the NPs, the DLS analysis was carried out. This test revealed a narrow distribution of particle sizes (80–98 nm) of the NPs, with an average diameter of 87.6 ± 5.1 nm (Fig. 3(a)). This result exhibited strong concordance with the HR-TEM findings.
 |
| | Fig. 3 (a) DLS data and (b) zeta potential analysis of CMFE@NiO NPs. | |
Based on the ZP analysis, the average ZP value by surface charge determination was found to be −28.9 ± 4.1 mV, as illustrated in Fig. 3(b). This negative value due to the capping of phytochemicals on the surface implies moderate colloidal stability of NPs in the liquid phase. Based on the ZP measurements, the suspension was reported to be electrostatically stable and resistant to agglomeration in aqueous media.
3.4. Thermogravimetric analysis of CMFE@NiO NPs
As shown in Fig. 4, the thermal stability of CMFE@NiO NPs was evaluated using TGA analysis in a temperature range of 25–1000 °C. Fig. S1 (ESI†) shows the DTG curves for the CMFE@NiO NPs. The DTG curves were plotted to validate the temperature assignments for each degradation step. The structure and disintegration process of CMFE@NiO NPs were found to be highly congruent with the TGA data when the material was heated. There were three separate stages of thermal degradation of CMFE@NiO NPs. Initially, a modest reduction in weight (about 8%) was observed within the temperature range of 301–400 K. This reduction was ascribed to the depletion of water molecules during dehydration and the elimination of moisture from the surface. In the second stage, a 6% reduction in weight was observed within the temperature range of 405–636 K. The observed decrease in weight was attributed to the breakdown of the organic components bound to the surface of the NPs. In the temperature range of 640–735 K, a weight reduction of 7% was observed as a consequence of the disintegration of Ni–O bonds on the surface and the subsequent pyrolysis of CMFE@NiO NPs. In general, the thermal data indicated that the sample exhibited excellent stability, with a little 21% weight loss, even when exposed to temperatures above 1200 K.
 |
| | Fig. 4 TGA curve of CMFE@NiO NPs. | |
3.5. Photodegradation of crystal violet (CV)
Previously, many photocatalysts have been reported to absorb high energy radiations, such as UV rays, for surface activation and charge separation, which results in their catalytic performance (Table S2, ESI†), but the high energy requirement is the main drawback of these catalysts.33,34 Therefore, the development of new nanocatalysts that can easily absorb inexpensive sunlight/visible radiations to perform catalytic applications is highly explored nowadays. Hence, owing to an Eg value of 3.18 eV, the CMFE@NiO NPs were explored for their catalytic applications to degrade hazardous dyes. Photodegradation of CV was carried out on the surface of CMFE@NiO in the presence of sunlight due to an appropriate bandgap (3.18 eV). This bandgap denotes the sunlight harvesting ability of CMFE@NiO for the generation of charge carriers (e−/h+ pairs) for redox reaction with dye molecules. The UV-vis spectra of the CV dye solution were recorded at λmax (599 nm) every 15 min for 120 min of sunlight exposure. The decrease in the absorbance showed a gradual decline in the concentration of dye (Fig. S2, ESI†).
3.6. RSM/BBD for optimization of CV degradation
The effect of the four independent variables and their interrelation on CV degradation was studied by applying the RSM/BBD model. The results of 29 runs of experiments suggested using the BBD model are depicted in Table 2 along with the predicted and actual results obtained. A high degree of agreement between adjusted R2 (0.9889) and predicted R2 (0.9762) with a difference of less than 0.2, insignificant lack of fit p-value (0.6696), sequential p-value (<0.0001) and a standard deviation of 2.22 suggested the quadratic model for CV degradation.21,35 For adequate fitting of the model, as far as the lack-of-fit p-value (0.6696) is concerned, the p-value for the lack-of-fit test must be more than 0.05 (p > 0.05). A lack of fit p-value greater than the significance level means that the model fits the data well. A fit summary of the model proposed by applying the software is shown in Table 3. The experimental and predicted findings displayed in Fig. S3 (ESI†) exhibited a high level of agreement.
Table 2 Four factor BBD model with experimental results and predicted values
| Run |
A: pH |
B: temperature (K) |
C: concentration of dye (ppm) |
D: catalyst dosage (mg) |
CV dye degradation (%) |
| Actual value |
Predicted value |
| 1 |
3 |
328 |
30 |
30 |
57 |
59.19 |
| 2 |
13 |
298 |
20 |
30 |
42 |
43.19 |
| 3 |
8 |
328 |
20 |
30 |
90.5 |
90.10 |
| 4 |
13 |
328 |
30 |
30 |
33 |
33.27 |
| 5 |
8 |
298 |
20 |
50 |
93 |
92.02 |
| 6 |
13 |
328 |
20 |
50 |
42 |
41.29 |
| 7 |
8 |
298 |
20 |
10 |
86 |
85.27 |
| 8 |
8 |
358 |
10 |
30 |
91 |
92.13 |
| 9 |
8 |
328 |
20 |
30 |
89.5 |
90.10 |
| 10 |
13 |
328 |
20 |
10 |
35 |
36.79 |
| 11 |
8 |
328 |
20 |
30 |
89 |
90.10 |
| 12 |
8 |
328 |
10 |
10 |
89 |
87.52 |
| 13 |
8 |
328 |
30 |
10 |
79 |
78.35 |
| 14 |
3 |
328 |
20 |
50 |
68.5 |
65.96 |
| 15 |
8 |
358 |
20 |
10 |
79 |
80.10 |
| 16 |
3 |
358 |
20 |
30 |
61 |
60.44 |
| 17 |
3 |
298 |
20 |
30 |
59 |
60.10 |
| 18 |
8 |
328 |
20 |
30 |
94 |
90.10 |
| 19 |
13 |
358 |
20 |
30 |
39 |
38.52 |
| 20 |
3 |
328 |
20 |
10 |
51 |
50.96 |
| 21 |
8 |
298 |
10 |
30 |
95 |
96.29 |
| 22 |
13 |
328 |
10 |
30 |
51 |
48.94 |
| 23 |
8 |
328 |
10 |
50 |
96 |
97.27 |
| 24 |
3 |
328 |
10 |
30 |
62 |
61.85 |
| 25 |
8 |
358 |
20 |
50 |
92 |
92.85 |
| 26 |
8 |
298 |
30 |
30 |
87 |
85.13 |
| 27 |
8 |
358 |
30 |
30 |
87 |
84.96 |
| 28 |
8 |
328 |
20 |
30 |
87.5 |
90.10 |
| 29 |
8 |
328 |
30 |
50 |
86 |
88.10 |
Table 3 Fit summary of the model by software for CV degradation
| Source |
Sequential p-value |
Lack of fit p-value |
Adjusted R2 |
Predicted R2 |
Remarks |
| Linear |
0.4600 |
0.0003 |
−0.0092 |
−0.2952 |
|
| 2FI |
0.9999 |
0.0001 |
−0.3345 |
−1.5738 |
|
|
Quadratic
|
<0.0001
|
0.6696
|
0.9889
|
0.9762
|
Suggested
|
| Cubic |
0.3981 |
0.8546 |
0.9904 |
0.9747 |
Aliased |
Table 4 displays the results of an analysis of variance (ANOVA) test conducted to determine the model's validity and relevance as suggested by the BBD. A significant model was indicated by a model F-value of 179.99.
Table 4 ANOVA of the quadratic polynomial model for CV degradation
| Source |
Sum of squares |
df |
Mean square |
F-Value |
p-Value |
Remarks |
| Model |
12![[thin space (1/6-em)]](https://www.rsc.org/images/entities/char_2009.gif) 398.87 398.87 |
14 |
885.63 |
179.99 |
<0.0001 |
Significant |
|
A-pH |
1131.02 |
1 |
1131.02 |
229.86 |
<0.0001 |
|
|
B-temperature |
14.08 |
1 |
14.08 |
2.86 |
0.1128 |
|
|
C-concentration of dye |
252.08 |
1 |
252.08 |
51.23 |
<0.0001 |
|
|
D-catalyst dosage |
285.19 |
1 |
285.19 |
57.96 |
<0.0001 |
|
|
AB
|
6.25 |
1 |
6.25 |
1.27 |
0.2787 |
|
|
AC
|
42.25 |
1 |
42.25 |
8.59 |
0.0110 |
|
|
AD
|
27.56 |
1 |
27.56 |
5.60 |
0.0329 |
|
|
BC
|
4.00 |
1 |
4.00 |
0.8129 |
0.3825 |
|
|
BD
|
9.00 |
1 |
9.00 |
1.83 |
0.1977 |
|
|
CD
|
0.0000 |
1 |
0.0000 |
0.0000 |
1.0000 |
|
|
A
2
|
9954.69 |
1 |
9954.69 |
2023.09 |
<0.0001 |
|
|
B
2
|
0.8524 |
1 |
0.8524 |
0.1732 |
0.6836 |
|
|
C
2
|
0.0821 |
1 |
0.0821 |
0.0167 |
0.8991 |
|
|
D
2
|
30.69 |
1 |
30.69 |
6.24 |
0.0256 |
|
| Residual |
68.89 |
14 |
4.92 |
|
|
|
| Lack of fit |
45.19 |
10 |
4.52 |
0.7627 |
0.6696 |
Not significant |
| Pure error |
23.70 |
4 |
5.93 |
|
|
|
| Total |
12467.76 |
28 |
|
|
|
|
Model terms were considered statistically significant when their p-values were less than 0.05. In this case, it was found that A2, D2, AC, AD, C, and D were all statistically significant. The F-value of 0.76 for the lack of fit showed that the lack of fit was insignificant compared to the pure error. For a given value for each parameter, the equation stated in terms of the coded factors can be used to anticipate the response. The ultimate equation (eqn (9)) expressing the coded factors for the deterioration of CV becomes
| | | CV degradation (%) = 90.10 − 9.71A − 1.08B − 4.58C + 4.88D − 1.25AB − 3.25AC − 2.62AD + BC + 1.5BD − 39.17A2 − 0.3625B2 − 0.1125C2 − 2.17D2 | (9) |
where the intercept is 90.10; the coefficients of
A,
B, and
C represent the slopes or regression coefficients for the linear effects;
A2,
B2,
C2, and
D2 represent the quadratic effects; and
AB,
AC,
AD,
BC,
BD, and
CD represent the regression coefficients for the 2-factor interaction effects. This equation enables predictions of the response at specified levels of each parameter. Moreover, Fig. S3 (ESI
†) provides evidence of a substantial degree of agreement between the experimental and predicted results.
Furthermore, the normal plot of residuals (Fig. 5(a)) and residual vs. run plots (Fig. 5(b)) were analyzed to check the suitability of the model. The linearity of the normal plot of residuals and the random rise and fall of residuals of each run around the central line indicate the appropriate fit of the model.
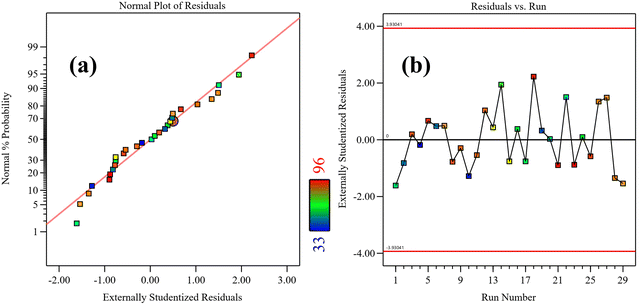 |
| | Fig. 5 (a) Normal plot of residuals and (b) residual vs. run distribution. | |
Two-dimensional contour plots and three-dimensional response surface graphs are used to assess the concurrent impact of two variables on the efficiency of dye degradation within specified ranges while keeping the other variables constant. Fig. 6 displays 2-D contour plots and 3-D response surface visualizations for different parameters.
 |
| | Fig. 6 2-D contour plots and 3-D response surface graphs of interaction of (a) pH and temperature (K), (b) pH and initial concentration of dye (ppm), (c) pH and catalyst dosage (mg), (d) temperature (K) and initial dye concentration (ppm), (e) temperature (K) and catalyst dosage (mg), and (f) concentration of dye (ppm) and catalyst dosage (mg). | |
Based on Fig. 6(a), it is evident that the degradation efficiency increases as the temperature increases at pH 8. An optimal degradation rate of 96% was achieved at pH 8 and 328 K using a constant catalyst dose of 50 mg and an initial dye concentration of 10 ppm. Nevertheless, the anticipated deterioration could reach 99% at a temperature of 358 K. By observing the F-values of independent parameters (Table 4), the pH plays a main role in the degradation phenomenon, followed by the catalyst dosage, initial dye concentration and temperature. Moreover, pH change affects the surface charge of nanomaterials, ionic nature of dyes, adsorption capacity and band edge potentials. A low pH may result in the agglomeration of NPs if a charge is neutralized and a decrease in the adsorption of cationic dyes on NPs with a change in surface charge. After agglomeration, the surface area of NPs decreases and photocatalytic potential is alleviated. At pH above 9, the ionization of CMFE@NiO NPs starts due to hydrolysis, and Ni(OH)2 becomes the predominant form, which again results in a decrease in NP concentration and reduced photocatalytic activity. Owing to the cationic nature of CV dye, the efficient adsorption of dye occurs at the surface of NPs at pH near 7, resulting in the best degradation efficiency. The catalytic efficiency is also reduced at a low pH due to the combination of H+ ions with −OH and ˙OH radicals. Hence, controlling pH is the main determining factor for the degradation of specific pollutants on the surface of nanomaterials.
After pH, catalyst dosage plays a major role in the degradation process, as evidenced by the F-value (Table 4). The degradation efficiency increases with an increase in the active sites of NPs by increasing the catalyst dosage. However, at a very high catalyst dosage, the efficiency may decrease due to the agglomeration of particles by increased collisions and less penetration of light in suspension due to high turbidity. In the given range of parameters, it can be observed that the maximum degradation occurred at pH 8 and the highest catalyst dosage (∼50 mg), as depicted in Fig. 6(c).
After catalyst dosage, the initial dye concentration affects the degradation efficiency and maximum %degradation can be observed at the lowest dye concentration at pH 8 and maximum catalyst dosage (50 mg), as shown in Fig. 6(b) and (f). As the concentration of dye increases, the competition between dye molecules increases to occupy the active sites of the catalyst. Owing to limited active sites, the %degradation is reduced at a given period of 120 minutes. Moreover, at very high concentrations of dye, the light penetration may reduce in the suspension, resulting in decreased %degradation.
Temperature played the minimum role in the %degradation of dye in the given range, as shown in Fig. 6(d) and (e). By increasing the temperature, the K.E. of dye molecules increases and the rate of degradation increases but up to a small extent, as evident from the F-value in the ANOVA analysis (Table 4).
The perturbation plot depicts the combined effect of all parameters/reaction conditions on the response at a particular point in the design space, as shown in Fig. 7. From the curvatures of factors, it can be clearly observed that the pH (A) and catalyst dose (D) are most influential in affecting the degradation phenomenon. The %degradation significantly varied as the pH and catalyst dose changed due to the change in surface charge on dye molecules and catalyst surface caused by a change in pH, variance of surface area and the number of active sites due to the change in the catalyst dosage. Moreover, under the optimized conditions of pH 8, temperature 358 K, initial dye concentration 10 ppm and catalyst dose of 50 mg, maximum degradation of dye was observed experimentally.
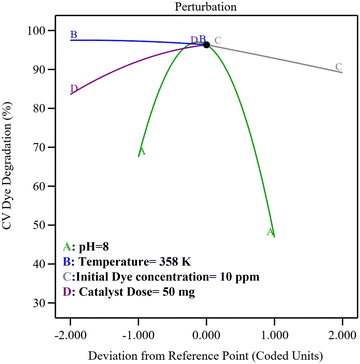 |
| | Fig. 7 Perturbation plot of variable effects on CV dye degradation (%). | |
To evaluate the degradation kinetics, dye degradation (%) was calculated using eqn (5) every 15 min for 120 min under optimized conditions of pH 8, 50 mg catalyst dosage, and 10 ppm initial dye concentration at various temperatures, as shown in Fig. 8(a). The kinetics of degradation were studied by pseudo-1st order kinetics using eqn (10). The degradation data were well fitted into eqn (10) with R2 values above 0.990 for CV degradation, as shown in Fig. 8(b). The slope of this plot gives the k values of 2.07 × 10⁻² min−1, 2.29 × 10⁻² min−1, 2.78 × 10⁻² min−1, 2.94 × 10⁻² min−1 and 3.81 × 10⁻² min−1 at 298 K, 343 K, 328 K, 343 K, and 358 K, respectively. It was observed that the rate of reaction increases with the increase in temperature, which illustrates the endothermic nature of the degradation reaction. These results demonstrate the promising potential of the synthesized NiO NPs as photocatalysts. This result was further supported by a comparison with the previously reported literature, as illustrated in Table S2 of the ESI.†
| |  | (10) |
 |
| | Fig. 8 (a) %Degradation of dyes vs. time. (b) Kinetics graph of degradation of CV dye. | |
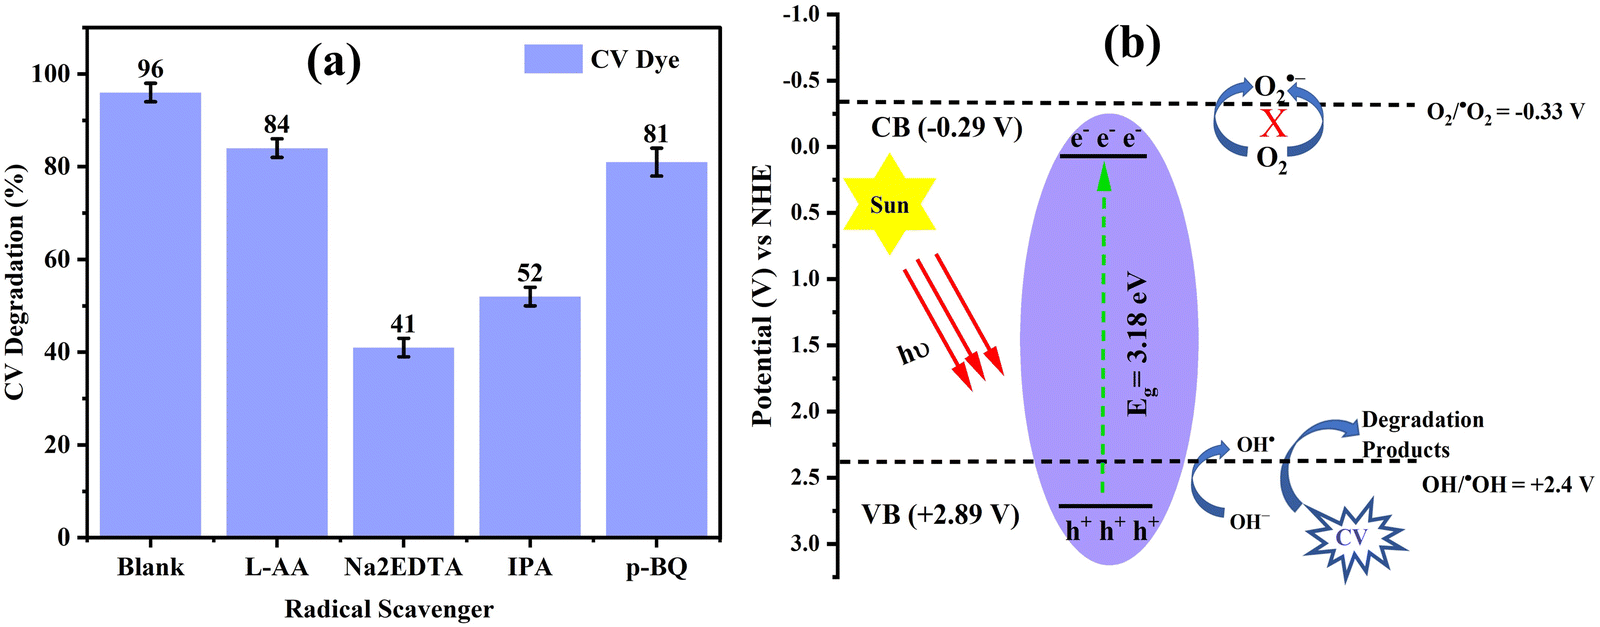
3.7. Effect of radical scavengers and proposed mechanism
Organic pollutants are rapidly degraded by ROS, including hydroxyl radicals, superoxide anion radicals, hydrogen peroxide, and holes. Batchwise radical scavenging tests assessed the production and major species involved using four scavengers: p-benzoquinone (p-BQ) for H2O2 scavenging, isopropyl alcohol (IPA) for OH˙ scavenging, disodium ethylenediamine tetraacetate (Na2EDTA) for h+ scavenging, and L-ascorbic acid (L-AA) for O2−˙ scavenging following the reported method.36 In every run of the experiment, 50 mg of catalyst was added to a 10-ppm dye solution (20 mL), and 10 mL of a 0.2 mM solution of one radical scavenger was dissolved in it. The previously discussed method was used to monitor each dye's rate of degradation.
Fig. 9(a) shows the results of radical scavenging studies, which show that the presence of all radical scavengers reduces the dye degradation percentage. This indicates that all reactive species were formed in the solution when exposed to sunlight. The degradation process was most suppressed by Na2EDTA addition, indicating that h+ had an active involvement in the degradation phenomena because by scavenging h+, the %degradation significantly decreased. Further suppression of the degradation process was observed in the presence of IPA, which showed the active role of OH˙ after h+. Relatively low suppression of the degradation of CV in the presence of p-BQ and L-AA showed the least involvement of H2O2 and O2−˙ in the degradation process.
 |
| | Fig. 9 (a) Effect of radical scavengers on the degradation of CV. (b) CV photodegradation mechanism of CMFE@NiO NPs, showing the position of VB and CB. | |
To correlate the experimental results with the band edge positions of VB and CB, the potentials of energy levels were estimated by Butler–Ginley equations (eqn (11) and (12)):37
where
X, and
EC and
Eg represent Mulliken's electronegativity and the energy of free electrons (4.5 eV).
ECB and
EVB were found to be −0.29 V and +2.89 V, respectively, as shown in
Fig. 9(b). These values of
ECB and
EVB displayed the easy generation of reactive destructive species (h
+ and OH˙) at the interface of the catalyst surface and aqueous media due to feasible oxidation potentials for the generation of OH˙, as shown in
Fig. 9(b). However, O
2−˙ ions were not effectively produced due to the lower potential of CB to reduce oxygen molecules.
By analyzing the effect of these radical scavengers in the degradation process, the degradation mechanism of azo dyes was proposed, as shown in eqn (13)–(17). It was postulated that the valence electrons of the catalyst are excited to the conduction band in the presence of sunlight radiation, resulting in the production of e− and h+ pairs. The e− are absorbed by the dissolved oxygen, and the h+ reacts with water to produce OH˙ radicals. Several secondary radicals are produced in the mixture by secondary reactions and actively participate in the degradation phenomenon.
| | | NiO + hν(UV-Vis) → NiO(e−(CB) + h+(VB)) | (13) |
| | | H2O(ads) + h+(VB) → OH˙(ads) + H+(ads) | (14) |
| | | CV + 2OH˙ → intermediates → CO2 + H2O | (15) |
| | | CV + h+(VB) → oxidation products | (16) |
| | | CV + e−(CB) → reduction products | (17) |
3.8. TOC analysis
Estimation of total organic carbon content by TOC analysis is an important test to evaluate waste water quality at an industrial scale. This test is often used in advanced oxidation processes, such as photocatalysis, to determine the extent of the complete mineralization of pollutants at the catalyst surface. Only the fading of the color of the dye solution cannot justify the complete conversion of dye molecules to CO2 and H2O. The disappearance of color may be due to the breakdown of the chromophore group or the azo bond, which might have resulted in intermediate products. Therefore, TOC analysis is an important parameter for estimating the complete degradation of pollutants in water purification.38 The process of dye mineralization was relatively sluggish in comparison to the disposal of color in the solution, as demonstrated by the calculation of TOC values at regular intervals (Fig. 10(a)). Measuring the TOC removal values after 4 h of sunshine exposure revealed that 79% of the CV dye was mineralized. Initially, the %removal of carbon content was slower due to the formation of reaction intermediates, but it gradually increased upon the complete degradation of organic carbon to CO2. The continuous decrease in TOC is also depicted in the inset of Fig. 10(a), which reaches 21% after 4 h. The gradual decomposition of stable nitrogen-containing species and many intermediates generated by photodegradation often cause mineralization to proceed at a slow rate.
 |
| | Fig. 10 (a) %Mineralization of CV dye after regular intervals of photodegradation. Inset is the decrease in TOC (%) over time. (b) Reusability results of CMFE@NiO NPs for the degradation of CV. | |
3.9. Reusability studies of the photocatalyst
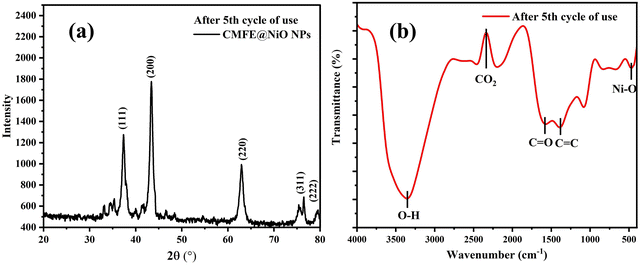
Using the previously described method,25 the reusable nature of the photocatalyst was assessed for the degradation of CV dye for five consecutive cycles. In summary, the catalyst, i.e., CMFE@NiO NPs, was recovered by centrifuging the mixture for 30 min at 3000 rpm. The solid catalyst was reused after rinsing three times with distilled water and drying for 4 h at 80 °C. The regeneration study's outcomes (Fig. 10(b)) demonstrated the catalyst's stability and capability for reuse with a minimal amount of activity alteration. After multiple usages, a mere 6% decrease in activity proved the catalyst's effectiveness for repeated usage. After appropriate activation, it seems that the described catalyst can be utilized several times for wastewater treatment. To examine the physical characteristics of regenerated CMFE@NiO NPs, the PXRD spectrum of the CMFE@NiO NPs was recorded in the 5th cycle. The PXRD spectrum indicated that the CMFE@NiO NPs remain stable and no significant change was observed. The PXRD spectrum of the used CMFE@NiO NP sample after the 5th cycle is presented in Fig. 11(a). All the characteristic peaks of NiO NPs were observed in the PXRD spectrum with negligible shifting of the peaks, which demonstrated the high stability of NiO NPs after several uses. Similar results have been reported by some peers.39 Similarly, the FTIR spectrum of CMFE@NiO NPs was also recorded after the 5th cycle. After the 5th cycle of regeneration (Fig. 11(b)), the FTIR spectrum of NPs indicated all the functional group peaks with a slight change in the peak positions. These results demonstrate the reusable nature of NiO NPs.
 |
| | Fig. 11 (a) PXRD spectrum of CMFE@NiO NPs after the 5th cycle. (b) FTIR spectrum of CMFE@NiO NPs after the 5th cycle. | |
3.10. Biological activities of CMFE@NiO NPs
Pathogenic bacterial colonies in contaminated water bodies are the main cause of many water-borne diseases in animals and humans. Many microbes present in the discharges of hospitals, medical labs, and domestic and industrial wastes are directly mixed with the fresh water reservoirs prior to suitable disinfection in under developing countries. These bacteria may cause outbreaks of diseases such as diarrhea in Italy.40 Some bacterial pathogens, their sources and possible infections are depicted in Table 5.
Table 5 Brief description of selective disease-causing pathogens
| Pathogen |
Strain |
Infections/diseases caused by pathogen |
Sources of pathogens in water bodies |
Ref. |
|
E. coli
|
Gram-negative |
Enteritis, urinary tract infection (UTIs), septicemia and other clinical infections, such as neonatal meningitis, diarrhea |
Hospitals, domestic waste, food industry waste and fecal pollution |
41 and 42
|
|
P. multocida
|
Gram-negative |
Respiratory infections, UTIs, skin infections, sepsis, soft tissue infections |
Landfills, domestic waste, hospitals and medical labs |
43 and 44
|
|
S. aureus
|
Gram-positive |
Boils and abscesses, cellulitis, osteomyelitis, food poisoning, sepsis |
Contaminated recreational waters and runoff from agricultural |
45 and 46
|
|
B. subtilis
|
Gram-positive |
Sepsis, bacteremia, skin and soft tissue infections |
Hospitals and medical labs |
47
|
Among several disinfection methods, the production of ROS in water discharges by sunlight-activated nanocatalyst can be a viable approach. In this regard, many greenly synthesized nanomaterials are being evaluated for their antimicrobial potential to mitigate water pollution. Therefore, the antibacterial effectiveness of CMFE and CMFE@NiO NPs was evaluated against two Gram-positive strains (S. aureus and B. subtilis) and two Gram-negative strains (E. coli and P. multocida) using the disc diffusion method. As previously noted, CMFE is an effective bactericidal agent. An antibacterial assessment of the samples was conducted to test the synergistic impact of NPs combined with the capping of bioactive compounds. Efficiently encapsulating NPs with phytochemical species significantly boosts their antibacterial effectiveness via synergistic effects.13Fig. 12(a) provides a comparison of the antibacterial activity of CMFE and CMFE@NiO NPs.
 |
| | Fig. 12 (a) Inhibition zones obtained for different antibacterial strains by CMFE, CMFE@NiO NPs and rifampicin (positive control). (b) Antioxidant activity of CMFE, CMFE@NiO NPs and gallic acid (standard). | |
The results of the zone of inhibitions showed that compared to CMFE, the CMFE@NiO NPs were more effective and comparable to the broad spectrum standard drug, rifampicin (Fig. 12(a)). CMFE@NiO NPs showed good inhibition of all bacterial strains with inhibition diameters of 15 ± 1.5 mm, 14 ± 1.2 mm, 22 ± 2 mm and 24 ± 2.2 mm for S. aureus, B. subtilis, E. coli and P. multocida, respectively. Rifampicin showed inhibition diameters of 25 ± 1.2 mm, 26 ± 1.5 mm, 23 ± 1.5 mm and 24 ± 1.1 mm for E. coli, P. multocida, S. aureus and B. subtilis, respectively. The exact mechanism of action of NPs to hinder the growth of bacteria is still unknown. However, it has been previously demonstrated that ROS plays a major role by applying oxidative stress to bacterial membranes, resulting in the breakdown of membrane barriers and cell death.48 Moreover, the generation of ROS within the cell, interaction of Ni2+ ions with the membrane, and interaction of NPs with genetic material and growth protein inside the cell are also considered possible reasons for cell death if NPs gain access to the inside of the cell by crossing the membrane barriers. It is interesting to note that CMFE@NiO NPs caused greater deterioration of Gram-negative strains of bacteria. The remarkable activity of the CMFE@NiO NPs against Gram-negative bacteria was ascribed to the variations in the cell membranes of the bacterial strains. Gram-negative bacteria have very thin cell walls, making it easier for tiny particles to pass through and prevent the cell from normal functioning. Upon entering the cell, NiO NPs can easily interact with growth proteins, enzymes and DNA, ultimately resulting in cell death. There was a greater suppression of Gram-negative bacterial strains as a result of the enhanced entry of CMFE@NiO NPs within the cells and the combined action of NPs and capping agents.
The antioxidant activity of the samples and gallic acid as a standard was assessed by applying the DPPH radical scavenging assay. GA was used as a standard because it can easily scavenge and reduce the DPPH radical. The action of GA is associated with the existence of three hydroxyl groups that are known to have strong antioxidant properties. Furthermore, the detection of –OH peaks in the FTIR spectra of CMFE and CMFE@NiO NPs has attracted attention to investigate their antioxidant capabilities.
The DPPH assay results showed a dose-dependent increase in the DPPH radical scavenging potential of CMFE, CMFE@NiO NPs and gallic acid, as shown in Fig. 12(b). The NPs showed considerable antioxidant activity compared to the standard at high concentrations (400 μg mL−1). This may be due to the capping of phytochemicals on the surface of the NiO NPs. The IC50 values have also shown a lower value of CMFE@NiO NPs (32.9 ± 2.4 μg mL−1) compared to the CMFE (39.3 ± 2.1 μg mL−1), which means the high activity of CMFE@NiO NPs than CMFE. Moreover, the CMFE@NiO NPs have shown a comparable IC50 to the gallic acid (22.3 ± 1.2 μg mL−1). As shown in Table 6, the comparison of CMFE@NiO NPs shows the highly efficient nature of these engineered biogenic NPs as an antioxidant agent, which has attracted further attention owing to their potential use in commercial products, such as creams and ointments.
Table 6 Comparison of antioxidant activity of CMFE@NiO NPs with previously reported green synthesized NiO NPs
| NPs |
Extract |
Assay |
IC50 value (μg mL−1) |
Ref. |
| Ag |
Memecylon umbellatum
|
DPPH |
53.46 |
49
|
| Ag |
Morus alba
|
DPPH |
97.27 |
50
|
| ABTS˙+ |
25.92 |
| Au |
Lotus leguminosae
|
DPPH |
30.54 |
51
|
| Au |
Plumbago zeylanica
|
DPPH |
68.53 |
52
|
| Cu |
Falcaria vulgaris
|
DPPH |
190 |
53
|
| CuO |
Cucurbita sp. |
DPPH |
40.81 |
54
|
| ZnO |
Knoxia sumatrensis
|
DPPH |
95.80 |
55
|
| ABTS˙+ |
92.29 |
| NiO |
Ziziphus spina-christi L. |
H2O2 |
45.7 |
56
|
| NiO |
Raphanus sativus
|
ABTS˙+ |
258 |
57
|
| NiO |
C. macrocarpa
|
DPPH |
32.9 ± 2.4 |
Current work |
4. Conclusion
Herein, green synthesis of CMFE@NiO NPs was reported using an aqueous extract of C. macrocarpa fruit. The UV-vis spectrum showed the SPR peak of the NiO NPs at 311 nm and a sunlight responsive bandgap of 3.18 eV calculated by Tauc plot. The presence of several functional group's peaks on the surface of the NPs confirmed the successful capping of bioactives on the surface of NPs. CMFE@NiO NPs with a crystallite size of 9.8 nm showed 99% degradation of CV under sunlight with a rate constant value of 3.81 × 10⁻² min−1. The reaction conditions were optimized by applying the RSM/BBD model, which showed that maximum degradation was possible at pH 7 and a catalyst dose of 50 mg at 358 K in a 10 ppm dye solution. Radical scavenging experiments showed that holes, followed by OH˙, were the main ROS involved in the degradation of CV. TOC analysis showed 79% mineralization of CV after 4 h exposure to sunlight. The antibacterial activity results showed that the CMFE@NiO NPs were more active against Gram-negative bacteria by inhibiting the growth of E. coli (22 ± 2 mm) and P. multocida (24 ± 2.2 mm) than the Gram-positive bacteria S. aureus (15 ± 1.5 mm) and B. subtilis (14 ± 1.2 mm), which might be due to the different cell wall structures of both strains. Antioxidant activity results showed a better reduction potential of CMFE@NiO NPs (IC50 = 32.9 ± 2.4 μg mL−1) than extract (IC50 = 39.3 ± 2.1 μg mL−1). These experimental results demonstrated the commercial importance of these sunlight responsive greenly synthesized CMFE@NiO NPs for waste water purification of industrial effluents.
Author contributions
A. B. Siddique: methodology, investigation, writing – original draft, writing – review & editing. M. A. Shaheen: conceptualization, supervision, project administration, data curation. A. Abbas: conceptualization, writing – review & editing. Y. Zaman: project administration, resources. Shakra Shafeeq, Muhammad Zahid Ishaque & Muhammad Aslam: investigation & writing – review & editing. All authors reviewed and approved the manuscript.
Data availability
All evaluated data is available in the manuscript. Additional information/data can be provided upon reasonable request.
Conflicts of interest
The authors have no known financial or non-financial interests to disclose.
Acknowledgements
The authors declare that no funds, grants, or other support were received during the preparation of this manuscript.
References
-
S. H. Hashemi and M. Kaykhaii, Emerging freshwater pollutants, Elsevier, 2022, pp. 267–287 Search PubMed.
-
P. Shandilya, P. Raizada and P. Singh, Water Pollution and Remediation: Photocatalysis, 2021, pp. 119–146 Search PubMed.
- W. Ahmad, S. C. Bhatt, M. Verma, V. Kumar and H. Kim, Environ. Nanotechnol., Monit. Manage., 2022, 18, 100674 CAS.
- M. W. Alam, Curr. Nanosci., 2021, 17, 893–903 CrossRef CAS.
- Y. Gong, S. Zhang, H. Gao, Z. Ma, S. Hu and Z. A. Tan, Sustainable Energy Fuels, 2020, 4, 4415–4458 RSC.
- A. Singh, V. Goyal, J. Singh, H. Kaur, S. Kumar, K. M. Batoo, J. Gaur, M. Pal, M. Rawat and S. Hussain, J. Cleaner Prod., 2022, 343, 131026 CrossRef CAS.
- K. Kannan, D. Radhika, M. P. Nikolova, K. K. Sadasivuni, H. Mahdizadeh and U. Verma, Inorg. Chem. Commun., 2020, 113, 107755 CrossRef CAS.
- H. E. Khalil, Y. M. Aljeshi and F. A. Saleh, J. Pharm. Sci. Res., 2015, 7, 497 CAS.
- F. Seke, V. E. Manhivi, T. Shoko, R. M. Slabbert, Y. Sultanbawa and D. Sivakumar, Foods, 2021, 10, 1420 CrossRef CAS PubMed.
- F. Souilem, M. I. Dias, L. Barros, R. C. Calhelha, M. J. Alves, F. Harzallah-Skhiri and I. C. Ferreira, Molecules, 2019, 24, 1696 CrossRef CAS.
- N. M. Mahmoodi, S. Keshavarzi and M. Ghezelbash, J. Environ. Chem. Eng., 2017, 5, 3684–3689 CrossRef CAS.
- D. Solomon, Z. Kiflie and S. Van Hulle, Int. J. Ind. Chem., 2020, 11, 43–53 CrossRef CAS.
- N. Al-Zaqri, K. Umamakeshvari, V. Mohana, A. Muthuvel and A. Boshaala, J. Mater. Sci.: Mater. Electron., 2022, 33, 11864–11880 CrossRef CAS.
- B. Ahmad, M. Khan, M. Naeem, A. Alhodaib, M. Fatima, M. Amami, E. A. Al-Abbad, A. Kausar, N. Alwadai and A. Nazir, Mater. Chem. Phys., 2022, 288, 126363 CrossRef CAS.
- T. Riaz, A. Munnwar, T. Shahzadi, M. Zaib, S. Shahid, M. Javed, S. Iqbal, K. Rizwan, M. Waqas and B. Khalid, Inorg. Chem. Commun., 2022, 142, 109656 CrossRef CAS.
- A. B. Siddique, M. A. Shaheen, A. Abbas, Y. Zaman, A. Ali, M. Naeem-ul-Hassan and J. Iqbal, J. Environ. Chem. Eng., 2024, 12, 112725 CrossRef CAS.
- S.-J. Hong, H.-J. Mun, B.-J. Kim and Y.-S. Kim, Micromachines, 2021, 12, 1168 CrossRef.
- A. B. Siddique, D. Amr, A. Abbas, L. Zohra, M. I. Irfan, A. Alhoshani, S. Ashraf and H. M. Amin, Int. J. Biol. Macromol., 2024, 256, 128009 CrossRef CAS PubMed.
- A. Ejaz, Z. Mamtaz, I. Yasmin, M. Shaban, A. B. Siddique, M. I. Irfan, A. Ali, S. Muhammad, M. Y. Sameeh and A. Abbas, J. Mol. Liq., 2024, 393, 123622 CrossRef CAS.
- Y. Zaman, M. Z. Ishaque, K. Waris, M. Shahzad, A. B. Siddique, M. I. Arshad, H. Zaman, H. M. Ali, F. Kanwal and M. Aslam, Arabian J. Chem., 2023, 16, 105230 CrossRef CAS.
- G. K. Weldegebrieal, H. H. Dube and A. K. Sibhatu, Int. J. Environ. Anal. Chem., 2023, 103, 6146–6168 CrossRef CAS.
- I. K. Konstantinou and T. A. Albanis, Appl. Catal., B, 2004, 49, 1–14 CrossRef CAS.
- W. W. Anku, S. O.-B. Oppong, S. K. Shukla and P. P. Govender, Acta Chim. Slov., 2016, 63, 380–391 CrossRef CAS PubMed.
- C. Lara-Pérez, E. Leyva, B. Zermeño, I. Osorio, C. Montalvo and E. Moctezuma, Environ. Earth Sci., 2020, 79, 277 CrossRef.
- Y. Zaman, M. Z. Ishaque, Y. Yousaf, M. Shahzad, A. B. Siddique, M. I. Arshad, M. Sajid, N. Ali and G. Nabi, Environ. Sci. Pollut. Res., 2023, 30, 95860–95874 CrossRef CAS PubMed.
- M. Z. Ishaque, Y. Zaman, M. Shahzad, A. B. Siddique, S. Shahid, M. Akram, H. Kanwal, M. T. Akhtar and S. Hussain, Water, Air, Soil Pollut., 2023, 234, 252 CrossRef CAS.
- M. S. Ahmad, A. B. Siddique, M. Khalid, A. Ali, M. A. Shaheen, M. N. Tahir, M. Imran, A. Irfan, M. U. Khan and M. W. Paixão, RSC Adv., 2023, 13, 9222–9230 RSC.
- F. Ascencio, A. Bobadilla and R. Escudero, Appl. Phys. A: Mater. Sci. Process., 2019, 125, 1–7 CrossRef CAS.
- P. K. Sharma, M. K. Singh, G. D. Sharma and A. Agrawal, Mater. Today: Proc., 2021, 43, 3061–3065 CAS.
- N. M. Hosny, Polyhedron, 2011, 30, 470–476 CrossRef CAS.
- M. Akram, A. H. Junaid, M. Z. Ishaque, Y. Zaman, M. Shahzad, A. B. Siddique, H. Kanwal, M. A. ur Rehman, M. I. Arshad and D. Ali, Phys. Scr., 2024, 99, 045938 CrossRef CAS.
- Y.-L. T. Ngo and S. H. Hur, Mater. Res. Bull., 2016, 84, 168–176 CrossRef CAS.
- M. W. Alam, Appl. Organomet. Chem., 2024, e7899 CrossRef.
- M. W. Alam, Opt. Mater., 2024, 152, 115401 CrossRef CAS.
-
L. A. Sarabia and M. C. Ortiz, Response surface methodology, in Comprehensive Chemometrics: Chemical and Biochemical Data Analysis, ed. S. D. Brown, R. Tauler and B. Walczak, Elsevier B.V, The Netherlands, 2009, vol. 1, pp. 345–390 Search PubMed.
- D. T. C. Nguyen, H. T. Le, T. T. Nguyen, T. T. T. Nguyen, L. G. Bach, T. D. Nguyen and T. Van Tran, J. Hazard. Mater., 2021, 420, 126586 CrossRef CAS PubMed.
- M. A. Ashraf, C. Li, D. Zhang, L. Zhao and A. Fakhri, Int. J. Biol. Macromol., 2021, 169, 436–442 CrossRef CAS.
- M. Kus, S. Ribbens, V. Meynen and P. Cool, Catalysts, 2013, 3, 74–87 CrossRef CAS.
- K. Hamidian, A. H. Rigi, A. Najafidoust, M. Sarani and A. Miri, Bioprocess Biosyst. Eng., 2021, 44, 2667–2678 CrossRef CAS PubMed.
- M. Escher, G. Scavia, S. Morabito, R. Tozzoli, A. Maugliani, S. Cantoni, S. Fracchia, A. Bettati, R. Casa and G. Gesu, Epidemiol. Infect., 2014, 142, 2559–2566 CrossRef CAS PubMed.
- N. Allocati, M. Masulli, M. F. Alexeyev and C. Di Ilio, Int. J. Environ. Res. Public Health, 2013, 10, 6235–6254 CrossRef.
- S. T. Odonkor and J. K. Ampofo, Microbiol. Res., 2013, 4, e2 Search PubMed.
- J. K. Miflin, X. Chen and P. J. Blackall, Avian Pathol., 2000, 29, 271–287 CrossRef.
- J. Stec, U. Kosikowska, M. Mendrycka, D. Stępień-Pyśniak, P. Niedźwiedzka-Rystwej, D. Bębnowska, R. Hrynkiewicz, J. Ziętara-Wysocka and E. Grywalska, Int. J. Environ. Res. Public Health, 2022, 19, 7308 CrossRef CAS PubMed.
- L. R. Plano, A. C. Garza, T. Shibata, S. M. Elmir, J. Kish, C. D. Sinigalliano, M. L. Gidley, G. Miller, K. Withum and L. E. Fleming, BMC Microbiol., 2011, 11, 1–10 CrossRef.
- A. O. Oladipo, O. G. Oladipo and C. C. Bezuidenhout, J. Water Health, 2019, 17, 930–943 CrossRef PubMed.
- U. Anand, B. Reddy, V. K. Singh, A. K. Singh, K. K. Kesari, P. Tripathi, P. Kumar, V. Tripathi and J. Simal-Gandara, Antibiotics, 2021, 10, 374 CrossRef CAS.
- N. Behera, M. Arakha, M. Priyadarshinee, B. S. Pattanayak, S. Soren, S. Jha and B. C. Mallick, RSC Adv., 2019, 9, 24888–24894 RSC.
- M. S. AlSalhi, K. Elangovan, A. J. A. Ranjitsingh, P. Murali and S. Devanesan, Saudi J. Biol. Sci., 2019, 26, 970–978 CrossRef CAS.
- D. Das, R. Ghosh and P. Mandal, SN Appl. Sci., 2019, 1, 1–16 Search PubMed.
- M. H. Oueslati, L. B. Tahar and A. H. Harrath, Arabian J. Chem., 2020, 13, 3112–3122 CrossRef CAS.
- S. Priya Velammal, T. A. Devi and T. P. Amaladhas, J. Nanostruct. Chem., 2016, 6, 247–260 CrossRef.
- M. M. Zangeneh, H. Ghaneialvar, M. Akbaribazm, M. Ghanimatdan, N. Abbasi, S. Goorani, E. Pirabbasi and A. Zangeneh, J. Photochem. Photobiol., B, 2019, 197, 111556 CrossRef CAS.
- K. Velsankar, S. Sudhahar and G. Maheshwaran, J. Photochem. Photobiol., B, 2019, 200, 111650 CrossRef.
- S. Loganathan, M. S. Shivakumar, S. Karthi, S. S. Nathan and K. Selvam, Toxicol. Rep., 2021, 8, 64–72 CrossRef CAS.
- B. H. Shnawa, P. J. Jalil, S. M. Hamad and M. H. Ahmed, Bionanoscience, 2022, 12, 1264–1278 CrossRef.
- S. Haq, S. Dildar, M. B. Ali, A. Mezni, A. Hedfi, M. I. Shahzad, N. Shahzad and A. Shah, Mater. Res. Express, 2021, 8, 055006 CrossRef CAS.
|
| This journal is © The Royal Society of Chemistry 2025 |
Click here to see how this site uses Cookies. View our privacy policy here. 
 Open Access Article
 This Open Access Article is licensed under a
  a,
Muhammad Ashraf
Shaheen
a,
Muhammad Ashraf
Shaheen