DOI:
10.1039/D4MA00818A
(Paper)
Mater. Adv., 2025,
6, 579-597
Unraveling the sorption mechanism of industrial dyes onto Zr-based MOFs: computational and experimental modelling for highly efficient removal†
Received
13th August 2024
, Accepted 22nd November 2024
First published on 25th November 2024
Abstract
The ability of NH2-UiO-66 to remove the cationic dye rhodamine B (RhB) and the anionic dyes indigo carmine (IC) and orange 2 (O2) was evaluated. XRD, SEM/EDX, FTIR, N2 sorption and TG/DTG analytical techniques were used to evaluate the physicochemical properties of NH2-UiO-66 produced by the solvothermal method. For IC and O2 dyes, the NH2-UiO-66 material showed an adsorption capacity of 265.8 mg g−1 and 229.8 mg g−1, respectively, while for RhB it was 91.6 mg g−1. The most accurate model was Toth's isothermal model with R2 > 0.90. The Elovich kinetic model provided the most accurate fit, with an R2 > 0.95 for all dyes, suggesting a competition between physisorption and chemisorption. The HOMOs are significantly delocalised on the nitrogen atom, while the LUMOs are delocalised around the aromatic nucleus, according to DFT and Monte Carlo simulation studies. The chemical reactivity of the dyes IC, RhB and O2 interacting at the adsorbent surface was demonstrated by calculating quantum parameters such as EHOMO, ELUMO and gap energy (Egap). The adsorption mechanism found was favorable, suggesting electrostatic attractions as well as pi–pi interactions between the benzene rings of the dye and the H2N-H2BDC linker. NH2-UiO-66 showed high stability after 5 adsorption cycles.
1. Introduction
Global industrial and technological development has introduced pollutants of various kinds into the environment. Pollutants such as organic contaminants, pharmaceutical compounds1,2 and heavy metals3,4 are identifiable as carcinogenic and mutagenic and their accumulation in the body leads to adverse health effects.5 Organic dyes are commonly used in many industrial activities such as paper, textile, wood and plastic dyeing, as well as in the cosmetics, food and pharmaceutical industries.6 Organic dyes are some of the most important pollutants, because once dissolved in water, they become difficult to treat due to their synthetic origin and complex molecular structures, which make them more stable and difficult to biodegrade.7,8 Consequently, most of the work on wastewater treatment focuses on the removal of contaminants.9,10 Several physical, biological and chemical methods are used and are being constantly developed to solve and above all improve wastewater treatment and recycling. In order to treat wastewater that contains dyes, a number of alternative treatment techniques have been studied. All of these approaches, though, have serious disadvantages. Some issues with membrane filtration include fouling, the production of secondary pollutants, and the high energy required. Furthermore, the degradation of bio-resistant pollutants through advanced oxidation processes such as Fenton and Fenton-like processes,11,12 electrocatalysis,13–15 photocatalysis,16–19 and catalytic ozonation can lead to the potential generation of toxic intermediates and are costly. Adsorption remains one of the most widely used techniques in the wastewater treatment field, due to its simplicity and efficiency.20 In this context, several works including the use of adsorbents such as activated carbon,21 zeolite and lignocellulosic materials22–25 have been reported. The choice of adsorbents is based on their porosity, flexibility, thermal and mechanical stability, high specific surface area and regeneration capacity.20 Metal–organic frameworks (MOFs) are one of the materials that meet most of these criteria.26 The effectiveness of MOFs for contaminant removal depends on metal ions and multifunctional sites. MOFs functionalized with carboxylic acids and amines present excellent properties for contaminant removal from wastewater. NH2-UiO-66, with its high thermal and water stability, high porosity and ordered structure, represents a potential sorbent for wastewater contaminant treatment. Several researchers have investigated the synthesis of NH2-UiO-66 using hydrothermal and microwave methods.27,28 For example, Shen et al. reported on the synthesis of NH2-UiO-66 using a hydrothermal method for photocatalytic applications,29 while Luu (2015) evaluated the performance of NH2-UiO-66 in the separation of CO2 from CH4.30 Hydrothermal methods have the advantage that they can simultaneously combine pressure and temperature, and ensure complete solubilization of the linker and metal salts used during the synthesis.31,32
The performance of UiO-66 for the removal of organic dyes has been the target of some research. For example, Embaby et al. reported on the adsorption of anionic and cationic dyes using UiO-66, and found that the anionic dye Alizarin Red S was preferentially adsorbed, with an adsorption capacity of 400 mg g−1 at an optimum pH of 2.1 The efficacy of NH2-UiO-66 on the removal of organic pollutants and theoretical studies remain little explored up to now. However, Tambat et al. (2018) reported on the removal of safranin dye using NH2-UiO-66, and they showed that the adsorption capacity increased with the pH; a maximum adsorption capacity of 390 mg g−1 was obtained at a pH of 7 at 289 K.6 Chen et al. reported on the adsorption of anionic (acid chrome blue K and methyl orange) and cationic (rhodamine B, methylene blue and neutral red) dyes using NH2-UiO-66 and UiO-66, and they found that the cationic dye was preferentially adsorbed on NH2-UiO-66 comparable to UiO-66 with the maximum adsorption capacities of 97.97 mg g−1 and 90.59 mg g−1, with methylene blue at an initial concentration of 20 ppm, respectively.33
However, efficient removal requires the simultaneous integration of all factors affecting the adsorption. Optimization using mathematical approaches represents an advance in methodology which ensures the experimental reproducibility of all experiments assigned. This approach recognizes simultaneous interactions and quadratic effects that may escape experimentation. Response surfaces have been developed for experiments involving several factors, in order to minimize errors and the time required for all experiments. The face-centered composite design (CCD) is one of the design approaches suitable for complex experimental designs in terms of the time and effort required. It provides a global experimental exploration, offering a balance between predicted and experimental values of total space.34 Non-linear isothermal models remain a feature of adsorbent–adsorbate adsorption, used to elucidate the mechanisms of the interactions at the adsorbent surface, disentangling adsorption sites and adsorbent–adsorbent interactions. Up to now, few works have combined theoretical and experimental studies to investigate the removal mechanism of organic dyes from wastewater. Computational studies have the advantage of being reproducible,35–37 providing adsorption energies of the molecules studied on the adsorbent surface and descriptors of the complexes. They offer the advantage of examining the interactions between the molecules studied on the surface of the material and different aqueous media, and the ability of molecules to exchange low-energy electrons with molecular orbitals.
The aim of this work is to present an improved strategy for the use of NH2-UiO-66 for the elimination of anionic dyes, indigo carmine (IC) and orange 2 (O2), and the cationic dye rhodamine B (RhB), via a mathematical approach used to optimize adsorption conditions, including the pH, the adsorbent amount, the dye concentration and the stirring time, followed by thermodynamic, kinetic and recyclability studies. Experimental data were fitted to Langmuir, Freundlich and Toth isotherms. Adsorption mechanisms were then elucidated using DFT studies and GCMC molecular simulations. NH2-UiO-66 obtained by the solvothermal method was characterized using XRD, SEM/EDX, FTIR, N2 sorption and TG/DTG analysis techniques.
2. Experiments
2.1. Chemicals and materials
The chemicals used were N,N-dimethylformamide (DMF), ZrCl4, 2-amino-1,4-benzenedicarboxylic acid (H2N-H2BDC), methanol, acetic acid (AA), indigo carmine, rhodamine B, orange 2, methanol, ethanol, HCl, and NaOH, and all chemicals were purchased from Sigma-Aldrich. Distilled water was used to prepare all solutions.
2.2. Synthesis of NH2-UiO-66
In a separate step, 5 mmol of H2N-H2BDC and 5 mmol of ZrCl4 were dissolved in 30 mL of DMF for 40 min at room temperature, the two solutions were mixed, and then 5 mmol of AA were added to the mixture and sonicated at 500 rpm for 30 min. The resulting mixture was transferred into a Teflon-coated stainless-steel autoclave and kept at 120 °C for 24 h. The resulting yellow solid was repeatedly washed with DMF and sonicated in methanol for 2 × 24 h to exchange the DMF, then filtered and dried at 60 °C overnight. Next, 0.5 g of dried solid was sonicated in 150 mL of methanol and 1 M HCl for around 20 h, and then refluxed for 24 h at 80 °C to regenerate the amine function. The final mixture after cooling was washed 4 times with methanol, then dried at 60 °C overnight, the resulting product was activated at 150 °C at 5 mbar and the final product obtained was called NH2-UiO-66.
2.3. Characterization techniques
The X-ray diffraction analysis of the materials was carried out using a PAN analytical XPERT Pro powder diffractometer that was automated and used anode-filtered Cu-K-1 radiation with a radiation wavelength (λ) of 1.54056, and an accelerating voltage of 40 kV at 40 mA. SEM and EDX studies were carried out using an 8 kV TESCAN VEGA 3-LMU instrument. Prior to SEM-EDX analysis, the samples were coated with thin gold sputter films to increase their conductivity. Fourier-transform infrared spectroscopy (FT-IR) was carried out using a Nicolet Thermoscientific IS5 spectrophotometer in the range of 200–4000 cm−1. Zeta potential measurement of the samples was carried out using a Zetasizer instrument (Malvern 169 Instruments, UK). UV-vis measurements were obtained using a UV-vis spectrophotometer (UV-3600 Shimadzu, Japan) in the range from 200 to 800 nm. The specific surface area, pore size, and pore volume of the materials were calculated using N2 sorption using a BELSORP MAX device from Bel Japan Inc. at 77 K. Thermogravimetry analysis (TGA) was carried out using a STA 449C Jupiter de Netzsch, Selb, Germany at 10 °C min−1 under N2.
2.4. Adsorption experiments
Batch adsorption experiments were carried out at room temperature with NH2-UiO-66 material, different adsorbent amounts and the concentrations of each dye were measured, then the pH of the solution was adjusted depending on each run of experiments, and the mixture was stirred according to the time assigned to each experiment. The solutions were filtered using Whatman filter paper, and the filtrates was analyzed using a UV-visible spectrophotometer at λmax between 650–611 nm for all three dyes. The absorbance obtained was used to calculate the equilibrium concentration (Ce) from the calibration curve. The amount adsorbed (Qads) and removal efficiency (%) were calculated from eqn (1) and (2), respectively.| |  | (1) |
| |  | (2) |
where, C0 and Ce are the initial and equilibrium dye concentration (mg L−1), respectively, V is the volume of the solution (L) and m is the mass of NH2-UiO-66 (mg).
2.5. Design of adsorption experiments
A central composite design (CCD) was employed to optimize the following factors: stirring time (A), initial dye concentration (B), pH (C) and adsorbent quantity (D). Statgraphics Plus version 18.0 was used to design experiments comprising 4 central points (Table S1, ESI†). The CCD generates 28 experiments according to eqn (3).| | | R = 2k + 2k + n = 24 + 2(4) + 4 = 28 | (3) |
where R is the total number of experiments, n is the number of center points and k is the number of experimental variables. The selection of the number of central points is essential to assess experimental errors and the reproducibility of the results obtained. The 4 experimental factors were coded as shown in Table 1, with −1 and +1 representing minimum and maximum values respectively, and 0 being the central value for each factor.
Table 1 Codification of experimental factors for the 28 experiments
| Factor |
Units |
Coded variable |
Variable level |
| −1 |
0 |
+1 |
| Time |
min |
A |
30.0 |
75.0 |
120.0 |
| [Dye concentration] |
mg L−1 |
B |
20.0 |
110.0 |
200.0 |
| pH |
— |
C |
2.0 |
6.0 |
10.0 |
| Mass of adsorbent |
mg |
D |
20.0 |
50.0 |
80.0 |
2.6. Mathematical modelling of the response and analysis of variance
All 28 experiments were performed randomly in a block to reduce the effects of uncontrolled factors and conditions. The expected response for each set of experiments was the amount of dye adsorbed. Statgraphics Plus version 18.0 generated an empirical model from the response of the 28 experiments, describing dye adsorption. Based on the standard second-order polynomial equation with its linear, cross and quadratic terms, the interactions between the experimental elements and their impact on the expected response are integrated, as shown in eqn (4).| |  | (4) |
where R is the predicted response, β0 is the constant of the quadratic equation, βi and βii are the linear and quadratic coefficients, respectively, βij is the interaction coefficient between the variables, xi and xj are the coded values of the factors studied and ε is the degree of uncertainty between the obtained and predicted responses. Statistical analysis of the experimental data used to validate the statistical model showed a correlation between the predicted responses of each of the 28 experiments and the experimental response, with a normal distribution and a probability value (p-value) of less than 5%.34,38
2.7. Kinetic, isotherm and error analysis studies of adsorption
The mechanisms controlling the adsorption of IC, RhB and O2 on NH2-UiO-66 were investigated using pseudo-first-order, pseudo-second-order, Elovich and intra-particle diffusion non-linear kinetic models, and their mathematical expressions are presented in Table S2 (ESI†). Non-linear Langmuir, Freundlich and Toth models were used to fit the equilibrium adsorption isotherms of the three dyes. The equations are presented in Table S3 (ESI†). The goodness of fit of each isotherm model was evaluated through the determination of the coefficient of determination (R2) and associated non-linear error functions, including residual root mean square error (RMSE), hybrid fractional error function (HYBRID), chi-square test error function (χ2) and average relative error (ARE). The equations are presented in Table S4 (ESI†).39
2.8. Molecular DFT and Monte Carlo simulation of IC, RhB and O2 adsorption on NH2-UiO-66
All simulations were carried out using Material Studio software (BIOVIA Inc.), into which the CIFs of the NH2-UiO-66 material were imported. DMol3 software was used to optimize the structure of each dye in aqueous medium and the localization of nucleophiles and electrophiles by the calculation of HOMO, LUMO and gap energy (Egap), using eqn (S2) (ESI†).40,41 The NH2-UiO-66 structure was optimized using the Forcite module and cleaved in a 1 × 1 × 1 complex cell unit plane, then extended to have a large interaction surface. The interaction between the IC, O2 and RhB molecules and the MOF material was evaluated using the molecular dynamics simulation technique via the Forcite tools and adsorption localization modules. All calculations were carried out at 289 K in acidic, basic and neutral medium, according to the optimum adsorption conditions for the dyes IC, RhB and O2, by loading into the cell 1 molecule of each dye, 200H2O + 5(H3O+, Cl−), 200H2O + 5(Na+, OH−) and 200 molecules of H2O.
3. Results and discussion
3.1. PXRD and FTIR analysis
Fig. 1a and b show the XRD pattern and Fourier transform infrared analysis of NH2-UiO-66, respectively. Fig. 1a shows three characteristic reflection peaks of NH2-UiO-66 located at 7.41°, 8.81° and 25.71°, attributable to the (111), (200) and (600) crystal planes, which are typical of NH2-UiO-66 materials.42 In addition, reflection peaks at 14.71°, 17.41°, 22.21°, 30.61°, 31.11°, 35.91°, 37.71°, 40.11°, 43. 61°, 50.51° and 56. 81° corresponding to the crystal planes (222), (400), (511), (711), (731), (820), (751), (664), (933), (955) and (1242), are comparable and identifiable with those of previously reported works in the literature.43 These peaks agree with the typical standard structure of NH2-UiO-66 reported by Ding et al. (2020). This observation shows that the stable, rigid crystal structure of the NH2-UiO-66 material was formed by the recrystallization of –COOH-bonded Zr6-node clusters from H2N-H2BDC. From the FTIR spectra (Fig. 1b), reflections appearing at wave numbers 1425–1564 cm−1 are attributable to the carboxylate groups present in NH2-UiO-66.33 The vibration at 1489 cm−1 corresponds to the asymmetric stretching mode of O![[double bond, length as m-dash]](https://www.rsc.org/images/entities/char_e001.gif) CO and that at 1155 cm−1 belongs to the symmetric stretching bending mode of O–C–O.44 The broad vibrational band observed between 3000–3520 cm−1 is attributable to stretching vibrations of the –OH group and physisorbed hydroxyls, showing synergistic effects with the characteristic vibrational bands of –NH2 groups appearing at 3350 cm−1.44,45 The vibrational bands at 1253 cm−1 are the bending bands of the CN corresponding to H2N-H2BDC. The CO, C–N and C–O groups are observable by vibrations appearing at 1564 cm−1, 1253 cm−1 and 1425 cm−1, respectively.33 The short wavelengths at 664 and 448 cm−1 are those attributable to the stretching modes of Zr–O and Zr6O4.10,30
CO and that at 1155 cm−1 belongs to the symmetric stretching bending mode of O–C–O.44 The broad vibrational band observed between 3000–3520 cm−1 is attributable to stretching vibrations of the –OH group and physisorbed hydroxyls, showing synergistic effects with the characteristic vibrational bands of –NH2 groups appearing at 3350 cm−1.44,45 The vibrational bands at 1253 cm−1 are the bending bands of the CN corresponding to H2N-H2BDC. The CO, C–N and C–O groups are observable by vibrations appearing at 1564 cm−1, 1253 cm−1 and 1425 cm−1, respectively.33 The short wavelengths at 664 and 448 cm−1 are those attributable to the stretching modes of Zr–O and Zr6O4.10,30
 |
| | Fig. 1 PXRD pattern (a) and FTIR spectra (b) of NH2-UiO-66. | |
3.2. SEM-EDX and N2 sorption analysis
NH2-UiO-66 crystal surface morphology and particle size were studied by SEM analysis. As shown in Fig. 2a, NH2-UiO-66 crystals are characterized by spherical and hexagonal particle shapes with a random heterogeneous distribution.6 EDX mapping (Fig. 2b) shows the presence and homogeneous dispersion of Zr atoms from zirconium clusters (Zr6O4(OH)4) of the metal salt and C, O and N of the organic ligand in the NH2-UiO-66 structure. A similar homogeneity of C, O and N element distribution is observed. The associated EDX analyses (Fig. 2c) also show the presence of the elements C, N, O and Zr with molar percentages of 60.19, 4.58, 32.43 and 2.80, respectively, meaning that NH2-UiO-66 crystals have been formed. Fiaz and Athar (2020)46 reported that EDX spectra of NH2-UiO-66 contain characteristic peaks of Zr, C, O and N, corresponding to the basic units of the NH2-UiO-66 crystal structure.33 N2 adsorption–desorption isotherms (Fig. 2d) show type I isotherms following the IUPAC classification, showing the presence of micropores and mesopores2,23,47,48 in the NH2-UiO-66 structure due to pore opening of the Zr6O4(OH)4 linker to –OOC–C6H3(NH2)–COO–.42 The textural properties (Table S5, ESI†) show that the BET specific surface area, total pore volume, micropore volume, micropore surface area and external surface area obtained were 1156 m2 g−1, 0.66884 cm3 g−1, 0.440253 cm3 g−1, 851.03 m2 g−1 and 305.58 m2 g−1, respectively. The BET specific surface area obtained is close to that obtained by Nanthamathee et al. 202142 and significantly higher than that obtained by Tambat et al. 2018.6 The BJH pore size distribution (Fig. 2e) shows that NH2-UiO-66 material contains nanoparticles with a maximum pore diameter of less than 5 nm.42
 |
| | Fig. 2 SEM (a), EDX mapping (b) and EDX spectra (c), N2 sorption (d) and BJH pore size distribution (e) of NH2-UiO-66. | |
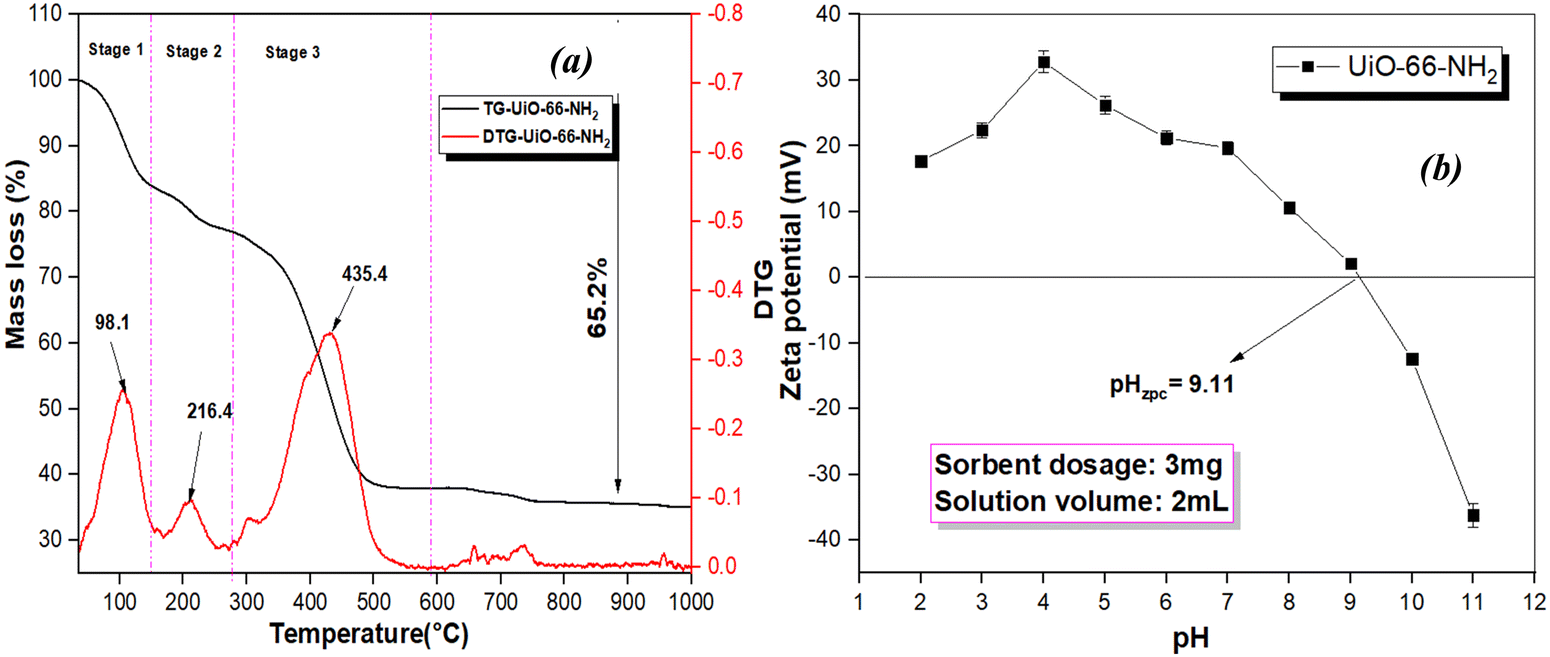
3.3. Thermo gravimetric and zeta potential analysis
The thermal analyses carried out enabled us to assess the stability of the NH2-UiO-66 material. The thermograms obtained are presented in Fig. 3a, showing a weight loss subdivided into three stages. The first stage, observable between 100–150 °C, is attributable to the departure of OH from water molecules and physisorbed methanol solvent in the pores and cluster of NH2-UiO-66. The second loss observed between 150–250 °C is associated with the dehydroxylation of zirconium clusters (Zr6O4(OH)4) and the strongly bound DMF solvent;43 the third step (250–560 °C) is associated with the decomposition of the NH2-UiO-66 structure attributable to the decomposition of the organic ligand and the formation of Zr6O4 clusters. In addition, increasing the temperature above 600 °C contributes to the transformation of Zr6O4 clusters into ZrO2, resulting in further loss in the third step. Overall, NH2-UiO-66 is stable near 560 °C.43 The zeta potential measurement of NH2-UiO-66 presented in Fig. 3b shows that the pH at the zero charge point (pzc) obtained is 9.11. This shows that above the pzc the surface charge of the material was electropositive for pH values between 2–9 and below the pzc the surface charge of the material was electronegative, due to the protonation and deprotonation of the –NH2 group of the –OOC–C6H3(NH2)– organic linker and –OH of the zirconium clusters (Zr6O4(OH)4), respectively basic units of the NH2-UiO-66 crystal structure. A similar observation was found by Tambat and coworkers.6
 |
| | Fig. 3 TGA/DTG spectra (a) and zeta potential (b) of NH2-UiO-66. | |
3.4. Experimental design of adsorption experiments and statistical validation of the model
3.4.1. Experimental design of the adsorption experiments.
The coded experimental matrix and adsorbed quantities are shown in Table 2. Y1, Y2 and Y3 represent the adsorbed quantities (mg g−1) of indigo carmine, rhodamine B and orange 2, respectively on NH2-UiO-66, as well as the value predicted by Statgraphics 18 software for each run. Eqn (5)–(7) are the quadratic model equations showing the fit between the predicted response and the linear, crossover and quadratic interactions showing the synergistic effects of the 4 coded variables: time (x1), dye concentration (x2), solution pH (x3) and adsorbent dose (x4).49 These equations have positive and negative signs, showing the correlation between the linear and quadratic terms of the factors studied. An increase in a factor with a positive term leads to an increase in the quantity adsorbed.8,50,51 The residual values in Table S6 (ESI†) are significantly lower than those observed and predicted by the model.
Table 2 Central composite design for the adsorption (observed and predicted values) of indigo carmine, rhodamine B and orange 2
| No. |
Time (min) |
Concentration (mg L−1) |
pH |
Mass (mg) |
Y1: adsorption of indigo carmine (mg g−1) |
Y2: adsorption of rhodamine B (mg g−1) |
Y3: adsorption of orange 2 (mg g−1) |
| Observed value |
Predicted value |
Observed value |
Predicted value |
Observed value |
Predicted value |
| 1. |
−1 |
−1 |
−1 |
−1 |
88.12 |
90.06 |
10.05 |
10.88 |
22.76 |
34.46 |
| 2. |
+1 |
−1 |
−1 |
−1 |
29.7 |
28.60 |
23.01 |
23.85 |
19.99 |
17.94 |
| 3. |
−1 |
+1 |
−1 |
−1 |
264.15 |
265.48 |
5.42 |
8.49 |
196.77 |
185.87 |
| 4. |
+1 |
+1 |
−1 |
−1 |
190.83 |
191.26 |
87.10 |
80.86 |
194.62 |
198.58 |
| 5. |
−1 |
−1 |
+1 |
−1 |
27.64 |
19.98 |
8.72 |
6.93 |
16.56 |
17.77 |
| 6. |
+1 |
−1 |
+1 |
−1 |
41.78 |
48.10 |
19.48 |
20.65 |
15.43 |
4.07 |
| 7. |
−1 |
+1 |
+1 |
−1 |
193.29 |
191.19 |
22.11 |
22.88 |
175.00 |
184.94 |
| 8. |
+1 |
+1 |
+1 |
−1 |
197.03 |
206.54 |
96.34 |
95.99 |
184.48 |
200.48 |
| 9. |
−1 |
−1 |
−1 |
+1 |
33.5 |
21.82 |
47.44 |
45.12 |
5.873 |
−9.48 |
| 10. |
+1 |
−1 |
−1 |
+1 |
48 |
51.20 |
28.15 |
29.76 |
8.68 |
2.01 |
| 11. |
−1 |
+1 |
−1 |
+1 |
92.04 |
86.82 |
18.98 |
20.19 |
8.75 |
23.37 |
| 12. |
+1 |
+1 |
−1 |
+1 |
97.94 |
103.43 |
65.10 |
64.22 |
64.65 |
64.09 |
| 13. |
−1 |
−1 |
+1 |
+1 |
7.38 |
8.05 |
2.40 |
11.02 |
6.70 |
6.01 |
| 14. |
+1 |
−1 |
+1 |
+1 |
130.5 |
127.0 |
2.14 |
−3.60 |
8.77 |
20.32 |
| 15. |
−1 |
+1 |
+1 |
+1 |
69.9 |
68.83 |
7.93 |
4.42 |
51.91 |
54.62 |
| 16. |
+1 |
+1 |
+1 |
+1 |
175.85 |
175.02 |
47.65 |
49.20 |
106.60 |
98.16 |
| 17. |
−1 |
0 |
0 |
0 |
20.91 |
44.70 |
8.71 |
1.83 |
37.45 |
24.21 |
| 18. |
+1 |
0 |
0 |
0 |
86.58 |
67.06 |
22.66 |
30.70 |
40.15 |
37.72 |
| 19. |
0 |
−1 |
0 |
0 |
8.27 |
20.08 |
3.57 |
0.35 |
29.65 |
41.32 |
| 20. |
0 |
+1 |
0 |
0 |
139.35 |
131.80 |
21.18 |
25.56 |
183.28 |
155.94 |
| 21. |
0 |
0 |
−1 |
0 |
15.31 |
20.91 |
48.87 |
50.74 |
7.05 |
12.30 |
| 22. |
0 |
0 |
+1 |
0 |
23.00 |
21.67 |
41.96 |
41.25 |
41.91 |
20.99 |
| 23. |
0 |
0 |
0 |
−1 |
82.38 |
73.71 |
22.57 |
24.28 |
104.78 |
86.28 |
| 24. |
0 |
0 |
0 |
+1 |
10.89 |
23.83 |
18.56 |
18.01 |
10.31 |
13.15 |
| 25. |
0 |
0 |
0 |
0 |
20.29 |
32.22 |
22.81 |
21.89 |
32.50 |
42.33 |
| 26. |
0 |
0 |
0 |
0 |
60.47 |
32.22 |
22.86 |
21.89 |
33.91 |
42.33 |
| 27. |
0 |
0 |
0 |
0 |
40.51 |
32.22 |
22.83 |
21.89 |
32.97 |
42.33 |
| 28. |
0 |
0 |
0 |
0 |
20.42 |
32.22 |
22.53 |
21.89 |
22.93 |
42.33 |
The closeness of the observed and predicted values means that there is a good correlation between them. Consequently, to estimate the quality of the model, the coefficient of determination (R2) and the adjusted coefficient of determination (Rajust2) were evaluated. R2 and R2 adjusted values of 97.77% and 95.36% for Y1, 97.75% and 95.41% for Y2 and 96.48% and 92.90% for Y3, respectively, were obtained. The closeness of the R2 and R2 adjusted values shows a good correlation between the factors studied and the accuracy of the central composite design adopted.52 Furthermore, these results are also confirmed by the closeness between the adsorbed quantities (Y1, Y2 and Y3) predicted by the model and those obtained experimentally (Table S7, ESI†) for the IC, RhB and O2 dyes, as shown in Fig. 4(a)–(c), respectively.
| | | Adsorption of IC = 228.27427 − 3.00459x1 + 0.021109x2 − 3.51040x4 − 0.000788x1 × x2 + 0.124406x1 × x3 + 0.016821x1 × x4 − 0.002929x2 × x3 − 0.010225x2 × x4 + 0.117297x3 × x4 + 0.011682x12 + 0.005398x22 − 0.683374x32 + 0.018384x42 | (5) |
| | | Adsorption RhB = 7.04659 + 0.590565x1 + 0.135792x2 − 17.59957x3 + 0.978671x4 + 0.003666x1 × x2 +0.001035x1 × x3 − 0.005247x1 × x4 + 0.012733x2 × x3 − 0.002087x2 × x4 − 0.062823x3 × x4 − 0.002779x12 − 0.001103x22 + 1.50638x32 − 0.000831x42 | (6) |
| | | Adsorption O2 = 33.72406 + 0.510720x1 − 0.544372x2 + 15.50179x3 − 1.62213x4 + 0.001805x1 × x2 + 0.003932x1 × x3 + 0.005187x1 × x4 + 0.010945x2 × x3 − 0.010978x2 × x4 + 0.067030x3 × x4 − 0.005614x12 + 0.006950x22 − 1.60548x32 + 0.008197x42 | (7) |
 |
| | Fig. 4 Predicted values vs. observed values of the adsorption of indigo carmine (a), rhodamine B (b) and orange 2 (c) on NH2-UiO-66. | |
3.4.2. Analysis of variance (ANOVA).
ANOVA was used to estimate the individual and simultaneous effect of the factors involved during the adsorption of the dyes IC, RhB and O2 onto NH2-UiO-66 using the CCD model. Table 3 shows the results, including linear, cross and quadratic terms for factors A, B, C and D. 9 of the factors for IC, 11 of the factors for RhB and 6 of the factors for O2 have p-values less than 0.05.50 Furthermore, five linear terms, three cross terms and one quadratic term are the 11 significant components for indigo carmine at the 95% confidence level. There are six linear, three cross and two quadratic terms for rhodamine B, and three linear, one cross and two quadratic terms for orange 2. However, dye concentration, stirring time and adsorbent dose were found to have significant linear and crossover effects for all three adsorbed dyes, regardless of the adsorption procedure used for all three dyes in this study. This implies that the model considered is statistically significant with a 95.0% degree of confidentiality for the cross and quadratic term of the 4 factors when they are simultaneously combined together. The CCD model adopted is reliable and recommended for maximum removal of the organic dyes IC, RhB and O2 in aqueous solutions. The Pareto diagram Fig. S1(a)–(c) (ESI†) and the normal probability of adsorption diagram Fig. S2(a)–(c) (ESI†) for IC, RhB and O2, respectively, show the positive effect of dye concentration, pH and stirring time, compared with mass, which shows a negative effect, meaning that the increase in adsorbed amount is significantly influenced by adsorption kinetics and medium pH, due to the oversaturation of NH2-UiO-66 pores, which could generate desorption and electrostatic repulsions created by the hydroxyl and/or amine groups of the organic linker.
Table 3
p-Value of the analysis of the variance (ANOVA) for the adsorption of indigo carmine, rhodamine B and orange 2 on NH2-UiO-66
|
|
Factors |
Adsorption of indigo carmine |
Adsorption of rhodamine B |
Adsorption of orange 2 |
|
p value significant (p > 0.05).
|
| Model |
|
<0.0001a |
<0.0001a |
<0.0001a |
|
|
| Linear term |
x
1: time |
0.0080 |
<0.0001a |
0.1254 |
|
x
2: concentration |
<0.0001a |
<0.0001a |
<0.0001a |
|
x
3: pH |
0.9176 |
0.0017 |
0.3112 |
|
x
4: mass |
<0.0001a |
0.0218 |
<0.0001a |
| Cross term |
x
1
x
2
|
0.4148 |
<0.0001a |
0.1186 |
|
x
1
x
3
|
<0.0001a |
0.8863 |
0.8740 |
|
x
1
x
4
|
<0.0001a |
<0.0001a |
<0.0001a |
|
x
2
x
3
|
0.7852 |
0.0033 |
0.3841 |
|
x
2
x
4
|
<0.0001a |
0.0007 |
<0.0001a |
|
x
3
x
4
|
0.0026 |
<0.0001a |
0.0889 |
| Quadratic term |
x
1
x
1
|
0.0263 |
0.1002 |
0.3157 |
|
x
2
x
2
|
0.0005 |
0.0147 |
0.0002 |
|
x
3
x
3
|
0.2674 |
<0.0001a |
0.0347 |
|
x
4
x
4
|
0.1031 |
0.8177 |
0.5102 |
3.4.3 Study of interaction factors on the adsorption of dyes and model validation.
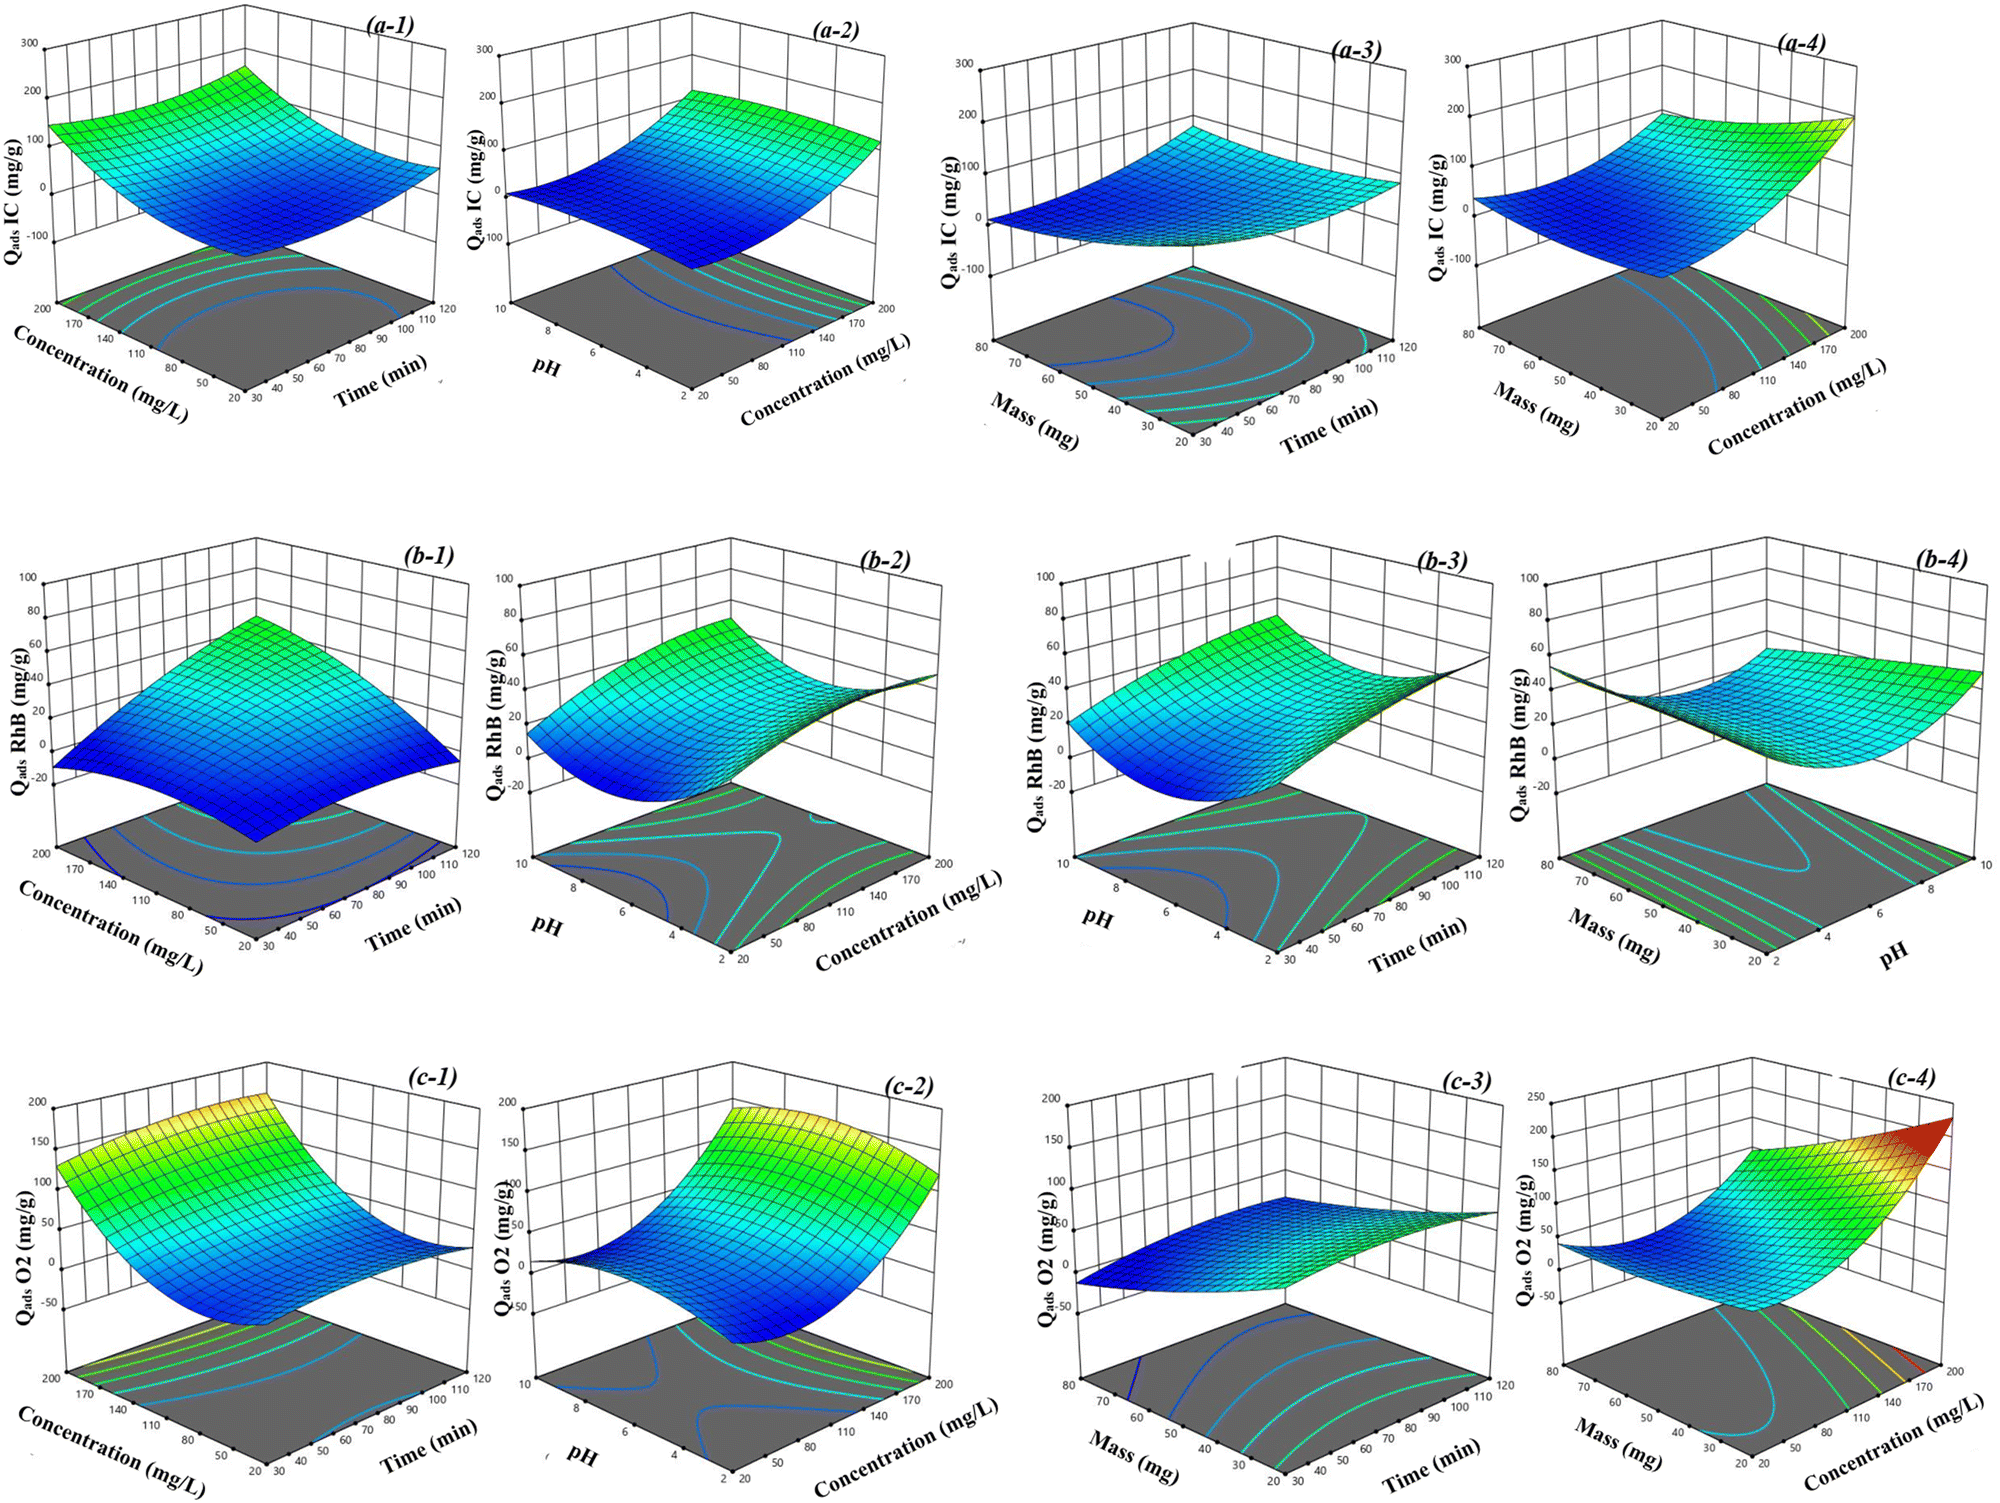
The 3D surface plot of dye adsorption on NH2-UiO-66 as a function of the variables: stirring time (A), initial dye solution concentration (B), dye solution pH (C) and adsorbent quantity (D) are shown in Fig. 5(a-1)–(c-4) and Fig. S3–S5 (ESI†) for indigo carmine, rhodamine B and orange 2. Increasing the dye concentration above 150 mg L−1 with time and mass results in a decrease in the amount adsorbed, as shown in Fig. 5(a-1) and (a-4), due to saturation of the NH2-UiO-66 pores, showing that adsorption at high concentrations is not favorable. At the same time, pH proved to be a factor influencing the adsorbed amount; maximum IC adsorption was more favorable for basic pH, as shown in Fig. 5(a-2) and Fig. S3 (ESI†), as shown by the closeness between predicted and experimental adsorption amounts (Table S7, ESI†), probably due to the electronegativity of the material favoring π–π interactions and van der Waals forces between the benzene rings of the H2N-H2BDC organic bond and those of indigo carmine.6
 |
| | Fig. 5 3D response surface plots of the central composite design showing the effect of time (min), concentration of dye solution (mg L−1), pH and mass (mg) on the adsorption of indigo carmine (IC) (a-1)–(a-4), rhodamine B (RhB) (b-1)–(b-4) and orange 2 (O2) (c-1)–(c-4), respectively. | |
The 3D surface plot of rhodamine B adsorption, Fig. 5(b-1)–(b-4), shows that the variation in stirring time does not significantly affect the amount adsorbed; the NH2-UiO-66 material was found to reach its maximum adsorption capacity only after 40 min, due to the blocking of the pores of the material, and to the positive charge created by protonation of the amine group of the H2N-H2BDC linker. Associated DFT analyses showed that RhB was preferentially adsorbed on the surface and in the cavities of the NH2-UiO-66 material. The optimum pH of 5.28 (Table S7, ESI†) was observed; increasing the pH above 7 would lead to a decrease in the amount adsorbed, Fig. 5(b-2)–(b-4), due to electrostatic repulsions between the –NH3+ groups and the positive charge of the dye, while increasing the mass was found to be the most significant factor on rhodamine adsorption, Fig. 5(b-1) and Fig. S4 (ESI†), indicating that larger amounts of NH2-UiO-66 would provide more favorable sites for RhB dye adsorption.42
The combined factors showed synergetic effects on the adsorption capacity of orange 2, with simultaneous increases in concentration, time and pH leading to increases in the quantity adsorbed, Fig. 5(c-1) and (c-2), and Fig. S5 (ESI†). The decrease in mass and pH enhances the adsorption capacity; an adsorbed quantity of 220 mg g−1 for small masses of the material can be observed at an optimum pH of 7 (Table S7, ESI†). However, the increase in the mass of NH2-UiO-66 would lead to a decrease in the adsorbed quantity, due to saturation of the solution,7 as high mass values inhibit the favorable active adsorption sites of orange 2, Fig. 5(c-3) and (c-4), due to the agglomeration of NH2-UiO-66 at the adsorption sites.6 These observations make it possible to note with precision the factors that influence the quantities adsorbed,53,54 as the increase in adsorbed quantity proved to be inversely related to the mass of the material. On the other hand, stirring time, pH of the solution and dye concentration were found to have a positive effect on adsorption rate. pH is known to influence the ionic form of the adsorbate–adsorbent, favoring π–π interactions. The order of adsorption of indigo carmine > orange 2 > rhodamine B dyes was observed according to the optimal conditions.34,38
3.5. Modelling of adsorption isotherms
Adsorption isotherms for IC, RhB and O2 dyes under optimum conditions are shown in Fig. S6(a)–(c) (ESI†) respectively. The NH2-UiO-66 material shows a high adsorption capacity for the anionic IC and O2 dyes, comparable to that of the cationic RhB dye. For example, a maximum equilibrium capacity of 264 mg g−1 and 229 mg g−1 of IC and O2 dyes was observed, respectively; RhB showed a maximum capacity of 91 mg g−1, with effective removal of 97%, 98.2% and 21.1% for IC, O2 and RhB, respectively. IC and O2 removal was fastest within 60 minutes, reflecting the favorable adsorption site coverage of the NH2-UiO-66 material.33,37,43,55 The high removal capacity of the anionic IC and O2 dyes could be attributed to the electropositivity of the material's surface charge in the pH range studied, which favors electrostatic attractions between the –NH3+ of the linker H2N-H2BDC and the overall negative charge of the dyes IC and O2, as well as the formation of donor–acceptor complexes between the free electrons of the linker's –OH and amine groups and the heteroatoms of the dyes, comparable to the cationic dye RhB which is more likely to create repulsion at the material surface, and associated theoretical studies have shown that the dyes are favorably adsorbed onto the material surface by diffusion. This observation shows that adsorption of the RhB dye was more favorable in the pores of the NH2-UiO-66 material and the pi–pi stacking interaction between the dye's benzene rings and the H2N-H2BDC linker.9
Experimental adsorption isotherms for the dyes IC, O2 and RhB were fitted with Langmuir, Freundlich and Toth models, in order to elucidate the favorable adsorption mechanism. Fig. 6 shows the fitting curves; these isotherms also show a concavity along the x-axis, suggesting that it becomes increasingly difficult to find an open site for a fresh solute molecule as the substrate sites fill up. The Langmuir isotherm accounts for monolayer adsorption with finite adsorption sites on the adsorbate surface. Derived parameters qmL, KL and RL are shown in Table S8 (ESI†). The maximum dye adsorption values of the Langmuir isotherm for RhB, O2 and IC are 1![[thin space (1/6-em)]](https://www.rsc.org/images/entities/char_2009.gif) 417330.00, 558.919 and 433640.98 mg g−1, respectively. These values demonstrate that the Langmuir model is not suitable to explain the adsorption phenomenon,39 which is confirmed by the lack of correlation between qmax and experimental values and by the low value of R2. However, Langmuir separation factors RL were calculated using eqn (S1) (ESI†) and optimum concentrations. The RL obtained were 0.19719, 0.09803 and 0.723327 for IC, O2 and RhB, respectively, with RL ranging from 0 to 1, showing that adsorption is favorable on monolayers.2 The Freundlich isotherm is used to characterize adsorption on multilayer adsorbates. The KF and nF values of the Freundlich model obtained are presented in Table S8 (ESI†). The KF values obtained for the IC and O2 dyes are higher than those for RhB, while the nF values are almost the same. The R2 values obtained for the Freundlich model are below 85%, which also shows that the Freundlich model is not suitable for characterizing the adsorption mechanism, as it also presents large error function values. The Toth isotherm has the advantage of combining the Langmuir and Freundlich models and can be modeled for heterogeneous adsorptions; the Toth model suggests that adsorption energy is heterogeneously distributed over the adsorbate surface. The parameters derived from the Toth model are shown in Table S8 (ESI†). The R2 values of 0.982, 0.991 and 0.852 for the dyes IC, O2 and RhB, respectively obtained are close to one, showing that the Toth model is more favorable than the Langmuir and Freundlich models, due to the heterogeneity of the adsorption surface energy.1 This correlates with the low values of the HYBRID, ERM, REQM and χ2 error functions. The values of n produced by Toth's model deviate from 1, showing that adsorption of the dyes IC, O2 and RhB is more favorable on a monolayer and not on a “heterogeneous system”.56 This implies that during adsorption of the organic dye onto the NH2-UiO-66 material, the molecules are bound in the micropores and mesopores of NH2-UiO-66.6
417330.00, 558.919 and 433640.98 mg g−1, respectively. These values demonstrate that the Langmuir model is not suitable to explain the adsorption phenomenon,39 which is confirmed by the lack of correlation between qmax and experimental values and by the low value of R2. However, Langmuir separation factors RL were calculated using eqn (S1) (ESI†) and optimum concentrations. The RL obtained were 0.19719, 0.09803 and 0.723327 for IC, O2 and RhB, respectively, with RL ranging from 0 to 1, showing that adsorption is favorable on monolayers.2 The Freundlich isotherm is used to characterize adsorption on multilayer adsorbates. The KF and nF values of the Freundlich model obtained are presented in Table S8 (ESI†). The KF values obtained for the IC and O2 dyes are higher than those for RhB, while the nF values are almost the same. The R2 values obtained for the Freundlich model are below 85%, which also shows that the Freundlich model is not suitable for characterizing the adsorption mechanism, as it also presents large error function values. The Toth isotherm has the advantage of combining the Langmuir and Freundlich models and can be modeled for heterogeneous adsorptions; the Toth model suggests that adsorption energy is heterogeneously distributed over the adsorbate surface. The parameters derived from the Toth model are shown in Table S8 (ESI†). The R2 values of 0.982, 0.991 and 0.852 for the dyes IC, O2 and RhB, respectively obtained are close to one, showing that the Toth model is more favorable than the Langmuir and Freundlich models, due to the heterogeneity of the adsorption surface energy.1 This correlates with the low values of the HYBRID, ERM, REQM and χ2 error functions. The values of n produced by Toth's model deviate from 1, showing that adsorption of the dyes IC, O2 and RhB is more favorable on a monolayer and not on a “heterogeneous system”.56 This implies that during adsorption of the organic dye onto the NH2-UiO-66 material, the molecules are bound in the micropores and mesopores of NH2-UiO-66.6
 |
| | Fig. 6 Impact of concentration on the adsorption of dye using NH2-UiO-66 and non-linear experimental data fitted with Langmuir, Freundlich and Toth models for indigo carmine (a), rhodamine B (b) and orange 2 (c). | |
3.6. Kinetic studies
Non-linear pseudo-first-order, pseudo-second-order, Elovich and intra-particle diffusion were applied to the experimental data for the kinetic studies. Fig. 7(a)–(d) show the experimental data obtained with the effect of contact time and the fitting curves obtained.2,6 Adsorption kinetics provide insight into the reaction mechanism by estimating the adsorption rate during the adsorption process. Fig. 7a shows that the cationic RhB dye reaches its adsorption equilibrium just after the first 20 minutes, and the material surface becomes saturated, as shown by the platform obtained, whereas the anionic dyes IC and O2 show a different behavior; the adsorbed quantities of IC and O2 increase progressively with adsorption time until around 80 minutes before reaching saturation, showing the attachment of IC and O2 dye molecules in the micropores and then the mesopores of the NH2-UiO-66 material.6 The low adsorption capacity of the RhB cationic dye could be due to electrostatic repulsions between the positive charge of the RhB dye and the –NH3+ groups of the NH2-UiO-66 material, comparable to the negative charge of IC and O2.
 |
| | Fig. 7 Impact of stirring time on the adsorption of dyes using NH2-UiO-66 (a), non-linear experimental data fitted with pseudo first-order, pseudo second-order, intraparticle diffusion and the Elovich model for indigo carmine (b), rhodamine B (c) and orange 2 (d). | |
Fig. 7(b)–(d) show the non-linear fitting curves associated with each of the models, and Table S8 (ESI†) groups together the constants for these models. Table S8 (ESI†) shows that the pseudo-first-order, Elovich and intra-particle diffusion models have higher χ2 error values than the pseudo-second-order model. Compared with the pseudo-first-order model and the intra-particle diffusion model, the pseudo-second-order and Elovich models also have lower HYBRID and REQM error levels. The pseudo-first-order model describes the multilayer adsorption taking place at the material surface. It involves a van der Waals-type interaction between the dye and the NH2-UiO-66 material. These interactions therefore highlight the physical adsorption between adsorbent and adsorbate.57 In contrast, the pseudo-second-order model asserts that the interaction between adsorbate and adsorbent is weak. The pseudo-first-order and pseudo-second-order models exhibit similar behaviors, characteristic of type I isotherms, comparable to intra-particle diffusion. The Elovich model accounts for a distinct surface energy distribution. However, the coefficient of determination values R2 > 0.95 for all four models accurately describe the adsorption process, implying competition between physisorption and chemisorption.6 Nevertheless, the Elovich model proved more accurate; these results suggest that the Elovich model more accurately accounts for the adsorption kinetics of IC, O2 and RhB dyes.
3.7. Thermodynamic study
The thermodynamic variables for adsorption of the dyes IC, O2 and RhB presented in Table S10 (ESI†) were calculated from the rate constants (K) obtained for reactions carried out at 25 °C, 35 °C and 45 °C with dye solutions obtained at equilibrium. Fig. 8a shows that adsorbed quantities decrease with increasing temperature, implying an exothermic process during the adsorption.58 Increasing temperature provides the adsorption system with more energy for the adsorbed dye molecules, increasing the rate of the adsorption reaction, showing that their mobility can avoid some favorable adsorption conditions.42 ΔH° and ΔS° were determined from the slope and y-intercept of the plot of lnK versus 1/T (Fig. 8b), the van't Hoff equation (eqn (8)) and Gibbs free energy (eqn (9)), and the rate constant Kc = Qe/Ce. The ΔH° obtained are −81.18, −64.60 and −17.05 kJ mol−1 for dyes IC, O2 and RhB, respectively, and these values which range between 5–40 kJ mol−1 for RhB dye and 40–800 kJ mol−1 for IC and O2 dyes show that physisorption is present during the adsorption of RhB and chemisorption is present during the adsorption of IC and O2 dyes, respectively.30 Furthermore, the ΔS° obtained was −243.22, −70.08 and −196.05 J mol−1 K−1 for the IC, RhB and O2 dyes, respectively. The standard free energy change (ΔG°) was negative for the IC and O2 dyes at all temperatures, while for the same temperature values it was positive for the RhB dye. This value indicates that adsorption is not spontaneous for the RhB dye but it is for the other two dyes at this temperature. However, the negative values of ΔH° and ΔS° indicate that adsorption will be spontaneous at lower temperatures32 through hydrogen bonding and/or dipole–dipole interactions,27 in which case ΔH° acts as a driving force for adsorption.42| |  | (8) |
 |
| | Fig. 8 Impact of the temperature on the adsorption of dyes using NH2-UiO-66 (a) and a plot of ln(Kc) versus 1/T (K−1) (b). | |
3.8. Reusability and comparison with the literature
The stability of NH2-UiO-66 as an adsorbent for IC, RhB and O2 dye removal was evaluated over 5 consecutive cycles of adsorption tests carried out under optimal conditions. Fig. 9 shows the results obtained, which demonstrate significant regeneration of dye removal. The adsorption capacity of indigo carmine remains quite high, compared with those of rhodamine B and orange 2. The adsorption capacity of orange 2 decreased by 6% between the first and last cycles, while that of rhodamine B decreased by 5%. These observations can be attributed to the fraction of undesorbed organic dyes in the MOF cavities,1 which occupy the adsorption sites for the next adsorption cycle. In contrast, the difference in adsorption capacity for indigo carmine was less than 5%, with an adsorption capacity of 97%. The high adsorption capacity of indigo carmine may be due to the strong interactions between the positively charged amines of NH2-UiO-66 and the negative charges of the IC dye. Table S11 (ESI†) shows the adsorption capacity of other dyes using NH2-UiO-66 and other materials. Table S11 (ESI†) shows that NH2-UiO-66 exhibits good stability and adsorption performance for IC, RhB and O2 dyes, comparable to other adsorbents used at the same adsorption temperature.33 In a recent study, He and coworkers showed poor adsorption performance for rhodamine, with a capacity of 75.85 mg g−1 on UiO-66,28 probably due to the absence of amine groups in the linker which are likely to create electrostatic repulsions during the adsorption. Nevertheless, the stability of NH2-UiO-66 shows its effectiveness in being regenerated and reused for IC, RhB and O2 removal.
 |
| | Fig. 9 Performance of NH2-UiO-66 for five consecutive cycles of indigo carmine (IC), rhodamine B (RhB) and orange 2 (O2) adsorption. | |
3.9. Adsorption mechanism
To further explore the adsorption mechanism of IC, RhB and O2, XRD, FT-IR, SEM, and EDX/EDX-elemental mapping analyses of the NH2-UiO-66 material after adsorption were carried out. The XRD pattern (Fig. 10a) showed all the same reflections with the same crystal planes as the fresh NH2-UiO-66 material, showing that the crystal structure of NH2-UiO-66 was not altered after adsorption.20 Nevertheless, it can be observed that the intensities of the first two standard peaks characteristic of NH2-UiO-66 are lower for the dyes IC, RhB and O2 than for the fresh sample, proving that the dyes are bound to the surface and active sites of the pores of NH2-UiO-66, which could hinder the reflection of electrons during the XRD measurement. A similar relationship was observed by Zhang et al. (2019).58
 |
| | Fig. 10 PXRD pattern (a) and FT-IR spectra (b) of fresh NH2-UiO-66 and after adsorption of dyes, EDX/EDX-mapping of NH2-UiO-66 after indigo carmine (IC) (c), rhodamine B (d) (RhB) and orange 2 (O2) (e) adsorption. | |
The FT-IR spectra presented in Fig. 10b after adsorption of IC, RhB and O2 revealed the same vibrational bands observable in fresh NH2-UiO-66 material, however, the vibrational band around 3350 cm−1 of bound OH and the overlap of O–H and N–H groups appears more visible and intense for NH2-UiO-66 material after adsorption, showing that hydrogen bonding of the –NH2 groups of the H2N-H2BDC linker is involved during adsorption.6,33 In addition, the peaks of the CO, C–N and C–O groups at 1564 cm−1, 1253 cm−1 and 1425 cm−1 of NH2-UiO-66 after adsorption have shifted and show lower intensities comparable to the fresh sample. This could be due to electrostatic interactions between the positively charged RhB dye and the negatively charged NH2-UiO-66 surface,58 as well as π–π stacking interactions of the aromatic dye cores and H2N-H2BDC linker;42 all dyes contain aromatic rings and their interaction might lead to peak shifts from 1564 to 1560 cm−1, from 1253 to 1248 cm−1 and from 1425 to 1420 cm−1 for the CO, C–N and C–O groups, respectively, while the large size of the RhB dye favors its attachment to the NH2-UiO-66 surface via π–π stacking interactions.58 In addition, the spectra of the negative dyes IC and O2 show new bands at 1093 cm−1, which could be due to the presence of the SO group of IC and O2 adsorbed in the pores of the Zr6O4(OH)4 bound to –OOC–C6H3(NH2)–COO– and on the material surface; C–S groups are also observable at 620 cm−1. These observations indicate the possibility of an interaction between the sulfonate groups of the anionic dyes and the –OH groups of Zr6 metals in Zr6O4(OH)4.33
The associated SEM analyses (Fig. S7, ESI†) showed similar morphologies to the fresh samples, demonstrating the stability of the material used after adsorption cycles. EDX analysis of the fresh sample revealed that the four constituent atoms of the NH2-UiO-66 material were Zr (70%), O (16%), C (12%) and N (2%). However, after adsorption, EDX spectra of the NH2-UiO-66 material show five atoms, including four atoms of the initial material in the case of IC and O2 adsorption (Fig. 10(c) and (e)). Sulfur, the fifth atom, is certainly derived from the dyes, as the structures of these two elements contain S. The EDX spectrum (Fig. 10d) of RhB shows more C element comparable to the fresh sample, probably due to the presence of RhB dye molecules adsorbed on the surface of NH2-UiO-66 materials. The percentages of the elements have changed in all three dye situations compared to the original material. The alteration in the percentages of the constituent elements of carbon attests to the alteration of its surface, indicating that additional atoms have been attached to it, probably by the dye in solution. The homogeneous distribution of the elements Zr, O, C, N and S in the EDX-elemental mapping (Fig. 10(c)–(e)) is evidence of the dyes IC, RhB and O2 adsorbed in the pores and on the surface of the NH2-UiO-66 material.28,33
4. DFT studies and molecular simulation
4.1. Quantum chemical calculations
Fig. S8 (ESI†) presents the XRD pattern of the synthesised and theoretical NH2-UiO-66 material, and it is observable that the two XRDs are well matched. The computer-based DFT approach is a technique used to elucidate the correlation between the molecular structure of adsorbates and their ability to adsorb to the adsorbent surface. This ability to interact depends mainly on their molecular arrangement in space and their electronic distribution on the frontier molecular orbitals (FMOs). FMOs are the most occupied molecular orbital (HOMO) and the lowest unoccupied molecular orbital (LUMO).37Fig. 11 shows the optimized geometric, HOMO and LUMO structures of the three dyes IC, RhB and O2. For O2, the HOMOs are strongly delocalized around the nitrogen atom, while the LUMOs are delocalized on one of the aromatic rings. In the IC molecule, the HOMOs and LUMOs are evenly distributed over the two heterocycles containing the nitrogen atom, as shown in the optimised structure. As in the RhB molecule, the electron density of the HOMO is low, while the LUMOs are distributed over the two aromatic rings. The electron density of the HOMOs and LUMOs indicates a strong capacity to donate and receive electrons at electrophilic centers. These centers are active sites for nucleophile interactions and promote extensive interaction with the metal surface.
 |
| | Fig. 11 Optimized geometric structures, and HOMO and LUMO structures of IC, RhB and O2. | |
Quantum chemical parameters: EHOMO, ELUMO and the gap energy (Egap) were calculated to estimate the structural stability and chemical reactivity of the molecules. Table S12 (ESI†) shows the energies of the quantum descriptors of the compounds studied; a low value for ELUMO and Egap and a high value for EHOMO indicate the high adsorption capacity of IC and O2.59 It can be seen from Table S12 (ESI†) that the lowest Egap value is 0.043 eV corresponding to the IC molecule, indicating that the IC molecule has the highest chemical reactivity and low kinetic stability. The order of reactivity for the dye molecules studied is as follows: IC > O2 > RhB. This is further confirmed by calculating the fraction of the electrons transferred (ΔN) from the dye molecules to the adsorbent surface. It has also been reported that the ΔN value is used to measure the ability of a chemical system to transfer electrons to the adsorbent surface. For the molecules studied, the electron transfer capacity follows the following order: IC > O2 > RhB. From the above results, we can conclude that the compounds studied can be translated into Lewis bases and can therefore form coordination bonds with the empty orbitals of the adsorbent thanks to the free doubles of the nitrogen atoms. However, although compound IC is more reactive, the quantum descriptors show that all three compounds can interact with the adsorbent surface.
4.2. Molecular dynamics simulation
The interaction between the IC, O2 and RhB dyes and the NH2-UiO-66 surface in different medium was investigated using the molecular dynamics simulation technique via the Forcite and adsorption locator modules, respectively.59 This approach is based on computer calculations that provide qualitative and quantitative information on the interactions involved during the adsorption, as well as on the adsorption mechanism.2 The most stable configuration of IC, O2 and RhB dyes on the NH2-UiO-66 surface in acidic, neutral and basic medium is illustrated in Fig. 12 and Fig. S9 (ESI†), where it can be seen that the IC, O2 and RhB dyes are adsorbed in an almost flat orientation on the surface of NH2-UiO-66. This orientation can be explained by the formation of chemical bonds between IC, O2 and RhB molecules and the NH2-UiO-66 surface.41Fig. 12 shows that IC and O2 molecules can be adsorbed in basic and neutral acidic media, while the RhB molecule is at a greater distance from the NH2-UiO-66 surface in basic media, indicating that the RhB molecule is less adsorbed in this medium than in others, due to electrostatic repulsion.
 |
| | Fig. 12 Front views of the most stable low-energy configuration for the adsorption of IC (a and b), O2 (c and d) and RhB (e and f) dyes with NH2-UiO-66 at 298 K in acidic, basic and neutral medium. | |
The adsorption energies of the molecules studied on the NH2-UiO-66 surface are presented in Table 4. The total energy (ET) of the adsorbent–adsorbate configuration is the sum of the adsorbate component energies, the rigid adsorption energy (RAE) and the deformation energy (Edeformation). The adsorbent energy is taken to be zero. Adsorption energy (EAds) is the energy released when the expanded components of the adsorbate are adsorbed onto the adsorbent. Deformation energy is the energy released when the adsorbed components are released onto the adsorbent surface.60 The total, adsorption and interaction energy of each dye was calculated using eqn (S3) and (S4) (ESI†), considering the optimum pH values for each dye under the experimental conditions. The experimental study showed that the adsorption of RhB took place under basic conditions, that of O2 under neutral conditions and that of IC under acidic conditions. It can be seen that the adsorption energies are all negative, suggesting an exothermic, stable and strong adsorption process for all the molecules studied on the NH2-UiO-66 surface.41,61 Furthermore, the total energy values for the IC and O2 systems are negative, indicating the spontaneous nature of the adsorption process, while the positive total energy value for the RhB system indicates a non-spontaneous process. This highlights the importance of MOF pore structure and medium pH, which contribute significantly to the adsorption of these molecules. Indeed, heteroatoms such as nitrogen, sulfur and oxygen, as well as the “pi” electrons of the aromatic ring, act as an adsorption site during the NH2-UiO-66-dye interaction. The negative values of the total energies for IC and O2 indicate that the adsorption process is favorable for both, while the positive value of that of RhB shows that the adsorption process is less favorable on the MOF material. This result is consistent with the experimental study and DFT calculations. Consequently, the theoretical and experimental results indicate that NH2-UiO-66 is a better adsorbent for the removal of anionic dyes than cationic dyes.23,25
Table 4 Adsorption energy (kcal mol−1) of IC, O2 and RhB dyes
| Compounds |
E
total
|
E
Ads
|
RAE |
E
deformation
|
| IC + 200H2O, 5HCl |
−187.286 |
−966.362 |
−281.178 |
−966.080 |
| O2 + 200H2O |
−13.803 |
−706.154 |
−291.129 |
−415.025 |
| RhB + 200H2O, 5NaOH |
63.541 |
−506.394 |
−272.548 |
−233.846 |
4.3. Probability energy distribution
MD simulation was used to determine the potential energy distribution in order to explore competing sites. The strength and stability of the interaction increases with the value of the adsorption energy.59,62 In addition, the adsorbate–adsorbent interaction energy is described by the probability energy distribution.63Fig. 13(a)–(c) show the interactions of IC, O2 and RhB dyes on the NH2-UiO-66 surface at 298 K in different media.
 |
| | Fig. 13 Probability of NH2-UiO-66 energy distribution from IC (a), O2 (b) and RhB (c) adsorption at 298 K. | |
For the IC dye (Fig. 13a), a competition for the distribution energy can be observed in different media. It can be seen that in the basic medium, IC has the highest interaction energy (−446 kcal mol−1), indicating the strong adsorption capacity of IC on the NH2-UiO-66 surface in the basic medium, followed by the neutral medium with an interaction energy of −443 kcal mol−1 and finally the acidic medium (−438 kcal mol−1). For the O2 dye (Fig. 13b), we observe that the O2 molecule in the acidic medium has the highest distribution energy values (−269 kcal mol−1) and the highest probability energy distribution (P(E)) (−0.47), indicating that the O2 molecule is more adsorbed and stable on the NH2-UiO-66 surface in the acidic medium than in other media. Fig. 13(c) shows that there is a competition in distribution energy between the RhB dye and the NH2-UiO-66 surface in acidic, basic and neutral media with a value of −966.11 kcal mol−1, while in acidic media the RhB dye interacts strongly with the adsorbent surface with a value of 0.45 for the probability energy distribution.25,51 Although the distribution energies are identical, the p(E) values show that the adsorbent–adsorbate complex is stable in acidic media,2 which could explain the low adsorption capacity of RhB in this medium. These results are also similar to those obtained experimentally.
5. Conclusion
NH2-UiO-66 obtained by the solvothermal method was characterized using XRD, FTIR, SEM/EDX, N2 sorption and TG/DTG analysis techniques. NH2-UiO-66 exhibited a BET specific surface area of 1156 m2 g−1, with a total pore volume of 0.66884 cm3 g−1, a micropore surface area of 851.03 m2 g−1 and an external surface area of 305.58 m2 g−1. Thermal analysis showed that NH2-UiO-66 presented multiple step mass losses linked to the departure of –OH from water molecules, the strongly bound DMF solvent and the dehydroxylation of zirconium clusters. The dye removal performance with NH2-UiO-66 using the face central composite design (CCD) was evaluated considering initial dye concentration, adsorbent amount, pH and stirring time as main factors. The CCD model revealed that dye concentration, stirring time and adsorbent amount had significant linear and crossover effects for all three dyes. The mathematical model adopted was significant with 95.0% confidence for the cross and quadratic terms for all 4 factors. NH2-UiO-66 showed high adsorption capacities of 265.8 mg g−1, 229.8 mg g−1 and 91.6 mg g−1 for IC and O2 and RhB dyes, respectively, under optimal conditions. The removal of IC and O2 was fastest within 60 minutes, due to favorable occupancy of the NH2-UiO-66 adsorption site. The Toth model was the most accurate fitting model, comparable to the Langmuir and Freundlich models, with R2 close to 1. The Elovich kinetic model showed the best fitting accuracy with R2 > 0.95 for all three dyes, comparable to the pseudo-first-order and pseudo-second-order intraparticle diffusion model, implying competition between chemisorption and physisorption. Molecular DFT studies and Monte Carlo simulations have shown that the LUMOs are delocalized on the aromatic rings, while the HOMOs are strongly delocalized around the nitrogen atom; and the dyes have a high capacity to interact with the NH2-UiO-66 surface. The observed adsorption mechanism is linked to the electrostatic attractions and π–π interactions between the dye's benzene rings and the organic linker. FT-IR and SEM-EDX analyses of NH2-UiO-66 after adsorption show that the sulfonate groups of the anionic dyes can interact with the free OH of the Zr6-node metals and the sulfur atom present. The effects of inorganic ions and organic matter will be the focus of future work.
Author contributions
Kora Lucresse Tiomo Nguena: methodology, conceptualization, formal analysis and investigation, writing – original draft preparation; Cyrille Ghislain Fotsop: methodology, formal analysis and investigation; Aurelien Bopda and Donald Raoul Tchuifon Tchuifon: methodology, formal analysis and investigation; Fredy Harcel Kamgang Djioko formal analysis and investigation; Alvine Mirabelle Soukoua Ngueabouo: methodology; Chinyere Ada Madu and Fabian I. Ezema: review and editing, supervision; Emeka Emmanuel Oguzie: supervision, review and editing.
Ethical approval
No human participants or biological materials were involved in this research.
Consent to publication
All authors have read and approved the final manuscript for publication.
Data availability
Data will be made available on request.
Conflicts of interest
No conflicts of interest are reported for this document.
Acknowledgements
The authors wish to thank the World Bank for its financial support for the second African Centers of Excellence in Higher Education for Development Impact project and the German Academic Exchange Service. The authors gratefully acknowledge the financial support of the World Bank for the second African Centers of Excellence in Higher Education for Development Impact project (P169064, IDA no. 6510-NG). They would also like to thank the German Academic Exchange Service (DAAD) for its financial support.
References
- M. S. Embaby, S. D. Elwany, W. Setyaningsih and M. R. Saber, The adsorptive properties of UiO-66 towards organic dyes: a record adsorption capacity for the anionic dye Alizarin Red S, Chin. J. Chem. Eng., 2018, 26, 731–739 CrossRef CAS.
- F. H. Kamgang Djioko,
et al., Efficient removal of pharmaceutical contaminant in wastewater using low-cost zeolite 4A derived from kaolin: experimental and theoretical studies, Mater. Chem. Phys., 2024, 315, 128994 CrossRef CAS.
- A. Ashfaq,
et al., Fabrication of Novel Agrowaste (Banana and Potato Peels)-Based Biochar/TiO2 Nanocomposite for Adsorption of Cr(VI), Statistical Optimization via RSM Approach, Polymers, 2022, 14, 2644 CrossRef CAS PubMed.
- T. Robinson, R. Marchant and P. Nigam, Remediation of dyes in textile effluent: a critical review on current treatment technologies with a proposed alternative, Bioresour. Technol., 2001, 77(3), 247–255 CrossRef CAS PubMed.
- S. Preethi, A. Sivasamy, S. Sivanesan, V. Ramamurthi and G. Swaminathan, Removal of Safranin Basic Dye from Aqueous Solutions by Adsorption onto Corncob Activated Carbon, Ind. Eng. Chem. Res., 2006, 45, 7627–7632 CrossRef CAS.
- S. N. Tambat,
et al., Hydrothermal synthesis of NH2-UiO-66 and its application for adsorptive removal of dye, Adv. Powder Technol., 2018, 29, 2626–2632 CrossRef CAS.
- G. T. Kenda,
et al., Green synthesis of magnetic biochars derived from biobased orange peel materials as sustainable heterogeneous catalytic supports for the Fenton process, Arabian J. Chem., 2024, 17, 105502 CrossRef CAS.
- S. G. Mokue Mafo,
et al., Low-cost magnetic carbons-based rubber seed husks materials for highly efficient removal for reactive black 5 and reactive blue 19 textile dyes from wastewater, Int. J. Environ. Anal. Chem., 2023, 1–25, DOI:10.1080/03067319.2023.2269857.
- A. R. Putra Hidayat,
et al., Selective adsorption of anionic and cationic dyes on mesoporous UiO-66 synthesized using a template-free sonochemistry method: kinetic, isotherm and thermodynamic studies, RSC Adv., 2023, 13, 12320–12343 RSC.
- Y. Qiu, Z. Zheng, Z. Zhou and G. D. Sheng, Effectiveness and mechanisms of dye adsorption on a straw-based biochar, Bioresour. Technol., 2009, 100, 5348–5351 CrossRef CAS PubMed.
- J. N. Ndongmo,
et al., Synthesis and characterization of peanut shell-derived ferromagnetic activated carbon: application in the Fenton process for the degradation of methyl orange, Front. Environ. Chem., 2024, 5, 1375705 CrossRef.
- T. Feze Fanle,
et al., Design and characterisation of activated magnetic zeolite 4A from naturally occurring kaolin clay of Cameroonian origin for optimised dye removal by Fenton-like degradation, Int. J. Environ. Anal. Chem., 2024, 1–29, DOI:10.1080/03067319.2024.2389417.
- F. P. Tchoumi,
et al., Polymer-free nanocomposite from zeolite and acetylene carbon black as glassy carbon modifier platform for simultaneous electrochemical quantification of acetaminophen and caffeine, J. Appl. Electrochem., 2024, 54, 1901–1918 CrossRef CAS.
- G. Deffo,
et al., Evaluation of two core–shell (Ag2S@- and Bi2S3@-) sensors based on a metal–organic framework (NH2-MIL-125-Ti)/polyaniline for the electroanalysis of uric acid in urine samples, Mater. Adv., 2024, 5, 3683–3695 RSC.
- L. A. Vomo,
et al., Synthesis of Zinc Oxide Nanoparticles Based on Coffee Husks Embedded on Mesoporous Silica for the Sensing of Acetaminophen, ChemElectroChem, 2024, 11, e202400088 CrossRef CAS.
- E. Abdel Azim, M. Samy, M. Hanafy and H. Mahanna, Novel mint-stalks derived biochar for the adsorption of methylene blue dye: effect of operating parameters, adsorption mechanism, kinetics, isotherms, and thermodynamics, J. Environ. Manage., 2024, 357, 120738 CrossRef CAS PubMed.
- K. Mensah, H. Shokry, M. Elkady, H. B. Hawash and M. Samy, Enhanced photocatalytic degradation of dyes using a novel waste toner-based TiO2/Fe2O3@nanographite nanohybrid: a sustainable approach, Water Sci. Eng., 2024, 17, 226–235 CrossRef.
- K. Mensah, M. Samy, H. Mahmoud, M. Fujii and H. Shokry, Rapid adsorption of sulfamethazine on mesoporous graphene produced from plastic waste: optimization, mechanism, isotherms, kinetics, and thermodynamics, Int. J. Environ. Sci. Technol., 2023, 20, 9717–9732 CrossRef CAS.
- P.-M. A. K. Sone,
et al., Innovative ternary bismuth oxychloride/bismuth oxide/carbon nanotubes induced excellent solar light-driven activity toward photomineralisation of diclofenac: impact of metastable β-Bi2O3 inserted and electron-hole separation, Results Chem., 2024, 7, 101497 CrossRef CAS.
- H. Molavi, Enhancing CO2/N2 adsorption selectivity via post-synthetic modification of NH2-UiO-66(Zr), Microporous Mesoporous Mater., 2018, 257, 193–201 CrossRef CAS.
- A. Zemfack Mekuiko,
et al., Tailoring activated carbons based cocoa pods lignocellulosic materials for Reactive blue 19 adsorption: optimization, adsorption isotherm and kinetic investigation, Desalin. Water Treat., 2023, 300, 144–157 CrossRef.
- G. F. K. Nindjio,
et al., Lignocellulosic-Based Materials from Bean and Pistachio Pod Wastes for Dye-Contaminated Water Treatment: Optimization and Modeling of Indigo Carmine Sorption, Polymers, 2022, 14, 3776 CrossRef CAS PubMed.
- G. N. Kouahou,
et al., Exploring the Sorption Mechanism of Endocrine Disruptors on a Newly Developed Cost-Effective Microporous Material Derived from Puck (Afroxtyrax lepidophyllus) Shell: Experimental and Theoretical Approaches, Water, Air, Soil Pollut., 2024, 235, 359 CrossRef CAS.
- C. B. Ngolong Ngwethe,
et al., Regeneration and Reusability of Bleaching Earth as a Sustainable Material for Tartrazine Yellow (E102) Removal: Insights into Kinetic Mechanisms, Sustainable Chem. Eng., 2024, 450–470 CrossRef.
- F. H. K. Djioko,
et al., Unraveling the sorption mechanisms of ciprofloxacin on the surface of zeolite 4A (001) in aqueous medium by DFT and MC approaches, Appl. Surf. Sci. Adv., 2024, 19, 100542 CrossRef.
- C. L. Luu, T. T. V. Nguyen, T. Nguyen and T. C. Hoang, Synthesis, characterization and adsorption ability of UiO-66-NH2, Adv. Nat. Sci.: Nanosci. Nanotechnol., 2015, 6, 025004 Search PubMed.
- Y. Li,
et al., Microwave-assisted synthesis of UIO-66 and its adsorption performance towards dyes, CrystEngComm, 2014, 16–30 Search PubMed.
- Q. He, Q. Chen, M. Lü and X. Liu, Adsorption Behavior of Rhodamine B on UiO-66, Chin. J. Chem. Eng., 2014, 22, 1285–1290 CrossRef CAS.
- L. Shen, W. Wu, R. Liang, R. Lin and L. Wu, Highly dispersed palladium nanoparticles anchored on UiO-66(NH2) metal–organic framework as a reusable and dual functional visible-light-driven photocatalyst, Nanoscale, 2013, 5, 9374 RSC.
- C. L. Luu, Synthesis, characterization and adsorption ability of UiO-66-NH2, Nanosci. Nanotechnol., 2015, 6(2), 025004 Search PubMed.
- W. Zhang, H. Huang, C. Zhong and D. Liu, Cooperative effect of temperature and linker functionality on CO2 capture from industrial gas mixtures in metal–organic frameworks: a combined experimental and molecular simulation study, Phys. Chem. Chem. Phys., 2012, 14(7), 2317–2325 RSC.
- J. H. Cavka,
et al., A New Zirconium Inorganic Building Brick Forming Metal Organic Frameworks with Exceptional Stability, J. Am. Chem. Soc., 2008, 130(42), 13850–13851 CrossRef PubMed.
- Q. Chen, Selective adsorption of cationic dyes by UiO-66-NH2, Appl. Surf. Sci., 2015, 327(1), 77–85 CrossRef CAS.
- A. M. S. Ngueabouo,
et al., Strategy for optimizing the synthesis and characterization of activated carbons obtained by chemical activation of coffee husk, Mater. Adv., 2022, 3, 8361–8374 RSC.
- E. T. Acar, An experimental and theoretical investigation of cationic azine dye adsorption on natural sepiolite in single and multi-component systems, Chem. Eng. Res. Des., 2022, 187, 507–515 CrossRef CAS.
- M. Athari, M. Fattahi, M. Khosravi-Nikou and A. Hajhariri, Adsorption of different anionic and cationic dyes by hybrid nanocomposites of carbon nanotube and graphene materials over UiO-66, Sci. Rep., 2022, 12, 20415 CrossRef CAS PubMed.
- M. Khnifira,
et al., A combined DFT, Monte Carlo, and MD simulations of adsorption study of heavy metals on the carbon graphite (111) surface A combined DFT, Monte Carlo, and MD simulations of adsorption study of heavy metals on the carbon graphite (111) surface, Chem. Phys. Impact, 2022, 5, 100121 CrossRef.
- G. Nzetchuen Kouahou,
et al., Optimized preparation of activated carbon with high porosities based on puck shells (Afrostyrax lepidophyllus) by response surface methodology and physico-chemical characterization, R. Soc. Open Sci., 2023, 10, 230911 CrossRef.
- I.-H. Tiotsop Kuete,
et al., Adsorption of Indigo Carmine onto Chemically Activated Carbons Derived from the Cameroonian Agricultural Waste Garcinia cola Nut Shells and Desorption Studies, J. Chem., 2022, 1–19 Search PubMed.
- J. Zhu, G. Zhou, F. Niu and Y. Shi, Understanding the inhibition performance of novel dibenzimidazole derivatives on Fe (110) surface: DFT and MD simulation insights, J. Mater. Res. Technol., 2022, 17, 211–222 CrossRef CAS.
- M. Khnifira, S. El Hamidi and M. Sadiq, Applied Surface Science Adsorption mechanisms investigation of methylene blue on the (0 0 1) zeolite 4A surface in aqueous medium by computational approach and molecular dynamics, Appl. Surf. Sci., 2022, 572, e08961 CrossRef.
- C. Nanthamathee, C. Chantarangkul, C. Jakkrawhad, A. Payaka and P. Dechatiwongse, Fine-Tuning Dye Adsorption Capacity of UiO-66 by Mixed-Ligand Approach, Heliyon, 2021, 8(2), 1–12 Search PubMed.
- L. Ding,
et al., Functionalization of UiO-66-NH2 with rhodanine via amidation: towarding a robust adsorbent with dual coordination sites for selective capture of Ag(I) from wastewater, Chem. Eng. J., 2020, 382, 123009 CrossRef CAS.
- J. Lee,
et al., UiO-66-NH2 and Zeolite-Templated Carbon Composites for the Degradation and Adsorption of Nerve Agents, Molecules, 2021, 26, 3837 CrossRef CAS PubMed.
- J. Hou,
et al., Synthesis of UiO-66-NH2 derived heterogeneous copper(II) catalyst and study of its application in the selective aerobic oxidation of alcohols, J. Mol. Catal. A: Chem., 2015, 407, 53–59 CrossRef CAS.
- M. Fiaz and M. Athar, Enhancing the hydrogen and oxygenevolution reaction efficiency of amine functionalized MOF NH2-UiO-66 via incorporation of CuO nanoparticles, Catal. Lett., 2020, 150, 3314–3326 CrossRef CAS.
- S. B. L. Ngomade,
et al., Catalytic performances of CeO2@SBA-15 as nanostructured material for biodiesel production from Podocarpus falcatus oil, Chem. Eng. Res. Des., 2023, 194, 789–800 CrossRef CAS.
- S. B. L. Ngomade,
et al., Pilot-scale optimization of enhanced biodiesel production from high FFA Podocarpus falcatus oil via simultaneous esterification and transesterification assisted by zirconia-supported ZSM-5, Chem. Eng. Res. Des., 2024, 209, 52–66 CrossRef CAS.
- G. T. Kenda,
et al., Building TiO2-doped magnetic biochars from Citrus sinensis peels as low-cost materials for improved dye degradation using a mathematical approach, Appl. Surf. Sci. Adv., 2024, 19, 100554 CrossRef.
- C. D. Atemkeng,
et al., Optimization of 4-nonylphenol adsorption on activated carbons derived from safou seeds using response surface methodology, Carbon Trends, 2021, 4, 100052 CrossRef CAS.
- S. G. M. Mafo,
et al., Unravelling the efficiency removal of 2,4-dinitrophenol on coconut shell biomass-derived activated carbons theoretical and experimental investigation, Biomass Convers. Biorefin., 2024, 1–21 Search PubMed.
- K. L. T. Nguena,
et al., Mathematical modeling approach for the green synthesis of high-performance nanoporous zeolites Na–X optimized for water vapor sorption, Mater. Today Commun., 2023, 37, 107406 CrossRef CAS.
- N. N. Mzinyane, Adsorption of heavy metals from acid mine drainage using poly(hydroxamic acid) ligand, S. Afr. J. Chem. Eng., 2022, 42, 318–336 Search PubMed.
- Y.-R. Lee, K. Yu, S. Ravi and W.-S. Ahn, Selective Adsorption of Rare Earth Elements over Functionalized Cr-MIL-101, ACS Appl. Mater. Interfaces, 2018, 10, 23918–23927 CrossRef CAS PubMed.
- S. G. Mokue Mafo,
et al., Low-cost magnetic carbons-based rubber seed husks materials for highly efficient removal for reactive black 5 and reactive blue 19 textile dyes from wastewater, Int. J. Environ. Anal. Chem., 2023, 1–25, DOI:10.1080/03067319.2023.2269857.
- H. N. Tran, S.-J. You and H.-P. Chao, Fast and efficient adsorption of methylene green 5 on activated carbon prepared from new chemical activation method, J. Environ. Manage., 2017, 188, 322–336 CrossRef CAS.
- A. P. Terzyk, J. Chatłas, P. A. Gauden, G. Rychlicki and P. Kowalczyk, Developing the solution analogue of the Toth adsorption isotherm equation, J. Colloid Interface Sci., 2003, 266, 473–476 CrossRef CAS.
- H. Zhang, X. Shi, J. Li, P. Kumar and B. Liu, Selective Dye Adsorption by Zeolitic Imidazolate Framework-8 Loaded UiO-66-NH2, Nanomaterials, 2019, 9, 1283 CrossRef CAS PubMed.
- L. Kora,
et al., Molecular modelling of energy storage performance on metal organic frameworks/ethane nanoparticles nanofluids mixtures and derivatives, Mater. Today Commun., 2024, 38, 107756 CrossRef.
- M. Barour,
et al., Applied Surface Science Advances Adsorption of dyes on microwave assisted activated stalks of pepper plants: experimental, DFT and Monte Carlo simulation studies, Appl. Surf. Sci. Adv., 2023, 16, 100424 CrossRef.
- H. Zhao, Y. Yang, X. Shu, Y. Wang and Q. Ran, Adsorption of organic molecules on mineral surfaces studied by first-principle calculations: a review, Adv. Colloid Interface Sci., 2018, 256, 230–241 CrossRef CAS PubMed.
- B. Mwendapole and L. Gang, Investigation of Adsorption Behaviors of Paraffin Waxes on Iron, Iron II Oxide, and Iron III Oxide Surfaces Using the Adsorption Locator Model, Arabian J. Sci. Eng., 2022, 47, 11763–11773 CrossRef.
- H. Long,
et al., Molecular simulation of the competitive adsorption characteristics of CH4, CO2, N2, and multicomponent gases in coal, Powder Technol., 2021, 385, 348–356 CrossRef CAS.
|
| This journal is © The Royal Society of Chemistry 2025 |
Click here to see how this site uses Cookies. View our privacy policy here. 
 Open Access Article
 This Open Access Article is licensed under a Creative Commons Attribution-Non Commercial 3.0 Unported Licence
 *ab,
Cyrille Ghislain
Fotsop
*ab,
Cyrille Ghislain
Fotsop