DOI:
10.1039/D4MA00768A
(Paper)
Mater. Adv., 2025,
6, 629-640
Carbon and cobalt co-doped ZnO thin films for highly sensitive and selective ammonia detection at room temperature†
Received
31st July 2024
, Accepted 6th December 2024
First published on 13th December 2024
Abstract
This study focuses on developing room temperature (300 K) ammonia sensors utilizing carbon doped and co-doped (carbon and cobalt) zinc oxide (ZnO) thin films fabricated through the chemical spray pyrolysis technique. Spray pyrolysis is a cost-effective and scalable process for fabricating thin films for sensor applications. The structural analysis demonstrated that the deposited thin films have crystalline characteristics required for practical gas sensing applications. The gas sensing capabilities of both thin films were thoroughly investigated; notably, the carbon and cobalt co-doped ZnO sensors demonstrated good selectivity and sensitivity to ammonia gas at ambient temperature. The co-doped sensors were susceptible, detecting trace levels of ammonia even at ambient temperature. The response for 5 ppm of ammonia was 851 at 300 K, while for 50 ppm of ammonia, it was 2729. This significant attribute eliminates the need for elevated operating temperatures, reducing energy consumption and enhancing device longevity. The observed response to ammonia at 300 K underscores the potential of carbon and cobalt co-doped thin films as promising candidates for practical gas sensing applications.
1. Introduction
Thin films have high surface-to-volume ratios and act differently from bulk materials with the same chemical composition in numerous ways.1 Spray pyrolysis is a process that involves spraying the precursor solution onto a warmed substrate. The precursor solution's components react with the substrate's temperature gradient, forming the desired chemical compound. Spray pyrolysis offers the benefit of producing extraordinarily crystalline and layered structures.2 High crystallinity and multilayer structures enhance gas responsiveness and selectivity, making them fundamental properties.3
Because of the possible risks posed by volatile organic compounds (VOCs) in the atmosphere, there is an increased demand for gas sensors. Ammonia, a pungent-smelling volatile chemical, dissolves rapidly in water, yielding an ammonium hydroxide solution that can cause irritation and burns. The agriculture industry consumes 80% of the ammonia produced for fertilizers.4 Ammonia is also used to purify water, refrigerate food, and manufacture textiles, explosives, pesticides, dyes, and other items. However, continuous or increased exposure to ammonia can cause serious health problems such as eye, throat, and nose irritation, skin allergies and irritation, blindness, and respiratory and cardiovascular troubles.5,6
Room temperature gas sensors are becoming more and more significant because of their advantages in terms of safety, cost-effectiveness, and energy efficiency. They use less energy and don't require complicated heating systems because they work well in ambient environments.7 Room temperature sensors are perfect for environmental sensing, wearable electronics, and continuous health monitoring. They guarantee safe machinery operation, detect pollutants in low quantities, and offer real-time data on air quality. In medical diagnostics, they can also identify biomarkers in breath for early disease diagnosis.8 Their incorporation into IoT platforms facilitates the development of smart devices that continuously track and respond to changes in their surroundings.9
Metal oxides are employed for various applications, including energy storage, catalysis, sensing, environmental remediation, etc.10 They are well-known materials used in sensors and biosensors.11–14 They have unique surface and microstructural properties, making them valuable adsorbing sources.15 Their specific active sites and large surface area allow them to perform adsorption easily.16 The surface of metal oxides is critical for their successful interaction with target molecules. Tailoring the surface characteristics of metal oxides provides for more properties. Several studies have used metal oxide–carbon nanocomposites in supercapacitors, batteries, and photoelectrochemical water splitting. Various carbon ratios, morphologies, and metal oxides allow us to change and tune the metal oxide/carbon nanocomposite properties prior to specific applications.17 Zinc oxide (ZnO) is an attractive metal–oxide-based semiconductor with a broad bandgap (∼3.37 eV at ambient temperature) and high exciton binding energy (∼60 meV)3 along with biocompatible features, making it ideal for sensor/transducer applications.18 ZnO is one of the most significant transparent conductive oxides in thin-film photovoltaics and has been actively studied in the disciplines of electronics and optoelectronics.19,20
2. Experimental section
2.1. Thin film deposition
Thin films of ZnO were deposited on soda lime glass substrates through the chemical spray pyrolysis method. Zinc nitrate hexahydrate (Sigma-Aldrich), cobalt(II) nitrate hexahydrate, and hexamethylenetetramine (Sigma-Aldrich) were used as precursors. The substrate was cleaned with de-ionized water, followed by sonication in acetone, isopropyl alcohol, and water each for 10 min. 0.1 M solution of zinc nitrate in 15 mL of de-ionized water was prepared and was kept for constant stirring. Similarly, 0.1 M solution of hexamethylenetetramine was prepared in 15 mL of de-ionized water and stirred well. Then, the two solutions were mixed thoroughly and stirred for 20 min, and the final precursor solution was thus prepared. The precursor solution was sprayed onto the glass substrates using the custom-made chemical spray pyrolysis setup, shown in Fig. 1. Compressed air was used as the carrier gas, with a pressure of 4 MPa. The nozzle-to-substrate distance was maintained at 30 cm, with a spray angle of 45°. The solution was sprayed for 10 s with intervals of 2 min at a substrate temperature of 300 °C. For the Co-doped ZnO thin films, cobalt(II) nitrate corresponding to 5 wt% was added to the zinc nitrate solution and stirred well, and the above procedures were repeated. The carbon-doped ZnO thin films will be referred to as CxZnO and the carbon and cobalt co-doped ZnO thin films will be referred to as CxCoxZnO further in this manuscript.
 |
| | Fig. 1 Schematic diagram of the spray pyrolysis setup. | |
2.2. Gas sensing
The gas sensing studies were carried out using a custom-made gas sensing setup at 300 K. It comprised a 1 L sensing chamber, a Keithely 6517B electrometer, and a computer. Over the surface of thin films of dimension 1 × 1.5 cm, ohmic contacts were made using the conducting silver paste and zero-resistance copper wires. The films were then connected to the electrometer, which interfaced with the computer using the GPIBO 27 interface. The schematic diagram of the sensing setup is given in Fig. 2. A bias voltage of 5 V was provided. Initially, normal air was flushed into the chamber, and the system was left undisturbed until a steady current (baseline current (Ia)) was reached. Then, appropriate volumes of VOCs corresponding to different concentrations were injected into the chamber through the inlet valve. The variation in current in the presence of VOCs with intervals of 1 s was recorded and continued until a steady current was reached (Ig). Then the VOC was released out of the chamber, and the chamber was flushed with normal air, waiting until the current reached back to the baseline current. The volume of VOC required for particular concentrations was calculated using the static liquid–gas distribution method given by eqn (1).19,21–27| |  | (1) |
where Vl is the volume of VOC required, Cppm is the desired concentration of VOC in ppm, MW is the molecular weight of the VOC, Pc is the pressure inside the chamber, Vc is the volume of the chamber, R is the ideal gas constant, T is the temperature of the chamber, ρ is the density of the VOC. The response of a gas sensor is defined as the ratio of its current in the presence of target gas to that of the current in ambient air, given in eqn (2).| |  | (2) |
where Ig is the current in the presence of the target gas, and Ia is the current in ambient air.
 |
| | Fig. 2 Schematic representation of the sensing setup. | |
The target gas solutions were purchased commercially. The response of the sensor under different humidity conditions was also studied. The humid air atmosphere was created inside the chamber with saturated solutions of LiCl, MgCl, MgNO3 and NaCl used respectively for 11, 33, 52, 76, and 84% RH, based on the procedure adopted elsewhere.4
2.3. Physiochemical characterization
The structure and material confirmation of the deposited thin films were obtained using X-ray diffraction studies (Bruker D8 Advance, Germany), using Cu Kα1 radiation (λ = 1.54 Å) as the X-ray source. The optical band gap was obtained using UV-visible spectroscopy (Agilent Cary 5000). The morphology of the thin films was analyzed using FE-SEM (Thermo Fisher FEI QUANTA 250 FEG). The elements were confirmed using EDX mapping (Oxford Instruments). The elemental composition was obtained using XPS studies (ULVAC-PHI).
3. Results and discussion
The structure, phase purity and crystallinity of the deposited films were obtained from the XRD analysis. The obtained XRD patterns were compared with ICDD card number 00-036-1451 and it was confirmed that they match well. The deposited CxZnO and CxCoxZnO thin films had a hexagonal structure. Both samples exhibited peaks corresponding to the (100), (002), and (101) planes, given in Fig. 3. The (002) plane dominated over the (100) and (101) planes. No other impurity peaks were detected, confirming the absence of impurities and secondary phase formation. The crystallite size, dislocation density, and lattice strain of both samples were calculated using eqn (3)–(5),19,28 respectively, and are tabulated in Table 1.| |  | (3) |
| |  | (4) |
| |  | (5) |
where D is the crystallite size, δ is the dislocation density, ε is the lattice strain, θ is the diffraction angle, and β is the full width at half maximum. For a hexagonal structure, the interplanar spacing is given in eqn (6), from which the lattice constants (a and c) were found for the samples.| |  | (6) |
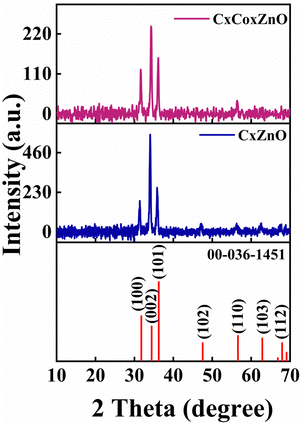 |
| | Fig. 3 XRD patterns of CxZnO and CxCoxZnO thin films. | |
Table 1 Inferences from XRD
| Sample |
2 theta (°) |
Crystallite size, D (nm) |
Lattice strain, ε (%) |
Dislocation density, δ (×1015 m−2) |
Lattice constant, a (Å) |
Lattice constant, b (Å) |
| CxZnO |
31.41 |
24.6 |
0.52 |
1.65 |
3.29 |
5.27 |
| 34.04 |
71.0 |
0.17 |
0.198 |
|
|
| 35.82 |
62.3 |
0.19 |
0.257 |
|
|
| CxCoxZnO |
31.64 |
30.8 |
0.41 |
1.054 |
3.27 |
5.23 |
| 34.31 |
31.0 |
0.38 |
1.040 |
|
|
| 36.16 |
24.9 |
0.45 |
1.612 |
|
|
In comparison to our prior work, A. Thomas et al.,23 on pristine and Co-doped ZnO, the lattice constants (a and c) of CxZnO and CxCoxZnO thin films have increased. The ionic radii of O2−, Zn2+, C4−, and Co2+ are 1.40, 0.60, 2.60, and 0.74 Å, respectively.29 Thus, it is evident that the dopants' (Co, C) ionic radii are bigger than those of the host O2− and Zn2+ ions. This opens up the potential of host ions being substituted by dopant ions.30 In the case of CxZnO thin films with C as the dopant, substituting C in the O and/or Zn sites results in lattice expansion. Aside from this, interstitial C can impact lattice growth. This will cause changes in the O–Zn–O bond lengths and angles.31 As a result, the lattice constants increased compared to that of pure ZnO, as reported previously.23 In the CxCoxZnO thin films, the lattice constant dropped compared to that of the CxZnO thin films, although it remains greater than that reported for pure ZnO. For the CxCoxZnO scenario, both C and Co are co-doped, and Co has a smaller ionic radius than C. The lattice distortion is caused by substituting C and Co in the Zn and O sites and filling the interstitial sites. Some sites inhabited by C in CxZnO might now be replaced by Co ions in CxCoxZnO thin films, causing lattice distortions. Additionally, due to the smaller size of Co2+, the lattice constant dropped in co-doping compared to C doping. In comparison with zinc ions (Zn2+), cobalt ions (Co2+) have a marginally larger ionic radius. Co2+ ions induce lattice distortions when they replace Zn2+ ions in the ZnO lattice. These distortions may cause a reduction in the crystallinity of the ZnO thin films, leading to diminished XRD peak intensities.32 Doping with cobalt can create defects, including oxygen vacancies and interstitials, within the ZnO lattice. These defects can disturb the periodicity of the crystal lattice, resulting in reduced intensity of the XRD peaks.33 Cobalt doping can influence the grain size of ZnO thin films. A reduction in grain size may result in wider and less strong XRD peaks, attributable to the enhanced surface area and the increasing number of grain boundaries.34
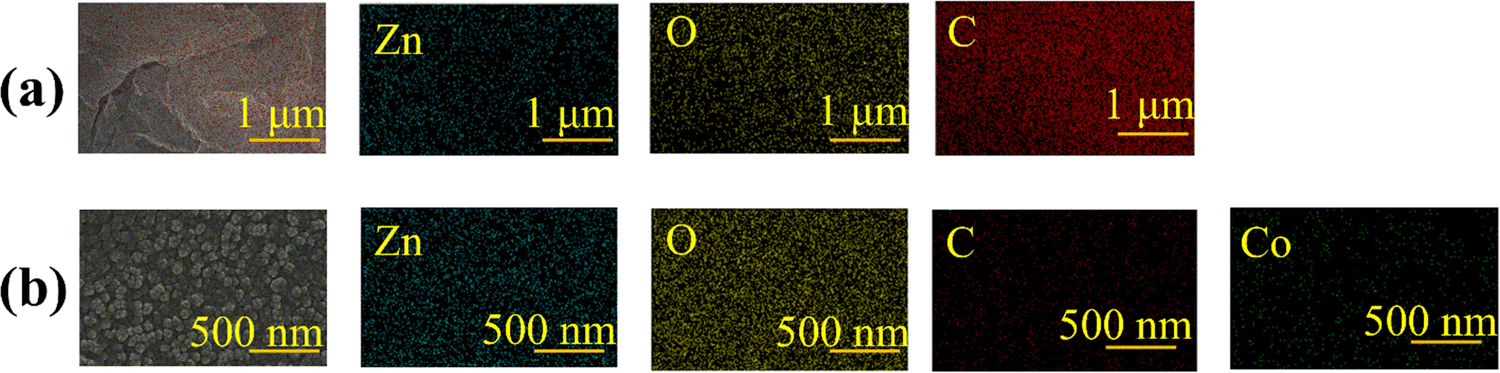
The morphology and elemental composition of the thin films were obtained from the FE-SEM and EDX studies. The FE-SEM image in Fig. 4 reveals that the C-doped ZnO thin films were stacked flakes. At the same time, the co-doping of C and Co caused the morphology to change to spherical granules. The elemental composition was obtained from the EDX spectrum, where the presence of Zn, O and C atoms was detected for the CxZnO thin film, and the presence of Zn, O, C and Co was detected for the CxCoxZnO thin films. From the color mapping, the even distribution of atoms over the thin films was obtained. The color mapping and EDX spectra are shown in Fig. 5 and 6, respectively.
 |
| | Fig. 4 FE-SEM images of (a) the CxZnO thin film and (b) and (c) the CxCoxZnO thin film. | |
 |
| | Fig. 5 Color mapping of the (a) CxZnO thin film and (b) CxCoxZnO thin film. | |
 |
| | Fig. 6 EDX spectra of the (a) CxZnO thin film and (b) CxCoxZnO thin film. | |
The surface chemistry of the deposited thin films is most important as the sensing occurs due to the redox reaction at the surface. The FTIR spectrum of thin films in Fig. 7 indicates the formation of ZnO. The absorption bands between 400 and 575 cm−1 suggest Zn–O bonding.31,35 The band at 400 cm−1 corresponds to the antisymmetric stretching vibrations of O–Zn–O in tetrahedral coordination.31 While the band at about 575 cm−1 can be attributed to oxygen vacancies in ZnO.36 Doping with Co causes a small blue shift in the bands at <700 cm−1. This implies that the O–Zn–O bond in ZnO is influenced by Co doping.37 The weak band at 2085 cm−1 suggests the presence of C![[double bond, length as m-dash]](https://www.rsc.org/images/entities/char_e001.gif) O,38 whereas those at around 900 cm−1 imply out-of-plane stretching of C–O.
O,38 whereas those at around 900 cm−1 imply out-of-plane stretching of C–O.
 |
| | Fig. 7 FTIR spectra of CxZnO and CxCoxZnO thin films. | |
The optical band gap of the thin films was calculated from the absorption spectrum using the Tauc plot method.39 The band gap of the CxZnO thin film was determined to be 3.07 eV, while that of the CxCoxZnO thin film was 3.22 eV (given in Fig. S1(a) and (b)). As per the literature, ZnO is a wide band gap material, with a band gap of ∼3.37 eV. Thus, C doping reduced the band gap of ZnO. C doping in zinc oxide (ZnO) changes the defect concentration in ZnO and hence reduces the band gap.40 When carbon atoms replace oxygen atoms in the ZnO lattice or occupy the interstitial sites, they can create localized states inside the band gap.41,42 The bandgap decreases as the carbon atoms generate additional energy levels within the band structure of ZnO. These energy levels interact with the existing energy bands, changing their positions and hence modifying the bandgap.43–45 However, in the co-doped CxCoxZnO thin film, there is a further reduction in bandgap to 3.07 eV when compared to that of CxZnO. The addition of Co might displace some of the C occupied sites and might influence the electronic properties of ZnO, and thus, there is a reduction in the band gap.
The surface area, pore volume, and average pore diameter of both samples were analyzed using BET analysis, with the results presented in Table 2. The adsorption–desorption isotherms for CxZnO and CxCoxZnO are presented in Fig. 8(a) and (b), respectively, indicating that both samples display H4 hysteresis. The surface area increased with the co-doping of C and Co, compared to the C doping. The average pore radii were between 2 and 50 nm indicating a mesoporous pore structure.
Table 2 Surface area, average pore diameter and pore volume of CxZnO and CxCoxZnO thin films
| Sample |
Surface area (m2 g−1) |
Average pore radius (nm) |
Pore volume (cc g−1) |
| CxZnO |
11.30 |
2.45 |
0.32 |
| CxCoxZnO |
12.29 |
3.90 |
0.42 |
 |
| | Fig. 8 Adsorption–desorption isotherms of (a) CxZnO and (b) CxCoxZnO. | |
The ionic states of the elements were confirmed from the XPS spectra. The wide survey spectra of CxZnO and CxCoxZnO thin films are given in Fig. 9(a) and 10(a). In the survey spectra, peaks corresponding to Zn, O, and C were present, and no other impurities were found for the CxZnO thin film. For the CxCoxZnO thin film, peaks corresponding to Zn, O, C, and Co were present. The core electron XPS spectra of the CxZnO thin film are shown in Fig. 9(b)–(d). In the Zn 2p spectrum, the peak at 1021.5 and 1044.58 represents the characteristic Zn 2p3/2 and 2p1/2 splitting.46 The binding energy difference between them (23.01 eV) represents the presence of ZnO and indicates that Zn is present in its +2 oxidation state.23,47 In the narrow scan spectra of O 1s, the peak is centered at around 531.68 eV and there are no shoulder peaks, confirming that there are no other oxide contaminations. The C 1s narrow scan spectra is centred at 284.78 eV.
 |
| | Fig. 9 (a) Survey spectrum, (b) narrow scan of O 1s, (c) narrow scan of C 1s, and (d) narrow scan of Zn 2p for the CxZnO thin film. | |
The core electron XPS spectra of the CxCoxZnO thin film are shown in Fig. 10(b)–(e). The Zn 2p spectrum of the CxCoxZnO thin film consisted of a doublet at 1021.6 and 1044.73 eV, corresponding to Zn 2p3/2 and 2p1/2 respectively. The binding energy difference of the doublets is 23.13 eV, confirming the formation of ZnO and the presence of Zn in its +2 oxidation state.46 The O 1s core spectrum of the CxCoxZnO thin film shows a peak at 531.4 eV in the co-doped ZnO, and there are no shoulder peaks, confirming that there is no oxide formation from Co. The C 1s core spectrum of the CxCoxZnO thin film shows a peak at 284.98 eV. The core spectrum of Co 2p consists of doublets at 786.55 and 801.04 eV, corresponding to 2p3/2 and 2p1/2 splitting. The energy difference between the 2p splitting is 14.49 eV, which is in agreement with the +2 oxidation state of the Co dopant in the host lattice.
 |
| | Fig. 10 (a) Survey spectrum, (b) narrow scan of O 1s, (c) narrow scan of C 1s, (d) narrow scan of Zn 2p, and (e) narrow scan of Co 2p, for the CxCoxZnO thin film. | |
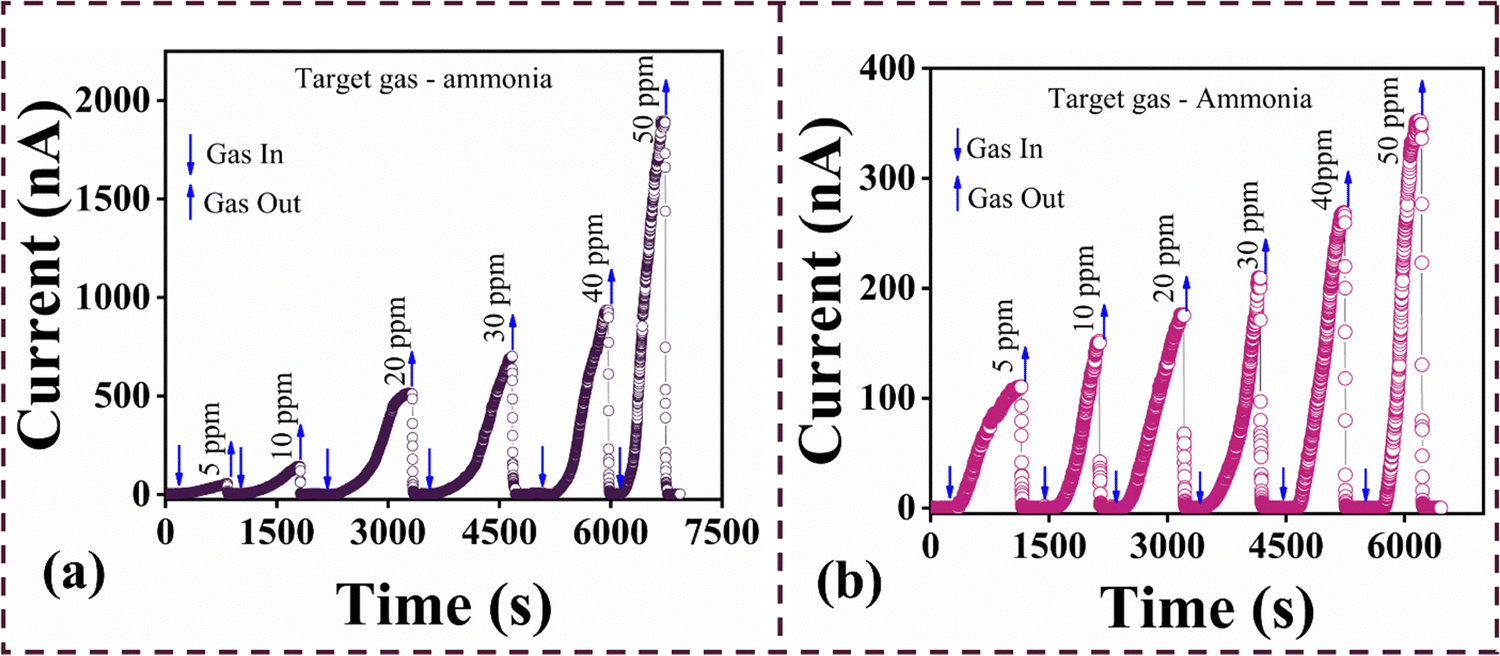
The selectivity of a gas sensor refers to how well it can sense a particular gas when compared to other gases. The selectivity and sensor response of both CxZnO and CxCoxZnO films were studied with the home-made gas sensor setup at 300 K (room temperature). Fig. 11(a) shows the selectivity plot of the CxZnO thin film, when it was tested towards acetone, acetaldehyde, ammonia, ethanol, butanol, benzene, formaldehyde, and xylene at a concentration of 50 ppm each. The CxZnO thin film was more selective to 50 ppm of ammonia, when compared to the other VOCs. The sensor response was 457 for 50 ppm of ammonia at 300 K. The CxZnO thin film had a response of 4 towards 50 ppm of formaldehyde, while it remained non-responsive to the other VOCs tested. Thus, CxZnO is selective to ammonia, and hence the sensor response of CxZnO thin films at different concentrations was studied. When compared to our previous reports of ammonia sensing of pure ZnO thin films, the carbon doping helped increase the sensor response to 457 from 22 for 50 ppm of ammonia at 300 K (33% RH). From the transient response curve of CxZnO thin films at various concentrations of ammonia, shown in Fig. 12(a), the lowest detected concentration of the CxZnO thin film was found to be 5 ppm, and the sensor response increased as the concentration of ammonia increased. The sensor responses were 13, 34, 122, 167, 223 and 457 corresponding to 5, 10, 20, 30, 40 and 50 ppm of ammonia, respectively. There were no baseline drift or saturation issues in the CxZnO thin film as the concentration of ammonia increased, stating that the CxZnO thin film is capable of being used as an effective ammonia sensor.
 |
| | Fig. 11 Sensor responsiveness of the (a) CxZnO and (b) CxCoxZnO thin films towards various VOCs of 50 ppm at 300 K. | |
 |
| | Fig. 12 Transient response curve of the (a) CxZnO and (b) CxCoxZnO thin films towards different concentrations of ammonia. | |
The Co and C co-doped ZnO (CxCoxZnO) thin film was also tested for selectivity at 300 K (33% RH), to 50 ppm of acetone, acetaldehyde, ammonia, ethanol, butanol, benzene, formaldehyde, and xylene. From the selectivity plot given in Fig. 11(b), the thin film was found to be the most selective to 50 ppm of ammonia, with a response of 2729. With co-doping of C and Co, the response towards formaldehyde increased to 14, compared to the only C doped ZnO thin films. Also, the CxCoxZnO thin film had shown responsiveness towards acetaldehyde with a sensor response of 26, which was unresponsive in the CxZnO case. Thus, co-doping of Co along with C had a significant effect in enhancing the sensing capacity of ZnO. The transient response curve of the CxCoxZnO thin film towards various concentrations of ammonia is given in Fig. 12(b). From the transient response curve, it is concluded that the CxCoxZnO thin film did not suffer from being saturated as the concentration of ammonia was increased. Also, there was no baseline drift, stating the chemical stability of the CxCoxZnO thin film for being used as an ammonia sensor. The sensor response of the CxCoxZnO thin film was 851, 1173, 1365, 1621, 2090, and 2729 towards 5, 10, 20, 30, 40, and 50 ppm of ammonia respectively.
It is being reported that carbon doping can significantly improve the material properties. In the present study, the carbon doping in ZnO helped to improve the sensor response towards ammonia at 300 K compared to that of pure ZnO. This is because the doped C could replace the Zn and/or O sites of the wurtzite hexagonal lattice and hence modify the electrical and surface properties of ZnO. It is reported that Co doping could effectively enhance the sensor response and also can switch the sensor response of pure ZnO from ammonia to acetaldehyde.23 In the CxCoxZnO case, there was a sensor response towards 50 ppm of acetaldehyde, which was not observed in the CxZnO thin film. But as Co was doped in trace amounts, C ruled out the switching of selectivity towards acetaldehyde. Nevertheless, the co-doping helped in enhancing the sensor response.
There is a significant change in the baseline current of CxCoxZnO from that of the CxZnO thin film. The baseline current of the CxZnO thin film is around 4 nA, while that for the CxCoxZnO thin film is around 0.1 nA. The baseline current for pure ZnO thin films reported in the literature is in the order of μA. The higher conductivity of the film diminishes the sensor response. This is because increasing the free electron concentration at the surface inhibits the change in depletion width in the presence of the target gas, limiting the sensor response.28,48 The C doping helped reduce the conductivity of the ZnO thin film, which was further reduced through co-doping of C and Co and resulted in enhanced sensor response. The repeatability of the sensor response for the CxCoxZnO thin film was studied by repeating the test for 50 ppm for five cycles. It is found that the sensor response was repeatable during the continuous cycles with an average response of 2727.6 ± 8.2, shown in Fig. 13(a). The stability of sensor response of CxCoxZnO thin films was studied for 60 days in intervals of 7 days and was found to be stable, as given in Fig. 13(b). Linear fitting of response versus concentration of ammonia was done for both CxZnO and CxCoxZnO thin films, given in Fig. 14(a) and (b). From the linear fitting, the CxZnO thin film demonstrated a sensitivity of 8.8/ppm and good linearity (r2 = 0.90). While the co-doped CxCoxZnO thin film had a higher sensitivity and linearity, 38.1/ppm and r2 = 0.96, pointing out the practical application of the CxCoxZnO thin film as an effective ammonia sensor.
 |
| | Fig. 13 (a) Repeatability study of the CxCoxZnO thin film and (b) stability study of the CxCoxZnO thin film for 50 ppm of ammonia. | |
 |
| | Fig. 14 Linear fit of (a) CxZnO and (b) CxCoxZnO for various concentrations of ammonia. | |
The dependence of humidity (RH) on the sensor responses of both thin films was studied. There was a small shift in baseline current as the RH increased, and the sensor responses also increased slightly for both CxZnO and CxCoxZnO thin films, as shown in Fig. 15. The wettability studies of the thin films were conducted using the contact angle measurements, given in Fig. 16, from which it was clear that the films were hydrophobic. The hydrophobic nature of the thin films helped the sensors to withstand the effect of humidity to some extent. The hydrophobic nature resisted the adsorption of OH radicals on the surface. The change in baseline and sensor response at higher RH levels might be attributed to a change in carrier concentration because of the interactions. Firstly, at higher RH levels the adsorbed OH− interacts with the lattice oxygen and releases electrons at the lattice, which increases the conductivity. Secondly, the interaction between the adsorbed OH radicals and the ammonia gas also changes the carrier concentrations.49,50 Increased humidity levels result in a greater number of water molecules accumulating on the surface of the sensors. Water molecules can adsorb onto the surface and dissolve into hydroxyl groups, which interact with ammonia molecules, thereby boosting the sensor's responsiveness.33 Water molecules can enhance the mobility of charge carriers (electrons and holes) within the ZnO matrix. A greater response may result from this enhanced mobility, which can intensify the conductivity changes of the sensor when exposed to ammonia.51 Water molecules can generate hydroxyl radicals on the sensor surface, enhancing their reactivity with ammonia. This reaction might result in a more pronounced modulation of the sensor's electrical characteristics, thus enhancing the responsiveness.52
 |
| | Fig. 15 Dependence of relative humidity on baseline current and sensor response for the (a) CxZnO and (b) CxCoxZnO thin films. | |
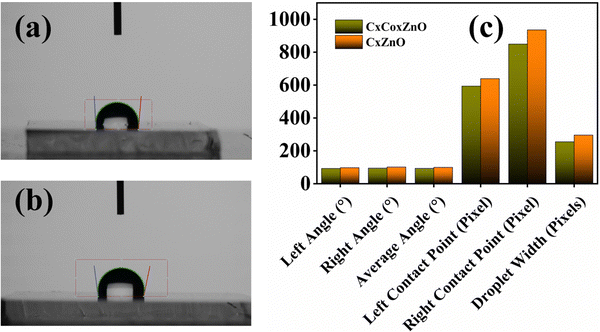 |
| | Fig. 16 Contact angle measurement of the (a) CxZnO, (b) CxCoxZnO thin films, and (c) contact angles for CxZnO and CxCoxZnO. | |
The thin films responded to target gases based on the change in the material's resistance upon the adsorption and desorption of gases on its surface. ZnO is an n-type material with electrons as the majority charge carriers, and the thin films demonstrated the characteristic sensing of n-type material with the onset of ammonia, which is a reducing gas. As ZnO is exposed to air, the oxygen molecules adsorb onto the surface. The adsorbed oxygen molecules then trap electrons from the conduction band and get ionized, as given in eqn (7) and (8). This immobilizes the electrons of ZnO in the conduction band and forms the electron depletion layer (EDL).23,53 When ammonia is injected into the chamber, the ammonia molecules interact with the oxygen ions at the surface and undergo a redox reaction. According to eqn (9), the interaction releases electrons to the conduction band, which reduces the width of the EDL and reduces the resistance of the thin film.53 When ammonia is released out of the chamber, the atmospheric oxygen again rebinds with the surface, the thin films reach back to their baseline resistance, and the thickness of the EDL layer is brought back to that of the initial stage. The schematic representation is given in Fig. 17.
| | | O2(ads) + e− → O2−(ads) | (8) |
| | | 4NH3 + 3O2− → 2N2 + 6H2O + 6e− | (9) |
 |
| | Fig. 17 Schematic representation of the sensing mechanism. | |
The CxCoxZnO films, after exposure to NH3 under dry and 84% RH conditions, were further studied with XPS. Under both dry and humid conditions, peaks corresponding to N2 arose in the survey spectrum of the films, which was not present in the before exposure case. Fig. 18 shows the XPS survey spectrum of the CxCoxZnO film before and after exposure to NH3. The narrow scan of N 1s of CxCoxZnO after exposure to NH3 at dry and humid conditions is also given in Fig. 18. This confirms that the proposed oxidation reaction given in eqn (9) occurs at the surface of the thin films.
 |
| | Fig. 18 Survey spectrum and N1s narrow scan spectrum of the CxCoxZnO thin film before and after exposure to ammonia. | |
In comparison with pure and carbon doped ZnO thin films, the carbon and cobalt co-doped ZnO thin films prove to have better characteristics to be used as effective and highly sensitive ammonia sensors. In the co-doped ZnO, Co, which is known to be a good catalyst, helped in fastening the redox reaction, thereby increasing the carrier concentration and hence resulting in a higher sensor response.23 Moreover, cobalt also helped in modifying the morphology of ZnO. The carbon doped ZnO was composed of flakes, whereas the co-doping with Co changed the morphology to spherical. The spherical morphology has a higher surface-to-volume ratio, when compared to that of flakes, and thus it provided more number of active sites for the gas adsorption.28 The presence of C impurities in ZnO enhances the surface reactivity, permitting greater adsorption and desorption of ammonia. Carbon doping can change the electrical properties of ZnO, notably its band gap. Modifying the material's energy levels and charge carrier concentrations can improve gas detection, including NH3. Ammonia molecules have a high affinity for carbon sites in co-doped ZnO, resulting in strong interactions with the sensor surface. Ammonia is a Lewis base, with a lone pair of electrons on the nitrogen atom. The co-doped ZnO structure has carbon sites that can take up electron pairs and function as Lewis acids. As a result, NH3 and the carbon sites have strong Lewis acid–base interactions, which encourage NH3 molecules to adsorb onto the sensor surface. In the ZnO lattice, carbon atoms can have the ability to remove electrons, particularly when doped. This has the potential to polarize adjacent chemical species, such as NH3 molecules, increasing their propensity to engage electrostatically with the carbon sites.
4. Conclusion
In conclusion, the deposition and characterization of carbon doped and co-doped (carbon and cobalt) ZnO thin films presented in this research article provides encouraging insights into their potential application as efficient ammonia sensors. The chemical spray pyrolysis approach was effective in depositing the thin films. Through the study of the films' morphology and various characteristics, we have observed promising results regarding their viability for sensing applications. The findings suggest that carbon and cobalt co-doped ZnO thin films demonstrate excellent sensitivity and stability when exposed to ammonia, indicating their potential as reliable sensors for detecting ammonia at 300 K. The co-doped ZnO thin films could detect as low as 5 ppm of ammonia, with a response value of 851 at 300 K.
Data availability
The data supporting this study's findings are available within the article.
Conflicts of interest
There are no conflicts to declare.
Acknowledgements
Author Anju Thomas would like to thank Dr Logu Thirumalaisamy for his support and guidance throughout the work and would also like to thank Mr Arunkumar P. S. and Mr Ravikumar Thangavel for their help and support. The authors express their gratitude to Dr T. N. Narayanan and Ms Arya Sohan, Tata Institute of Fundamental Research, Hyderabad for providing the BET facility.
References
-
K. Mylvaganam, Y. Chen, W. Liu, M. Liu and L. Zhang, Anti-Abrasive Nanocoatings, 2015, 543–567 Search PubMed.
- A. M. E. Raj, L. C. Nehru, M. Jayachandran and C. Sanjeeviraja, Cryst. Res. Technol., 2007, 42, 867–875 CrossRef CAS.
- K. Sivaperuman, A. Thomas, R. Thangavel, L. Thirumalaisamy, S. Palanivel, S. Pitchaimuthu, N. Ahsan and Y. Okada, Prog. Mater. Sci., 2024, 142, 101222 CrossRef CAS.
- T. Ravikumar, L. Thirumalaisamy, S. Madanagurusamy and K. Sivaperuman, J. Alloys Compd., 2023, 959, 170568 CrossRef CAS.
-
O. Braissant, V. A. McLin and C. Cudalbu, preprint, 2013 DOI:10.1007/s10545-012-9546-2.
- M. Neghab, A. Mirzaei, H. Jalilian, M. Jahangiri, J. Zahedi and S. Yousefinejad, Int. J. Occup. Environ. Med., 2019, 10, 80–88 CrossRef PubMed.
- R. Kumar, X. Liu, J. Zhang and M. Kumar, Nano-Micro Lett., 2020, 12, 1–37 CrossRef PubMed.
- Y. Cheng, B. Ren, K. Xu, I. Jeerapan, H. Chen, Z. Li and J. Z. Ou, J. Mater. Chem. C, 2021, 9, 3026–3051 RSC.
- W. Zhang, X. Chen, Y. Chen, H. Y. Li and H. Liu, Nanoscale, 2024, 16, 12883–12908 RSC.
- M. S. S. Danish, A. Bhattacharya, D. Stepanova, A. Mikhaylov, M. L. Grilli, M. Khosravy and T. Senjyu, Metals, 2020, 10(12), 1604 CrossRef CAS.
- D. Nunes, A. Pimentel, A. Goncalves, S. Pereira, R. Branquinho, P. Barquinha, E. Fortunato and R. Martins, Semicond. Sci. Technol., 2019, 34, 043001 CrossRef CAS.
- V. M. Aroutiounian, J. Contemp. Phys. (Arm. Acad. Sci.), 2022, 57, 54–75 CrossRef CAS.
-
V. Beniwal, N. Sharma and J. Jain, in Nanosponges for Environmental Remediation, Springer, Cham, 2023, pp. 309–333 Search PubMed.
- I. Şerban and A. Enesca, Front. Chem., 2020, 8, 354 CrossRef PubMed.
- R. Xavier, L. Thirumalaisamy, S. Madhanagurusamy and K. Sivaperuman, Ceram. Int., 2024, 50, 969–976 CrossRef CAS.
-
K. Goria, A. Bharti, S. Raina, R. Kothari, V. V. Tyagi, H. M. Singh and G. Kour, Sustainable Materials for Sensing and Remediation of Noxious Pollutants, 2022, 87–112 Search PubMed.
-
A. A. Farghali and S. I. El-Dek, Metal Oxide-Carbon Hybrid Materials: Synthesis, Properties and Applications, 2022, 3–24 Search PubMed.
-
M. H. Asif, A. Razaq, S. Bhand, M. Willander and B. Danielsson, Nanotechnology and Biosensors, 2018, 29–49 Search PubMed.
- A. Thomas, L. Thirumalaisamy, S. Madanagurusamy and K. Sivaperuman, J. Mater. Sci.: Mater. Electron., 2023, 34, 2294 CrossRef CAS.
- C. E. Caballero-Güereca, M. R. A. Cruz, E. Luévano-Hipólito and L. M. Torres-Martínez, Surf. Interfaces, 2023, 37, 102705 CrossRef.
- S. Nallakumar, L. Thirumalaisamy, S. Madhanagurusamy, S. Kalainathan and M. Usha Rani, New J. Chem., 2023, 47, 11110–11122 RSC.
- V. Mounasamy, G. K. Mani, D. Ponnusamy, K. Tsuchiya, A. K. Prasad and S. Madanagurusamy, J. Mater. Chem. A, 2018, 6, 6402–6413 RSC.
- A. Thomas, L. Thirumalaisamy, S. Madanagurusamy and K. Sivaperuman, Sens. Actuators, B, 2024, 401, 135043 CrossRef CAS.
- T. Ravikumar, L. Thirumalaisamy, S. Madanagurusamy and S. Kalainathan, Phys. Chem. Chem. Phys., 2023, 25, 32216–32233 RSC.
- T. Ravikumar and K. Sivaperuman, Mater. Today Chem., 2024, 38, 102049 CrossRef CAS.
- R. A. B. John, J. Shruthi, M. V. Ramana Reddy and A. Ruban Kumar, Ceram. Int., 2022, 48, 17654–17667 CrossRef CAS.
- A. Thomas and K. Sivaperuman, Surf. Interfaces, 2024, 54, 105421 Search PubMed.
- A. Thomas, L. Thirumalaisamy, S. Madanagurusamy and K. Sivaperuman, ACS Omega, 2023, 8, 32848–32854 CrossRef CAS PubMed.
- R. D. Shannon, Acta Crystallogr., Sect. A, 1976, 32, 751–767 CrossRef.
- S. Zhou, Q. Xu, K. Potzger, G. Talut, R. Grötzschel, J. Fassbender, M. Vinnichenko, J. Grenzer, M. Helm, H. Hochmuth, M. Lorenz, M. Grundmann and H. Schmidt, Appl. Phys. Lett., 2008, 93, 232507 CrossRef.
- J. J. Beltrán, C. A. Barrero and A. Punnoose, Phys. Chem. Chem. Phys., 2019, 21, 8808–8819 RSC.
- R. Bairy, P. S. Patil, S. R. Maidur, H. Vijeth, M. S. Murari and U. K. Bhat, RSC Adv., 2019, 9, 22302–22312 RSC.
- V. Karpyna, L. Myroniuk, D. Myroniuk, O. Bykov, O. Olifan, O. Kolomys, V. Strelchuk, M. Bugaiova, I. Kovalchuk and A. Ievtushenko, Catal. Lett., 2024, 154, 2503–2512 CrossRef CAS.
- W. Vallejo, A. Cantillo, B. Salazar, C. Diaz-Uribe, W. Ramos, E. Romero and M. Hurtado, Catalysts, 2020, 10, 528 CrossRef CAS.
- Z. N. Kayani, M. Iqbal, S. Riaz, R. Zia and S. Naseem, Mater. Sci.-Pol., 2015, 33, 515–520 CrossRef CAS.
- G. Xiong, U. Pal, J. G. Serrano, K. B. Ucer and R. T. Williams, Phys. Status Solidi C, 2006, 3, 3577–3581 CrossRef CAS.
- R. Elilarassi and G. Chandrasekaran, J. Mater. Sci.: Mater. Electron., 2013, 24, 96–105 CrossRef CAS.
- M. Tayebi, A. Tayyebi, Z. Masoumi and B. K. Lee, Appl. Surf. Sci., 2020, 502, 144189 CrossRef CAS.
- N. Santhosh and M. U. Rani, J. Hazard. Mater., 2024, 134041 Search PubMed.
- Y. Ding, L. Niu, Y. Chen and M. H. Wang, Cryst. Res. Technol., 2023, 58, 2300015 CrossRef CAS.
- D. Sarkar, C. K. Ghosh and K. K. Chattopadhyay, Appl. Surf. Sci., 2017, 418, 252–257 CrossRef CAS.
- M. J. Akhtar, H. A. Alhadlaq, A. Alshamsan, M. A. Majeed Khan and M. Ahamed, Sci. Rep., 2015, 5, 13876 CrossRef.
-
F. Zhang, Y. Lu, D. S. Schulman, T. Zhang, K. Fujisawa, Z. Lin, Y. Lei, A. L. Elias, S. Das, S. B. Sinnott and M. Terrones, Carbon doping of WS 2 monolayers: Bandgap reduction and p-type doping transport, 2019, 5 Search PubMed.
- N. A. Sukrey, A. R. Bushroa and M. Rizwan, J. Aust. Ceram. Soc., 2023, 60, 563–589 CrossRef.
- F. Zimmermann, J. Beyer, F. C. Beyer, G. Gärtner, I. Gamov, K. Irmscher, E. Richter, M. Weyers and J. Heitmann, J. Appl. Phys., 2021, 130, 55703 CrossRef CAS.
- X. Zhang, J. Qin, R. Hao, L. Wang, X. Shen, R. Yu, S. Limpanart, M. Ma and R. Liu, J. Phys. Chem. C, 2015, 119, 20544–20554 CrossRef CAS.
- D. K. Mishra, J. Mohapatra, M. K. Sharma, R. Chattarjee, S. K. Singh, S. Varma, S. N. Behera, S. K. Nayak and P. Entel, J. Magn. Magn. Mater., 2013, 329, 146–152 CrossRef CAS.
- K. Xu, N. Li, D. Zeng, S. Tian, S. Zhang, D. Hu and C. Xie, ACS Appl. Mater. Interfaces, 2015, 7, 11359–11368 CrossRef CAS PubMed.
- Y. Wang, Y. Zhou and Y. Wang, Sens. Actuators, B, 2020, 323, 128695 CrossRef CAS.
- M. Shooshtari, A. Salehi and S. Vollebregt, Nanotechnology, 2021, 32, 325501 CrossRef CAS.
- H. A. Varudkar, L. H. Kathwate, M. B. Awale, S. D. Lokhande, G. Umadevi, J. S. Dargad and V. D. Mote, J. Aust. Ceram. Soc., 2022, 58, 793–802 CrossRef CAS.
- A. Dutta, K. Chatterjee, S. Mishra, S. K. Saha and A. J. Akhtar, J. Mater. Res., 2022, 37, 3955–3964 CrossRef CAS.
- Q. Yue, T. Liu, Y. Mu, X. Chen and X. T. Yin, Sens. Actuators, B, 2024, 410, 135666 CrossRef CAS.
|
| This journal is © The Royal Society of Chemistry 2025 |
Click here to see how this site uses Cookies. View our privacy policy here. 
 Open Access Article
 This Open Access Article is licensed under a Creative Commons Attribution-Non Commercial 3.0 Unported Licence
 *
*