DOI:
10.1039/D4EB00018H
(Review Article)
EES Batteries, 2025,
1, 23-72
A review of the design and strategies for photoassisted rechargeable metal-ion batteries
Received
14th October 2024
, Accepted 9th December 2024
First published on 14th January 2025
Abstract
In the quest to combat environmental pollution and reduce reliance on fossil fuels, renewable energy sources have garnered significant attention. Among these, solar energy stands out due to its green, clean, and virtually limitless supply. However, solar cells, while efficiently converting solar energy into electricity, cannot store this energy, making them impractical in the absence of sunlight. This challenge has spurred the development of photoassisted rechargeable batteries (PARBs), which combine the energy-harvesting capabilities of solar cells with the storage capacity of batteries. PARBs enable the direct conversion and storage of solar energy into chemical energy, enhancing energy efficiency and offering longer cycle life, stability, and reduced energy loss compared with traditional devices. This review provides a comprehensive overview of PARB technologies, including recent advancements in metal-ion-based systems such as Li, Na, K, Zn, Mg, and Al. Key strategies to improve PARB performance are explored, including structural and defect engineering, electrolyte modification, and surface coating techniques. Additionally, challenges related to interfacial issues, charge carrier recombination, and electrolyte degradation are discussed alongside proposed solutions. By addressing these challenges and highlighting the potential of PARBs, this review aims to inspire further research and innovation in the field, contributing to the future of sustainable energy storage technologies.
Broader context
In light of the urgent need to mitigate environmental pollution caused by the excessive use of fossil fuels, renewable energy sources have gained immense attraction. Solar energy, with its green and inexhaustible potential, stands as a promising solution. However, conventional solar cells face limitations due to their inability to store energy, necessitating additional storage devices. This review highlights the paradigm-shifting technology of photoassisted rechargeable batteries (PARBs), which combines solar energy harvesting and storage into a single efficient system, thus addressing this critical challenge. Special attention is paid to their design, strategies, and the integration of metal-ion batteries to optimize energy conversion and storage. The review article also delves into the technical challenges of PARB systems, such as interfacial issues, charge carrier recombination, and electrolyte instability, while offering recent strategies for improving cycling stability, carrier transfer, and light absorption.
|
1. Introduction
In the current era, tackling environmental pollution caused by the excessive use of fossil fuels has become the highest priority. Utilization of renewable energy sources for energy needs is the solution and has gained immense interest among researchers. Among many renewable energy sources, solar energy stands out for various applications due to its prospects, such as being green, clean, and having an unlimited steady supply. Solar cells can effectively harvest solar energy and convert it into electrical energy, but limited by energy storage. Moreover, due to their inability to store electrical energy without an additional storage device, photovoltaic devices become impractical during absence of illumination. Hence, it is crucial to find a device that efficiently converts and stores solar energy into chemical energy for sustainable utilization. Nowadays, research is focused on developing devices that can function as both photovoltaic cells and batteries, capable of absorbing solar energy and storing it as chemical energy simultaneously. These devices are known as photoassisted rechargeable batteries (PARBs), which are more efficient than individual solar cells or batteries. The paradigm-shifting energy storage concept enables the conversion of solar energy, allowing for efficient use of solar energy and electricity produced by solar power, which is utilized to recharge a battery as an alternative. This PARB could display unique photoelectrochemical (PEC) properties compared with solar cell and rechargeable batteries, such as (i) either the direct transformation of solar energy into chemical energy or the simultaneous transformation of solar energy into electrical energy and then chemical energy, (ii) reduced energy loss, (iii) charging voltage and voltage stability, and (iv) long cycle life.1,2 Hodes et al.3 proposed the first PARB with a three-electrode system in 1976 using a CdSe photoelectrode along with Ag/Ag2S and S/S2−. However, the CdSe photoelectrode is poisonous and produces side reactions with the redox shuttle. Later Zou et al.4 reported a PARB with TiO2/carbon fiber, then Hauch et al.5 reported the WO3/TiO2 electrode with a charging of 1 h under illumination, yielding 1.8 C cm−2 when discharged in the dark. Recent developments in the field have incited further research on various types of PARB, such as metal-ion, metal–air, metal–I2, metal–CO2, and metal–organic batteries, with the timeline provided in Fig. 1.
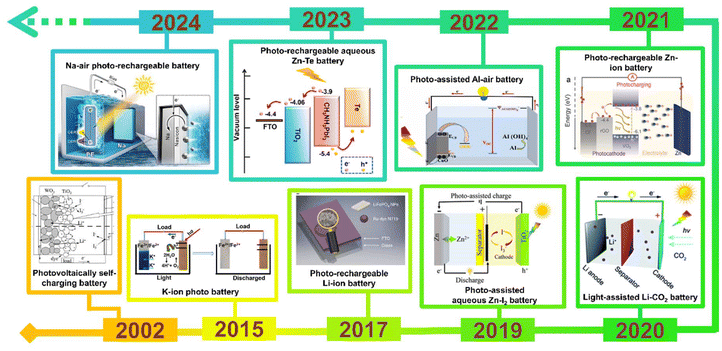 |
| | Fig. 1 Timeline of PARBs. Photovoltaically self-charging battery,5 Copyright: 2002 Iopscience. K-ion photobattery,6 Copyright: 2015 American Chemical Society. Li-ion PARB,7 Copyright: 2017 Nature. Aqueous Zn–I2 PARB,8 Copyright: 2019 Wiley. Li-PARB,9 Copyright: 2020 Royal Chemical Society. Zn-ion PARB,10 Copyright: 2021 Wiley. Al-PARB,11 Copyright: 2022 Elsevier. Aqueous Zn-Te PARB,12 Copyright: 2023 American Chemical Society. Na-air PARB.13 Copyright: 2024 Wiley. | |
With this perspective, in this review battery and PEC concepts as well as the working mechanism of PARBs are introduced in turn. Subsequently, this review summarizes and analyzes the progress of photoelectrodes for various metal-ion-based PARBs and design strategies for PARBs. The analysis is conducted from the perspective of PARBs. The key issues and perspectives on which PARBs should focus and future research are discussed, and these are expected to pave the way from laboratory to industry.
2. Key advances and insights
To date, ∼175 papers have been published in the field of PARBs, and the year-wise publication numbers are given in Fig. 2(a). It is evident from the figure that the number of publications are increasing rapidly, leaping from 2022 onwards, which proves the significance of the emergence of this field for utilising solar energy. On the other hand, Fig. 2(b) shows the number of publications for various metal-ion devices, which also gives clear evidence of employing multiple metal ions in PARBs. It is seen that Li is predominantly exploited. Nevertheless, researchers are gradually inclining towards alternatives such as Zn, Na, K, Mg, and Al for application in PARBs. Furthermore, few (∼12) review articles are available for PARBs.1,2,14–19 Most reviews have provided the working principle and recent advances of PARBs, mainly focusing on Li, Zn, and Na-based devices. However, Zhang et al.16 illustrated the issues of photoelectrodes and electrolytes in the PARB, namely (i) interfacial issues between the active material and photocatalyst, (ii) higher charge carrier recombination, (iii) poor light absorption ability of photocatalyst, (iv) flammability and volatility of liquid electrolyte, (v) degradation of electrolyte caused by side reactions, and (vi) cycle life. Besides, BaO et al.2 proposed some modification strategies, including (i) structural engineering for improving cycling stability, (ii) defect engineering for improving carrier transfer, (iii) heterojunction for tuning the electronic band structure, and (iv) dye-sensitization for enhancing light absorption. Not much information is available concerning the modification strategies such as electrolyte engineering and surface coating. Considering these perspectives, this review article begins with the fundamentals and the progress attained during the development of PARBs, their working principles, and advancing towards key parameters required to improve their performance. Later, a detailed description of recent advances in PARBs derived from a variety of monovalent (Li, Na, K, and H) and multivalent (Zn, Mg, and Al) ion-based metal batteries, such as metal ion, metal–air, metal–CO2, metal–sulfur, metal–iodide, metal–organic, etc. is provided. Furthermore, an in-depth investigation of various modification strategies to improve the inherent photochemical and electrochemical performance of PARBs is laid out. This includes ion intercalation/de-intercalation behaviour, surface area, light absorption, band alignment, charge transfer process, ionic conductivity, cycling stability, self-life, etc. Finally, future perspectives and opportunities are offered. This review will likely contribute to developing potential practices for metal-ion-based PARBs. By providing forward-looking insights into the potential of PARBs to bridge existing gaps in renewable energy storage, this review positions PARBs not merely as an emerging scientific concept but as a feasible and transformative technology in the push toward sustainable energy solutions.
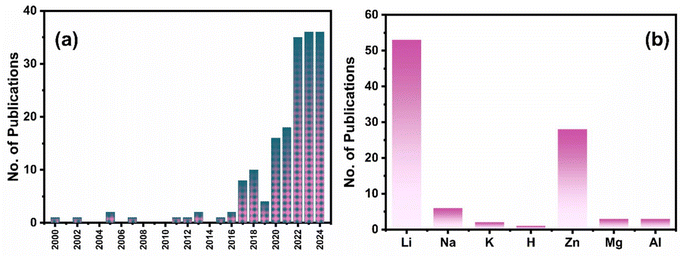 |
| | Fig. 2 (a) Year-wise no. of research articles published in the field of PARBs (b) no. of research articles published so far concerning metal ions. Data are taken from the Web of Science. | |
3. Operating principle of photoassisted rechargeable batteries
A PARB is a combined device that converts solar energy by charge separation and stores it in batteries by utilising solar illumination, thus increment in voltage. The operating principle of the PARB is similar to that of a simple rechargeable battery; the only difference is that it uses solar energy to charge with or without external bias. However, before investing in the details of PARB devices, it is essential to understand the working principle of rechargeable metal-ion batteries. Rechargeable metal-ion batteries typically contain an anode and a cathode, separated by an ion-conducting layer and liquid or solid-state electrolyte. The energy storage process primarily relies on electron transfer to metal ions by intercalating charge-compensating ions. Moreover, this device drives a reversible electrochemical reaction to store chemical energy during the charging process. When discharging, the electrochemical reaction is reversed, and it is noted that the ion transport in typical rechargeable metal-ion batteries follows the “rocking chair” mechanism, which achieves facile ion intercalation/deintercalation;20,21 the schematic of the discharge process in metal-ion rechargeable battery is shown in Fig. 3.
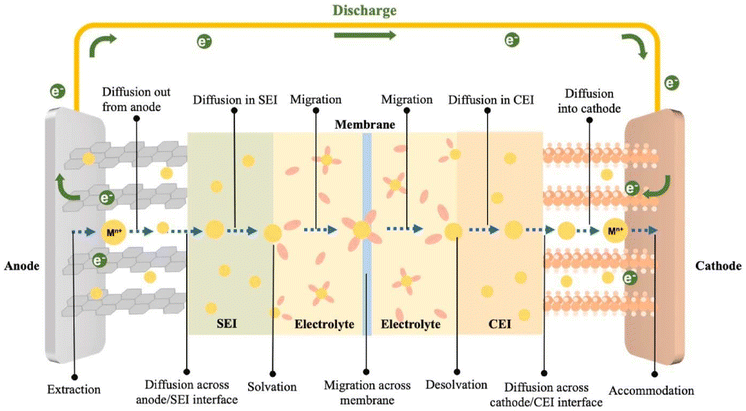 |
| | Fig. 3 Illustration of the metal-ion transport steps during the battery discharge.21 Copyright: 2024 Elsevier. | |
PARBs are classified into three types, namely (i) combination type, (ii) three-electrode, and (iii) two-electrode systems, and the schematics of structural design are given in Fig. 4. In the first type, i.e., the combination type, as shown in Fig. 4(a), the conversion and energy storage devices are completely independent, meaning that the photovoltaic and energy storage cells are directly connected via external wires. Hence, it is evident that these devices are not genuinely photoassisted devices. However, this system is limited by its high cost, large volume, overweight, and the loss of electrical energy. In recent years, photoactive semiconductors have been incorporated along with energy storage materials to attain PARBs. Here, a photoelectrode is inserted into a rechargeable battery within a single device. For that, with the combination of a photoelectrode and charge storage electrode, variation in configuration can be attained, such as three-electrode and two-electrode systems. For example, the three-electrode system typically comprises a photoelectrode, anode, and cathode. Fig. 4(b) illustrates the operating principle of a three-electrode configuration in a PARB. During the photoassisted charging, after the photoelectrode harvests light, the photogenerated electrons are transferred through an external circuit to the anode. Simultaneously, the photogenerated holes oxidize the metal ions in the electrolyte, and this process continues until equilibration. At this moment, solar energy is stored as chemical energy, oxidized mediators at the photoelectrode and reduced active material at the anode. During the discharge process, which occurs between the anode and cathode, the reduced active material at the anode is oxidized, and the electrons are transferred from the anode to the cathode. Meanwhile, the oxidized mediator at the cathode is reduced to its reduced state, which completes the charge and discharge cycle of the PARB. The following configuration is a two-electrode system in Fig. 4(c), the most exploited type of PARB for harvesting, converting, and storing solar energy. Here is a dual-functional electrode that combines photovoltaic conversion and energy storage in a single unit, functioning as a photocathode or photoanode. The design of dual-functional electrode materials can be categorized into two approaches: (i) blending of photoactive and energy storage material. In this case, it is crucial to match energy levels of both the materials. After the photoelectrode excitation, the photogenerated electrons transfer through an external circuit, and the holes can transfer in opposite directions. (ii) A single active material that possesses both photoactive and energy storage properties, thus enabling solar energy harvesting, conversion, and storage within a single material. Fig. 4(c) depicts the operating principle with a two-electrode device in which the dual-functional photoelectrodes harvest sunlight and generate electron–hole pairs. The holes are transferred to the energy storage material, where they participate in oxidation. Meanwhile, the photogenerated electrons travel through an external circuit to the anode, where they reduce metal ions, thereby completing the charging process of a PARB.1,2,17
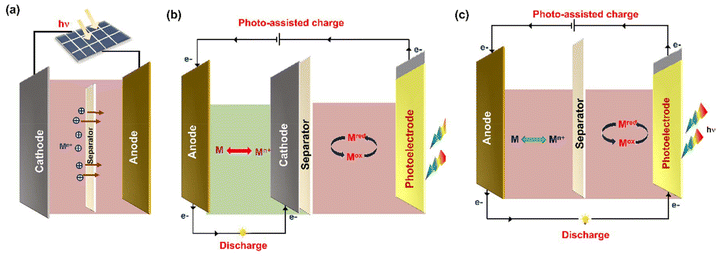 |
| | Fig. 4 The different configuration of PARBs. (a) Photoassisted device combining a solar cell and a battery, (b) three-electrode and (c) two-electrode device. | |
4. Key performance parameters and relevant characterisation of photoassisted rechargeable batteries
The performance of the PARBs is essential since they are being developed to harvest and store solar energy. Thus, the device must take advantage of the available solar spectrum and convert it efficiently into electrical energy. This electrical energy needs to be stored and consumed later. Key performance parameters such as operating voltage (cell voltage), specific capacity, energy/power density, Photo conversion efficiency (PCE), cycling life, and self-life are necessary for the device's functioning. A schematic illustration of the critical parameters is given in Fig. 5, with practical trends and values compared with those of the ideal, along with the significance of each parameter for the application of PARBs, which is given in detail below.
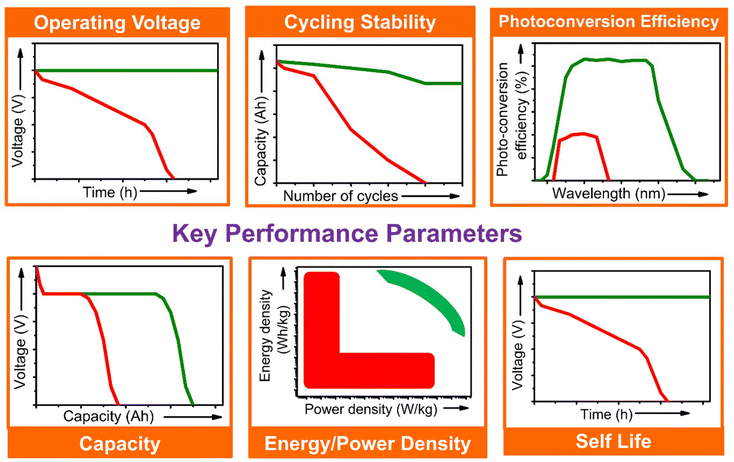 |
| | Fig. 5 Key parameters for evaluating the PARBs. Green and red colors represent the ideal and obtained results, respectively. | |
4.1. Capacity
In PARBs, capacity plays a crucial role, directly influencing the amount of solar energy stored, the runtime, charging behaviour, and power delivery. Theoretically, the capacity refers to the total amount of electric charge (current × time) a battery can hold, usually measured in mA h (milliampere-hours) or A h (ampere-hours). For a given voltage, the energy stored in a battery is directly proportional to its capacity. A battery's practical capacity is always less than the theoretical capacity, and various factors, such as discharge rate, cut-off voltage, and temperature, influence the practical capacity. Higher capacity improves the energy storage behaviour and reduces the frequency of charge cycles. Balancing the capacity with other factors, such as size and weight, is essential for optimizing performance. It is important to note that the capacity must be optimized to match the amount of solar energy that can be generated. If the capacity is too low, the battery may become fully charged too quickly, leading to underutilization of available sunlight. In contrast, the higher capacity extends the runtime of PARBs. This can continue to power devices for extended periods without requiring additional charging, which helps maintain the battery's capacity. Furthermore, the capacity retention over repeated charge and discharge cycles is crucial for the long-term stability of the batteries. A battery's capacity tends to degrade over time due to various factors, such as side reactions and material fatigue, which can reduce the energy it can store and deliver.22
Prior to comparing the dark and light behaviour of photoelectrodes for metal ion insertion, this working electrode will be electrochemically stabilized by performing certain cyclic voltammograms in order to reach a stable electrochemical signal upon cycling. Then, CVs will be performed in the dark and under illumination to evaluate photoassisted performance. Moreover, the shift in the redox peak associated with metal-ion intercalation/deintercalation will be analysed regarding improved kinetics under light illumination. Moreover, galvanostatic discharge/charge curves under dark and illumination conditions exhibit the impact of light on the capacity of photoassisted rechargeable batteries. As shown in Fig. 5, an increase in the plateau's length results in higher capacity suggesting the same. Moreover, the potentiostatic experiments are important to analyse the contribution of anodic and cathodic current under light and dark conditions, which is used to analyse the performance of PARBs. The repeatability of the photocurrent generation is crucial for the long-term stability of PARBs. The significant difference in current density under dark conditions suggests good charge separation and transport. Sudden drops in photocurrent density between light cycles indicate recombination losses, where photogenerated electrons and holes recombine before they participate in the redox process. The dark photocurrent profile helps to understand the kinetics of photodriven redox reactions, as variations in photocurrent intensity can indicate the rate of reaction initiation and completion under illumination. Faster responses to light indicate quicker charge transfer, which is beneficial for the charging/discharging efficiency of the battery.
4.2. Operating voltage
Operating voltage, or cell voltage, is determined by the potential difference of redox reactions taking place between the cathode and anode, which should fall within the electrochemical stability window. The higher operating voltage of the rechargeable battery will result in higher operating power. Comparing aqueous and organic electrolytes, aqueous electrolytes have a much narrower voltage window than organic electrolytes, which is only ∼1.23 V. Beyond this window, the evolution of H2 and O2 will take place, limiting the capacity of the electrode materials. This window can be widened in practice due to the overpotentials for H2/O2 evolution at electrode surfaces.23,24Fig. 6(a) compares various batteries’ energy density and operating voltage. Then, Fig. 6(b) compares the specific capacity and standard electrode potentials of different metal anodes. From that, it is noted that except for Zn, most metals have too low a potential to permit reversible redox reactions. Therefore, choosing the right cathodes, anodes, and electrolytes regarding cell voltage is essential for achieving optimal performance.23 Moreover, in PARBs, the photovoltage compensates the charging voltage, which decreases the charging potential of the cell.25
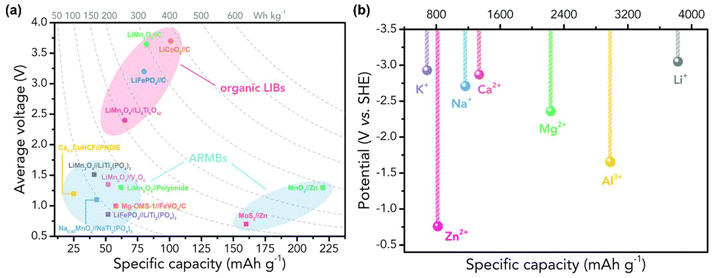 |
| | Fig. 6 (a) The operating voltage with a specific capacity of various batteries (b) standard electrode potentials and specific capacities of different metal anodes.23 Copyright: 2020 Royal Chemical Society. | |
In PARBs, open circuit voltage (OCV) represents the maximum voltage that the photoelectrode can generate under illumination without any external current flow, which is a direct measure of the energy difference between the photogenerated electrons and holes, providing insight into the energy conversion efficiency of the photoelectrode material. A high OCV suggests effective charge separation and minimal recombination losses and indicates that the device can generate and maintain sufficient energy for the redox reactions essential for battery photoassisted charging and discharging. It is noted that different materials yield different OCV values based on their band positions and surface states. By analyzing OCV, it is possible to identify those with more favorable energetics for the targeted redox reactions in PARBs for maximum efficiency. Moreover, higher OCV means that the battery can store more energy per charge/discharge cycle, making it more efficient and potentially extending its operational life in practical applications.
4.3. Energy/power density
Energy density is a critical parameter in metal-ion rechargeable batteries as it directly affects the performance and refers to the battery's ability to store energy. There are two types of energy density to consider, namely gravimetric energy density, which denotes the amount of energy stored per unit mass (W h kg−1), where weight is a key factor for portable and wearable devices – higher gravimetric energy density means a longer runtime for a given battery weight; and volumetric energy density, the amount of energy stored per unit volume (W h L−1 or W h cm3). This is especially crucial factor where space is limited. A higher volumetric energy density allows for more compact designs without compromising energy storage capacity.17,26 In PARBs, energy density also reflects how well the system can store energy harvested from light. However, if the battery has a high energy density but the photovoltaic efficiency is low, the overall efficiency will be poor, and vice versa.16 Power density is another key performance parameter requiring energy in short intervals. Power density is defined as the amount of power delivered per unit volume or mass of the battery (W L−1 or kg−1). It influences the ability of the battery to provide high power outputs in a short period, which is essential for applications requiring rapid energy delivery. In PARBs, power-density batteries determine how quickly the system can store light-generated energy. Since sunlight is often intermittent, high power density allows the battery to store energy quickly when the sun is available. On the other hand, if the power density is low, the battery may not fully capture the available energy during peak hours of sunlight, reducing the device's overall efficiency.17,27,28
4.4. Photoconversion efficiency
The photoconversion efficiency (PCE) resembles the solar-to-electrical energy conversion efficiency, which is crucial in PARBs and reflects how much incident sunlight is converted into usable energy for battery charging. A higher efficiency means more sunlight is captured and converted into energy, allowing the battery to charge faster or store more energy, minimizing energy loss as heat and improving stability and reliability. Low PCE results in limited energy input, affecting the overall energy density. To achieve high battery performance, a high PCE ensures enough energy is stored during daylight when sunlight is available.29 For PARBs, Boruah et al.30 calculated the PCE values by using the following formula,| |  | (1) |
where E is the discharge energy at discharge-specific current, Pin is the illuminated light intensity, tph represents photoassisted charging time, and Aph is the illuminated surface area.
On the other hand, Yan et al.18 give a formula for calculating energy efficiency (η) and energy saving (Es) for PARBs.
| |  | (2) |
| |  | (3) |
4.5. Cycling stability
Cycling stability is a critical factor for the performance and durability of PARBs. It refers to the ability of the battery to maintain its capacity and efficiency over prolonged charge and discharge cycles. A battery with poor cycling stability will degrade over time, leading to reduced capacity and performance, while higher cycling stability ensures that the battery can withstand numerous charge/discharge cycles without significant loss of efficiency or storage capacity, thus extending the lifetime of the device. On the other hand, reduced cycling stability decreases the efficiency of converting light into stored energy and reduces the overall efficiency of the photoassisted process.16,31,32
4.6. Self-life
The self-life of the active materials is crucial for determining the overall performance, reliability, and economic viability of PARBs. Here, the active materials may degrade over time, which can reduce the performance and efficiency of the battery. A long self-life implies a lower self-discharge rate, particularly in intermittent usage scenarios where the battery needs to hold its charge for extended periods between uses. Moreover, the photoactive material can suffer from photodecomposition, and ensuring a long self-life helps maintain the battery's structural stability. In summary, a longer self-life in PARBs ensures better performance, reliability, cost-effectiveness, and sustainability, all critical for commercial and practical application.2,32,33
5. Metal-ion-based photoassisted rechargeable battery
5.1. Monovalent-based photoassisted rechargeable battery
5.1.1. Li+-ion-based photoassisted rechargeable battery.
Li metal is known for its lightweight (∼6.94 g mol−1) nature with a specific gravity of ∼0.53 g cm−3,34 hence it delivers a higher specific capacity value of 3860 mA h g−1 compared with lead (only 260 A h kg−1).35 Additionally, Li is a highly electropositive metal with the lowest working potential of −3.04 VRHE and an energy density of 11.7 kW h kg−1.34 Akira Yoshino, a Japanese chemist, developed the Li-ion battery in 1986. From then onwards, they have been well explored, and a substantial increment in the specific capacity has been observed from 120 W h kg−1 to 270 W h kg−1. The performance improvement can be explained by changes in chemistry/design and packing engineering during manufacturing processes. The Li-ion-based PARB was first investigated by Nomiyama et al. in 199536 using a p-type CuFeTe2 semiconductor as a cathode, and they achieved a photocharged energy density of 0.562 W h kg−1. After that, many reports investigated the use of different electrodes were utilised, and some were analysed. It is noted that Lee et al.37 illuminated a widely employed LiMn2O4 cathode which enables effective charge separation, thus leading to fast charging, because the exposure of LiMn2O4 under illumination lowers charge transfer resistance. In this work, under illumination, Mn at lower valency (∼3+) was promoted to a higher oxidation state (4+), and Li+ was ejected from LiMn2O4 into the electrolyte, with the electrons flowing through the external circuit, thus achieving photoassisted charging until reaching equilibrium.37,38 Furthermore, Wang et al.38 replaced the Mn with V, and they formed γ-LiV2O5, which was also extensively investigated due to its high theoretical capacity and readily accessible V5+/V4+ redox couple for fast charging and self-powering.39,40 The crystal structure of LiV2O5 consists of [V2O5] layers with edge and corner-sharing [V5+O5] and [V4+O5] square pyramids along the ab-plane, and Li+ are positioned in between [V2O5] layers by octahedral coordination with oxygen atoms.41 Here, various characterizations have been done to understand the nature of the material and its compatibility for constructing a Li-ion PARB. X-ray diffraction analysis (XRD) confirmed the γ phase of LiV2O5, while scanning electron microscopy (SEM) imaging indicated nanorods with a bundled structure, as seen in Fig. 7(a), and the optical band gap is 2.8 eV, deduced from UV-vis spectroscopy (Fig. 7(b)). Charge separation and transport properties verified LiV2O5 as a photodetector, where the rapid current response was observed for illumination and darkness.
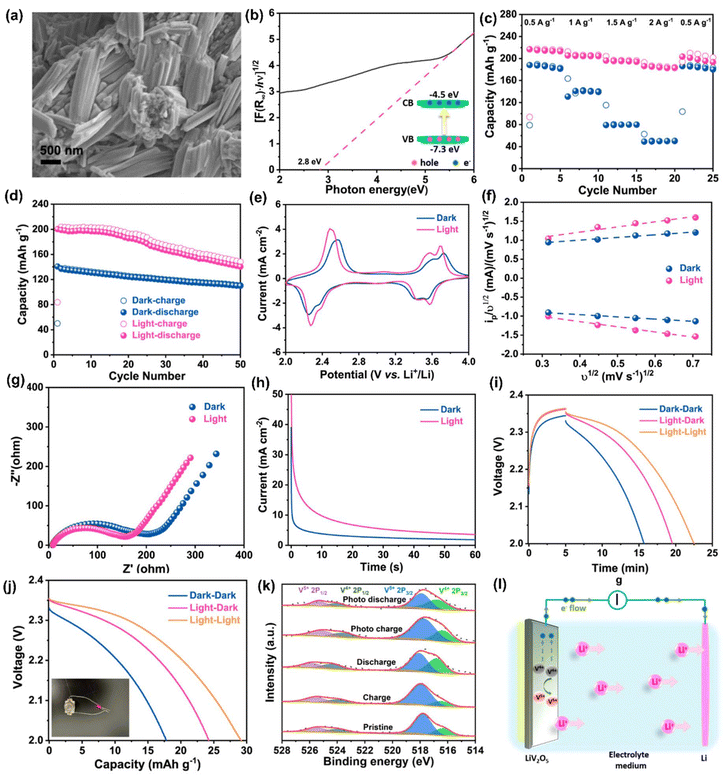 |
| | Fig. 7 (a) SEM image and (b) Kubelka–Munk curve from the diffusion reflectance spectra of LiV2O5 (inset: band energy diagram), (c) rate performance based on GCD curves at 0.5, 1.0, 1.5, and 2.0 A g−1 in dark and light conditions, (d) cycling stability at 1.0 A g−1 in dark and light conditions, (e) CV curves at 0.3 mV s−1, (f) diffusion constant analysis, (g) AC impedance spectra (h) J–t curves after charging at 2.5 VLi+/0 for 60 s in dark and under illumination, (i) photocharge and galvanostatic discharge curves, (j) corresponding discharge capacities (inset: photograph of a 2 V LED powered by a Li-ion PARB), (k) XPS spectra of V 2p3/2 and V 2p1/2 of LiV2O5, (l) schematic illustration of the photoassisted charging mechanism of the Li-ion PARB.38 Copyright: 2022 American Chemical Society. | |
A study on photoassisted charging ability was done by modifying a conventional coin cell with a quartz window for light illumination on the photoactive material. Galvanostatic charge–discharge (GCD) and cyclic voltammetry (CV) were performed to observe the function of the material as the battery, with a discharge capacity of 187.5 mA h g−1 and a coulombic efficiency of 98.8% on the 2nd cycle. A capacity retention of 89.3% after 20 cycles at 1 A g−1 indicated the material was quite stable and functional. Discharge capacity was reduced in the dark from 181 to 50 mA h g−1 when the current density varied from 0.5 to 2 A g−1 due to the higher polarization effect at higher current density. Still, under illumination, the capacity was observed to be enhanced by 13.6% (Fig. 7(c and d)). This established that illumination could reduce the polarization of the Li-ion PARB and hence promote fast charging. This will play a prominent role in the future, as energy storage with a better charging rate under illumination can benefit energy storage and utilization. The redox peaks obtained from CV (Fig. 7(e)) indicated a multi-step electrochemical reaction. The current response curve was also enhanced during the charging process under illumination, indicating an accelerated redox reaction, i.e. Li+ diffusion, thereby supporting the photorechargeable property of the Li-ion battery. EIS measurement in Fig. 7(g) showed a decrease in charge transfer resistance, and chronoamperometry (Fig. 7(h)) curves deduced that the current decayed at a slower rate under illumination, indicating an improvement in electrochemical performance. To test the effectiveness of recharging under illumination only, PARB performance was observed under illumination without any current provided for charging the device. The increase in capacity was observed for 5 min of photoassisted charging, as shown in Fig. 7(i), thus indicating fast charging and charging without external bias. To demonstrate the practical application, the photoassisted rechargeable battery under illumination for 20 min could power a 2 V, 0.6 mW red LED for more than 90 min Fig. 7(j). The notable part of this work is that no charge separation layer was observed in the device, along with an energy conversion efficiency of 9% for the full spectrum (LED white light, 33 mW cm−2). Under illumination, V4+ ions get excited into V5+ ions and photoelectrons, thus de-intercalating Li+ from LiV2O5, electrons move via an external circuit, and charge compensation occurs (Fig. 7(l)).
Likewise, Boruah et al.30 devised a PARB using V2O5 nanofiber photocathodes mixed with poly(3-hexylthiophene-2,5-diyl) (P3HT) and reduced graphene oxide (rGO) additives on carbon felt (CF), and Lithium bis(trifluoromethanesulfonyl)imide (LiTFSI) electrolyte. In this, V2O5 acted as a photoactive and energy storage material. This design promoted better charge separation; P3HT not only has hole-blocking ability but can also generate electron–hole pairs under illumination (Fig. 8(a)). The device has a PCE of 2.6% for 455 nm illumination, thereby showing a 57% capacity increase and potential to 2.82 V, as seen in Fig. 8(b). Also, Li et al.42 have proposed a PARB with TiO2 photoelectrode, Li metal anode, and LiFePO4 as cathode with an I− ion redox shuttle. The schematic illustration and energy diagram of this device are given in Fig. 8(c and d). The device can be charged at a lower potential of 2.6 V and discharged at a potential of 3.4 V, as shown in Fig. 8(e), thereby saving energy during charging. Under illumination, an I− is oxidized by photogenerated holes of TiO2 and diffuses to LiFePO4 electrode surface, and LiFePO4 converts to Li+ and FePO4, and I3− is again reduced back to I− to complete the full redox cycle. In the meantime, the photogenerated electrons transfer to the anode and reduce the Li+ to Li. Subsequently, the photovoltage produced on the TiO2 photoelectrode compensates for the charging potential. Since the CBM of TiO2 (∼2.6 V) is lower than the LiFePO4/FePO4 standard potential of 3.45 V, the photoassisted charging voltage is anticipated to be lower than the conventional Li–LiFePO4 batteries. Nonetheless, no study on PCE and cycling stability was conducted here. The discharge capacity was observed at a low current density value, which cannot be used for electronic devices. Similarly, Nikiforidis et al.43 used a hematite (α-Fe2O3) photoelectrode and aqueous I−/I3− catholyte, and this device delivered energy efficiency for the photoassisted charging process of ∼95.4%, which was ∼20% higher than dark at a current rate of 0.075 mA cm−2 and displayed over 600 h of cycling without significant performance decay or photocorrosion.
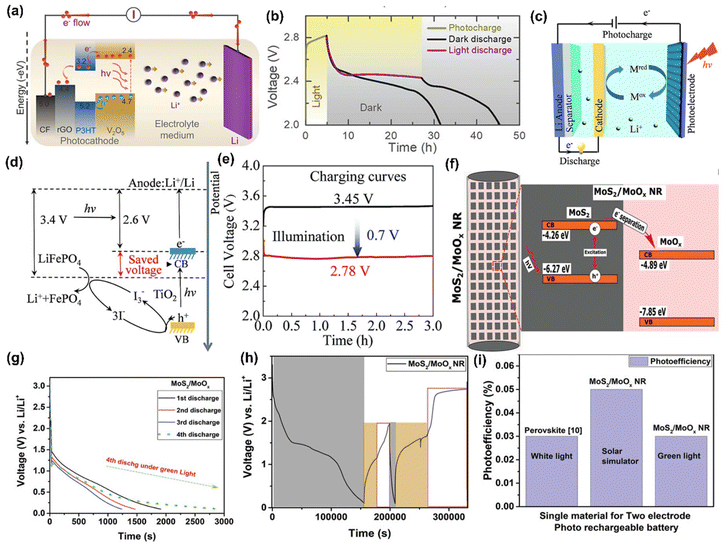 |
| | Fig. 8 (a) Schematic of photoassisted charging mechanism of V2O5 nanofibers photocathode mixed with P3HT and rGO additive, (b) photocharge for 5 h and galvanostatic discharge at 200 mA m−2.30 Copyright: 2021 American Chemical Society. (c) Schematic illustration and (d) energy diagram of Li-ion PARB, (e) charge curves at 0.02 mA cm−2.42 Copyright: 2015 Royal Society of Chemistry. (f) Schematic of electron–hole separation in the MoS2/MoOx NR heterostructure (black-MoS2, light pink-MoOx), (g) voltage–time curves, (h) discharge in dark at 0.2 mA cm−2 (black) followed by the voltage equilibration (yellow) and photoassisted charging (white), (i) photoefficiency comparison of MoS2/MoOx NR to another reported single-perovskite material for two-electrode PARB.44 Copyright: 2021 Wiley. | |
Kumar et al.44 presented a two-electrode Li-ion PARB with a MoS2/MoOx hetero-structured semiconductor for the effective separation of photogenerated electron–hole pairs, and higher energy capacity was also considered as a factor for heterostructure material selection when compared with individual counterparts. Because of the recombination effect and high exciton binding energy, it is troublesome to separate photogenerated charges. Hence, the authors suggested type II semiconductors (Fig. 8(f)) for effective charge separation after light absorption, a large surface area for Li+ diffusion, and controlled volume expansion during the cycling process. Here, the nanorods were hydrothermally synthesized and later, using CVD, formed the heterostructure of MoS2/MoOx, in which MoS2 acts as both a photoactive and energy storage material, whereas MoOx acts as a charge separation layer. Thus, discharge capacity was observed to be 162 mA h g−1 (Fig. 8(g)). After the voltage stabilization (1.14 V), under illumination, voltage enhancement up to 1.95 V within 6 h was visible in Fig. 8(h). This is a simple and effective synthesis method, thereby ensuring easier device formation. However, in terms of practicality, the PCE is 0.05% (Fig. 8(i)), which is not significant enough to support the devices in photo-only charge mode. The hybridization of dye-sensitized solar cells (DSSC) with Li-ion intercalating electrodes was introduced by Hauch et al.5 Already, DSSC contains most of the components of a battery, such as one redox couple, an electrolyte, and two electrodes (TiO2 and Pt). To complete the battery, only a second redox couple is needed. Hence, the authors put forth WO3 as the additional redox couple, which helps in charge storage, thus modifying the DSSC into the PARB (Fig. 9(a)). In continuation of this, the combination of DSSC and Li-ion battery was observed by Guo et al.45 in which TiO2 nanotubes (NTs) were grown on titanium, which works as a back plate for TiO2. When light is illuminated, the photogenerated electrons from the dye are injected into the conduction band (CB) of TiO2 NTs and transferred through the Ti foil to the anode. In contrast, the photogenerated holes accumulate at the Pt electrode. Then Li-ion reacted on at the anodes as follows: TiO2 + xLi+ + xe− → LixTiO2, and simultaneously, at the cathode: LiCoO2 → Li1−xCoO2 + xLi+ + xe−. Furthermore, the free electrons released flow toward the counter electrode (Pt). After illuminating the three series-connected DSSC, the voltage was increased from 550 mV to 2996 mV in 440 s, and after the photoassisted charging, the discharging back to 750 mV occurred in about 1400 s (Fig. 9(b)) with a discharge current density of 100 μA and the stored capacity of 33.89 μA h with 3.39 V open circuit voltage (VOC) with 1.01 mA cm−2 short-circuit current density (JSC) (Fig. 9(c)), and the stored energy was used to drive a commercial red LED, as seen in Fig. 9(d). Furthermore, Paolella et al. have demonstrated7 DSSC combined with Li+ photoassisted charging. Particularly, here they reported the direct photooxidation of LiFePO4 along with N719-Ruthenium-dye as a photocathode, Li metal as anode, and LiPF6 in a carbonate-based electrolyte with a two-electrode system. As seen in Fig. 9(e), after 70 h, the battery reached 3.62 V and discharged at C/24 to a capacity of 104 mA h g−1. After photoassisted charging, the device was discharged at C/24 with a capacity of 99.3 mA h g−1. As mentioned, dye-sensitization generated electron–hole pairs, aiding the conversion of LiFePO4 nanoplatelets to FePO4 at the cathode. Then, the electrons were utilized to form a solid electrolyte interface (SEI) at the anode via oxygen reduction into peroxide/superoxide species. Here, the interfacial study of LiFePO4/dye photocathode was required to reduce charge recombination, and a reversible redox mediator was used to accept the photogenerated electrons, thereby reducing the electrolyte-reduction reaction.
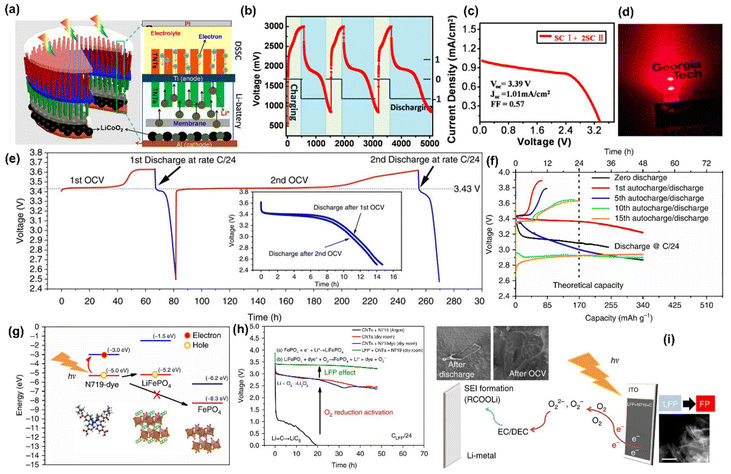 |
| | Fig. 9 (a) Design and principle of an integrated DSSC and Li-ion battery with TiO2 nanotubes, (b) discharge/charge cycling performances, (c) J–V curves of the DSSC with three tandem cells (SC I and 2SC II) connected in series, (d) LED powered by using the storage energy.45 Copyright: 2012 American Chemical Society. (e) VOC and (f) GCD curves of LiFePO4, (g) energy band alignment of the photocathode components, (h) discharge curves of films in different gas atmospheres at C/24 discharge rate, (i) photoassisted charging mechanism of LFP(dye)/electrolyte/Li cell.7 Copyright: 2017 Nature. | |
Furthermore, Li–O2 batteries have attracted much attention because of their ∼10 times higher energy density than Li-ion batteries. Their redox storage mechanism involves the oxygen evolution reaction (OER) and the oxygen reduction reaction (ORR) for the O2/Li2O2 couple, with a thermodynamic equilibrium potential of 2.96 V. However, the sluggish kinetics and higher energy barriers produce high overpotential, which diminishes efficiency. As mentioned, this could be overcome by integrating a photocathode into a Li–O2 battery (Fig. 10(a)). For example, Jia et al.46 have successfully studied the size variation in photocatalysts by considering siloxane; therein, they compared the Li–O2 PARB with the larger-sized siloxene nanosheets (SNSs) with siloxene quantum dots (SQDs) photoelectrode, bringing a superior efficiency of 230% with the highest discharge potential of 3.72 V and lowest charge potential of 1.60 V, thus allowing the long-term cycling life with only 13% attenuation after 200 cycles at 0.075 mA cm−2. Additionally, it displayed an efficiency of 162% at 3 mA cm−2 with a higher discharge capacity of 2212 mA h g−1 at 1 mA cm−2. Also, from the free energy diagram, it is clear that the simulative charge voltages (UC) and discharge voltages (UDC) are attained as the minimum and maximum voltages, respectively, which make each pathway persist downhill, as shown in Fig. 10(b and c). Compared with SNSs, the SQD-based Li–O2 battery showed a reduced reaction barrier with a theoretical overpotential of 0.22 and 0.42 V for ORR and OER, respectively, with an overall overpotential of 0.64 V for better performance.
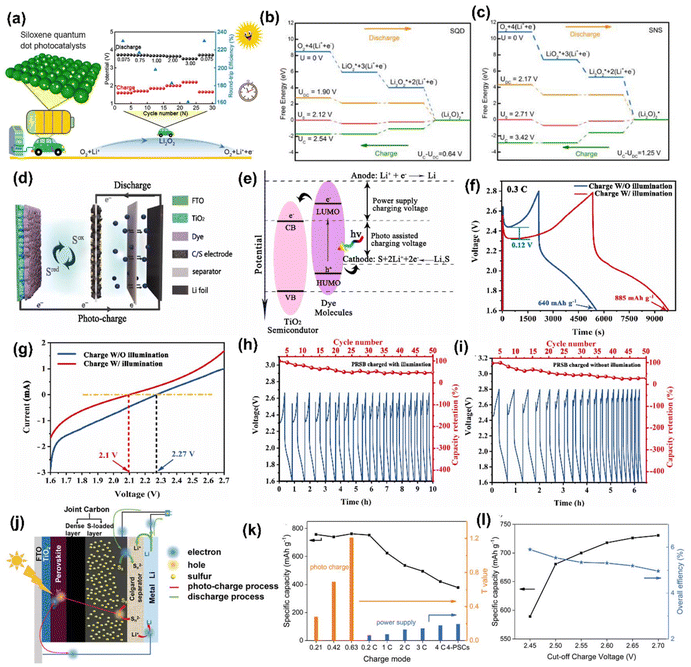 |
| | Fig. 10 (a) Schematic representation of Li–O2 PARB with a siloxene quantum dot (b–c) energy diagrams for the discharge–charge reactions on the active surface of SQD and SNSs.46 Copyright: 2023 American Chemical Society. (d) Device structure, (e) energy diagram, (f) GCD curves at 0.3C, (g) LSV curves with and without illumination, (h) cycling performance with illumination, and (i) cycling performance without the illumination of the Li–S PARB.47 Copyright: 2023 Elsevier. (j) Schematic diagram, (k) discharge capacities (black line) and T values (blue and yellow columns) of the battery under different charge modes, (l) discharge capacity and overall efficiency of different cut-off photocharge voltage of the fabricated PSC-Li–S battery.48 Copyright: 2019 Wiley. | |
Also, Li–S batteries are a potential replacement for Li-ion batteries as energy storage units of PARBs.18,47–49 Qu et al.47 have combined a Li–S battery with DSSC; the integrated sulphur PARB schematic is given in Fig. 10(d). It comprises a Li-metal anode, a dye-sensitized TiO2 photoelectrode, and a sulfur and multi-walled carbon nanotubes (S/C) cathode. Under dark conditions, Li metal is oxidized to Li+, and the electrons are collected at the anode during discharging, similar to conventional Li–S batteries. At the cathode, sulfur reacts with Li+ and electrons, reducing to soluble polysulfide in an electrolyte. When light is illuminated, after the dye produces the photogenerated electrons, they are moved into the CB TiO2. After that, the oxidized dye molecules react with partially reduced sulfur in the electrolyte to generate the oxidized sulfur. In the meantime, the electrons are reducing Li+ to Li metal at the anode, as shown in Fig. 10(e). Here, the polysulfides were formed by the S/C electrode, and LiTFSI was partially oxidized with holes from the photoanode, which can significantly cut down the charging voltages of the Li–S battery under illumination. Fig. 10(f) shows that the reduced charging voltage of 0.12 V and the capacity with photoassisted charging reached 885 mA h g−1 from 640 mA h g−1 (without photoassisted charging). Here, it is noted that the voltage of the photoassisted charging depends on the potential difference between the sulphur redox couple and the CB of the TiO2. The linear sweep voltammetry (LSV) curves in Fig. 10(g) show that the initial oxidation voltage in the dark (2.27 V) was higher than the illumination (2.1 V). Also, after 50 cycles, the capacitance retained up to 47.7% with photoassisted charging (Fig. 10(h and i)). This cycling stability test could have been further extended to observe the durability of the design, thereby showing research on issues related to Li+ de-intercalation. Chen et al.48 have designed an integrated photobattery consisting of a perovskite solar cell and Li–S battery (Fig. 10(j)). The perovskite (MAPbI3) acted as the photoactive layer, and the charge storage was observed in the metal Li anode with sulfur-loaded carbon nanotubes. The specific capacity was 750 mA h g−1 at a photocharge rate of 2C (Fig. 10(k)), which was higher than the external power charging mode, and this device displayed an overall solar-to-energy conversion efficiency of 5.14% (Fig. 10(l)). However, the selection of the perovskite is crucial for the overall efficiency and stability of the DSSC part, whereas solid electrolytes can be leakproof for various applications.
Moreover, Andersen et al.50 have reported that the PARB with copper-based metal–organic frameworks (Cu-hexahydrobenzene) as the photoactive material can deliver both photoactivity and charge storage. The authors have claimed it as the first report on using metal–organic frameworks for photobatteries, which exhibited improved charge storage kinetics and had a discharge capacity of 126 mA h g−1 at 200 mA g−1 and capacity retention of 55% at 1000 mA g−1 current density, respectively. However, there is no information regarding coulombic efficiency or PCE efficiency. Ren et al.51 studied GeSe as a material with dual-charge storage and photoactivity properties, thus projecting it as a suitable electrode for PARB. For two-electrode studies, the authors used Li metal as the cathode and GeSe-coated FTO as the anode. The discharge capacity was observed to be 670 mA h g−1 at 0.2 A g−1 and coulombic efficiency was 99.8% for 100 cycles. In contrast, a good rate capability was observed at 2 A g−1, capable of providing high-power transfer in the application. Still, the authors did not provide PCE. Recently, Li–CO2 batteries have also been developed as a novel energy conversion and storage strategy that offers a CO2 reduction, and their theoretical energy density was up to 1876 W h kg−1.52,53 With this phenomenon, Li et al.9 constructed a Li–CO2 PARB with SiC grown on a SiC/rGO hybrid cathode. By doing so, they achieved an ultralow overpotential of 0.424 V and an energy efficiency of 84.4%. The summary of previously reported Li-ion based PARB is provided in Table 1.
Table 1 Summary of previously reported based on Li-ion PARB
| S. no. |
Device configuration |
Device type |
Photoactive material |
Band gap (eV) |
Storage material |
Electrolyte |
Light source |
Discharge capacity |
Open circuit voltage (V) |
Photoconversion efficiency (%) |
Ref. |
| 1 |
TiO2/WO3 anode |
Two electrode |
Dye coated TiO2 |
3.2 |
WO3 |
LiI + I2 in propylene carbonate + 4-tert-butyl pyridine |
1000 W m−2 and 150 W m−2 |
— |
0.6 |
— |
5
|
| Pt cathode |
| 2 |
V2O5 photocathode |
Two electrode |
V2O5 nanofibers |
2.86 |
V2O5 |
LiTFSI |
λ = 455 nm, 12 mW cm−2 |
161 mA h g−1 @ 200 mA g−1 |
2.82 |
2.6 |
30
|
| Li anode |
| 3 |
LiCoO2 cathode |
Three electrode |
N719 and N749 dye |
2.33, 1.4 |
TiO2 |
LiI, +I2, +4-tertbutylpyridine in 3-methoxypropionitrile |
100 mW cm−2 |
38.89 μA h @ 100 μA |
3.39 |
0.82 |
45
|
| Dye sensitised TiO2 NTs anode |
| 4 |
LiFePO4/N719 dye photocathode |
Two electrode |
N719 dye |
2 |
LiFePO4 |
Lithium hexafluorophosphate in carbonate |
100 mW cm−2 |
99.3 mA h @ C/24 |
3.7 |
0.06–0.08 |
7
|
| Li metal anode |
| 5 |
MoS2/MoOx NR cathode |
Two electrode |
MoS2 |
2.1 |
MoS2 |
— |
50 mW cm−2 |
162 mA h g−1 |
3.1 |
0.05 |
44
|
| Li metal anode |
| 6 |
LiV2O5 photocathode |
Two electrode |
LiV2O5 |
2.8 |
LiV2O5 |
LiFP6 in EC/EMC |
33 mW cm−2 |
185 mA h @ 2 A g−1 |
2.5 |
9 |
38
|
| Li metal anode |
| 7 |
LiFePO4 cathode |
Three electrode |
TiO2 |
3.2 |
TiO2 |
Organic LiClO4 in EC/DMC |
— |
104 mA h g−1 @ 0.01 mA cm−2 |
3.4 |
— |
42
|
| Li anode |
Aqueous: Li2SO4 + LiI |
| 8 |
Li–O2 battery |
Three electrode |
Siloxene quantum dots (SQD) |
4.87 |
SQD |
LiTFSI in DMSO |
— |
2212 mA h g−1 @ 1 mA h cm−2 |
3.72 |
— |
46
|
| Li foil anode siloxene |
| 12 |
Li–S battery |
Three electrode |
MAPbI3 |
— |
Lithium |
LiTFSI in a 1,3-dioxolane and dimethoxymethane |
300 W |
750 mA h g−1 @ 2C |
2.8 |
12 |
48
|
| 13 |
Cu-HHB photocathode |
Two electrode |
Copper-hexahydrobenzene |
1.81 |
Copper-hexahydrobenzene |
LiTFSI in EC/PC |
— |
107–126 mA h g−1 @ 200 mA g−1 |
— |
— |
50
|
| Li anode |
| 14 |
Li foil cathode |
Two electrode |
GeSe |
1.14 |
GeSe |
LiClO4 in polycarbonate |
2000 lm LED white light lamp |
670 mA h g−1 at 0.2 A g−1 |
— |
>30 (theoretical) |
51
|
| GeSe/FTO anode |
5.1.2. Na+-ion-based photoassisted rechargeable battery.
Although Li-ion dominates the energy storage market due to its higher energy and power densities and small size, the limited abundance, low output voltage, and irregular distribution of Li resources are challenges. Because of this, sodium (Na) ion has been considered an alternative to Li+ because of its natural abundance, low cost, and similar physical and chemical properties to Li.54 Similar to Li-ion PARB, the photoassisted charging mechanism was also incorporated in Na-ion batteries, and various photoelectrodes, such as TiO2, MoO3, SnS2, etc.,55–59 have been extensively studied. For instance, Gui et al.55 have reported a Na-ion PARB with Fe2(MoO4)3 microspheres as energy storage material and TiO2 being used as a photoactive material. As mentioned earlier, under illumination, photogenerated electrons from dye are transferred into the CB of TiO2, and then the dye molecules are reduced by I− from the electrolyte. The injected electrons from TiO2 are transferred to Fe2(MoO4)3via the external circuit; electrons are stored by Fe2(MoO4)3 photoassisted charging. Then Na+ ions are diffused across the membrane to counterbalance the charge created by the abstraction of electrons; the illustration of the device is shown in Fig. 11(a and b). Also, Fig. 11(c) shows the photocurrent and photovoltage profiles under illumination, in which the initial anodic photocurrent density was 1.3 mA cm−2, and it quickly decreased with an increase in time to 60 μA cm−2. Then, the battery voltage was dramatically increased, obtaining a stable voltage of 0.63 V, known as the difference in Eredox between the dye-sensitised TiO2 and the I−/I3− redox couple. Moreover, the discharge performance was analysed under different current densities in dark conditions. Fig. 11(d) shows that the cycles of photocharge and discharge curves indicated relatively good cycling stability. However, the study could have been more impactful if cycling stability had been extended for more cycles, and the coulombic efficiency and discharge capacity could have been reported.
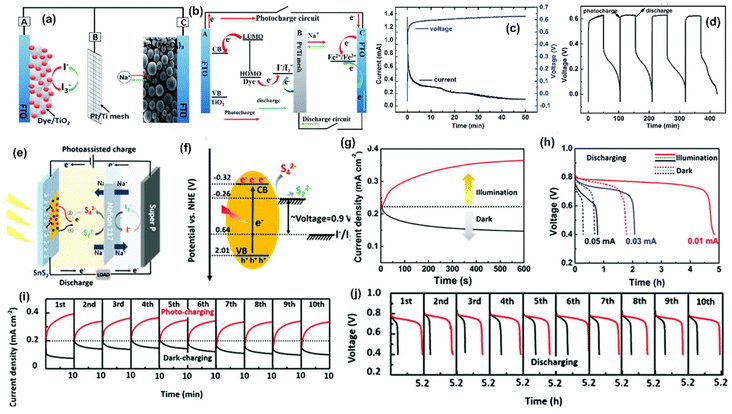 |
| | Fig. 11 (a and b) Schematic of the configuration and working mechanism of the Na-ion PARB, (c) profile of the current and voltage of the under illumination, (d) discharge/charge cycling performances of the PARB.55 Copyright: 2018 Royal Society of Chemistry. (e) Schematic and (f) energy diagram of an aqueous redox PARB, (g) potentiostatic charge curves at 1 V and the discharge curves (f) at different current densities, (i) current density profile at 1 V, (j) corresponding galvanostatic discharge profiles at 0.01 mA cm−2.56 Copyright: 2019 Royal Society of Chemistry. | |
Tian et al.56 have projected SnS2 as a dual functional electrode, such as both photocathodes and an anode, with Super P carbon as a counter electrode using Na2S4 anolyte and NaI catholyte, as seen in Fig. 11(e). Here, the photogenerated electrons from SnS2 moved to the SEI and reduced S42− to S22−. In the discharge process, the S22− and I3− moved back to their initial states, with the output voltage of the cell being 0.9 V (0.64 + 0.26 V), as seen in Fig. 11(f). Fig. 11(g) displays the current response under illumination at 1 V, which revealed that light acted as the main drive for enhanced performance and current density steadily increased on photoassisted charging and stabilized, meaning that the photogenerated charge carriers started to react to boost the current until obtaining dynamic equilibrium, leading to current stability. Moreover, the equivalent galvanostatic discharge profiles at various current densities are given in Fig. 11(h), which demonstrated prolonged discharge suggesting a capacity enhancement. Furthermore, the good cycling stability for photoassisted charging and discharging is understood from Fig. 11(i and j). Overall, this device delivered coulombic efficiencies of 98% for 10 cycles and a capacity of 140 mA h g−1 with a PCE of 0.11%.
Similarly, Li et al.58 devised an aqueous Na-ion PARB that consisted of Na2S4 as anolyte and NaI as catholyte, meaning S2−/S42− anode and I−/I3− cathode, along with TiO2 as photoelectrode (Fig. 12(a)). Here, it was seen that under illumination, the photogenerated electrons in the CB of the TiO2 were transferred into the anolyte, resulting in the reduction of Na2S4 into Na2S. The photogenerated holes in the valence band (VB) instantly oxidized the NaI into NaI3 in the catholyte. Moreover, during the discharging, the reverse processes, namely oxidation of Na2S to Na2S4 and reduction of NaI3 to NaI, took place in the anolyte and catholyte, respectively. The redox potentials of S42−/S2− and I3−/I− couples were found to be ∼2.20 and ∼3.22 VNa+/Na, respectively, as shown in Fig. 12(b), which means that the theoretical voltage of these Na polysulfide/iodine-based batteries was ∼1 V. For photoassisted charging, the theoretical photovoltage should be estimated at only 0.07 V, which is the potential difference between the redox potential of the S42−/S2− and the CBM of the TiO2, which is ∼2.27 VNa+/Na as shown in Fig. 12(b). Moreover, Fig. 12(c) shows the gradient color change of electrolytes of the S42−/S2− anolyte and the I3/I− catholyte redox couple, which suggests the depth of charge/discharge process and reversibility. Fig. 12(d) shows the GCD curves at 0.5 mA cm−2, showing an average charging voltage of 1.09 V with a discharging voltage of 0.97 V. Fig. 12(e) shows the cycling stability of a PARB, and the enlarged 1st and 20th cycles are given. From that, it is clear that the initial photoassisted charging voltage was 0.08 V with ∼90% energy savings. After 20 cycles, this cell still delivered 0.1 V of charging voltage, contributing to ∼88% of input energy saving, suggesting good stability.
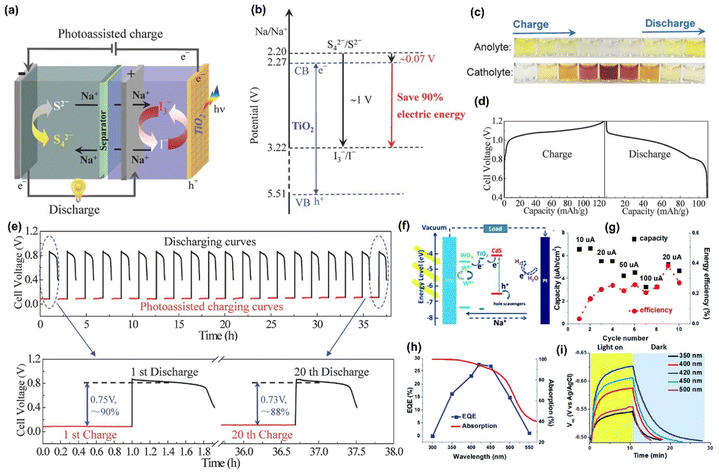 |
| | Fig. 12 (a) Schematic and (b) potential diagram for the photoassisted charging process of sodium polysulfide/iodine battery, (c) visual color gradient of anolyte and catholyte during charge and discharge, (d) charge and discharge curves at 0.1 mA cm−2, (e) photoassisted charging and discharging curves at 0.01 mA cm−2.58 Copyright: 2016 Wiley. (f) Schematic of PARB with WO3–(TiO2)–CdS, (g) discharge current-dependent areal capacity and energy efficiency with photoassisted charging, (h) external quantum efficiency and (i) wavelength dependent VOC of the system.59 Copyright: 2020 Royal Society of Chemistry. | |
Wang et al.59 reported that the bifunctional material for an aqueous Na-ion PARB with a WO3–(TiO2)–CdS photoelectrode and Na2SO3 + Na2S acted as a hole-scavenging electrolyte with a Pt counter electrode, in which CdS produced and transferred the photogenerated electrons to WO3 over the TiO2 interface. They noted that the maximum potential was restricted by the CBM of TiO2, and the calculated potential of the photoelectrode was ∼1.2 V. It is known that the reduction potential of W6+/W5+ is lower than the CBM of CdS and TiO2 (Fig. 12(f)) and that the instantaneous intercalation of Na+ from the electrolyte into the WO3 is necessary to maintain the device charge balance; the reaction is as follows: WO3 + xNa+ + xe−(CdS) → NaxWO3. Fig. 12(g) compares the discharge capacities and overall energy efficiency, and the discharge capacity of 12.3 μA h cm−2 was achieved when the device was photocharged for 10 min and later discharged at 10 μA current. Moreover, the device achieved a reasonably stable discharge capacity of 4.5 mA h cm−2 which was around ∼90% of its initial value. Also, external quantum efficiency (EQE) was measured and is given in Fig. 12(h). It was shown that the 350–550 nm wavelength range contributed ∼30% to the photoassisted charging process, which makes it a visible light-rechargeable energy storage device. Furthermore, the VOC profile vs. Ag/AgCl at different light-charging wavelengths was measured and is shown in Fig. 12(i), and it is seen that monochromatic light of 420 nm was found to charge the photoelectrode. However, an irreversible phase change occurred during photoassisted charging, which was resolved by optimizing the operating potential window, which was thereby reduced to 0.25 V, at the expense of loss of capacity and material utilization. Capacity decrement in the device was mentioned, and further increase in the number of cycles of cycling stability could be beneficial for the longevity of the device. As a modification, Pt was replaced by a Cu2S/brass electrode as it suffered from instability in the sulfide electrolyte. On the other hand, Lou et al.57 have studied a bifunctional MoO3 photoelectrode. During photointercalation, the MoO3 is transformed into NaxMoO3 (0.33 < x < 1.1); the authors have explained the intercalation mechanism, backed up by the operando synchrotron XRD methodology, which provides the change in the structure of the electrode lattice, which reflects the relationship between the PEC response and the structure of the photoelectrode.
5.1.3. K+-ion-based photoassisted rechargeable battery.
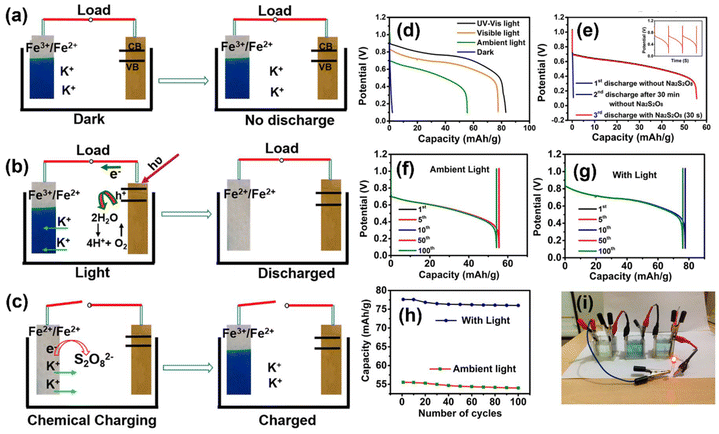
Similar to Na-ion, K-ion batteries have also attracted extensive attention due to their higher power density and low cost, and integrating with photoassisted charging again opens the possibility for unlimited solar energy utilization. For instance, Thimmappa et al.6 have successfully formed a photoanode using TiN and iron(III)hexacyanoferrate(II) as cathode material, which is helpful in the insertion and deinsertion of K+ with KCl containing sodium Na2S2O8 electrolyte (Fig. 13(a)). In this work, the KFe[Fe(CN)6](Fe3+/Fe2+) was selected as an active species that can reversibly undergo intercalation and deintercalation of K+, whereas TiN was selected as the photoelectrode due to the existence of an inherent oxynitride layer on its surface60 and because it has a band gap of ∼2.2 eV to utilize visible light from the solar spectrum. Also, it has better conductivity and higher corrosion resistance. Here, after illumination, the generated photoelectrons from the photoelectrode were transferred to KFe[Fe(CN)6] (Fe3+/Fe2+), and the reduction took place to form K2Fe[Fe(CN)6] (Fe2+/Fe2+), with instantaneous K+ intercalation, as seen in Fig. 13(b). From Fig. 13(d), it can be seen that under ambient light the attained VOC was ∼1.1 V, in the dark the VOC was ∼0.74 V (Fig. 13(f)), and under the illumination of 35 mW cm−2, the VOC up to ∼1.2 V was obtained (Fig. 13(g)), signifying that the facilitation is visible light-driven. It was noted that the measured half-cell VOC values of KFe[Fe(CN)6] (Fe3+/Fe2+) and TiN were ∼1.12 VRHE and ∼16 mVRHE, respectively. The authors claimed that the appropriately positive value of TiN (16 mVRHE) compared with the equilibrium H2 reduction potential makes it a suitable anode without the problem of HER. After the first discharge without Na2S2O8, the subsequent discharge after 30 min gave inferior capacity, as shown in Fig. 13(e). Nevertheless, with Na2S2O8, KFe[Fe(CN)6] (Fe3+/Fe2+) redox state was quickly restored due to the oxidation of Na2S2O8 on K2Fe[Fe(CN)6] (Fe2+/Fe2+) (Fig. 13(c)). Also, it was noted that the analogous discharge capacities obtained with and without Na2S2O8 (Fig. 13(d)) make it evident that Na2S2O8 did not affect the discharge rate taking place at the cathode, which was mainly acting as a chemical charging agent and gave a discharge capacity of 77.8 mA h g−1, with capacity retention of 97.9% of its initial capacity after 100 cycles (Fig. 13(h)). Under ambient light, an LED was powered using the PARB, as shown in Fig. 13(i).
 |
| | Fig. 13 (a) Photobattery in the dark, (b) discharge reactions in the light, (c) Na2S2O8-assisted rapid recovery of the battery active species, (d) discharge curves in light at 400 mA g−1. (e) Continuous discharge behavior at 400 mA g−1 in light with and without Na2S2O8 without external current, (inset: multiple charge–discharge with Na2S2O8), (f–g) cycling performance at 400 mA g−1, (h) capacity vs. cycle number, (i) image of photobattery powering a LED.6 Copyright: 2015 American Chemical Society. | |
5.1.4. H+-ion-based photoassisted rechargeable battery.
Nowadays, the hydrogen storage process is seen as an useful method since hydrogen is considered as clean alternative to fossil fuel with a higher energy density of ∼140 MJ kg−1,61 and we note that the integration of hydrogen production, storage and its utilization has been investigated. For hydrogen production, PEC water splitting is considered an efficient means of solar energy conversion and to produce hydrogen in a renewable manner for scalable green hydrogen production.62 In a typical PEC reaction, electron–hole pairs are generated after illumination of the photoelectrode, and there is separation and transfer of photogenerated charge carriers, leading to water splitting to form molecular hydrogen. Nevertheless, if the light is removed, electrons and holes will recombine instantly, leading to the sudden termination of photoactivity. The PEC cell can be used to charge a battery in the dark by integrating two devices: solar cells for energy conversion and a battery for charge storage. For that, Lei et al.63 have projected a PARB with a hydrogen storage mechanism in a dual-phase electrolyte with hydrogen generation, utilization, and storage with AB5-type hydrogen storage alloys (MH-Ni), which was used as a counter electrode in the hybrid combination of DSSC and electrochemical cell. PEDOT-modified Nafion was used as a separator. The schematic diagram with DSSC and hydrogen storage mechanism is shown in Fig. 14(a). As is known, under illumination, dye molecules are excited to produce photogenerated electron and hole pairs, and electrons are quickly moved to the CB of TiO2 and transferred to the counter electrode through the external circuit. In the counter electrode (MH-Ni), the photogenerated electrons facilitate the water splitting on the counter electrode to produce molecular hydrogen, which is instantly absorbed and stored in the hydrogen storage alloy. As shown in Fig. 14(b and c), the voltage jumps from 0.36 to 1.06 V under illumination, then increases gradually to 1.46 V. In the discharge process under dark conditions, it shows the typical discharge characteristic of conventional batteries with a sloped discharge curve, primarily associated with the potential difference between the I−/I3− redox couple and alloy anode. Fig. 14(d) shows I–V characteristics with hydrogen storage alloy as a counter electrode, which has a lower efficiency than DSSC with a Pt counter electrode. From Fig. 14(e), it is seen that the ηCE value is improved slightly and reaches a steady value after nine cycles owing to the slower activation process of the alloy anode, whereas the relatively lower change in ηEC value leads to a gradual increment in the overall energy conversion efficiency (OECE). Still, the OECE value is lower than 1%, hence more efforts should be made to increase the OECE. On the other hand, developing photoactive materials that can store photogenerated charges under illumination and release the stored energy in dark conditions built in a single device is beneficial. For example, Lou et al.64 have studied charge separation, storage, and discharge in α-MoO3. The anodization and its effectiveness in tuning pH variation to tune MoO6 distortion in α-MoO3 were demonstrated. The α-MoO3 has an orthorhombic arrangement with a preferential orientation of (0k0) as pH increases. α-MoO3 can store charges obtained under illumination, which is influenced by the amount of MoO6 octahedral distortion, which affects the balance between the generation of photocurrent and charge storage (Fig. 14(f)). Fig. 14(g and h) shows that the highest charge storage was attained at pH = 9, and the highest anodic photocurrent generation was achieved at pH = 6. They claimed that the larger distortion favors charge storage and the lesser distortion favors enhancement in anodic photocurrent and the previous reports based on other monovalent ion based PARB is given in Table 2.
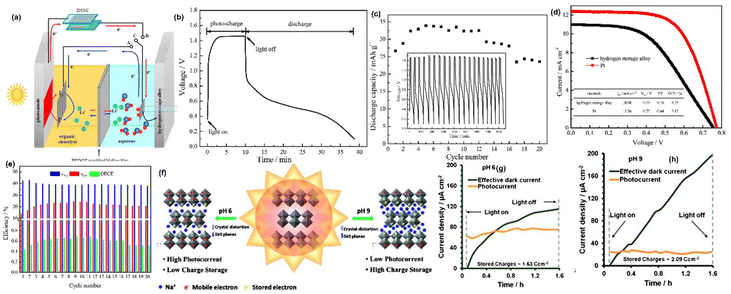 |
| | Fig. 14 (a) Schematic configuration of AB5-type hydrogen storage alloy, (b) voltage profiles, (c) discharge capacity vs. cycle number, (d) I–V curves of the DSSC with hydrogen storage alloy, (e) efficiency profile AB5-type hydrogen storage alloy.63 Copyright: 2017 Elsevier. (f) Schematic representation of crystal structure distortion of layered α-MoO3 structure, (g–h) effective dark current and photocurrent density profiles for α-MoO3 thin films synthesised using different anodization electrolytes with different pH values.64 Copyright: 2014 Wiley. | |
Table 2 Summary of previous reports based on other monovalent ion PARB
| Ion type |
Device configuration |
Device type |
Photoactive material |
Band gap (eV) |
Storage material |
Electrolyte |
Light source |
Discharge capacity |
Open circuit voltage (V) |
Photoconversion efficiency (%) |
Ref. |
| Na |
Photoelectrode: WO3–(TiO2)–CdS |
Two electrode |
CdS |
2.25 |
WO3 |
Na2SO3 + Na2S |
50 mW cm−2 |
18.1 mA h g−1 @ 10 μA |
0.25 |
0.3 |
59
|
| Counter electrode: Pt |
| Photoelectrode: TiO2 |
Three electrode |
TiO2 |
3.2 |
Na2S4 |
Anolyte: Na2S4 |
XEF-501S Xe-lamp |
110 mA h g−1 @ 0.05 mA g−1 |
0.08 |
190 |
58
|
| Cathode: Super P carbon in Ti mesh |
Catholyte: NaI |
| Photoelectrode: MoO3 |
Two electrode |
MoO3 |
3.1 |
MoO3 |
Na2SO4 |
30 mW cm−2 |
190 mA h g−1 @ 10 μA |
0.64 |
— |
57
|
| Counter electrode: Pt |
| Photoelectrode: TiO2/dye |
Three electrode |
Z907 dye |
— |
Fe2(MoO4)3 |
I2 + LiI, DMPII + TBP in acetonitrile |
100 mW cm−2 |
— |
0.63 |
— |
55
|
| Anode: Fe2(MoO4)3 microspheres |
| Photoelectrode: SnS2 |
Two electrode |
SnS2 |
2.33 |
Super P |
NaI |
50 mW cm−2 |
140 mA h g−1 |
1 |
0.11 |
56
|
| Anode: Super P |
| K |
Photoelectrode: TiN |
Two electrode |
TiN |
2.2 |
KFe[Fe(CN)6] (Fe3+/Fe2+) |
KCl + Na2S2O8 |
35 mW cm−2 |
77.8 mA h g−1 |
0.74 |
72 |
6
|
| Counter electrode: KFe[Fe(CN)6] (Fe3+/Fe2+) |
| H |
Photoanode: dye-sensitized TiO2 |
Three electrode |
N719 dye |
— |
MmNi3.6Co0.75Mn0.35Al0.3 alloy |
Catholyte: TBP in PC |
100 mW cm−2 |
23.6 mA h g−1 @ 50 mA g−1 |
1.46 |
<1% |
63
|
| Counter electrode: LiI |
Anolyte: KOH + LiOH |
5.2. Multivalent-based photoassisted rechargeable battery
Monovalent batteries such as Li, Na, and K ion batteries suffer severely from lower energy density, lower capacity, and shorter cycle life. However, multivalent ion-based batteries, such as Mg2+, Zn2+, and Al3+, are under development which achieve higher specific capacity and higher energy density than monovalent ions because multiple electrons are involved during redox reactions in comparison. This is also applicable for PARB, for which zinc-ion PARB (ZIBs) have recently been developed, which have the advantage of relatively good stability of Zn metal during cycling compared with Li metal.65 The Zn-ion PARB was reported by Boruah and coworkers in 2020,66 and they went on to report Zn-ion PARBs with various photoelectrodes such as VO2, V2O5, and MoS2.66–68 For example, in a MoS2 photocathode-based device,67 MoS2 nanosheets (Fig. 15(b and c)) were used as a dual-active material (i.e. for both photocharge separation and energy storage), and ZnO was used as a hole-blocking layer, which were both grown on the carbon felt (CF) current collector with zinc as an anode. Here it is notable that the electrode was binder-free, thus reducing ineffective material for charge separation and transportation of photocharges, therefore promoting the PCE of the device. At a specific current of 100 mA g−1, the capacity of this device increased from 245 to 340 mA h g−1 (38.77% enhancement) under illumination, as shown in Fig. 15(d). The rate test results with various specific currents under light and dark conditions are shown in Fig. 15(e), and this result suggests that light can be used not only to recharge Zn-ion battery but also to increase rate performance. The capacity retention attained was 82% for 200 cycles with coulombic efficiency of 100%. Fig. 15(f) shows the photocharge and discharge curves in the dark at various specific currents, and Fig. 15(g) illustrates chronoamperometry curves at 0 V under chopped illumination; from these results, it is clear that there was an increase in the response current under illumination. Overall, the authors proposed that, during photoassisted charging, the photogenerated electrons were transported from the photocathode to the Zn anode through the external circuit, and the photogenerated holes helped to drive the deintercalation of Zn2+ from the photocathode with the increased oxidation state of Mo. These are in balance with the Zn2+ that is reduced to Zn metal by the photogenerated electrons transported to the anode (Fig. 15(c)), and the photoassisted charging reactions are as follows, as illustrated in Fig. 15(a):
| At anode: Zn–MoS2 + 2h+ → Zn2+ + MoS2 |
| At cathode: Zn2+ + 2e− → Zn |
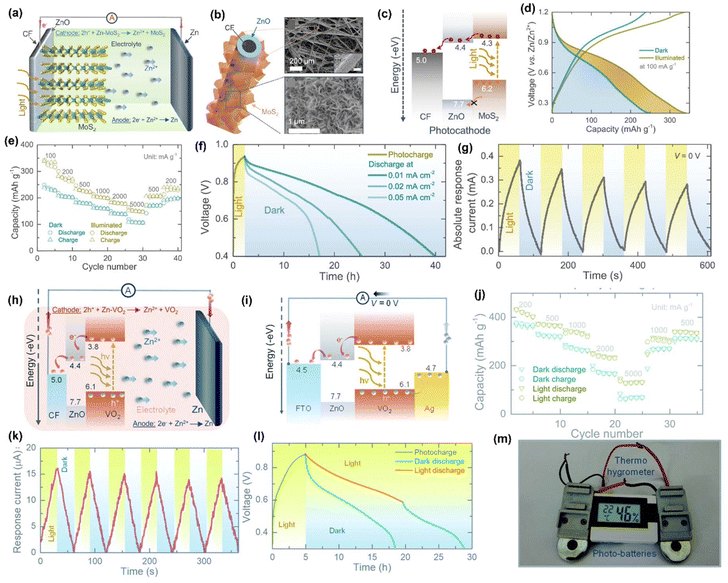 |
| | Fig. 15 (a) Schematic illustration of the proposed photoassisted charging mechanism of Zn-ion PARB, (b) MoS2 nanosheets grown on a ZnO-coated carbon fiber with their SEM images, (c) energy band diagram of the MoS2/ZnO photocathode, (d) rate capacity tests under chopped condition, (e) GCD curves in dark and illuminated condition, (f) photocharge and discharges at different specific currents, (g) chronoamperometry under chopped illumination condition at 0 V of Zn-ion PARB.67 Copyright: 2021 American Chemical Society. (h) Photoassisted charging mechanism, (i) energy band diagram of a stacked FTO/ZnO/VO2/Ag, (j) rate capacity measurements in dark and illuminated (λ = ∼455 nm) condition, (k) chronoamperometry test under chopped illumination condition at 0 V, (l) photocharge and galvanostatic discharge in dark and illuminated condition, (m) digital photograph showing at 1.5 V Thermo-hygrometer powered by two photocharged photobatteries.68 Copyright: 2021 Royal Society of Chemistry. | |
Also, the observed PCE was about 1.8% with a light source of 455 nm wavelength and 0.2% with 1 sun illumination.
Further, the authors suggested VO2 as a dual-functional photocathode. Initially, they demonstrated the photoactivity of the material by forming a photodetector, and later formed a PARB using CR2450 with an 8 mm diameter window for light illumination. The photoassisted charging mechanism of the proposed ZnO/VO2 photocathode-based ZIB is depicted in Fig. 15(h), which explains that under illumination, the electrons are excited to the CB of VO2 and then transferred to CF through a ZnO layer, which is also utilized to block holes as mentioned earlier. This combined action of electron extraction and blocking holes in VO2 leads to photoassisted charging. Here, the ZnO layer was utilized for charge transport, while VO2 was utilized for energy storage (Fig. 15(i)). Also, rate test results are given in Fig. 15(j), which confirmed the increase in capacity under illumination even at 5000 mA g−1, and the capacity enhancement was observed from 367 mA h g−1 to 432 mA h g−1 at 200 mA g−1 with capacity retention of 73% observed after 500 cycles and the enhancement of PCE from 0.18% to 0.51%. Fig. 15(k) shows the chronoamperometry curves at 0 V, showing the increasing current response under light illumination, which provides evidence of the facile transport of photogenerated charges over the cell with Zn ions. Furthermore, it is seen that when a cell was discharged under illumination, the discharge of the PARB was slower than in dark conditions, which is seen in Fig. 15(l), because it was photocharged during the discharge process. Additionally, the authors powered a commercial sensor (1.5 V Digital Thermo-Hygrometer TFA, MPN: 30.5005) by PARB as shown in Fig. 15(m). They modified VO2 with reduced graphene oxide, which acts as a hole-blocking layer. The VOC observed was 890 mV in darkness, and the illuminated capacity was 282 mA h g−1 and 315 mA h g−1 at 200 mA g−1 with a capacity retention of ≈90% at 1000 cycles, thus indicating good device stability.10
Moreover, in other work the authors used V2O5 nanofibers66 (Fig. 16(b)) as a dual-active material with P3HT and rGO for effective charge separation, and the energy band diagram is given in Fig. 16(a). Fig. 16(c) displays the long-term cycling measurement at 500 mA g−1, where the increment in the capacity at the initial few cycles might be attributed to the activation of the photocathode, and the following capacity diminishing after 30 cycles might be because of direct drop-casting of the photocathode on the CF without conductive additives. Furthermore, the lower coulombic efficiencies at the initial few cycles could be due to serious dendrite growth and self-corrosion of the Zn anode in an aqueous electrolyte. Fig. 16(d) shows the photoassisted charging and discharging at 100 mA m−2, and it is seen that the voltage for photoassisted charging gradually dropped from 0.95 to 0.715 V when discharged under illumination, which was owing to the instantaneous actions of photoassisted charging and discharging; in the dark condition the voltage reduced to 0.2 V. Then, Fig. 16(e) shows photographs of commercial sensors powered only by light with a fabricated Zn-ion PARB and a larger scale ∼100 cm2 pouch cell. Fig. 16(f) shows the photocharge and discharge of the pouch cell with a ∼64 cm2 optical window. Finally, the PCE was observed to be 1.2% along with gravimetric capacities of 190 mA h g−1 and 370 mA h g−1 for dark and illumination conditions, respectively.
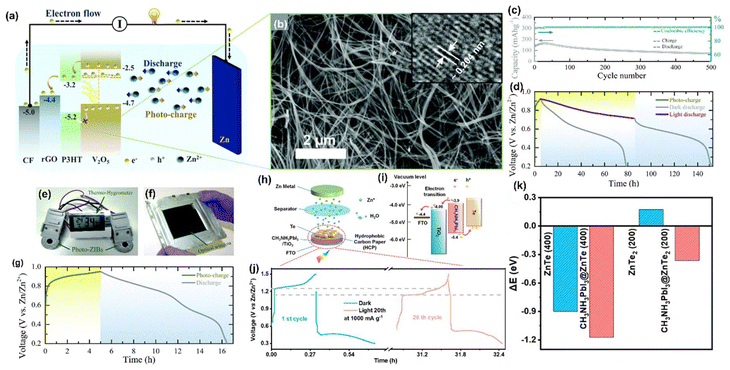 |
| | Fig. 16 (a) Schematic illustration of the photoassisted charging mechanism, (b) SEM image of V2O5 nanofibers (inset: HRTEM image), (c) long-term photocycling in the dark at 500 mA g−1, (d) photoassisted charge and galvanostatic discharge in dark and illuminated Zn-ion PARB charged by light, and (e–f) photograph of a Zn-ion PARB pouch cell, (g) photoassisted charge and discharge of the pouch cell.66 Copyright: 2020 Royal Society of Chemistry. (h) Schematic representation of the integrated aqueous Zn-Te PARB, (i) corresponding energy band diagram, (i) GCDs at 100 mA g−1, (j) photoassisted charge/discharge curves at 1000 mA g−1 with enlarged profiles of 1st cycle and 20th cycle. (k) Comparison of overflowing energies of one Zn atom before and after adding the CH3NH3PbI3 perovskite.12 Copyright: 2023 American Chemical Society. | |
Liu et al. reported12 an aqueous Zn-Te PARB with a Janus-jointed structure that protects the photocathode in the electrolyte and promotes transportation from photogeneration to the storage unit, with an overall efficiency of 12%. As demonstrated in Fig. 16(g), the photocathode consisted of a CH3NH3PbI3 perovskite as a photoabsorber unit, and a Janus-joined electrode consisted of hydrophobic carbon paper flanked by perovskite and a Te storage cathode, with the Te particles as the storage cathode. Fig. 16(g) shows that CH3NH3PbI3 created photogenerated electron–hole pairs under light illumination. The good matching band energy level alignment of CH3NH3PbI3 perovskite and TiO2 (−3.9 vs. −4.06 eV) facilitated the injection of photogenerated electrons from the perovskite to TiO2/FTO (Fig. 16(h)), and then transported to the Zn anode to reduce Zn2+ through an external circuit. In contrast, photogenerated holes in the perovskite oxidized the ZnTe into ZnTe2 and then converted it into Te, which completed the entire photoassisted charging process. Under illumination, an enhancement of capacity to 362 mA h g−1 at 100 mA g−1 (Fig. 16(i)) and a decrease in charging voltage by 0.1 V (Fig. 16(j)) were observed. The photogenerated charges by CH3NH3PbI3 perovskite were sufficient to charge the battery. Hence, it did not require an external power supply and had structural stability with a PCE of 0.31%. Fig. 16(k) shows the enlarged photocharge/discharge curves in the dark condition (1st cycle) or light illumination condition (20th cycle) at 1000 mA g−1, unambiguously demonstrating the higher stability of aqueous Zn-Te PARB. In this work, density functional theory (DFT) calculations were also used to better understand the role played by the CH3NH3PbI3 perovskite during Zn2+ insertion and extraction from the Te host. Initially, the authors calculated interface adhesion formation energy of CH3NH3PbI3@ZnTe (400) and CH3NH3PbI3@ZnTe2 (200) systems, shown in (Fig. 16(l and m)), and the accordingly obtained values were −0.36 and −1.04 eV; these negative values indicated that both CH3NH3PbI3@ZnTe (400) and CH3NH3PbI3@ZnTe2 (200) composites could form a stable structure at the interface, which facilitated the transport of the photogenerated charges from CH3NH3PbI3 through the interface of ZnTe (400) or ZnTe2 (200). Furthermore, the authors calculated the overflow energies of Zn2+ from the surfaces of ZnTe (400) and ZnTe2 (200) before and after the introduction of CH3NH3PbI3 (Fig. 16(n–q)). As seen in Fig. 16(r), again, the more negative ΔE value facilitated the Zn atom overflows from the surface, indicating the favorable Zn2+ insertion/extraction during the photocharge and discharge process, and the decreased ΔE values of 0.273 and 0.535 eV could be calculated for ZnTe (400) and ZnTe2 (200) after the addition of CH3NH3PbI3, suggesting that the CH3NH3PbI3 perovskite could efficiently accelerate the redox kinetics.
Aluminum-ion batteries (AIBs) have also been proposed due to their higher volumetric capacity (∼8040 mA h cm−3) and good gravimetric capacity (∼2980 mA h g−1). Its fast charging and discharging feature, higher energy storage efficiency (ESE), long cycling stability, abundant aluminium (Al) resources, and lower cost and safety together make the AIB a promising energy storage candidate,65,69 and it could be useful to utilize the advantages of Al3+ in PARB. For instance, Zhang et al.70 have proposed a photoregulation strategy to promote rate capability and energy density during galvanostatic charging and discharging of electrochemical batteries using α-MnO2 nanorod as an active photosensitizer, rGO as an electron transport material, and porous carbon fiber as a current collector. Fig. 17(a) shows an aqueous Al–Mn battery's schematic diagram and energy level configuration. Fig. 17(b) illustrates that the intercalated Al3+ would introduce a hybrid level, which could effectively decrease the transition barrier of photogenerated electrons from the VB to the CB. During illumination, the photogenerated electrons flow to the negative electrode, and the holes are neutralized by the electrons generated in the process of Al3+ deintercalation (discharge). The electrochemical performance of Al–MnO2 was analysed in dark and illuminated conditions at 100 mA g−1, and is given in Fig. 17(c). It achieved a discharge capacity of 532 mA h g−1 with an increment of 41.3% (376.4 mA h g−1 in the dark). Fig. 17(d) shows that in the dark condition, the obtained discharge capacities were 376.4 and 286.0 mA h g−1 at 100 and 300 mA g−1, respectively. Moreover, after 200 cycles, the discharge capacities were maintained at 205.4 mA h g−1. Fig. 17(e) displays the photoassisted charging and discharging (dark and illumination) curves at 100 mA g−1; the longer discharge time indicates the intercalation of more Al3+. Meanwhile, charging under light and dark conditions followed by dark galvanostatic discharge cycles at different current densities was also performed, shown in Fig. 17(f), evidencing that, in dark discharge, the photocharged cell displayed a longer discharging time that fully established the advantages of the PEC process. Moreover the multivalent ion PARB based previous reports are given in Table 3.
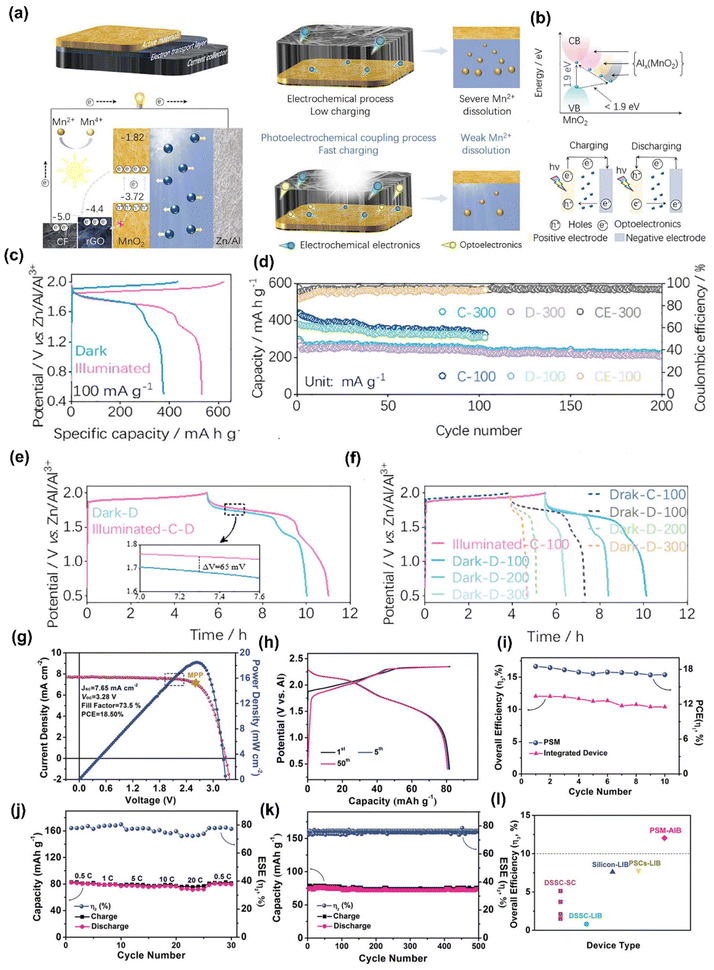 |
| | Fig. 17 Schematic diagram of (a) PEC aqueous Al–Mn oxide batteries, (b) migration of light-excited electrons in α-MnO2, where AlxMnO2 represents the impurity levels and electron migration in the during charge and discharge, (c) GCD curves under with/without illumination at 100 mA g−1, (d) cycling performance at 100 and 300 mA g−1 without illumination. (e) Fully charged under light and then discharged in the dark (inset exhibiting a potential difference of 65 mV), (f) fully charged under light and then discharged at the same current density under dark and light.70 Copyright: 2022 Elsevier. (g) J–V curve of PSM, (h) charge and discharge curves at 41 mA g−1 (0.5C), (i) PCE of the PSM and overall efficiency during the cycling measurement, (j) charge–discharge capacities and corresponding ESE under a range of current densities from 0.5C to 20C, (k) long-term cycling of charge–discharge capacities and ESE at of 820 mA g−1 (10C), (l) comparison of overall efficiencies of reported representative portable devices.69 Copyright: 2019 Wiley. | |
Table 3 Summary of previous reports based on multivalent ion-based PARB
| Ion type |
Device configuration |
Device type |
Photoactive material |
Band gap (eV) |
Storage material |
Electrolyte |
Light source |
Discharge capacity |
Open circuit voltage (V) |
Photoconversion efficiency (%) |
Ref. |
| Zn2+ |
Photocathode: VO2 |
Two electrode |
VO2 |
∼2.53 |
VO2 |
Zn(CF3SO3)2 |
∼12 mW cm−2 |
367–462 mA h g−1 @ 200 mA g−1 |
0.88 |
0.51% |
68
|
| Anode: Zn |
| Photocathode: VO2 |
Two electrode |
VO2 |
∼2.53 |
VO2 |
Zn(CF3SO3)2 |
∼12 mW cm−2 |
315 mA h g−1 @ 200 mA g−1 |
0.89 |
0.18% |
10
|
| Anode: Zn |
| Photocathode: V2O5 |
Two electrode |
V2O5 |
2.2 |
V2O5 |
Zn(CF3SO3)2 |
∼12 mW cm−2 |
370 mA h g−1 @ 50 mA g−1 |
0.95 |
1.2% |
66
|
| Anode: Zn |
| MoS2 |
Two electrode |
MoS2 |
1.9 |
MoS2 |
Zn(CF3SO3)2 |
∼12 mW cm−2 |
340 mA h g−1 @ 100 mA g−1 |
0.99 |
1.8% |
67
|
| Anode: Zn |
| Photocathode: Te/CH3NH3PbI3/TiO2 |
Two electrode |
CH3NH3PbI3 |
2.5 |
Te particles |
ZnSO4 |
250 W xenon lamp |
556 mA h g−1 @ 1 A g−1 |
∼0.4 |
0.31% |
12
|
| Anode: Zn |
| Al3+ |
Anode: MAPbI3/Al |
Two electrode |
MAPbI3 |
— |
Graphite |
LiPF6 in EC/DMC/DEC |
100 mW cm−2 |
82 mA h g−1 @ 41 mA g−1 |
3.28 |
12.04% |
69
|
| Cathode: graphite |
| Photocathode: FTO/rGO/MnO2/Ag |
Two electrode |
MnO2 |
1.9 |
MnO2 |
Al(CF3SO3)3 |
300 W xenon lamp |
531 mA h g−1 @ 0.1 A g |
0.05 |
1.2% |
70
|
| Anode: Zn/Al |
Hu et al.69 reported a PARB obtained by combining a perovskite solar module with an Al-ion battery. Their miniaturized perovskite solar module (PSM) delivered a large photovoltage of 3.28 V and a high PCE of 18.5%, obtained from the J–V curve shown in Fig. 17(g). The GCD curves are shown in Fig. 17(h), and a reversible capacity of 82 mA h g−1 could be achieved at 41 mA g−1. The overall photoelectric conversion and storage efficiency (PCSE) (Fig. 17(i)) achieved was as high as 12.04%, outperforming previously reported devices (Fig. 17(l)). Also, the AIB showed a higher rate capacity (Fig. 17(l)) with negligible capacity loss of 76 mA h g−1 at 1640 mA g−1 (20C rate). Fig. 17(k) shows the long-term cycling stability of the AIB at a high current density of 820 mA g−1 (10C) and stabilized energy storage efficiency (ESE) of ∼77% even after 500 cycles. On the other hand, as of our knowledge, compared with Zn2+ and Al3+, the development of Mg-ion batteries (MIBs) is restricted owing to the sluggish Mg2+ diffusion in host lattices Finally the advantages and disadvantages of various metal ion based PARB is given in Table 4.65
Table 4 Summary of the advantages and limitations of different metal-ion-based PARBs
| Ion type |
Metal-ion |
Electrode |
Advantage |
Disadvantage |
Ref. |
| Monovalent |
Li |
V2O5 nanowires |
High specific capacity, high energy density, high photocharge voltage, lightweight, advancements in LiB technology |
Scarce, inflammable, expensive, assembly under inert atmosphere, single-electron reaction, large overpotentials |
30
|
| LiV2O5 |
38
|
| MoS2 |
44
|
| TiO2 |
42
|
| MAPbI3 |
48
|
| H |
N719 dye |
Cost effective, abundant, light weight, better diffusion due to small size of ion |
Reactive, short cycle life, side reactions, single-electron reaction, H2 generation |
63
|
| Na |
Z907 dye |
Cost effective, abundant, light weight |
Reactive, assembly under inert atmosphere |
55
|
| SnS2 |
56
|
| MoO3 |
57
|
| CdS |
71
|
| K |
TiN |
Cost effective, light weight |
Reactive, assembly under inert atmosphere, large ion size |
6
|
| Multivalent |
Zn |
V2O5 |
Cost effective, aqueous electrolyte, multi-electron reaction |
Cycle life, large ion size |
66
|
| VO2 |
68
|
| CH3NH3PbI3 |
67
|
| MoS2 |
12
|
| Al |
MnO2 |
Cost effective, aqueous electrolyte, multi-electron reaction |
Cycle life, side reactions, large ion size |
70
|
| MAPbI3 |
69
|
6. Modification strategies for enhancing the performance of the photoassisted rechargeable battery
At present, the efficiency and cycle life of PARB are insufficient due to various factors such as limited light absorption of the photoelectrodes, higher charge carrier recombination, poor photoactivity of the semiconductor electrode, and higher interfacial resistance between the photoactive semiconductor and the current collector. Hence, developing various modification techniques to enhance the performance of photoassisted devices is crucial. Various strategies, such as defect engineering, morphological engineering, heterojunction engineering, electrolyte engineering, and surface coating can be incorporated. For example, morphological engineering enhances light absorption, charge transport, increased ion diffusion, and mechanical and chemical stability. Defect engineering can improve charge separation, reduce recombination, increase active sites and enhance overpotential for redox reactions. Heterojunction engineering enhances performance by enabling efficient charge separation, broadening light absorption, reducing recombination, and improving stability. Electrolyte engineering is pivotal in optimizing performance by tailoring the electrolyte composition, concentration,
and additives, which can enhance ion transport, stability, compatibility with photoelectrodes, efficiency, and durability. Surface coating is a highly effective strategy for improving the performance and longevity of PARBs, and it provides improved stability, charge separation, and redox kinetics. Overall, these modifications make the electrodes more efficient, durable, and reliable for developing high-performance PARBs for sustainable energy solutions. A detailed investigation of modification strategies is given below (Fig. 18).
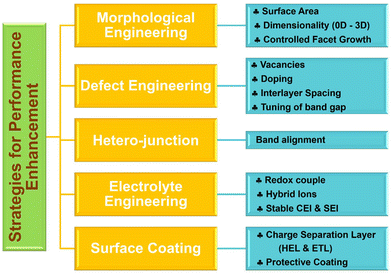 |
| | Fig. 18 Schematic representation of modification strategies for enhancing the performance of PARBs. | |
6.1. Morphological engineering for facile charge transport
6.1.1. Dimensionality control for increasing the surface area and ion diffusion.
The morphological engineering of photoactive materials plays a critical role in improving the performance of PARBs, such as (i) reducing the dimensions of semiconductor nanomaterials to shorten the diffusion time of intercalated ions, which speeds up the kinetics, thus increasing the charge and discharge rates; (ii) the lower-sized nanomaterials increase the surface area, improving the interfacial Faradaic reactions in the batteries across the electrode–electrolyte interface (EEI), leading to enhanced capacity; (iii) the controlled crystallinity offers stable tunnels for electron transfer and increases the stability of the battery. Moreover, the dimensionality of the nanomaterials is very important, as shown in Fig. 19(a). Zero-dimensional (0-D) has no extent in any direction (e.g., nanoparticles, fullerene, nanocluster, etc.); one-dimensional (1-D) nanomaterials show only linear dimension such as length, width, or height (e.g., nanorods, nanotubes, and nanowires, nanocones, nanofibres, etc.); two-dimensional (2-D) nanomaterials have width and length but not depth, e.g., graphene, g-C3N4, nanofilms, nanolayers, and nanosheets. Then, three-dimensional (3-D) nanomaterials seem to have the dimension of depth as well as width and height; examples include micro and nanostructures that display nanofeatures such as nanowalls or nanoshells, diamonds, perovskites, etc.72,73
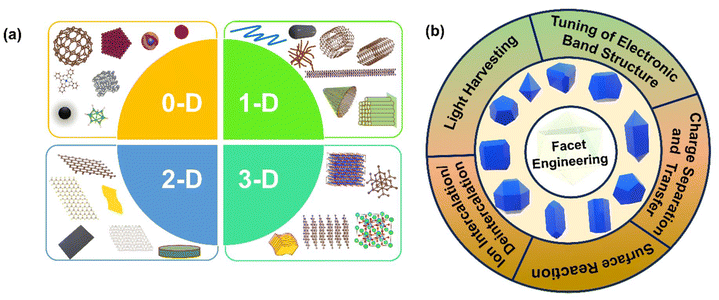 |
| | Fig. 19 Schematic representation of (a) different types of morphologies (b) facet engineering. | |
In batteries, 0-D nanoparticles deliver many advantages compared with bulk materials, including faster ion and electron transport, high surface contact with the electrolyte, and buffering of cycling-induced volume change. For instance, fullerene (C60) is taken as an example, which is a 0-D nano allotrope of carbon that can be used as an electron acceptor. Also, it has the effectiveness of endorsing electronic conductivity, charge separation, and transfer.74,75 For instance, Zhang et al. reported75 a redox-active C60@porous organic cage (POC), which served as a dual-functional cathode for a highly efficient Li–organic PARB. The designed C60@POC material holds enhanced charge separation and slower charge recombination efficiency (τCS/CR = 20.83/171.17 ps) than POC (τCS/CR = 178.49/3.95 ps) (Fig. 20(a)) to facilitate solar conversion. It comprises reversible redox-active sites for efficient energy storage. The assembled Li–organic PARB with a C60@POC cathode was realized with an 81.4% increase in output power and a 13.2% decrease in input power. To understand their redox behavior, the HOMO and LUMO levels were investigated experimentally and theoretically, and the HOMO/LUMO values for POC and C60@POC were ca. 5.53/3.47 eV and 5.43/3.56 eV, respectively (Fig. 20(b)). In addition, the HOMO and LUMO levels were also investigated by CV techniques, and the obtained HOMO/LUMO values were ca. 5.33/3.32 eV for POC and 5.23/3.60 eV for C60@POC (Fig. 20(c)). These results confirmed that the encapsulation of C60 into POC leads to a narrow band gap, owing to the strong electron-withdrawing ability of C60. Moreover, the HOMO and LUMO densities were calculated by DFT analysis; as seen in Fig. 20(d), the HOMO and LUMO densities were primarily placed around the C![[double bond, length as m-dash]](https://www.rsc.org/images/entities/char_e001.gif) O groups in POC with an energy gap of 2.17 eV, which matched well with the experimental result. For C60@POC, the HOMO density was transported to the tip units at POC, while the LUMO density was positioned on one of the entrapped C60, signifying a decrease in the band gap. The results also proposed radical ion pair C60@POC+ formation upon photoexcitation to facilitate the charge carrier's separation. Then, the separated photogenerated electrons and holes participated in Li+ storage, which enhanced the performance of the PARBs. The discharge/charge performances under illumination are shown in Fig. 20(e). Here it is noted that the discharge of C60@POC was increased by 0.47 V and the charge was decreased by 0.41 V, which corresponds to an extra 24.2% of round-trip efficiency, much higher than that of POC (5.6%). As shown in Fig. 20(f), the discharge voltage of C60@POC was maintained at 1.81 V at 3 mA cm−2, with the corresponding output powers of C60@POC in dark/light conditions at 3 mA cm−2 being ca. 3.06 and 5.55 mW cm−2 (Fig. 20(g)), indicating an 81.4% increase in output power under illumination. Concerning the charging process, the charging voltages at each current density of the photoassisted C60@POC electrode were at 3 mA cm−2 as seen in Fig. 20(h), with a 13.2% saving of the input power, as seen in Fig. 20(i). Fig. 20(j–k) shows that the dual-functional C60@POC enabled an extended lifetime of the photogenerated charge carriers, resulting in enhanced power density, round-trip efficiency, and solar energy storage efficiency.
O groups in POC with an energy gap of 2.17 eV, which matched well with the experimental result. For C60@POC, the HOMO density was transported to the tip units at POC, while the LUMO density was positioned on one of the entrapped C60, signifying a decrease in the band gap. The results also proposed radical ion pair C60@POC+ formation upon photoexcitation to facilitate the charge carrier's separation. Then, the separated photogenerated electrons and holes participated in Li+ storage, which enhanced the performance of the PARBs. The discharge/charge performances under illumination are shown in Fig. 20(e). Here it is noted that the discharge of C60@POC was increased by 0.47 V and the charge was decreased by 0.41 V, which corresponds to an extra 24.2% of round-trip efficiency, much higher than that of POC (5.6%). As shown in Fig. 20(f), the discharge voltage of C60@POC was maintained at 1.81 V at 3 mA cm−2, with the corresponding output powers of C60@POC in dark/light conditions at 3 mA cm−2 being ca. 3.06 and 5.55 mW cm−2 (Fig. 20(g)), indicating an 81.4% increase in output power under illumination. Concerning the charging process, the charging voltages at each current density of the photoassisted C60@POC electrode were at 3 mA cm−2 as seen in Fig. 20(h), with a 13.2% saving of the input power, as seen in Fig. 20(i). Fig. 20(j–k) shows that the dual-functional C60@POC enabled an extended lifetime of the photogenerated charge carriers, resulting in enhanced power density, round-trip efficiency, and solar energy storage efficiency.
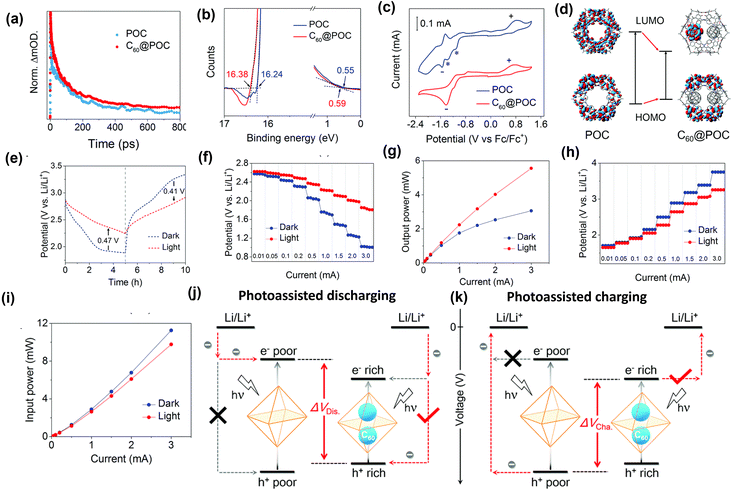 |
| | Fig. 20 (a) Kinetics of the fs-TA absorption bands at 573 nm. (b) UPS spectra (c) CV with 0.10 M tetrabutylammonium hexafluorophosphate (d) energy diagrams of POC and C60@POC obtained from DFT calculations (e) charge and discharge curves of C60@POC with or without illumination (f–g) I–V and I–P curves of C60@POC during discharge (h–i) I–V and I–P curves of C60@POC during charge (j-k) schematic of the photoassisted Li-organic battery with POC and C60@POC cathodes.75 Copyright: 2021 Royal Society of Chemistry. | |
However, 0-D nanoparticles have some drawbacks, including side reactions with electrolytes, interparticle contact resistance, and the ability to aggregate. These drawbacks of 0-D are mitigated by 1-D morphology, which permits faster charge transfer in the longitudinal direction, resulting in faster reaction kinetics. Furthermore, they have higher structural stability owing to the favorable stress distribution in the higher aspect ratio, and they are also easy to grow on the surface of current collectors. 1-D is better than 0-D, which has poor conductivity due to numerous nanoparticle interfaces. Fast charge transport improves mass diffusion and provides high conductivity for active materials. In the previous section, various reports were given for 1-D nanostructures. For example, Wang et al.38 reported the γ phase of LiV2O5 with bundled structure Fig. 7(a) which provided a relatively higher surface area for good light absorption for a LiV2O5 photocathode providing an enhancement of 270% of specific capacity with reference to that in the dark. On the other hand, Kumar et al.44 proposed the MoS2/MoOx nanorod heterostructure for a two-electrode Li-ion PARB. Here, the MoS2/MoOx NR structure offered higher light interaction and high intercalation area for Li+ for enhanced performance (Fig. 8(h)). Furthermore, Zhang et al.70 reported the Al-ion battery with α-MnO2 nanorod; here, the photogenerated electrons could transfer along the nanorods, which is advantageous to reduce the recombination rate of photogenerated electron–hole pairs to enhance the photochemical oxidation behaviors. By doing so, α-MnO2 nanorods promoted the discharge capacity 531 mA h g−1 at a specific current of 0.1 A g−1 along with a higher increment of 41.3%, as seen in Fig. 17(d).
2-D layered nanomaterials have an exceptional structure with lateral dimensions that facilitate in-plane electron and ion transfer and allow for better contact with the electrolyte owing to the more significant aspect ratio. Moreover, the extended lateral dimensions afford continuous ion transfer pathways and can endure stress–strain cycles during battery operation, thus improving stability. On the other hand, using 2-D nanomaterials would facilitate faster anisotropic ion diffusion. Meanwhile, larger 2-D nanosheets have higher density and fewer side reactions with the electrolyte than the 0-D and 1-D, leading to higher stability and volumetric energy density. For example, Boruah et al.67 reported Zn-ion PARBs using a photoactive cathode composed of layer-by-layer-grown ZnO and MoS2 nanosheets, as seen in Fig. 15(b). Moreover, MoS2 nanosheets increased the photosensitivity and facilitated the separation of photogenerated electron and hole pairs, thereby enhancing the battery capacity to 340 mA h g−1 at 100 mA g−1. Likewise, 3-D nanostructures have provided fewer electrolyte side reactions and higher volumetric energy density, enhancing their stability through physical confinement. For example, Bayaguud et al.41 reported 3D porous γ-LiV2O5 prepared by the electrostatic spray deposition (ESD) method, which showed a homogeneous irregular pattern that looks like the folds and connections on the surface of the brain, thus having a high surface area, as seen in Fig. 21(a–c). This 3-D microstructure can facilitate the contact between the electroactive material and electrolyte. Also, the presence of uniform pores helps the electrolyte penetrate the inner layers. It demonstrated a better rate capability with a specific capacity of 198 mA h g−1 at a high current density of 35C. It maintained the 234 mA h g−1 for 100 cycles with a discharge capacity of 0.093% decay/cycle (Fig. 21(d–f)).
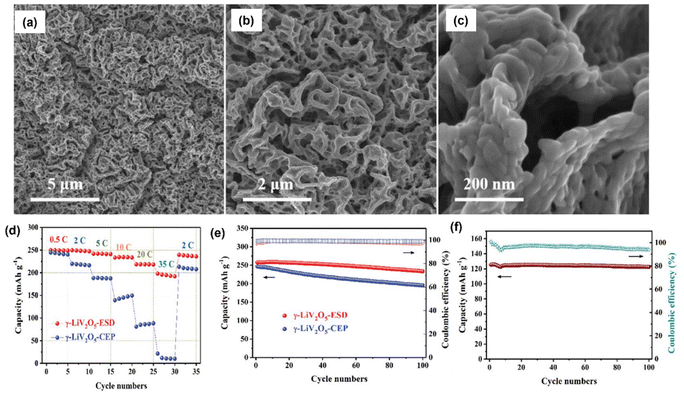 |
| | Fig. 21 (a–c) SEM of the γ-LiV2O5 film, (d) rate performance comparison at different C-rates, (e) cycle performance and coulombic efficiency comparison of γ-LiV2O5-ESD and γ-LiV2O5-CEP at 0.5C for 100 cycles, (f) cycle performance and coulombic efficiency of γ-LiV2O5-ESD.41 Copyright: 2019 Wiley. | |
Wang et al.76 compared the morphology of 0-D, 1-D, and 3-D metal oxide nanomaterials for the Li-ion battery application. Here, they correlated the Li-ion battery performance of 0-D, 1-D, and 3-D motifs of various metal oxide nanomaterials, such as Li4Ti5O12, TiO2, and LiV3O8. From their reported perspective, authors stated that complex 3D hierarchical assemblies were generally found to outperform, notably their 0-D, conventional counterparts of identical composition. For example, as compared with the 0-D nanoparticle (Fig. 22(a)), 3D “sea urchin” TiO2 (Fig. 22(d)) yielded a reasonable capacity of 214 mA h g−1 at 0.1C with 90% retention after 100 cycles, as seen in Fig. 22(e and f). Also, the 1-D LiV3O8 submicron-sized fibre (Fig. 22(b)), which was synthesised by the sol–gel method, displayed a first and second cycle discharge capacity of 207 and 227 mA h g−1 (Fig. 22(g)), respectively, and retained 60% of its initial capacity, as seen in Fig. 22(h). Moreover, the 3-D flower-like Li4Ti5O12 (Fig. 22(c)) maintained a higher capacity of 141 mA h g−1 under a 10C rate at 55 cycles, as shown in Fig. 22(i and j). Even though all the above-mentioned nanostructures have advantages such as high surface area and fast ion diffusion kinetics, combining two or more morphologies gain synergistic effect that increases battery performance.73 For example, Jia et al.46 reported the synergy of 2-D siloxene nanosheets (SNSs) and 0-D siloxene quantum dot (SQD) for the Li–O2 battery. They achieved a round-trip efficiency of 230% with a discharge potential of up to 3.72 V and the lowest charge potential of 1.60 V with a higher discharge capacity of 2212 mA h g−1 at 1 mA cm−2 (Fig. 10(a–c)). Also, Boruah et al.67 reported Zn-PARBs using a photocathode composed of layer-by-layer-grown ZnO and dense 2-D MoS2 nanosheets, as shown in the schematic of Fig. 15(b), which is of the planar metal–semiconductor–metal (MSM) type. Here, ZnO acted as a hole-blocking layer and acted both as the photoactive material and the material storing the Zn ions. Employing this, they achieved a capacity of 245 mA h g−1, with a capacity retention of 82% over 200 cycles.
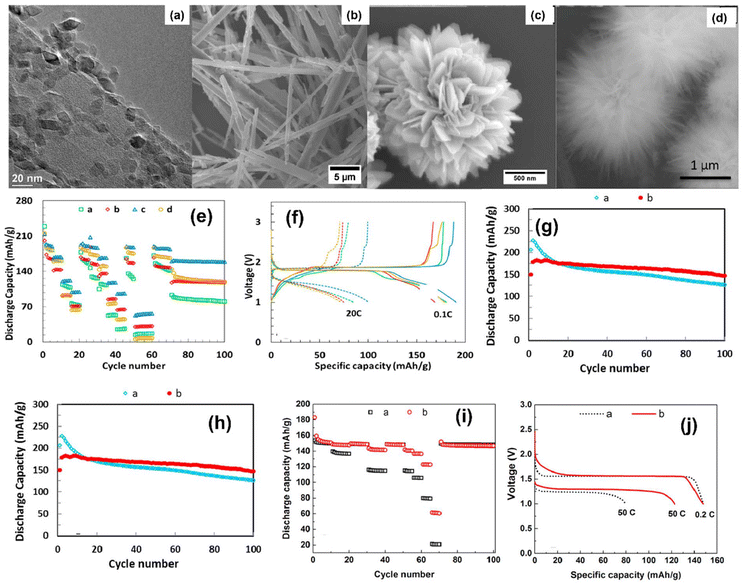 |
| | Fig. 22 SEM images of (a) 0-D TiO2 nanoparticles, (b) 1-D submicron LiV3O8 fiber motif, (c) 3D “flower-like” Li4Ti5O12 hierarchical composites, and (d) 3D sea urchin-like TiO2-based aggregates. (e) Discharge capacity curves of Li/TiO2 electrochemical cells containing TiO2 materials ((a) 0-D, (b) 1-D, (c) 3-D and (d) commercially available TiO2), (f) corresponding voltage profiles curves. (g) Discharge capacity curves of Li/LiV3O8 ((a) sol–gel and (b) hydrothermal) (h) corresponding voltage profiles (solid lines represent discharge and dashed lines represent charge). (i) Discharge capacity of Li/Li4Ti5O12 electrochemical cells ((a) spherical (commercial) and (b) “flower-like” motifs), (j) corresponding voltage profiles.76 Copyright: 2017 American Chemical Society. | |
6.1.2. Controlled facet growth for improved ion intercalation and charge transfer.
Even though the control of dimensionality has many advantages such as increased surface area and improved light absorption, it may suffer from reduced mechanical and cycling stability. Compared with dimensionality control, controlled facet growth enhances surface reactivity by presenting active sites with optimized atomic arrangements, improves charge carrier dynamics by promoting effective electron–hole separation, and fine-tunes light absorption. Furthermore, facet growth allows for selective tuning of electrochemical reactions, making it an effective strategy for optimizing performance in energy storage applications.77 In the past decades, anatase TiO2 has been actively studied as an anode material in Li-ion batteries with an operating voltage higher than 1 V, due to its various characteristics, such as higher specific surface area, lower volume change during the Li+ insertion/desertion process, good cycling stability, lower internal resistance, and lower intercalation potential for Li. It is noted that Li+ intercalation/deintercalation depends on the orientation of the anatase TiO2, and the anatase TiO2 with a (001) surface facilitates the rate of Li-ion storage. Also, as seen in Fig. 23(a), the equilibrium shape of an anatase TiO2 crystal generally possesses a slightly truncated bipyramid shape enclosed by more than 94% {101} and fewer than 6% {001} facets. It is seen that the TiO2 nanosheets with exposed {001} facets offer high surface areas (∼170 m2 g−1), which provide more Li+ insertion along the c-axis and short paths for Li-ion diffusion, as seen in Fig. 23(b).78–80 For example, Cheng et al.81 reported ∼10 nm thick anatase TiO2 nanosheets (NSs) with 82% exposure of {001} facets, which is seen in Fig. 23(c–f). Also, Fig. 23(g) shows a typical XRD pattern, which confirms the formation of anatase TiO2. Fig. 23(h) shows that the charge–discharge voltage profiles exhibited ∼1.75 V for lithium insertion and ∼2.0 V for lithium extraction. Fig. 23(i) shows that the anatase TiO2 NSs exhibited a higher discharge capacity of 143.6 mA h g−1 than the P25 TiO2 NPs (105.5 mA h g−1) after 100 cycles at 1C. At 10C, the anatase TiO2 NSs electrodes still delivered a reversible capacity of 101.9 mA h g−1 after 100 cycles compared with P25 TiO2 NPs (32.3 mA h g−1). Fig. 23(j) shows the comparative rate performance at different current rates. These results reveal the better rate performance of the ultrathin anatase TiO2 NSs with dominant {001} facets, which could be attributed to their ultrathin thickness in the [001] direction with a large amount of {001} exposed facets, which allows fast and efficient lithium insertion/extraction. Likewise, Yang et al.82 reported Mn-based P2 layered oxide cathodes for Na-ion batteries. Here, they controlled the coordination numbers to direct the preferred orientation growth, which means that inhibiting the {001} active facet facilitates the faster growth of the {010} active facet (Fig. 23(k–m)), enabling the electrode to have large Na-ion diffusion. Mn2+ with six coordination (C-Na0.67MnO2) facilitated the same. C-Na0.67MnO2 cathode brought a capacity of 106.8 mA h g−1 with a retention of 94.8% after 150 cycles, as seen in Fig. 23(n).
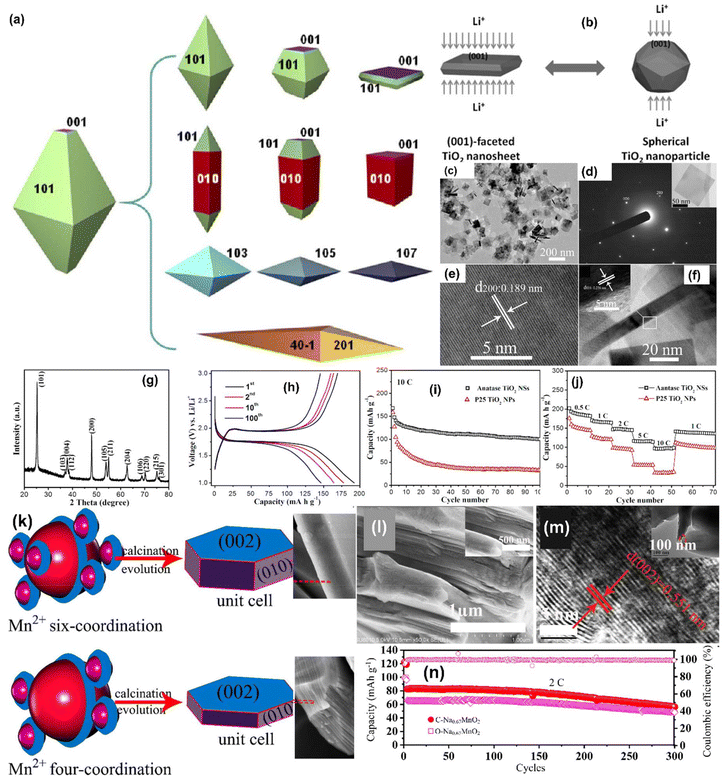 |
| | Fig. 23 (a) Possible equilibrium crystal shape of anatase TiO2.78 Copyright: 2014 American Chemical Society. (b) Schematic illustration of the facilitation of lithium diffusion in (001) faceted TiO2 nanosheets over spherical TiO2 nanoparticles (NPs).79 Copyright: 2014 Wiley. (c) TEM image, (d) SAED pattern (inset: single TiO2 nanosheet (NSs)), (e) corresponding HRTEM image of an anatase TiO2 nanosheet, (f) vertical-view TEM image of an individual TiO2 nanosheet, (g) XRD pattern of an anatase TiO2 nanosheet, (h) charge–discharge voltage profiles at 1C, (i) cycling performances at 10C, (j) rate capability of the anatase TiO2 NSs and P25 TiO2 NPs.81 Copyright: 2014 American Chemical Society. (k) Schematic illustration of facet growth of six and four co-ordinates based Na0.67MnO2 cathode (l–m) SEM and HRTEM images of Na0.67MnO2, (n) long-term cycling performance at 2C.82 Copyright: 2023 Elsevier. | |
Wang et al.83 proposed Li–O2 PARBs with a (002) facet-controlled WO3, which was confirmed by SEM and HRTEM analysis, as shown in Fig. 24(g–l). Here, the (002) facet of WO3 exhibited higher photoactivity due to the deepened quasi-Fermi level (q-EF) of holes in Fig. 24(a). This obtained system delivers an ultralow polarization overpotential of 0.07 V, with a higher discharge capacity of up to 10![[thin space (1/6-em)]](https://www.rsc.org/images/entities/char_2009.gif) 500 mA h g−1 (Fig. 24(n)), and high cycling stability for 200 h could be attained by the WO3 photocathode. On the other hand, it is known that the (010) facet of BiVO4 is highly photoactive because it possesses a higher surface area available to gather the photogenerated electrons and facilitates the photogenerated electron–hole pairs separation.84,85 For example, Zhang et al.84 demonstrated {010} and {110} crystal facets of monoclinic BiVO4, in which BiVO4 crystal facets were formed using a template and surfactant-free method. Fig. 25(b) shows that BiVO4 was decahedron shaped with a truncated tetragonal bipyramid that was obtained at a higher HNO3 concentration, in which the top and bottom flat surfaces were geometrically defined as {010} facets. In comparison, the trapezoidal sides were assigned as {110} facets. The apparent decrease in thickness was due to the lower HNO3 concentration, which indicated the formation of platelike BiVO4 (Fig. 25(c)), which had greater exposure {010} facets relative to the {110}. Fig. 25(d) illustrates the steady-state fluorescence spectra of both BiVO4, exhibiting a prominent band located at 500 nm and a low-energy tail band extended to 650 nm. These emission bands originated from the recombination of radiative electron–hole pairs. It is noted that the truncated bipyramid BiVO4 has a relatively more minor area of the {010} facets than the {110} facets; thus, the number of free electrons available on the surface of photogenerated truncated bipyramid BiVO4 was less than the holes. Nevertheless, the opposite phenomenon was applied to platelike BiVO4, where the more significant {010} facets than {110} facets facilitated the photogenerated charge transfer. Also, as shown in Fig. 25(e), the decay curve showed a sharp decay, which could be attributed to ultrafast hole trapping in m-BiVO4. The platelike BiVO4 had lifetimes of 1.0 and 9.5 ns for the fast (τ1) and slow (τ2) components. In contrast, the truncated bipyramid BiVO4 had shorter lifetimes of 0.8 (τ1) and 6.8 ns (τ2), signifying a more considerable electron trapping and a faster photogenerated charge recombination rate than the platelike BiVO4. Fig. 25(f and g) compares truncated bipyramid and platelike BiVO4 regarding charge trapping and the charge transfer kinetics contributing to the different photocatalytic activities. Because of the extended {010} facets exposed on platelike BiVO4 compared with truncated bipyramid BiVO4, the more significant population of photogenerated electrons available on its surface can facilitate electron transfer, leading to better photoactivity.
500 mA h g−1 (Fig. 24(n)), and high cycling stability for 200 h could be attained by the WO3 photocathode. On the other hand, it is known that the (010) facet of BiVO4 is highly photoactive because it possesses a higher surface area available to gather the photogenerated electrons and facilitates the photogenerated electron–hole pairs separation.84,85 For example, Zhang et al.84 demonstrated {010} and {110} crystal facets of monoclinic BiVO4, in which BiVO4 crystal facets were formed using a template and surfactant-free method. Fig. 25(b) shows that BiVO4 was decahedron shaped with a truncated tetragonal bipyramid that was obtained at a higher HNO3 concentration, in which the top and bottom flat surfaces were geometrically defined as {010} facets. In comparison, the trapezoidal sides were assigned as {110} facets. The apparent decrease in thickness was due to the lower HNO3 concentration, which indicated the formation of platelike BiVO4 (Fig. 25(c)), which had greater exposure {010} facets relative to the {110}. Fig. 25(d) illustrates the steady-state fluorescence spectra of both BiVO4, exhibiting a prominent band located at 500 nm and a low-energy tail band extended to 650 nm. These emission bands originated from the recombination of radiative electron–hole pairs. It is noted that the truncated bipyramid BiVO4 has a relatively more minor area of the {010} facets than the {110} facets; thus, the number of free electrons available on the surface of photogenerated truncated bipyramid BiVO4 was less than the holes. Nevertheless, the opposite phenomenon was applied to platelike BiVO4, where the more significant {010} facets than {110} facets facilitated the photogenerated charge transfer. Also, as shown in Fig. 25(e), the decay curve showed a sharp decay, which could be attributed to ultrafast hole trapping in m-BiVO4. The platelike BiVO4 had lifetimes of 1.0 and 9.5 ns for the fast (τ1) and slow (τ2) components. In contrast, the truncated bipyramid BiVO4 had shorter lifetimes of 0.8 (τ1) and 6.8 ns (τ2), signifying a more considerable electron trapping and a faster photogenerated charge recombination rate than the platelike BiVO4. Fig. 25(f and g) compares truncated bipyramid and platelike BiVO4 regarding charge trapping and the charge transfer kinetics contributing to the different photocatalytic activities. Because of the extended {010} facets exposed on platelike BiVO4 compared with truncated bipyramid BiVO4, the more significant population of photogenerated electrons available on its surface can facilitate electron transfer, leading to better photoactivity.
 |
| | Fig. 24 (a) Schematic of the facet-controlled Li2O2 growth routes and WO3 photocatalytic activity in Li-organic PARBs, (b) photoresponses of the Li-organic PARBs with intermittent light on and off during both the discharge and charge processes for 3-WO3-nanosheet/CC, (c) galvanostatic discharge profiles of the three photocathodes at 50 mA g−1 without and with illumination. (d) Proposed mechanism for the photoassisted discharge, (e) long-term cycling test of the photocathode, (f) schematic band structure diagram for the prepared WO3/CC photocathodes, (g) schematic of charge/discharge process in the WO3/CC cathode under illumination.83 Copyright: 2023 Royal Society of Chemistry. | |
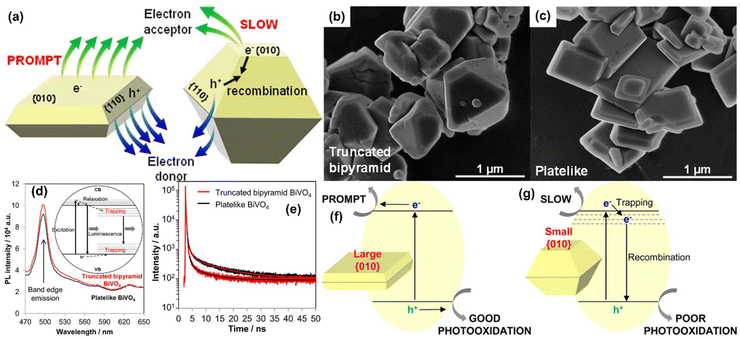 |
| | Fig. 25 (a) Schematic representation of facilitated charge transfer of large exposed (010) BiVO4 surface. SEM micrographs of (b) truncated bipyramid and (c) platelike BiVO4, (d) steady-state fluorescence spectra of truncated bipyramid and platelike BiVO4 (inset: mechanism of photoluminescence), (e) time-resolved PL spectra of the band-edge emission of truncated bipyramid and platelike BiVO4.85 Copyright: 2016 American Chemical Society. | |
6.2. Defect engineering for improving the active sites and enhanced light absorption
While morphological engineering is beneficial for increasing surface area and enhancing light absorption, it has several disadvantages for PARBs, such as decreased material and cycling stability; and increasing surface area generally promotes unwanted side reactions, reducing efficiency. Moreover, it doesn't provide precise control over electronic properties, such as band structure or charge carrier dynamics, which are crucial for optimizing light-driven processes. As a result, increased surface area can sometimes result in inefficient charge separation and higher recombination rates, limiting energy conversion efficiency. On the other hand, defect engineering has been a crucial phenomenon for materials science, enabling the modulation of electronic structures and the fine-tuning of local structures, etc. In the ideal case of crystals, all atoms are arranged in a perfectly ordered manner. Nevertheless, in reality, the structure of the actual crystal departs from the perfect arrangement, and is called a crystal defect. In the past few decades, defects have been commonly considered undesirable phenomena in crystals. There is a vast misunderstanding of their roles in various applications, and previously researchers have avoided defects in different materials. After understanding their merits in various applications, the artificial control and rational design of defects can offer the tuning of the structural and electronic properties of the materials.86,87 Defect engineering provides various functions in rechargeable batteries, such as more active sites, faster ion diffusion, and charge transfer by reducing migration and diffusion barriers, as shown in Fig. 26. Furthermore, the presence of defects can increase surface energy and promote electrochemical parameters. It is noted that defects reduce the stress between adjacent layers, which promotes the intercalation and deintercalation of ions. Also, defect-rich materials increase the number of active sites for energy storage on their surface, which increases the capacity and improves their electrochemical performance.88,89 In photoactive materials, the formation of defects extends the light absorption, modulates the electronic structure, and reduces the photogenerated electron–hole pairs’ recombination.90 Among the various defects, such as point defect, surface defect, line defect, and bulk defect, the point defect is the simplest form, which can be divided into two types, namely intrinsic and non-intrinsic defect. Vacancies in the lattice cause the intrinsic defect, called the Schottky defect, whereas the Frenkel defect is generally caused by atoms or ions squeezing into the interstitial lattice sites. The non-intrinsic defects are caused by impurity atoms in the lattice, which is called doping.88 A detailed investigation of vacancies and doping for PARB is given in the following sections.
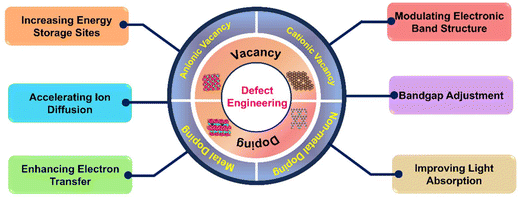 |
| | Fig. 26 Schematic representation of defect engineering. | |
6.2.1. Formation of vacancies to improve the active sites and light absorption.
The most studied defect in nanomaterials is called a vacancy, which arises when a cation or anion is absent from a specific spot in the perfect crystal lattice. Three different types of vacancies can be distinguished: anionic, cationic, and polyionic (cationic and anionic). Because of their low formation energies, anionic vacancies like O, N, and S are the most common in semiconductor materials based on oxide, nitride, and sulfide, respectively. The anionic vacancies significantly impact the energy band structure, which increases light absorption. Additionally, they effectively modulate the local microstructure, thereby improving active sites.
On the other hand, the cationic vacancies play a vital role by acting as shallow acceptors. Also, they modulate the energy band structure through upward shifting of the valence band maximum (VBM) and downward shifting of the conduction band minimum (CBM). Moreover, they facilitate the separation and rapid transfer of photogenerated charge carriers. Overall, vacancy engineering provides notable advantages in semiconducting photoactive material, such as (i) providing a narrow band gap, (ii) enhanced light absorption, and (iii) improved charge separation.87,91 As shown in Fig. 27, both anionic and cationic vacancies form the trap states in the disorder crystal structure within their band gap of the semiconductor. The anionic vacancy leads to the absence of a negatively charged ion that traps an electron. This trapping prevents the electron from conducting until it is released into the CB.
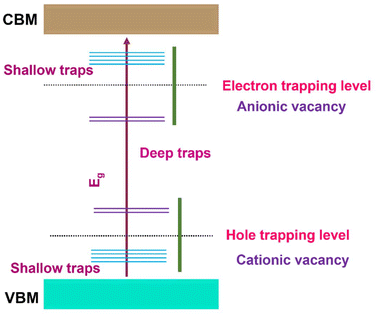 |
| | Fig. 27 Schematic representation of formation of trap states during vacancy formation. | |
On the other hand, the absence of a positively charged ion traps a hole, and this hole trapping prevents the hole from moving freely in the VB. The traps can be shallow if they are located in the vicinity (a few kT) of the band edge or deep if they lie far away (several kT) from the band edge. The charge carriers in the shallow traps can facilitate charge transport through thermally activated hopping or tunnelling from one localized state to another, whereas the deep states often act as charge carrier recombination centres, reducing their overall lifetime.92–94 Pan et al. theoretically investigated the effect of S-vacancy on the electronic and optical properties of the FeS2 electrode since it is a fascinating electrode for Na-ion batteries.95 Their results determined that the S-vacancies enhance the electrical and catalytic activity of FeS2 because the band gap of S-vacancies is much lower than that of FeS2. Also, the S-vacancies improve the photocatalytic properties of FeS2 and electrical conductivity.
On the other hand, for PARB, Sun et al.96 investigated oxygen vacancy-rich molybdenum trioxide (MoO3−x) nanorods for Li–O2 batteries. The oxygen vacancies confirmed some disorder and discontinuous lattice fringes, as seen in the ellipse marks of Fig. 28(a), which proved the introduction of the oxygen vacancies in the MoO3−x nanorods. Also, from the ESR spectra of the MoO3 and MoO3−x nanorods, as shown in Fig. 28(b), it is seen that there is no visible ESR signal for the pristine MoO3 nanorods, whereas for the MoO3−x nanorods, an intense signal with a g-factor of 2.003 is observed, which further confirmed the successful introduction of oxygen vacancies in MoO3−x nanorods. Here, the oxygen vacancies increased the light-harvesting ability and improved the electrochemical activity of the MoO3−x cathode. As illustrated in Fig. 28(c), MoO3−x nanorods will accelerate the ORR and OER processes under illumination. During discharge, the photogenerated electrons excited in the CB will boost the formation of Li2O2. Meanwhile, the holes are present in the VB and reduced via the electrons in an external circuit. During charging, the holes in the VB can facilitate the decomposition of Li2O2, and the photoelectrons can reduce Li+ at the anode through the external circuit. In Fig. 28(d), it is seen that the overpotential of MoO3−x under light was 0.22 V at mA g−1, corresponding to the round-trip efficiency of 92.86% with a cycle life of 100 cycles under light (Fig. 28(e)). These results indicate that the oxygen vacancy-rich MoO3−x nanorods facilitated the ORR and OER processes in the Li–O2 PARBs. Furthermore, Li et al.97 reported an oxygen vacancy-mediated Ag/Bi2MoO6 supported on carbon cloth (AB-OV/CC) for a photoassisted Li–O2 system. As shown in Fig. 28(f), the hot electrons generated from plasmonic Ag overcame the Schottky barrier and were injected into the level of the oxygen vacancy of Bi2MoO6 (B-OV). This vacancy was confirmed by the EPR signal at g = 2.003, as seen in Fig. 28(g). The relationship between the energy level diagram of the obtained AB-OV/CC and the thermodynamic equilibrium potential of Li–O2 battery is given in Fig. 28(h). From that, it is seen that the hot electrons from sp-bands transferred to the band of oxygen vacancy and reacted with O2 to generate Li2O2, while the hole below the EF of Ag possessed a potential above 2.96 V, which is the redox potential of Li+/Li. Thus, upon discharge, the energy level of the holes received electrons from the external circuit on the cathode, whereas during charging, Li2O2 was oxidized to O2 by holes. Therefore, AB-OV/CC was used as a bifunctional photoelectrode to promote ORR and OER for Li–O2 cells. Here, Fig. 28(j) demonstrates the rate performance of the AB-OV/CC photocathode at different current densities of 50 mA g−1 to 1 A g−1, which sustained a higher efficiency. Fig. 28(k) illustrates that an obvious photocurrent for the AB-OV/CC photocathode was observed during discharge or charge under illumination. Also, the long-term cycling performance at 50 mA g−1 is given in Fig. 28(l), demonstrating better stability with a round-trip efficiency retention of 70% after 500 h with illumination, compared with 46% after 280 h without illumination. These results give clear evidence for higher photoutilization and faster kinetics of the Li–O2 battery.
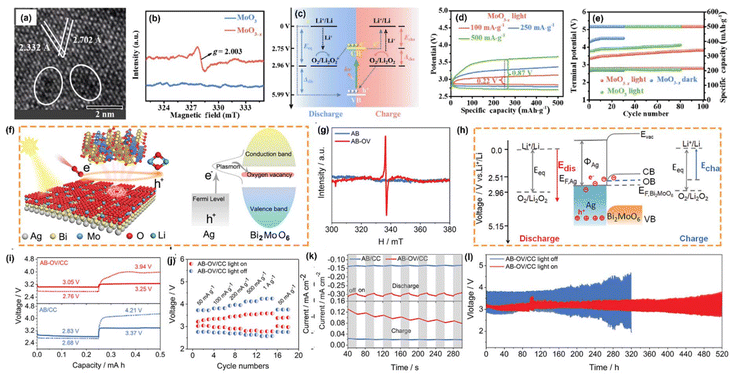 |
| | Fig. 28 (a) HRTEM image of MoO3−x nanorods, (b) ESR spectra of MoO3 and MoO3−x nanorods, (c) schematic energy diagram of Li–O2 cell using MoO3−x nanorods under illumination, (d) discharge and charge curves with MoO3 and MoO3−x under illumination, (e) corresponding cycle number associated with terminal discharge/charge voltage and delivered discharge.96 Copyright: 2023 Sciopen. (f) Schematic illustration of the AB-OV/CC photocathode for Li–O2 battery, (g) EPR spectra of Bi2MoO6 with oxygen vacancy, (h) reaction mechanism of the photoinvolved Li–O2 battery with AB-OV/CC photocathode, (i) discharge and charge profiles of AB-OV/CC and AB/CC photocathode at 50 mA g−1, (j) rate performance of AB-OV/CC photocathode, (k) photocurrent behaviors, (l) cycle performance at a current density of 50 mA g−1.97 Copyright: 2022 Wiley. | |
6.2.2. Doping to improve the visible light absorption and charge transfer.
The other point defect is the introduction of impurities or dopants, in which the doped atoms are placed substitutively or interstitially into the crystal lattice. Compared with vacancy formation, dopants can selectively promote or inhibit certain reactions. There are possibilities for two types of doping; one is metallic doping and the other one is non-metallic doping. In metallic doping, if the dopant concentration is lower, it can introduce localized electronic states above the VB as seen in Fig. 29(a), or an acceptor level below the CB, as seen in Fig. 29(b), which can narrow their band gap and thus greatly enhance their photoactivity under visible light. Instead, if the dopant concentration is higher, delocalized states will be formed in the middle of the band gap, known as intermediate or mid-gap states, as shown in Fig. 29(c). Appropriate doping enhances visible light absorption due to the formation of localized or delocalized electronic states and enhances the separation efficiency of photogenerated electron–hole pairs. Overall, metal ion doping can improve the electronic structure, such as the mobility and conductivity of charge carriers, thus promoting the separation and transfer of photogenerated charge carriers. On the other hand, for non-metallic doping, there will be (i) a broadening of the VB, as seen in Fig. 30(a), (ii) introduction of localized states above the VB (Fig. 30(b)), (iii) introduction of localized states below the CB (Fig. 30(c)), (iv) formation of color centres in the band gap (Fig. 30(d)). Moreover, these changes are reflected in the absorbance spectrum of the semiconductor, as shown in Fig. 31. In the first case, the formation of local states due to doping for optical excitation and relaxation leads to the absorption tail of the absorption curve in longer wavelengths (Fig. 31(b)) compared with an intrinsic semiconductor (Fig. 31(a)). The other case caused by doping is shifting the CBM or VBM, narrowing the band gap (Fig. 31(c)), thus causing a red-shift at the edge of the absorption spectrum.
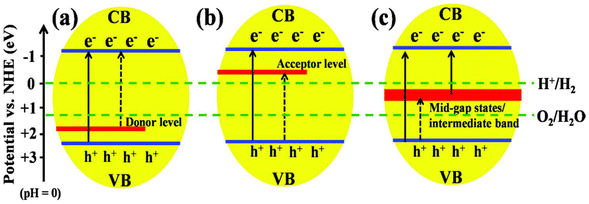 |
| | Fig. 29 (a) Donor level, (b) acceptor level, (b) and mid-gap states formed by metal ion doping in the semiconductor.98 Copyright: 2015 Royal Society of Chemistry. | |
 |
| | Fig. 30 Schemes illustrating the possible mechanisms for non-metal doping. (a) Narrowing of the band gap resulting from the broadening of the VB; (b) introduction of localized states above the VB; (c) introduction of localized states below the CB; (d) formation of color centres in the band gap.98 Copyright: 2015 Royal Society of Chemistry. | |
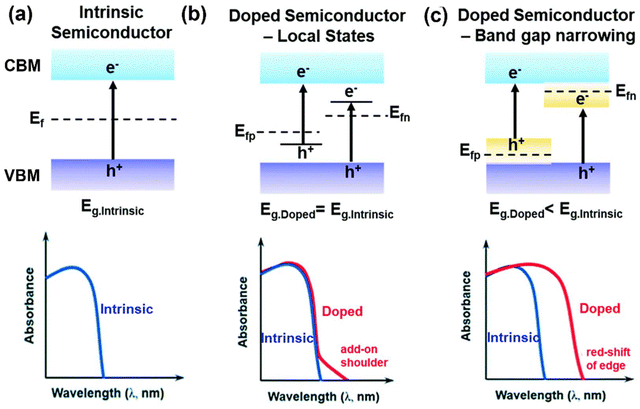 |
| | Fig. 31 The band structure and optical absorption curves of (a) an intrinsic semiconductor, (b) doping-induced intra-band energy states, (c) doping-induced band gap narrowing.99 Copyright: 2019 Royal Society of Chemistry. | |
Besides vacancy formation, doping improves conductivity and ionic mobility, eventually leading to improved electrochemical properties and cycling stability. For example, Nulu et al.100 prepared transition metal-doped (0.5% Mn and 0.5% Ni) nano silicon anodes, as shown in Fig. 32(a), for Li-ion energy storage applications. The cycling stability tests were analysed at 200 mA g−1 for 100 cycles. The results are given in Fig. 32(b), in which the Si NPs decayed quickly during the first 30 cycles with only 8% capacity retention. In contrast, the SiMn05% and SiNi05% gave 2324/2301 and 2561/2538 mA h g−1 with 88% and 86% capacity retention, respectively. Also, the coulombic efficiency is shown in Fig. 32(c), with ∼95% efficiency except for the initial cycles. On the other hand, Fig. 32(d) shows the rate capability with current densities ranging from 100 to 3200 mA g−1, in which the SiNi05% electrode showed higher specific capacity in all the current density ranges. It was noted that after a high applied current of 3200 mA g−1, the SiNi05% delivered a discharge capacity of 2783 mA h g−1. Similarly, the SiMn05% also retrieved 2431 mA h g−1 after applying a current density of 3200 mA g−1. Conversely, Si NPs delivered a specific capacity of only 510 mA h g−1 at the current density of 3200 mA g−1, much less than SiMn05% and SiNi05%. Fig. 32(e) shows that both electrodes exhibited excellent cycling stability, even at high current densities. Then Sun et al.101 explored the effect of various dopants such as Mg2+, Al3+, Ti4+, Ta5+, and Mo6+ on the electrochemical structural properties of Li[Ni0.91Co0.09]O2 cathodic material. The initial charge–discharge curves of the electrode materials are given in Fig. 32(f), which shows that all the cathodes exhibited initial capacities of 227–230 mA h g−1 at 0.1C and 30 °C. Fig. 32(g) displays their cycling performances at 0.5C and 30 °C of the cathodes, in which the lower oxidation state dopants, such as Mg2+ and Al3+, retain 82.5, and 83.7% compared to undoped one (78.8%), respectively, after 100 cycles, and the dopants with higher oxidation states, such as Ti4+, Ta5+, and Mo6+, retain 94.0, 97.0, and 94.9%. Moreover, the long-term cycling of pouch-type full cells (with graphite anodes) in the voltage range of 3.0–4.2 V, at 1C is given in Fig. 32(h). The Mg and Al-doped cathodes displayed better cycling performances than the undoped cathode, attaining capacity retention of 45.1 and 54.2%, respectively, after 1000 cycles. The Mo-doped cathodes revealed excellent cycling performances with a retention of 95% for the 3000 cycles. The Ta-doped cathode achieved a capacity retention of 81.5%. Finally, the Ti-doped cathode achieved in the same way as the Ta and Mo-doped cathodes, experiencing a retention of 76.5% after 1000 cycles. On the other hand, for PARB, Cao et al.102 reported Li–O2 batteries with Co–C3N4; here the VB of the Co–C3N4 was lower than that of C3N4, as seen in Fig. 32(i). Still, both have a higher theoretical decomposition potential of Li2O2, which makes it possible for the photogenerated holes to facilitate the oxidation of Li2O2. Fig. 32(j) displays the charge/discharge curve at 500 mA h g−1 and 100 mA g−1, which shows that Co doping significantly reduced the charge and discharge overpotential without illumination and also increased the conductivity, ORR, and OER ability of C3N4. Under illumination, the charge voltage for C3N4 and Co–C3N4 was decreased from 3.95 to 3.36 V and 3.90 to 3.30 V at 500 mA h g−1 and 100 mA g−1, as shown in Fig. 32(k). Under dark conditions, as shown in Fig. 32(l), the cycle life of Co–C3N4 was five times higher than that of C3N4 for 20 cycles, whereas under illumination, Co–C3N4 had a low cycle life of 300 h at 200 mA g−1.
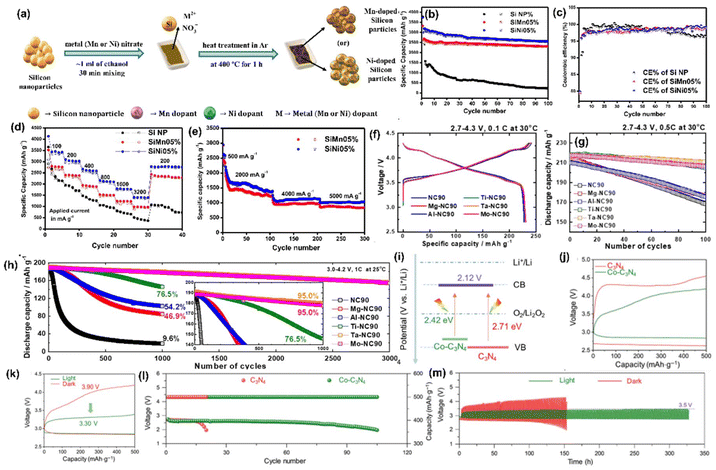 |
| | Fig. 32 (a) Step-by-step procedure to prepare metal (Mn, Ni)-doped Si NPs, (b) cyclability, (c) coulombic efficiency, (d) rate performance, (e) long-term rate performance of Si NPs, SiMn05%, and SiNi05%.100 Copyright: 2022 Elsevier. (f) Charge–discharge cycle curves at 0.1C (18 mA g−1), (g) cycling at 0.5C over 100 cycles at 30 °C, (h) cycling within the voltage range of 3.0–4.2 V vs. graphite at 1C (200 mA g−1).101 Copyright: 2021 Nature. (i) Potential diagram of CB and VB at Li+/Li of C3N4@CP and Co-C3N4@CP, (j) charge–discharge cycle curves of C3N4@CP and Co–C3N4@CP without illumination at 100 mA g−1, (k) charge–discharge cycle curves of Co–C3N4@CP with and without illumination at 100 mA g−1, (l) cycle performance of C3N4@CP and Co–C3N4@CP without illumination at 100 mA g−1, (m) cycle performance of Co–C3N4@CP with and without illumination at 100 mA g−1.102 Copyright: 2023 Springer. | |
6.2.3. Interstitial doping to increase the interlayer spacing for facile ion diffusion.
Pre-intercalation offers unique advantages over doping in PARBs, such as interstitial doping or pre-intercalation, which includes inserting foreign ions into the crystal structure to support the intercalation (Fig. 33). The insertion of large species increases the lattice spacing (d-spacing) in the layered structures since they occupy a larger volume with an increasing atomic radius and longer M–O bond length. This increase in d-spacing can help reduce cationic–cationic repulsion during the charge and discharge process, allowing enhanced capacity and rate performance. Overall, interstitial doping increases characteristics such as d-spacing and cycling stability and alters metal redox centres, corresponding to capacity improvements and ionic and electronic conductivity.103 There are a few more reports available based on interstitial doping for the battery application, and some of the reports are given here. For example, Zhao et al.104 investigated the in situ interstitial doping of CoNb2O6 with regard to Li-ion batteries, in which Fig. 34(a) shows the changes in the crystal structure of pure CoNb2O6 after interstitial and substitutional doping with V. Here, the authors explained that interstitial doping primarily occurs when the doping amount is small. In contrast, when the doping amount exceeds a certain amount, this results in the dominance of substitutional doping. Here, they synthesised V5+-doped CoNb2O6 with different doping amounts, such as 0.25, 0.5, and 1%, denoted as CNO (pure) and CNO-Vx (doped). Fig. 34(b) shows the rate capability of the electrodes in which the CNO-V0.005 electrode delivered the discharge capacity of 1007.8 mA h g−1 and 138.6 mA h g−1 at 100 and 5000 mA g−1, respectively, indicating excellent rate performance and capacity retention rate. Moreover, the long cycling performance of CNO-Vx is shown in Fig. 34(c), which shows that the high discharge capacity of 276.8 mA h g−1 was maintained after 1000 cycles at 2000 mA g−1. Overall, the doping with V5+ can effectively broaden the Li channel and accelerate the Li-ion transmission rate, and it has a good rate of performance. Also, DFT calculations were done and the authors calculated the energy barriers for Li+ diffusion in pure, substitutional, and interstitial-doped CoNb2O6, which were 0.625, 0.448, and 0.167 eV, respectively (Fig. 34(d–f)). From that, it is seen that interstitial-doped CoNb2O6 had lower energy barriers for Li+ diffusion (Fig. 34(f)), facilitating higher conductivity and a faster ion transfer rate. Xu et al.105 reported B-doped (interstitial) Mn-based layered oxide cathode, namely K0.5Mn0.8Co0.2B0.1O2 (KMCO) for K-ion batteries. The schematic of interstitial doping with B in KMCO is visualized in Fig. 34(g), and a small amount of boron atoms were embedded in between the transition metal layers and formed the strong bonding interaction with the nearest four oxygen atoms with the tetrahedron co-ordination, which regulated the Jahn–Teller distortion of the transition metal. Moreover, the cycle performances are given in Fig. 34(h). Here, the KMCBO displayed a reversible capacity of 86.1 mA h g−1 at 200 mA g−1 with a capacity retention of 87.1% after 100 cycles, while K0.5Mn0.8Co0.2O2 (KMCO) and K0.5MnO2 (KMO) retained the capacity of only 61.3 and 26.7%. Likewise, the rate capability of these samples is shown in Fig. 34(i). This shows the continuous capacity degradation of KMO during the first 5 cycles at 0.1C and has only 10.1 mA h g−1 at 5C. In contrast, KMCBO recovered 103.0 mA h g−1 at 0.1C, and this rate capability indicates that B-doping effectively improved the K+ transportation kinetics in the layered structure. In addition, the cycle performance between 1.4–4.3 V is shown in Fig. 34(j). As is known, KMO offers rapid capacity degradation, whereas KMCBO showed a much enhanced cycling stability and delivered a higher capacity of 99 mA h g−1 after 50 cycles at 1C. Overall, interstitially doped boron ions supported the formation of a homogeneous cathode electrolyte interphase (CEI) layer, enhancing interfacial stability and highly reversible cycling with a wide voltage range (1.4–4.3 V). The partial charge density distribution from DFT studies is illustrated in Fig. 34(k–l), which shows that strong B–O bonding in KMCBO tended to construct a regular hexahedral structure with mitigated Jahn–Teller distortion and improved electrical conductivity. Similarly, Fang et al.106 also mitigated the effect of Jahn–Teller distortion of Na0.67Fe0.5Mn0.5O2 (NFMO) layered cathode by B3+ doping for Na-ion battery, and the schematic is shown in Fig. 34(m). Fig. 34(n) shows the comparison of the charge/discharge curves in the voltage range of 1.5–4.0 V at 0.1C, and the B-doped NFMO showed slightly lower capacity (152 mA h g−1) than pristine NFMO (161 mA h g−1), but the NFMO-B curve is steeper in the voltage range of 1.5–2.0 V. This shows the inhibition of Mn3+/Mn4+ redox activity. Moreover, in the rate performance in Fig. 34(o), the capacity of pristine NFMO rapidly decayed due to the slow diffusion kinetics. It displayed a specific capacity of 49 mA h g−1 in the voltage window of 1.5–4.0 V at 10C with the capacity retention of only 31%. Meanwhile, B-doped NFMO showed a better rate performance than the pristine one, with a capacity of 89 mA h g−1 at 10C, with a 59% retention. Fig. 34(p) displays the long cycling performance of the cathodes with the voltage range of 1.5–4.0 V at 1C over 100 cycles. After 100 cycles, NFMO-B delivered a capacity of ∼114 mA h g−1, with a ∼89% capacity retention, which was ∼24.2% higher than pristine NFMO. Fig. 34(q) shows that B steadily occupied the tetrahedral interstitial position and did not contribute to charge compensation for the charge/discharge process. Also, it decreased the amount of Mn3+ during the charge/discharge process; hence, the Jahn–Teller effect was weakened. Therefore, a stable M–O layer was constructed during long cycling, allowing the layer structure to be effectively maintained. Furthermore, the electrostatic repulsion between B3+ and transition metal ions mitigated the migration of metal ions, efficiently improving the metal ion dissolution, leading to better cycling stability.
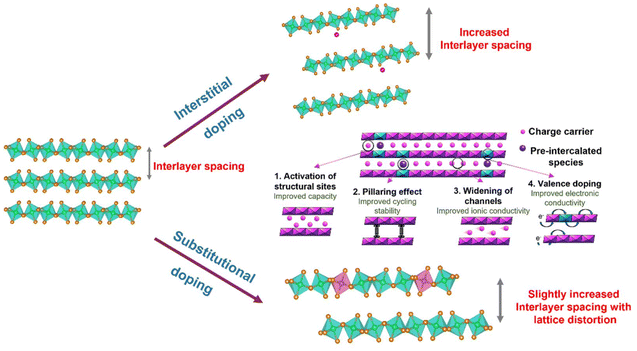 |
| | Fig. 33 Two types of doping, namely interstitial and substitutional doping, are used for battery application. The inset figure is taken from ref. 103 Copyright: 2024 Elsevier. | |
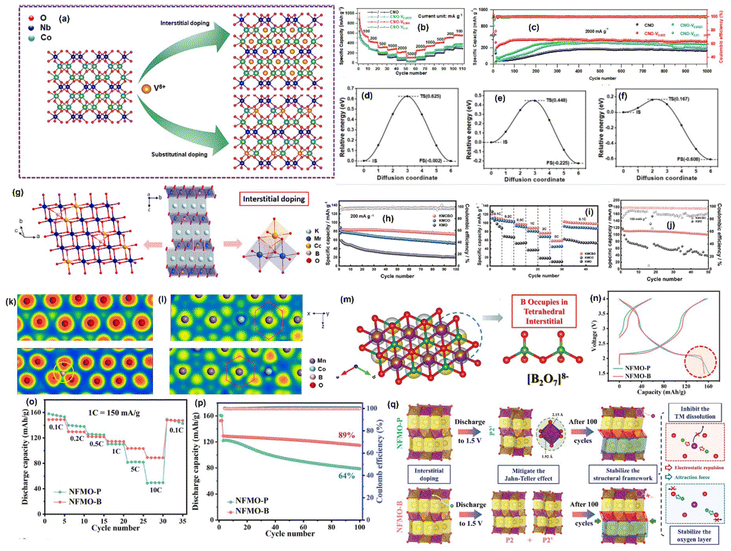 |
| | Fig. 34 (a) Schematic diagram of CoNb2O6 and its structural changes after doping, (b) rate capability testing of Li half cells at different current densities, (c) cycling performance of CNO and CNO-Vx for 1000 cycles at 2000 mA g−1. Calculated Li diffusion energy barriers of (d) CNO, (e) substitutional doped CNO, and (f) interstitial-doped CNO.104 Copyright: 2023 Elsevier. (g) Schematic structure of KMCBO, (h) cycle performance of the three samples at 2C between 1.4 and 4.0 V, (i) rate capability of the three samples from 0.1C to 5C between 1.4 and 4.0 V, (j) cycling performance of KMO and KMCBO at 1C, (k–l) charge density distribution for KMCO and KMCBO visualized by electron localization functions.105 Copyright: 2023 Elsevier. (m) Crystal structure of P2-type NFMO-B along the c-axis and schematic illustration of the site occupied by B3+, (n) GCD curves at 0.1C, (o) rate performance of NFMO-P and NFMO-B cathodes, (p) cycling performance of NFMO-P and NFMO-B cathodes in the voltage range of 1.5–4.0 V at 1C (150 mA g−1) over 100 cycles, (q) schematic illustration of the mechanism by which B3+ mitigates material failure.106 Copyright: 2023 Wiley. | |
6.3. Heterojunction formation for band alignment
The formation of heterojunctions is considered an efficient method to improve photoactivity by resolving the major problem of a higher recombination rate of photogenerated electron and hole pairs. Heterojunction formation provides significant advantages over morphological and defect engineering in PARBs by enabling highly efficient charge separation and transport. Heterojunctions also allow for selective tuning of light absorption across a broader range of wavelengths by combining materials with complementary band structures, improving photon-to-electron conversion efficiency. Unlike morphological engineering, which can increase instability in complex structures, heterojunctions often bring enhanced stability, as each material can contribute specific structural or chemical properties that reinforce overall durability. Overall, heterojunctions offer a synergistic approach that combines optimized charge dynamics, light absorption, and reaction selectivity, giving them an edge over morphological and defect engineering in photoassisted energy storage applications. Also, in a heterojunction, two materials with complementary electronic properties (often with different bandgaps) are joined to create a built-in electric field at their interface. This electric field effectively drives electrons and holes in opposite directions, drastically reducing charge recombination, which is the challenge of morphological and defect engineering. The heterojunctions can be classified into several types, such as (i) type I heterojunction, (ii) type II heterojunction, (iii) p–n heterojunction, and (iv) Z-scheme heterojunction, etc. In type I heterojunction, both the CB and VB of semiconductor-B are lower than semiconductor-A, which leads to the transfer of both e− and h+ in semiconductor-A into semiconductor-B under illumination after photoexcitation.107,108 Therefore, the photogenerated electrons and holes are accumulated in the same semiconductor and cannot be separated effectively, leading to quick recombination and the redox ability of the electron–hole pairs; therefore, type-I is not favourable. Type II heterojunction is the most commonly used one, in which the photogenerated electrons in the CB of semiconductor-A will transfer to the CB of semiconductor-B under light illumination, and the photogenerated holes in the VB of semiconductor-B will be transferred to the VB of semiconductor-B, as shown in Fig. 35(a). Here, due to the formation of an inner electric field (IEF) at the interface, the photogenerated electron–hole pairs can be separated efficiently, resulting in improved photoactivity. For example, Kumar et al.44 presented a two-electrode Li-ion PARB with MoS2/MoOx hetero-structured semiconductor for effective separation of photoexcited electron–hole pairs, and with higher energy capacity also being considered as a factor for heterostructure material selection when compared with the individual counterparts. Because of the recombination effect and high exciton binding energy, it is troublesome to separate photogenerated charges. Hence, the authors have suggested type II semiconductors (Fig. 8(h)), thus observing a discharge capacity of 162 mA h g−1 (Fig. 8(i)). After the voltage stabilization (at 1.14 V), under illumination, the voltage enhancement of up to 1.95 V within 6 h can be seen in Fig. 8(j), with the PCE being 0.05% (Fig. 8(k)).
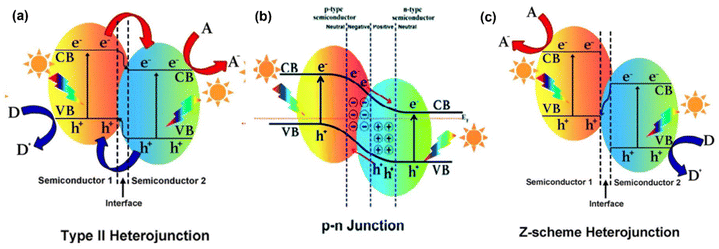 |
| | Fig. 35 Different types of heterojunction: (a) type II heterojunction, (b) p–n junction, (c) Z-scheme.109 Copyright: 2021 Royal Society of Chemistry. | |
Nevertheless, there is still a possibility of photogenerated electron–hole pair recombination. To further reduce electron–hole pair recombination, the concept of the p–n junction is proposed through the synergy of the band alignment of the interface and IEF. In general, after contact with the p and n-type semiconductor, electrons on the n-type semiconductor diffuse into the p-type semiconductor, and holes in the p-type semiconductor tend to diffuse into the n-type semiconductor simultaneously until they reach the EF equilibrium. As a result, an IEF is formed at the p–n junction interface, as seen in Fig. 35(b). Under the synergy of the IEF and light illumination, electrons and holes will migrate in an opposite direction, greatly inhibiting the recombination of electrons and holes, thus further improving the photoactivity. For instance, Zhu et al.110 used n-type Fe2O3 and p-type Cu2O nanowires to form a p–n heterojunction for metal–CO2 PARB, as shown in Fig. 36(a), and this p–n junction promoted the CO2RR/CO2ER kinetics and reduced the voltage gaps. Fig. 36(b) compares the discharge/charge curves with and without illumination. From that, it is seen that the illumination condition was more desirable than the dark, which shows higher round-trip efficiency. Also, the rate performance in Fig. 36(c) displayed a higher discharge voltage in illumination at different current densities. The long-term cycling tests were carried out at a current density of 0.1 mA cm−2, as shown in Fig. 36(d). Under illumination, this Li–CO2 battery exhibited a long-term cycling stability over 260 cycles with a potential gap of less than 0.38 V. Meanwhile, the round-trip efficiency after 260 cycles was maintained at 88%. On the other hand, Liu et al.111 investigated p–n Cu2O/CuCoCr-layered double hydroxide heterojunction nanosheets for aqueous Zn–CO2 PARBs, and the schematic of p–n Cu2O/CuCoCr LDH is given in Fig. 36(e), to reduce the CO2 to CO and CH4. Fig. 36(f) displays the charge and discharge curves of aqueous Zn–CO2 PARB with and without illumination, in which the p–n junction cathode attained 2.48 V charge voltage, 0.59 V discharge voltage, and a voltage platform of 1.89 VZn/Zn2+ under dark condition, whereas under illumination, the charge voltage decreased to 2.07 V and the discharge voltage increased to 1.22 V and round-trip efficiency increased from 23.79% to 58.94%. Furthermore, the stability testing was carried out for 54 h, shown in Fig. 36(g), indicating remarkable stability. Overall, the p–n heterojunction facilitates the separation of photogenerated electrons and holes and increases the performance.
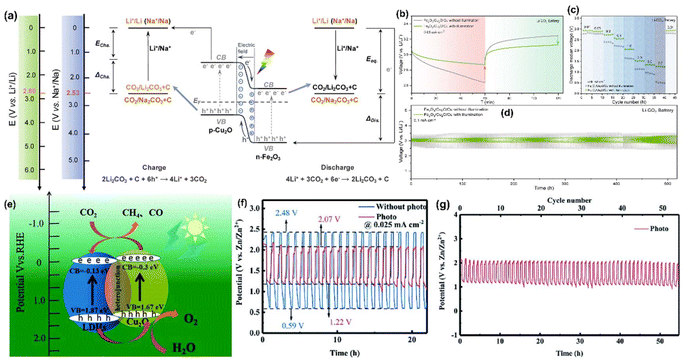 |
| | Fig. 36 (a) Schematic diagram of the working mechanism of Fe2O3/Cu2O nanowires with a p–n heterojunction for increasing discharge voltage and decreasing charge voltage of light-assisted Li/Na–CO2 batteries, (b) discharge/charge voltage curves at a current density of 0.01 mA cm−2, (c) rate performance, (d) cycling curves at a current density of 0.10 mA cm−2.110 Copyright: 2024 Royal Society of Chemistry. (e) Diagram of the CO2RR under PEC conditions, (f) charge and discharge profiles with and without light illumination, (g) galvanostatic discharge–charge cycling profiles at 0.025 mA cm−2 for more than 54 h under illumination.111 Copyright: 2021 Royal Society of Chemistry. | |
However, the weak redox ability of photogenerated electrons and holes is the problem with type II and p–n heterojunctions; therefore, an artificial Z-scheme heterojunction was constructed. As seen in Fig. 35(c), in this instance, the photogenerated holes and electrons in semiconductor-B would recombine and transfer, placing the photogenerated electrons in a relatively higher position and the photogenerated holes in a lower position to take part in the redox reactions. For example, Wang et al.83 reported the formation of a Z-type heterojunction with the (002) facet-dominated WO3 and formed Li2O2. As Fig. 24(b) illustrates, the generated Z-scheme heterojunction facilitated exciton dissociation of Li2O2 into free carriers, allowing photoelectrons to engage in the ORR process and produce Li2O2 continuously. This means that WO3 absorbs photon energy under illumination to generate excited electrons and holes, which are then excited to the CB, leaving the excited holes in the VB. As Fig. 24(p) illustrates, the potentials of electrons and holes are described by their q-EFs. During the discharge process, the photogenerated electrons can participate in the ORR process and induce the reduction of O2 to O2−. Thus, the facet-controlled reaction mechanism is clarified in Fig. 24(q). Yang et al.112 reported α-Fe2O3/SnO2 Z-scheme heterojunction photocathode for Li–O2 batteries. The illustration of the synthesis of α-Fe2O3/SnO2 hollow nanotubes is shown in Fig. 37(a), and the α-Fe2O3 nanotubes had an average diameter of 400 nm, which is shown in Fig. 37(b). This Z-scheme induced the population of photogenerated electrons in the CB of α-Fe2O3, and photogenerated holes populated the VB of SnO2, which inhibited the recombination of photogenerated charge carriers, as shown in Fig. 37(c), resulting in the increase of total operating voltage of the battery. When illuminated, the Z-scheme heterojunction exhibited a 3.27 V discharge plateau and a 3.28 V charging plateau at 0.01 mA cm−2. This resulted in an energy efficiency of 99.7%, surpassing that of the dark condition (73.8%), which displayed a 2.76 V discharge and 3.74 V charge plateau, respectively (Fig. 37(d)). Furthermore, Fig. 37(e) demonstrates that the charge and discharge plateau voltage value was nearly identical to the initial value, demonstrating the heterojunction's good cycle repeatability and, furthermore, showing how the quick migration of electrons and holes under light speeds up the ORR and OER processes for Li–O2 batteries; the overpotential under light is lower than it is in the dark. Moreover, the charge/discharge measurements at 0.01 mA cm−2 are given in Fig. 37(f), which can cycle 252 times when the discharge voltage is 3.0 V. Additionally, the discharge specific capacity can reach 6723.6 mA h g−1 at 100 mA g−1 under illumination, which is higher than the dark condition (2478.6 mA h g−1), as shown in Fig. 37(g). The above results indicate that the α-Fe2O3/SnO2 Z-scheme heterojunction photocathode behaves as a bifunctional photocatalyst, which benefits both ORR and OER under illumination for Li–O2 batteries.
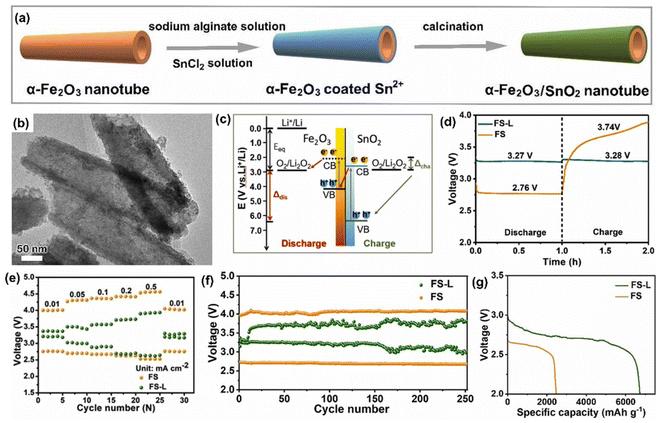 |
| | Fig. 37 (a) Schematic illustration of the synthesis procedure, (b) HRTEM image of α-Fe2O3/SnO2 nanotube, (c) energy diagram, (d) discharge/charge profiles at 0.01 mA cm−2, (e) rate performance, (f) cycling performance at 0.1 mA cm−2, (b) specific capacity at 100 mA g−1 with and without illumination.112 Copyright: 2023 Elsevier. | |
6.4. Electrolyte engineering for enhanced ionic conductivity and cyclic stability
The electrolyte greatly influences the diffusion of ions and the electrochemical reactions at the EEI. Undesirable reactions, such as HER and corrosion, etc., occur at the EEI, which hinder the performance of the batteries. Electrolyte engineering enables precise control over ion conductivity and mobility, optimizing the transport of ions between electrodes to enhance the overall efficiency of charge/discharge cycles. This level of control over ionic pathways is challenging to achieve with heterojunctions. Electrolyte engineering also enables tuneable electrochemical environments, such as pH and ion concentration, which influence the stability and activity of photoelectrodes, allowing for optimized photoassisted charging efficiency, and electrolyte engineering will mainly focus on utilizing hybrid electrolytes, additives, gels and solid electrolytes. These processes can effectively reduce the free water activity, weaken the ion solvation, improve electrochemical stability, and modulate the electric double layers, etc.; there are different types of electrolytes used in the batteries, such as (i) aqueous electrolyte, (ii) organic electrolyte, (iii) hybrid electrolyte, which is the combination of organic and aqueous electrolyte, and (iv) solid electrolyte, which incorporates a polymer electrolyte and a glass-ceramic electrolyte, or a combination of both.113–117 Polymer gel electrolytes possess better electrochemical stability than aqueous electrolytes and the good mechanical properties and flexibility required to form a reasonable SEI and CEI interface. Hybrid electrolytes and electrolyte additives can improve the reversibility of metal anodes by modulating the solvation configuration around metal ion ions to inhibit side reactions. Researchers have achieved good results by using the unique above-mentioned electrolytes to promote the decomposition of anions to regulate the SEI or CEI.118,119 A few examples of electrolyte engineering other than aqueous electrolytes for metal-ion batteries are given below (Fig. 38).
 |
| | Fig. 38 Schematic representation of benefits of electrolyte engineering. | |
Puthiyaveetil et al.120 engineered the CEI with a hydrogel polymer electrolyte for a quasi-solid-state Zn-metal battery (QSS-RZMB). The utilisation of gel polymer electrolytes can prevent the cathode from dissolving, electrolyte leakage, and electrolyte evaporation. Here the Zn-doped MnO was synthesized by a re-flux reaction, and acted as the 3D cathode skeleton for the gel polymer electrolyte, as seen in Fig. 39(a). The hydrogel polymer electrolyte was prepared from the optimal combination of PEG, HEMA, PEGDA, Zn(CF3SO3)2·H2O, and HMPP by UV-light-assisted polymerization. The CV profile of the QSS-Zn|PHPZ-30|Zn–MnO cell is shown in Fig. 39(b), in which the cell, which replaced the hydrogel polymer electrolyte integrated cathode (i-Zn–MnO) with the standard Zn–MnO cathode, showed a weak redox peak, suggesting a poorly designed CEI, and these findings validate that a better-designed interface dramatically aids in controlling the mass transfer issues. Fig. 39(c) displays the GCD profiles at 0.10 A g−1, in which QSS-Zn|PHPZ-30|i-Zn–MnO exhibited a specific capacity of 229.2 mA h g−1 compared with the conventional cell (165 mA h g−1). The rate performance test from Fig. 39(e) showed that QSS-Zn|PHPZ-30|i-Zn–MnO exhibited reasonably good specific capacities compared with conventional cells and retained an almost stable specific capacity of 154 mA h g−1 at 0.25 A g−1. To assess the sustainability of the cells, the cycling stability tests were conducted at the current density of 1.0 A g−1, and are given in Fig. 39(d), in which Zn|PHPZ-30|i-Zn–MnO cell displayed a better cycle life lasting over 1000 cycles with capacity retention and coulombic efficiency of 85% and 99%, respectively, whereas the conventional Zn|PHPZ-30|Zn–MnO cell showed a coulombic efficiency of ∼99% with a capacity retention of 75% over the 100 cycles. These outcomes revealed that using hydrogel polymer electrolytes significantly improved the performance of the traditional QSS-RZMB.
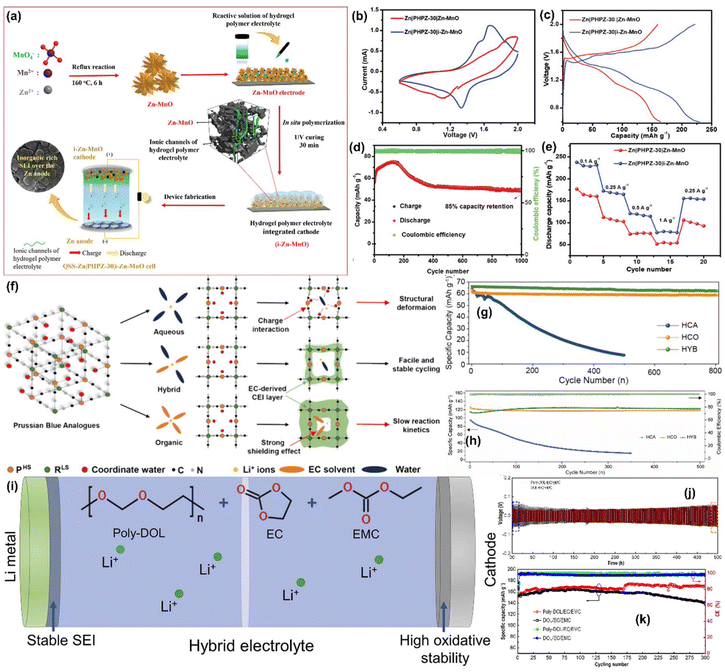 |
| | Fig. 39 (a) Schematic representation of the synthesis of the Zn–MnO cathode and the fabrication of the i-Zn–MnO cathode, (b) CV profiles 1.0 mV s−1, (c) GCD profiles at 0.10 A g−1, (d) rate capability plots of QSS-RZMBs, (e) cycling stability plots of the Zn|PHPZ-30|i-Zn–MnO cell.120 Copyright: 2024 Wiley. (f) Schematic of the structural effect on PBA materials during the Li+ insertion process in different electrolytes, (g) cycle retention tests at 30 mA g−1 in different electrolytes, (h) cycle retention tests of NiHCFe in different electrolytes.121 Copyright: 2024 American Chemical Society. (i) Illustration of hybrid poly-ether/carbonate ester electrolyte-based quasi-solid-state Li-metal batteries, (j) long-term cycling at 0.5 mA cm−2, (k) galvanostatic cycling performances of the Li||LiFePO4 cells.122 Copyright: 2022 Elsevier. | |
Moreover, to mitigate the sluggish electrochemical kinetics of organic electrolytes and structural deformation due to aqueous electrolytes, Wi et al.121 employed a hybrid electrolyte which significantly enhanced the stability of the Li insertion/extraction processes. They engineered the CEI with Prussian blue analogues (PBAs) for Li-ion batteries; here they demonstrated the in situ creation of polymeric interphase in PBAs within Li-ion systems. They employed three electrolyte variations, namely highly concentrated aqueous (HCA), highly concentrated organic (HCO), and hybrid electrolytes (HYB), as shown in Fig. 39(f), and compared the stability and redox kinetics. The organic and hybrid electrolytes facilitated polymeric CEI layer formation on the PBA surface, unlike aqueous electrolytes. The CEI layer enhanced the structural stability and prevented water and hydronium ions from penetrating the structure, thus improving the active sites and Fe activation. Fig. 39(g) demonstrates the cycle retention test at 30 mA g−1, which was significantly enhanced with the assistance of CEI on iron hexacyanoferrate (FeHCFe) in HCO (93.6% at 500th cycle) and HYB (107% at 500th cycle) electrolytes. However, Fe underwent phase transition (hybridisation of low spin and high spin) during cycling and to mitigate that, nickel hexacyanoferrate (NiHCFe) was used which displayed a high specific capacity of ∼68 mA h g−1, and maintained over 800 cycles at 65 mA g−1 as shown in Fig. 39(h). These results indicate that the CEI formation can facilitate stable Li-ion insertion/extraction.
Also, Song et al.122 used hybrid poly-ether/carbonate ester quasi-solid-state electrolytes for high oxidative stability of Li-metal batteries. They reported an in situ polymerization of ether-based 1,3-dioxolane (DOL) and ester-based ethylene carbonate (EC)-ethyl methyl carbonate (EMC) catalysed by rare-earth triflate Sc(OTf)3, and the schematic is shown in Fig. 39(i). This cell displayed much lower overpotential than the conventional cell for the first 100 cycles and was stable for 250 cycles, as shown in Fig. 39(j), demonstrating good interface comparability and more negligible polarization. Although the cell enabled a high anodic voltage limit of 5 V, it could produce a stable SEI featuring Li plating/stripping over 500 h at 0.5 mA cm−2. The derived Li||LiFePO4 QSS-LMB provided the improved oxidative stability of electrolyte and displayed a capacity of 169 mA h g−1 at 1C with no capacity decay after 300 cycles, as shown in Fig. 39(k). Li et al.118 proposed a solvation control strategy with ethoxy (pentafluoro) cyclotriphosphazene (PFPN) and NaClO4 additives for Na-ion batteries, which enabled the electrolyte to form a dense and stable SEI and CEI on the surface of the electrode material to achieve cycling stability and higher capacity. Here, ClO4− initially reached the cathode surface to create a NaCl and polymer-like chain CEI with sodium ions and solvents, and migrated to the cathode surface to open the ring and decompose, thus forming a double-layer stable CEI; a schematic is given in Fig. 40(a). Also, Fig. 40(b) shows the cycling performance of the Na symmetric battery, in which the double additive electrolyte showed low and stable voltage distribution after 1600 h due to the improved Na+ transfer kinetics. Then, as shown in Fig. 40(c), this double additive electrolyte showed higher capacity and cycling stability due to its lower polarization effect. Conversely, Li et al.123 used a gel polymer electrolyte-based Li–air battery, in which this DMSO-based gel polymer electrolyte was initiated by toluene-2,4-diisocyanate (TDI) and 1,4-benzene boronic acid (BDBA). It was designed to enable stable Li–air batteries. As illustrated in Fig. 40(d), PVA was selected as the polymer network for the gel polymer electrolyte due to its long-chain structure. Fig. 40(e) shows a significantly larger total discharge capacity (5362 mA h g−1) than the base electrolyte at 1000 mA g−1 (3504 mA h g−1). The cycling performance in Fig. 40(f) shows that gel polymer electrolyte-based cells showed outstanding cycling stability at 1000 mA g−1 and 60 °C. Similarly, Dong et al.124 investigated various fluorinated electrolytes which effectively regulated solvation structure for a wide temperature of 160 °C (−50 to 110 °C) for Li-metal batteries, as illustrated in Fig. 40(g). Moreover, Fig. 40(h) shows the cycling performances of the batteries with EC + DMC and FEC + HFB electrolytes at mutative temperatures. For the EC + DMC electrolyte, at the temperature above 75 °C, the discharge capacity quickly reduced owing to the interfacial dissolution and gas generation. Quite the reverse, the discharge capacity with the FEC + HFB electrolyte remained stable even at 125 °C. Also, it was noted that the discharge capacity recovered to ∼144 mA h g−1 when the temperature was back to 25 °C, indicating excellent reversibility of the FEC + HFB electrolyte. However, for EC + DMC, when the temperature dropped to 25 °C, it had almost no capacity. As shown in Fig. 40(i), the symmetrical Li/Li cell with the FEC + HFB electrolyte sustained stable cycling for 2047 h at 10 mA cm−2 and 60 °C. From this work, the authors claimed that this study assessed the utilisation of an all-weather electrolyte in the reversible operation of Li metal batteries at a wide temperature range. Finally, Li et al.125 proposed using super wettable electrolytes to tackle the challenge of wettability issues encountered in conventional electrolytes. Fig. 40(j and k) depicts their strategy of electrolytes with an ultralow concentration with the coverage of the graphite surface. This indicates that this strategy induced a noticeable overpotential (Fig. 40(l)), leading to the abundant formation of an SEI layer due to inorganic components (Fig. 40(m)). Thus, the stability of the SEI was confirmed. The long-term cycling stability at 0.5C with a voltage range of 0.01–1.5 VLi/Li is depicted in Fig. 40(n). It shows that the cells formed with low-concentration electrolyte exhibited excellent cycling stability compared with higher concentration electrolytes, with the capacity retentions for the 0 and 0.02 M electrolyte cells at 77.4 and 76.4%, respectively, which demonstrated that the formation of an ultralow concentration electrolyte was beneficial for achieving the high cycling stability. Fig. 40(o) shows the rate performance tests for both lithiation and de-lithiation processes, showing that all exhibited comparable specific lithiation capacities of ∼370 mA h g−1 at 0.2C.
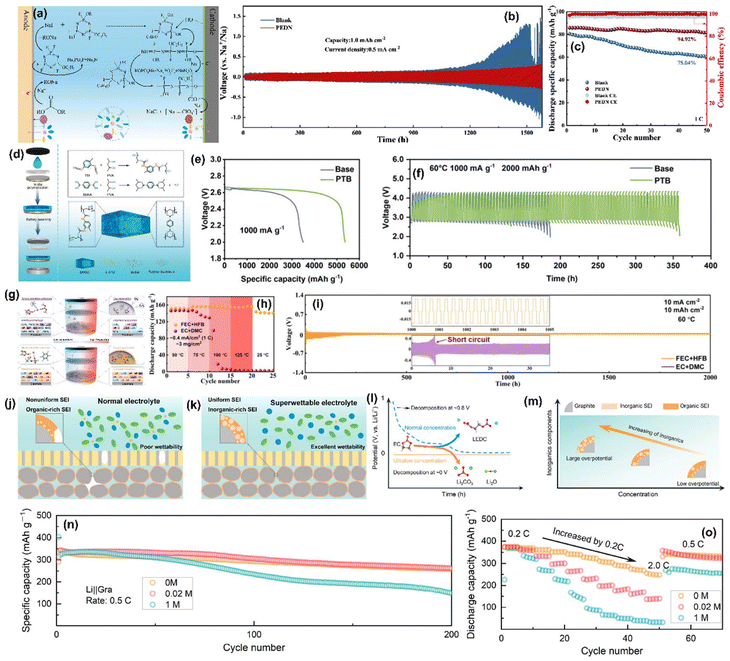 |
| | Fig. 40 (a) Reaction mechanism of SEI and CEI formed by PEDN electrolyte in NFP||HC battery, (b) cycling performance of Na||Na symmetric batteries with different electrolytes at 0.5 mA cm−2 and 1.0 mA h cm−2, (c) cycle performance of HC||Na battery in different electrolytes.118 Copyright: 2024 Elsevier. (d) Schematic illustration of the synthesis of the PTB electrolyte, (e) full discharge performance at different electrolytes, (f) cycling performance with different electrolytes.123 Copyright: 2024 Wiley. (g) Schematics with EC + DMC and FEC + HFB electrolytes at low and high temperatures. (Balls with various colors represent different atoms: red-O; light purple-P; light blue-F; magenta-Li; gray-C; white-H; yellow-S; blue-N.) (h) Cycling performances, (i) cycling performances of symmetrical Li/Li cells with EC + DMC and FEC + HFB electrolytes.124 Copyright: 2024 American Chemical Society. Illustration of the SEI formation on graphite electrode with (j) normal concentration and (k) ultralow concentration electrolytes. Schematic illustration of (l) SEI formation in the graphite anode with different discharge mode, (m) SEI formation using different concentration electrolyte, (n) cycling performance of the half cells at rates of 0.5C. (o) Rate performance of the Li||graphite half cells.125 Copyright: 2024 American Chemical Society. | |
6.5. Surface coating to enhance the charge transfer process and self-life
Surface coatings also play a crucial role in battery applications by acting as a protective passivation film that shields the electrode and electrolyte from direct contact, reducing the risk of harmful side reactions that impair performance. Coating layers should ideally have excellent ionic and electrical conductivity, and be homogeneous and thin. The coating substance ought to be conductive, thin, homogeneous, affordable, and expandable. Nowadays, the structure of surface coating is mainly one of two types, namely (i) coating the surface of the electrode with a few nanometers of a heterogeneous material, as shown in Fig. 41(a), and (ii) coating the electrode material with separate materials in different layers to form a composite structure, as shown in Fig. 41(b). Again, the surface coating can be divided into three subgroups, namely (i) rough coating, (ii) core–shell structure, and (iii) ultra-thin film coating, as illustrated in Fig. 42. The surface coating provides various advantages for battery application, such as (i) preventing the degradation of electrode material, (ii) suppressing the side reactions during high-temperature and high-voltage operations, (iii) enhancing the charge transfer between the electrode and electrolyte, (iv) providing electronic percolation pathways between the cathode material and the current collector, and (v) allowing ion diffusion and electron migration during the charge/discharge process. Overall, the surface coating will act as a physical barrier, HF scavenger, conductivity booster, charge transfer layer, structural stabilizer, etc.126–128
 |
| | Fig. 41 Schematic of the coating structure of cathode materials. (a) Single-layered coating, (b) composite coating.126 Copyright: 2020 Elsevier. | |
 |
| | Fig. 42 Schematic of three types of surface coating: rough coating, core–shell structure, and ultra-thin film.127 Copyright: 2010 Royal Society of Chemistry. | |
Several types of coating materials have been investigated for battery applications, such as metal oxides, fluorides, phosphates, and conducting polymers. Metal oxides offer physical protection, and MgO, Al2O3, ZnO, and TiO2 are commonly used materials. Fluorides are usually used as an HF scavenger in Li-ion batteries because, in Li-based batteries, the widely used electrolyte (LiPF6) will produce corrosive HF, and the reaction is given below.
This leads to the dissolution of active materials in the electrode, which reduces its capacity. Retention and this limitation can be solved by utilizing fluoride-coated material. Here, F− ions can inhibit this process and diminish the charge transfer resistance, which improves the conductivity and, therefore, improves the rate performance and cyclability of the battery. The typically used fluorides include LiF, MgF2, AlF3, CaF2, etc. Phosphates-based materials improve ion transport, particularly in nickel-rich cathodes, because the chemical bonds between PO43− and metal ions have strong covalent properties, which enhance the stability of the material. Phosphate coating material mainly involves FePO4, AlPO4, and Co3(PO4)2. Carbon-based coating material with high conductivity has a higher rate of performance. Commonly used carbon coating materials include porous carbon nanowires, graphene, and carbon nanotubes.
For example, Deng et al.129 modified the P2-type Na0.65[Mn0.70Ni0.16Co0.14]O2 (NMNCO) cathode material with NASICON-type NaTi2(PO4)3 (NTP) surface modifier for the Na-ion battery. Here, the crystal structural changes (Fig. 43(a)) and the variation of lattice parameter (c) (Fig. 43(e)) during the Na+ intercalation and deintercalation were analysed by first-principles calculation. When the content of Na+ varied from 1 to 0.33 mol, the lattice parameter (c) of NxMNCO@NTP progressively improved from 10.88 to 11.42 Å due to the formation of Na vacancies, which enhanced the electrostatic repulsion between two adjacent TMO2 layers and reduced the P2–O2 phase transition compared with pristine NxMNCO. Moreover, they studied the diffusion of Na+ using the nudged elastic band (NEB) method, and the corresponding calculated activation barrier energy values of pristine NMCNO and NMNCO@NTP materials are shown in Fig. 43(f). The activation barrier energy of NMNCO@NTP was ∼510 meV, which was much lower than the NMNCO (∼827 meV). The results indicated that incorporating NTP could facilitate the diffusion of Na+ and thus presented a better rate capability. The rate performance at various rates in the range of 1.5–4.3 V is shown in Fig. 43(b). From that, it is seen that the rate performance of NMNCO@NTP was better than pristine NMNCO, which was due to (i) NASICON-type NTP having an exceptional ion conductivity structure with an open framework of large interstitial spaces, and (ii) NTP enlarging the d-spacing of the Na+ diffusion layer, which decreased the migration barrier and enhanced the diffusion coefficient of Na+. Also, Fig. 43(c and d) represent the cycling performance at 1C and 5C. The NMNCO@NTP-3 exhibited higher capacity retention of 88.3% after 100 cycles at 1C and 5C; the NMNCO@NTP-3 still had capacity retention of 84.3%, which was higher than the pristine one, which is evidence for the improved cycling performance.
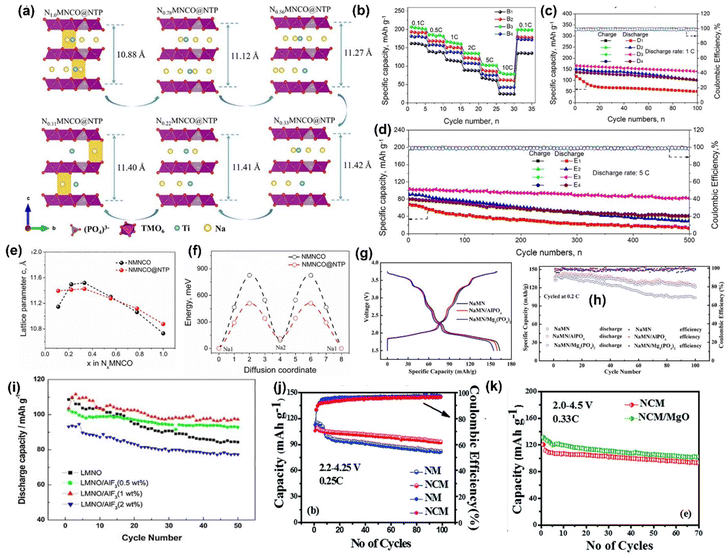 |
| | Fig. 43 Schematic diagram of structural changes (a) Na1–Na2–Na1 diffusion path, (b) rate performance, cycling performance at (c) 1C and (d) 5C of pristine NMNCO (A1, B1, D1, and E1), NMNCO@NTP-1 (A2, B2, D2, and E2), NMNCO@NTP-3 (A3, B3, D3 and E3) and NMNCO@NTP-5 (A4, B4, D4 and E4) samples, (e) variation of lattice parameter c during the extraction of Na+, (f) activation barrier energy for Na+ diffusion of pristine NMCNO and NMNCO@NTP materials.129 Copyright: 2021 Elsevier. (g) GCD between 1.5 and 3.75 V at 0.1C, (h) cycling performance at 0.2C.130 Copyright: 2019 Elsevier. (i) Cycling performances of the pristine and surface-modified LMNO electrodes.131 Copyright: 2021 Elsevier. (j) Cycling performance of NM and NCM at 0.25C in a voltage range of 2.2–4.25 VNa, (k) cycling performance of NCM and NCM/MgO.132 Copyright: 2017 Royal Society of Chemistry. | |
Wang et al.130 employed AlPO4 and Mg3(PO4)2 protective coatings to improve the cycling stability of P3-Na0.65Mn0.75Ni0.25O2 (NaMN) electrodes for Na-ion batteries. Fig. 43(g) shows the charge and discharge performances, and the NaMN, NaMN/AlPO4, and NaMN/Mg3(PO4)2 materials delivered discharge capacities of 165.0, 153.2, and 159.4 mA h g−1 at 0.1C in the voltage range of 1.5–3.75 V, respectively. Moreover, the protective coating might prevent direct contact of the electrolyte with active material. Still, the reversible capacities were reduced to some extent after metal phosphate coating due to their poor conductivity and more considerable internal resistance. As shown in Fig. 43(h), at 0.2C, the samples delivered the initial capacities of 135.4, 133.6, and 130.2 mA h g−1, respectively. The 76.4, 93.7, and 92.4% capacities were maintained after 100 cycles, respectively, and the cycle performances of the samples were significantly enhanced after metal phosphate coating. In addition, metal phosphate coating could sustain the stability of the mechanical properties of the materials during the Na+ intercalation/deintercalation. Moreover, coating metal phosphates could prevent side reactions at the EEI and increase coulombic efficiency. Wu et al.131 modified the spinel LiMn1.5Ni0.5O4 (LMNO) with AlF3 for Li-ion batteries. The AlF3-coated LMNO exhibited a capacity retention of 77.6%, in the range of 3.5–4.9 V at 0.1C after 50 cycles, as shown in Fig. 43(i), whereas the pristine LMNO suffered fast capacity fading. Ramasamy et al.132 reported a novel P2-type Na0.5Ni0.26Cu0.07Mn0.67O (NCM) encapsulated with MgO enhanced Na-ion battery. From Fig. 43(j) it is seen that NCM delivered a discharge capacity of 110 mA h g−1 at 0.25C in a voltage range of 2.2–4.25 VNa. Here, the small amount of Cu in the lattice was sufficient to smooth the plateau at higher voltages. The long-term cycling performance was analyzed and is shown in Fig. 43(k); Mgo-modified NCM showed an initial discharge capacity of 131 mA h g−1 with a superior rate performance of 83 mA h g−1.
Liu et al.133 significantly improved the cycling performance of LiNi0.6Co0.2Mn0.2O2 (NCM) cathodes by coating Al2O3 and LiAlO2 for Li-ion batteries. Here, Al2O3 could protect the surface of the electrode from direct contact with the organic electrolyte, and LiAlO2 coatings are well known as Li-ion conductors, which have greater Li+ diffusion (Fig. 44(a)), which increased the performance of LiNi0.6Co0.2Mn0.2O2 in Li-ion batteries. Fig. 44(b) shows that Al2O3 and LiAlO2 presented better rate capabilities than pristine at a high cutoff voltage of 4.7 V. The long-term stability is further compared in Fig. 44(c), and the pristine NCM showed poor cycling performance with 0.20% decay/cycle. Al2O3-coated NCM's capacity dropped to <149 mA h g−1 after 200 cycles with 0.12% decay/cycle. In contrast, LiAlO2 preserved a reversible capacity >149 mA h g−1 after 350 cycles with 0.078% decay/cycle, and these results proposed that the cycling performance of the cathode materials was enhanced due to Al2O3 and LiAlO2 coatings, which significantly improved the efficiency of Li-ion battery. In addition, Meghnani et al.134 coated Na3PO4 over the surface of NaNi0.815Co0.15Al0.035O2. Here, the Na3PO4 coating acted as a physical protective layer, which reduced the growth rate of intergranular cracks on the surface of the cathode material during cycling with higher Na+ diffusion coefficients, and the schematic is given in Fig. 44(d). From the cycling performance curves, it is known that the Na3PO4@0.5 cathode at 100 mA g−1, the first discharge capacity of ∼77.8 mA h g−1, remained almost constant up to 25 cycles; after that, there was a slight decrement in the discharge capacity (∼65.5 mA h g−1) with the capacity retention of ∼85% (Fig. 44(f)) up to 150 cycles, which is about 14% greater than that of pristine Na-NCA (only 71% capacity retention up to 120 cycles, as seen in Fig. 44(e)). The improved performance could be ascribed to the uniform thin-layer coating of Na3PO4, which protects the structural degradation during cycling.
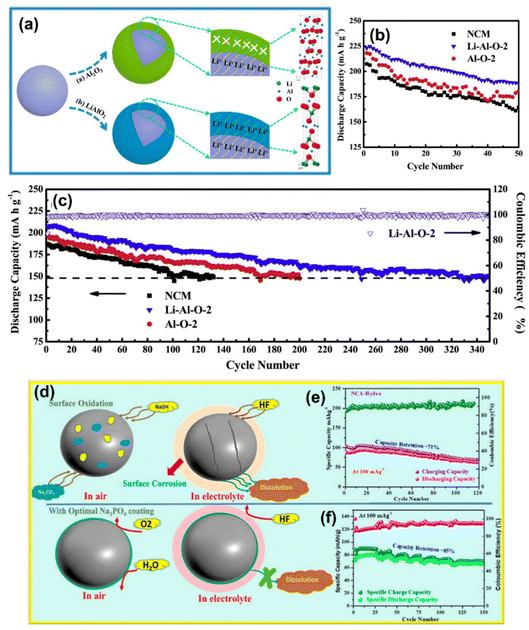 |
| | Fig. 44 (a) Schematic of coatings on NCM, (b) cycle performance of NCM, Al–O-2, and Li–Al–O-2 at 0.2C in a voltage range of 2.7–4.7 VLi/Li+, (c) comparison of cycle performance of NCM, Al–O-2, and Li–Al–O-2 with an electrochemical window of 2.7–4.5 VLi/Li+.133 Copyright: 2018 Elsevier. (d) Schematic representation of Na3PO4 protection layer regarding surface corrosion. Cycling performance of (e) pristine Na-NCA, (f) Na3PO4@0.5 cathode at 100 mA g−1 current density.134 Copyright: 2024 American Chemical Society. | |
For a PARB, Boruah et al.68 used a ZnO hole-blocking layer for VO2 as a dual-functional photocathode; the schematic is seen in Fig. 15(h). It improved capacity under illumination even at high specific current densities of 5000 mA g−1. The capacity enhancement was observed from 367 mA h g−1 to 432 mA h g−1 at 200 mA g−1, with a capacity retention of 73% after 500 cycles (Fig. 15(h)). After that, they used V2O5 nanofibers66 (Fig. 16(b)) as a dual-active material with P3HT and rGO for effective charge separation for the PARB. Also, Zhang et al.70 have proposed an aqueous Al–Mn battery with a α-MnO2 nanorod as an active photosensitizer and rGO as an electron transfer material, and Fig. 17(a) displays the schematic diagram and energy level configuration of an aqueous Al–Mn battery. Fig. 17(d) shows that in the dark condition, the discharge capacities were 376.4 and 286.0 mA h g−1 at 100 and 300 mA g−1, respectively. After 200 cycles, the discharge capacities were sustained at 205.4 mA h g−1. Fig. 17(e) displays the charging (under illumination) and discharging (with and without illumination) curves at 100 mA g−1; the longer discharge time indicates the intercalation of more Al3+. Meanwhile, charging under light and dark conditions followed by dark galvanostatic discharge cycles at different current densities was also performed, shown in Fig. 17(f), evidencing that, in dark discharge, the photocharged cell displayed a longer discharge time, which thoroughly established the advantages of the PEC process.
7. Commercial availability and challenges
Currently, the energy requirements of the world are increasing and demand is expected to grow further. The data from Allied Market Research and Emergen Research suggest that growth in energy harvesting systems will grow from $496.7 million to 1.7 billion by 2032. Along with energy harvesting systems, the energy storage market is also expected to grow in terms of utilizing stored energy. The complexities, such as the involvement of multiple electronics and transport methods, high cost, and mediocre energy efficiencies of current energy harvesting and energy storage units invite the idea that the amalgamation of the above two concepts into one system might be able to address the current issues.135,136 As explained earlier, PARBs can eliminate complex electronic and transport methods, reduce cost reduction, increase energy efficiency and widen applications, leading to cost reduction and sustainability goals.
The abridged system design leads to the elimination of the interfacing components required to couple solar cells and energy storage units, leading to simpler, compact, and lightweight PARBs. Since there are a lot of coupling electronics and materials for energy harvesting and storage, the PARBs require few materials, and streamlining the production process leads to cost reduction. The elimination of coupling electronics and transport of charges to batteries minimizes the energy loss during the transport, resulting in energy efficiency. Finally, PARBs could work as independent energy harvesting and storage systems; they could be implemented in remote, off-grid, and standalone systems. Presently, there are no PARB units available in the market; however, practical applications include areas such as facades, wearable electronics, Internet of Things (IoT) devices, and standalone energy systems in off-grid applications. Overall, the PARBs take economical or efficiency advantages over conventional solar cells and rechargeable battery systems. PARBs represent the advanced idea of integrating the functionalities of the solar cell and energy storage systems into a single unit. The amalgamation of these two concepts offers several advantages, such as abridged system design, cost reduction, energy efficiency, and wide applications.
8. Summary, perspective and future outlook
This review provides an overview of the progress in PARBs, covering their working mechanisms, configurations, designs, recent advancements, and the development of photocathodes. PARBs hold great potential for various electronics, from portable devices to electric vehicles. However, their development is still in its early stages, and further efforts are needed to enhance their durability, energy efficiency, and cost-effectiveness. One of the critical challenges is selecting the right combination of materials and designing them for optimal performance. In this review, we explore monovalent and multivalent metal-ion-based PARBs and modification strategies to improve their performance. Despite recent advancements, several issues and challenges remain. First, there is a need for standardized experimental parameters to allow for a better comparison among the reported literature. For instance, variations in light intensity and wavelength in different studies make it difficult to compare results. The concentration of electrolytes can also significantly affect energy storage performance and stability; therefore, standardizing electrolyte concentrations is critical for accurate comparisons. Additionally, more precise distinctions between photoelectric and photothermal effects in materials are necessary, and the working mechanisms should be more thoroughly explained. The movement of energy bands during charge–discharge cycles requires more profound analysis, and more experimental evidence, such as ex situ and in situ studies, is needed to clarify the working mechanism. Techniques like in situ transmission electron microscopy and in situ Raman spectroscopy can offer direct insights into structural changes during photoassisted charging and discharging. To validate experimental findings, theoretical studies should be more prominent in future research. Tools such as DFT calculations can effectively model band alignment changes, adsorption, and mass transfer during redox reactions. Finally, to achieve higher performance and bring PARBs closer to practical use, the focus must be on addressing key challenges, including stability, efficient light absorption, electron transport, electrolyte selection, and cost management.
1. Stability: Photocathodes are typically composed of multiple materials, with one acting as the active material for charge storage and light absorption and another as a charge transfer medium. During the charge storage process, changes in these materials’ conduction and valence band positions can negatively impact electron–hole separation efficiency. Therefore, the photocathode must withstand repeated charge–discharge cycles without significant loss of light absorption efficiency.
2. Efficient light absorption: Selecting an appropriate active material is complex, as it must exhibit excellent charge storage capabilities and a low optical band gap. Expanding the absorption range of solar light can enhance the overall efficiency of PARBs.
3. Electron transport: Achieving high PCE requires more than just effective light absorption. After generating electron–hole pairs through light absorption, efficient separation and transport of these charges is crucial. The photoactive material and the hole-blocking layer must work together to transport photogenerated electrons to maximise battery performance efficiently.
4. Electrolyte selection: A good PARB requires more than efficient photoconversion and rapid electron transfer. Achieving good charge storage and stability heavily depends on the electrolyte. Its ionic conductivity plays a significant role in enhancing energy storage and the overall stability of the PARB.
5. Cost management: Achieving strong performance in PARBs is not enough; for practical applications, cost becomes a key factor. Materials and processing expenses must be carefully considered when designing the PARBs.
In addition, there are several flaws present in the current approach and design of PARBs, which need to be addressed and improved. Hence, we have given some suggestions to aid in the future development of PARBs. (i) Currently, researchers achieve photoactivity in PARBs by either physically mixing photoactive materials with the hole-blocking layer or by creating heterojunctions through separate thin-film depositions. Although both methods yield photoactivity, it is essential to explore the fundamental differences between these two approaches for a deeper understanding of PARB functionality. (ii) The current PARB design consists of a small hole to allow light to reach the photoactive material, resulting in limited exposure of the light that affects the performance of the PARBs. Hence, a new design strategy must enhance the light exposure to the photoactive material. For instance, a double cathode strategy can be considered137,138 to get more light exposure, along with the use of transparent conducting electrodes (ITO, FTO, etc.) that can be implemented instated of a carbon-based current collector in coin cell configuration, to get better light exposure to the photoactive material. (iii) The PARBs are exposed to light for an extended duration of time, and resulting heat may elevate the temperature of the device, which can cause material degradation or hinder the electron–hole separation to reduce the efficiency of the device performance. A detailed study should be done to understand the photothermal contribution to the performance of the PARBs. (iv) The development of PARBs may significantly change energy storage technology in the future; however, their reliance on sunlight presents a limitation. To address this issue, along with the photoactive material, researchers could explore a catalytic perspective to generate and store the energy. In the absence of light, the catalytic active material should perform and improve the PARB's performance.
In conclusion, PARBs have the potential to meet the demand for eco-friendly, energy-efficient storage systems by utilizing renewable solar energy, thereby addressing global warming concerns. These batteries could replace traditional solar energy harvesting and storage devices, with applications ranging from wearable electronics to solar-powered vehicles. To make this vision a reality, it is essential to address the current challenges through a multidisciplinary approach, drawing expertise from materials science, semiconductor physics, photochemistry, and electronics. Ongoing efforts are focused on developing photoassisted energy storage systems, and these batteries have the potential to revolutionize future energy storage by replacing conventional systems.
Data availability
The submitted manuscript is a review article. All the data included in the manuscript has been either cited from existing sources or written by the authors themselves.
Conflicts of interest
There are no conflicts to declare.
Acknowledgements
The authors are grateful to Professor G. U. Kulkarni for his encouragement and discussions. The authors acknowledge the financial support from the Indo-French Centre for the Promotion of Advanced Research (IFCPAR-Grant no.: 70T10-4). A. S. M. acknowledges IFCPAR for fellowship. M. K. G. acknowledges CeNS and the DST, Government of India for fellowship. R. R. and G. M acknowledge CSIR (Grant no. 09/1243(0005)/2021-EMR-I), and CSIR (Grant no. 09/1243(15788)/2022-EMR-I), respectively, for their fellowship.
References
- L. Song, Y. Fan, H. Fan, X. Yang, K. Yan, X. Wang and L. Ma, Nano Energy, 2024, 125, 109538 CrossRef.
- W. Bao, H. Shen, R. Wang, C. Qian, D. Cui, J. Xia, H. Liu, C. Guo, F. Yu, J. Li and K. Sun, J. Mater. Chem. A, 2023, 11, 18605–18625 RSC.
- G. Hodes, J. Manassen and D. Cahen, Nature, 1976, 261, 403–404 CrossRef.
- X. Zou, N. Maesako, T. Nomiyama, Y. Horie and T. Miyazaki, Sol. Energy Mater. Sol. Cells, 2000, 62, 133–142 CrossRef.
- A. Hauch, A. Georg, U. O. Krašovec and B. Orel, J. Electrochem. Soc., 2002, 149, A1208 CrossRef CAS.
- R. Thimmappa, B. Paswan, P. Gaikwad, M. C. Devendrachari, H. Makri Nimbegondi Kotresh, R. Rani Mohan, J. Pattayil Alias and M. O. Thotiyl, J. Phys. Chem. C, 2015, 119, 14010–14016 CrossRef CAS.
- A. Paolella, C. Faure, G. Bertoni, S. Marras, A. Guerfi, A. Darwiche, P. Hovington, B. Commarieu, Z. Wang, M. Prato, M. Colombo, S. Monaco, W. Zhu, Z. Feng, A. Vijh, C. George, G. P. Demopoulos, M. Armand and K. Zaghib, Nat. Commun., 2017, 8, 14643 CrossRef CAS PubMed.
- Y. Man, Q. Hao, F. Chen, X. Chen, Y. Wang, T. Liu, F. Liu and N. Li, ChemElectroChem, 2019, 6, 5872–5875 CrossRef CAS.
- Z. Li, M.-L. Li, X.-X. Wang, D.-H. Guan, W.-Q. Liu and J.-J. Xu, J. Mater. Chem. A, 2020, 8, 14799–14806 RSC.
- B. Deka Boruah, A. Mathieson, S. K. Park, X. Zhang, B. Wen, L. Tan, A. Boies and M. De Volder, Adv. Energy Mater., 2021, 11, 2100115 CrossRef CAS.
- X. Hou, Y. Zhang, C. Cui, C. Lin, Y. Li, D. Bu, G. Yan, D. Liu, Q. Wu and X.-M. Song, J. Power Sources, 2022, 533, 231377 CrossRef CAS.
- H. Liu, P. Wu, R. Wang, H. Meng, Y. Zhang, W. Bao and J. Li, ACS Nano, 2023, 17, 1560–1569 CrossRef CAS PubMed.
- X. Wang, J. Li, C. Liu, Y. Lin, F. Yang, L. Zhong, Y. Zhang and D. Yu, Adv. Funct. Mater., 2024, 34, 2312729 CrossRef CAS.
- Z. Yuan, H. Mao, D. Yu and X. Chen, Chem. – Eur. J., 2023, 29, e202202920 CrossRef CAS PubMed.
- X. Yu, G. Liu, T. Wang, H. Gong, H. Qu, X. Meng, J. He and J. Ye, Chem. – Eur. J., 2022, 28, e202202104 CrossRef.
- P. Zhang, M. Cai, Y. Wei, J. Zhang, K. Li, S. R. P. Silva, G. Shao and P. Zhang, Adv. Sci., 2024, 11, 2402448 CrossRef.
- M. Yang, D. Wang, Y. Ling, X. Guo and W. Chen, Adv. Funct. Mater., 2024, 2410398 CrossRef.
- N. Yan and X. Gao, Energy Environ. Mater., 2022, 5, 439–451 CrossRef.
- Y. X. Tan, X. Zhang, J. Lin and Y. Wang, Energy Environ. Sci., 2023, 16, 2432–2447 RSC.
- C. Deng, X. Li, R. Chen, K. Ye, J. Lipton, S. A. Maclean, H. Wang, A. D. Taylor and G. M. Weng, Energy Storage Mater., 2023, 60, 102820 CrossRef.
- X. Shi, G. Li, R. Zhang, O. C. Esan, X. Huo, Q. Wu and L. An, Renewable Sustainable Energy Rev., 2024, 189, 113861 CrossRef.
- W. Waag, C. Fleischer and D. U. Sauer, J. Power Sources, 2014, 258, 321–339 CrossRef.
- Z. Liu, Y. Huang, Y. Huang, Q. Yang, X. Li, Z. Huang and C. Zhi, Chem. Soc. Rev., 2020, 49, 180–232 RSC.
- J. K. Yadav, B. Rani, P. Saini and A. Dixit, Energy Adv., 2024, 3, 927–944 RSC.
- J. Li, H. Liu, K. Sun, R. Wang, C. Qian, F. Yu, L. Zhang and W. Bao, J. Mater. Chem. A, 2022, 10, 7326–7332 RSC.
- F. M. N. U. Khan, M. G. Rasul, A. S. M. Sayem and N. Mandal, Energy Rep., 2023, 9, 11–21 CrossRef.
- P. V. Braun, J. Cho, J. H. Pikul, W. P. King and H. Zhang, Curr. Opin. Solid State Mater. Sci., 2012, 16, 186–198 CrossRef CAS.
- F. Wang, E. Hu, W. Sun, T. Gao, X. Ji, X. Fan, F. Han, X.-Q. Yang, K. Xu and C. Wang, Energy Environ. Sci., 2018, 11, 3168–3175 RSC.
- O. K. Varghese and C. A. Grimes, Sol. Energy Mater. Sol. Cells, 2008, 92, 374–384 CrossRef CAS.
- B. D. Boruah, B. Wen and M. De Volder, Nano Lett., 2021, 21, 3527–3532 CrossRef CAS.
- J. P. Pender, G. Jha, D. H. Youn, J. M. Ziegler, I. Andoni, E. J. Choi, A. Heller, B. S. Dunn, P. S. Weiss, R. M. Penner and C. B. Mullins, ACS Nano, 2020, 14, 1243–1295 CrossRef CAS.
- J. S. Edge, S. O'Kane, R. Prosser, N. D. Kirkaldy, A. N. Patel, A. Hales, A. Ghosh, W. Ai, J. Chen, J. Yang, S. Li, M.-C. Pang, L. Bravo Diaz, A. Tomaszewska, M. W. Marzook, K. N. Radhakrishnan, H. Wang, Y. Patel, B. Wu and G. J. Offer, Phys. Chem. Chem. Phys., 2021, 23, 8200–8221 RSC.
- C.-Y. Hsu, Y. Ajaj, G. K. Ghadir, H. M. Al-Tmimi, Z. K. Alani, A. A. Almulla, M. A. Hussein, A. R. Al-Tameemi, Z. H. Mahmoud, M. Ahmed mustafa, F. Kianfar, S. Habibzadeh and E. Kianfar, e-Prime - Adv. Electr. Eng. Electron. Energy, 2024, 8, 100510 CrossRef.
- A. D. Salunke, S. Chamola, A. Mathieson, B. D. Boruah, M. de Volder and S. Ahmad, ACS Appl. Energy Mater., 2022, 5, 7891–7912 CrossRef CAS.
- J. M. Tarascon and D. Guyomard, Electrochim. Acta, 1993, 38, 1221–1231 CrossRef CAS.
- T. Nomiyama, H. Kuriyaki and K. Hirakawa, Synth. Met., 1995, 71, 2237–2238 CrossRef CAS.
- A. Lee, M. Vörös, W. M. Dose, J. Niklas, O. Poluektov, R. D. Schaller, H. Iddir, V. A. Maroni, E. Lee, B. Ingram, L. A. Curtiss and C. S. Johnson, Nat. Commun., 2019, 10, 4946 CrossRef PubMed.
- J. Wang, Y. Wang, C. Zhu and B. Liu, ACS Appl. Mater. Interfaces, 2022, 14, 4071–4078 CrossRef CAS PubMed.
- E. M. Roginskii, M. B. Smirnov, K. S. Smirnov, R. Baddour-Hadjean, J.-P. Pereira-Ramos, A. N. Smirnov and V. Y. Davydov, J. Phys. Chem. C, 2021, 125, 5848–5858 CrossRef.
- H. Y. Xu, H. Wang, Z. Q. Song, Y. W. Wang, Y. C. Zhang and H. Yan, Chem. Lett., 2003, 32, 444–445 CrossRef.
- A. Bayaguud, Z. Zhang, M. Geng, Y. Fu, Y. Yu and C. Zhu, Small Methods, 2019, 3, 1–9 CrossRef.
- Q. Li, N. Li, M. Ishida and H. Zhou, J. Mater. Chem. A, 2015, 3, 20903–20907 RSC.
- G. Nikiforidis, K. Tajima and H. R. Byon, ACS Energy Lett., 2016, 1, 806–813 CrossRef.
- A. Kumar, P. Thakur, R. Sharma, A. B. Puthirath, P. M. Ajayan and T. N. Narayanan, Small, 2021, 17, 2105029 CrossRef PubMed.
- W. Guo, X. Xue, S. Wang, C. Lin and Z. L. Wang, Nano Lett., 2012, 12, 2520–2523 CrossRef PubMed.
- C. Jia, F. Zhang, N. Zhang, Q. Li, X. He, J. Sun, R. Jiang, Z. Lei and Z.-H. Liu, ACS Nano, 2023, 17, 1713–1722 CrossRef PubMed.
- Y. Qu, X. He, J. Hu, L. Duan, J. Wang, S. Liao and F. Lu, J. Power Sources, 2023, 555, 232374 CrossRef.
- P. Chen, G. Li, T. Li and X. Gao, Adv. Sci., 2019, 6, 1900620 CrossRef.
- J. Li, C. Ren, L. Zhang, W. Jiang, H. Liu, J. Su and M. Li, J. Energy Chem., 2022, 65, 205–209 CrossRef.
- H. Andersen, Y. Lu, J. Borowiec, I. P. Parkin, M. De Volder and B. Deka Boruah, Nanoscale, 2023, 15, 4000–4005 RSC.
- C. Ren, Q. Zhou, W. Jiang, J. Li, C. Guo, L. Zhang and J. Su, Int. J. Energy Res., 2020, 44, 6015–6022 CrossRef.
- W. I. Al Sadat and L. A. Archer, Sci. Adv., 2016, 2, 1–11 Search PubMed.
- K. Takechi, T. Shiga and T. Asaoka, Chem. Commun., 2011, 47, 3463 RSC.
- X. Zhang, C. Fu, J. Li, C. Yao, T. Lu and L. Pan, Ceram. Int., 2017, 43, 3769–3773 CrossRef.
- Y.-Y. Gui, F.-X. Ai, J.-F. Qian, Y.-L. Cao, G.-R. Li, X.-P. Gao and H.-X. Yang, J. Mater. Chem. A, 2018, 6, 10627–10631 RSC.
- Z. Tian, C. Li, J. Cai, L. Zhang, C. Lu, Y. Song, T. Jiang, J. Sun and S. Dou, Chem. Commun., 2019, 55, 1291–1294 RSC.
- S. N. Lou, N. Sharma, D. Goonetilleke, W. H. Saputera, T. M. Leoni, P. Brockbank, S. Lim, D. Wang, J. Scott, R. Amal and Y. H. Ng, Adv. Energy Mater., 2017, 7, 1–11 Search PubMed.
- Q. Li, N. Li, Y. Liu, Y. Wang and H. Zhou, Adv. Energy Mater., 2016, 6, 1–6 Search PubMed.
- Z. Wang, H.-C. Chiu, A. Paolella, R. Gauvin, K. Zaghib and G. P. Demopoulos, Sustainable Energy Fuels, 2020, 4, 4789–4799 RSC.
- N. C. Saha and H. G. Tompkins, J. Appl. Phys., 1992, 72, 3072–3079 CrossRef.
- R. Kumar, R. Singh and S. Dutta, Energy Fuels, 2024, 38, 2601–2629 CrossRef.
- M. A. Marwat, M. Humayun, M. W. Afridi, H. Zhang, M. R. Abdul Karim, M. Ashtar, M. Usman, S. Waqar, H. Ullah, C. Wang and W. Luo, ACS Appl. Energy Mater., 2021, 4, 12007–12031 CrossRef.
- B. Lei, G. R. Li, P. Chen and X. P. Gao, Nano Energy, 2017, 38, 257–262 CrossRef.
- S. N. Lou, Y. H. Ng, C. Ng, J. Scott and R. Amal, ChemSusChem, 2014, 7, 1934–1941 CrossRef.
- G. Fang, J. Zhou, A. Pan and S. Liang, ACS Energy Lett., 2018, 3, 2480–2501 CrossRef.
- B. D. Boruah, A. Mathieson, B. Wen, S. Feldmann, W. M. Dose and M. De Volder, Energy Environ. Sci., 2020, 13, 2414–2421 RSC.
- B. D. Boruah, B. Wen and M. De Volder, ACS Nano, 2021, 15, 16616–16624 CrossRef PubMed.
- B. D. Boruah and M. De Volder, J. Mater. Chem. A, 2021, 9, 23199–23205 RSC.
- Y. Hu, Y. Bai, B. Luo, S. Wang, H. Hu, P. Chen, M. Lyu, J. Shapter, A. Rowan and L. Wang, Adv. Energy Mater., 2019, 1900872 CrossRef.
- X. Zhang, W.-L. Song, M. Wang, J. Tu, H. Jiao and S. Jiao, Energy Storage Mater., 2022, 45, 586–594 CrossRef.
- J. Wang, C. Hua, X. Dong, Y. Wang and N. Zheng, Sustainable Energy Fuels, 2020, 4, 1855–1862 RSC.
- Z. Wu, Q. Liu, P. Yang, H. Chen, Q. Zhang, S. Li, Y. Tang and S. Zhang, Electrochem. Energy Rev., 2022, 5, 26 CrossRef.
- A. A. AbdelHamid, A. Mendoza-Garcia and J. Y. Ying, Nano Energy, 2022, 93, 106860 CrossRef.
- A. Kausar and I. Ahmad, Next Mater., 2024, 2, 100131 CrossRef.
- X. Zhang, K. Su, A. G. A. Mohamed, C. Liu, Q. Sun, D. Yuan, Y. Wang, W. Xue and Y. Wang, Energy Environ. Sci., 2022, 15, 780–785 RSC.
- L. Wang, S. Yue, Q. Zhang, Y. Zhang, Y. R. Li, C. S. Lewis, K. J. Takeuchi, A. C. Marschilok, E. S. Takeuchi and S. S. Wong, ACS Energy Lett., 2017, 2, 1465–1478 CrossRef.
- W. Tu, W. Guo, J. Hu, H. He, H. Li, Z. Li, W. Luo, Y. Zhou and Z. Zou, Mater. Today, 2020, 33, 75–86 CrossRef.
- G. Liu, H. G. Yang, J. Pan, Y. Q. Yang, G. Q. M. Lu and H.-M. Cheng, Chem. Rev., 2014, 114, 9559–9612 CrossRef PubMed.
- Z. Wang, Y. Zhang, T. Xia, J. Murowchick, G. Liu and X. Chen, Energy Technol., 2014, 2, 376–382 CrossRef.
- A. Bokare and F. Erogbogbo, J, 2021, 4, 500–530 Search PubMed.
- X.-L. Cheng, M. Hu, R. Huang and J.-S. Jiang, ACS Appl. Mater. Interfaces, 2014, 6, 19176–19183 CrossRef.
- C. Yang, X. Peng, J. Yu, S. Li and H. Zhang, J. Colloid Interface Sci., 2023, 629, 1061–1067 CrossRef PubMed.
- M. Wang, J. Chen, Z. Tian, W. Dai, B. Cui, X. Cui, D. Wang, Y. Xiao, X. Lian, C. Jiang, H. Yang, Y. Wang, Z. Sun, Y. Ding, Y. Sun, J. Zhang and W. Chen, Energy Environ. Sci., 2023, 16, 523–534 RSC.
- Y. Zhang, C. Cheng, Z. Zhou, R. Long and W.-H. Fang, J. Phys. Chem. Lett., 2023, 14, 9096–9102 CrossRef PubMed.
- H. L. Tan, X. Wen, R. Amal and Y. H. Ng, J. Phys. Chem. Lett., 2016, 7, 1400–1405 CrossRef.
- N. Zhang, C. Gao and Y. Xiong, J. Energy Chem., 2019, 37, 43–57 CrossRef.
- W. Ding, S. Yuan, Y. Yang, X. Li and M. Luo, J. Mater. Chem. A, 2023, 11, 23653–23682 RSC.
- Y. Zhang, L. Tao, C. Xie, D. Wang, Y. Zou, R. Chen, Y. Wang, C. Jia and S. Wang, Adv. Mater., 2020, 32, 1–22 Search PubMed.
- J. Mi, L. Chen, J. Ma, K. Yang, T. Hou, M. Liu, W. Lv and Y. He, Small Methods, 2024, 8, 2301162 CrossRef.
- S. Bai, N. Zhang, C. Gao and Y. Xiong, Nano Energy, 2018, 53, 296–336 CrossRef.
- B. Wang, J. Liu, S. Yao, F. Liu, Y. Li, J. He, Z. Lin, F. Huang, C. Liu and M. Wang, J. Mater. Chem. A, 2021, 9, 17143–17172 RSC.
- H. F. Haneef, A. M. Zeidell and O. D. Jurchescu, J. Mater. Chem. C, 2020, 8, 759–787 RSC.
- Y. Shirakawa and H. Kukimoto, Solid State Commun., 1980, 34, 359–361 CrossRef.
- Q. Li, T. Liu, X. Xu, R. Guo, X. Jiao, X. Wang and Y. Lu, J. Phys. Chem. Solids, 2020, 145, 109542 CrossRef.
- Y. Pan, E. Yu, D. Wang and H. Deng, J. Alloys Compd., 2021, 858, 157662 CrossRef CAS.
- G. Sun, D. Yang, Z. Zhang, Y. Wang, W. Lu and M. Feng, J. Adv. Ceram., 2023, 12, 747–759 CrossRef.
- F. Li, M. Li, H. Wang, X. Wang, L. Zheng, D. Guan, L. Chang, J. Xu and Y. Wang, Adv. Mater., 2022, 34, 2107826 CrossRef PubMed.
- X. Li, J. Yu, J. Low, Y. Fang, J. Xiao and X. Chen, J. Mater. Chem. A, 2015, 3, 2485–2534 RSC.
- M. Gao, L. Zhu, C. K. Peh and G. W. Ho, Energy Environ. Sci., 2019, 12, 841–864 RSC.
- A. Nulu, V. Nulu and K. Y. Sohn, J. Alloys Compd., 2022, 911, 164976 CrossRef.
- H. H. Sun, U.-H. Kim, J.-H. Park, S.-W. Park, D.-H. Seo, A. Heller, C. B. Mullins, C. S. Yoon and Y.-K. Sun, Nat. Commun., 2021, 12, 6552 CrossRef.
- R. Cao, Y. Cui, G. Huang, W. Liu, J. Liu and X. Zhang, Nano Res., 2023, 16, 8405–8410 CrossRef.
- C. A. F. Nason and Y. Xu, eScience, 2024, 4, 100183 CrossRef.
- S. Zhao, T. Chen, H. Li, Y. Liu, M. Huang, C. Xu, Y. Cui, G. Li, J. Lian and Y. Wang, Chem. Eng. J., 2023, 472, 145115 CrossRef.
- X. Xu, X.-L. Li, M. M. Rahman, J. Bao, R.-J. Luo, C. Ma, C.-Y. Du, J. Zeng, Z. Mei, Z. Qian, E. Hu and Y.-N. Zhou, Chem. Eng. J., 2023, 477, 147021 CrossRef.
- H. Fang, H. Ji, J. Zhai, C. Wang, C. Zhu, G. Chen, M. Chu, T. Zhang, Z. Ma, W. Zhao, W. Ji and Y. Xiao, Small, 2023, 19, 1–12 Search PubMed.
- K. Afroz, M. Moniruddin, N. Bakranov, S. Kudaibergenov and N. Nuraje, J. Mater. Chem. A, 2018, 6, 21696–21718 RSC.
- E. Kusmierek, Catalysts, 2020, 10, 439 CrossRef CAS.
- Y. Zhong, C. Peng, Z. He, D. Chen, H. Jia, J. Zhang, H. Ding and X. Wu, Catal. Sci. Technol., 2021, 11, 27–42 RSC.
- Y. Zhu, Y. Wei, P. Li, S. Liu, J. Zhang, L. Tian, P. Gao, Y. Zhang, J. Li, D. Wang, Y. Shen and M. Wang, J. Mater. Chem. A, 2024, 12, 5133–5144 RSC.
- X. Liu, S. Tao, J. Zhang, Y. Zhu, R. Ma and J. Lu, J. Mater. Chem. A, 2021, 9, 26061–26068 RSC.
- W. Yang, J. Zhao, Z. Li, J. Xin, F. Li and Y. Wang, J. Alloys Compd., 2023, 967, 171576 CrossRef.
- L. Zhou, Z. Cao, W. Wahyudi, J. Zhang, J.-Y. Hwang, Y. Cheng, L. Wang, L. Cavallo, T. Anthopoulos, Y.-K. Sun, H. N. Alshareef and J. Ming, ACS Energy Lett., 2020, 5, 766–776 CrossRef.
- L. He, C. Lin, P. Xiong, H. Lin, W. Lai, J. Zhang, F. Xiao, L. Xiao, Q. Qian, Q. Chen and L. Zeng, Trans. Tianjin Univ., 2023, 29, 321–346 CrossRef.
- Y. Yin and X. Dong, Interdiscip. Mater., 2023, 2, 569–588 Search PubMed.
- C. Zhai, D. Zhao, Y. He, H. Huang, B. Chen, X. Wang and Z. Guo, Batteries, 2022, 8, 153 CrossRef.
- Y. Lu, L. Li, Q. Zhang, Z. Niu and J. Chen, Joule, 2018, 2, 1747–1770 CrossRef.
- E. Li, X. Tang, J. Zhou, H. Zhao, J. Teng, J. Huang, B. Dai, T. Lu, Q. Tao, K. Zhang, W. Deng and J. Li, Chem. Eng. J., 2024, 489, 151525 CrossRef.
- X. Zhang, L. Zhang, X. Jia, W. Song and Y. Liu, Nano-Micro Lett., 2024, 16, 75 CrossRef.
- P. P. Puthiyaveetil, A. Torris, S. Dilwale, F. Kanheerampockil and S. Kurungot, Small, 2024, 2403158, 1–20 Search PubMed.
- T.-U. Wi, C. Park, S. Ko, T. Kim, A. Choi, V. Muralidharan, M. Choi and H.-W. Lee, Nano Lett., 2024, 24, 7783–7791 CrossRef.
- S. Song, W. Gao, G. Yang, Y. Zhai, J. Yao, L. Lin, W. Tang, N. Hu and L. Lu, Mater. Today Energy, 2022, 23, 100893 CrossRef.
- Z. Li, Y. Liang, J. Wang, J. Yan, J. Liu, G. Huang, T. Liu and X. Zhang, Adv. Energy Mater., 2024, 14, 1–8 Search PubMed.
- L. Dong, D. Luo, B. Zhang, Y. Li, T. Yang, Z. Lei, X. Zhang, Y. Liu, C. Yang and Z. Chen, ACS Nano, 2024, 18, 18729–18742 CrossRef PubMed.
- C. Li, Z. Liang, L. Wang, D. Cao, Y.-C. Yin, D. Zuo, J. Chang, J. Wang, K. Liu, X. Li, G. Luo, Y. Deng and J. Wan, ACS Energy Lett., 2024, 9, 1295–1304 CrossRef.
- P. Guan, L. Zhou, Z. Yu, Y. Sun, Y. Liu, F. Wu, Y. Jiang and D. Chu, J. Energy Chem., 2020, 43, 220–235 CrossRef.
- Z. Chen, Y. Qin, K. Amine and Y.-K. Sun, J. Mater. Chem., 2010, 20, 7606 RSC.
- U. Nisar, N. Muralidharan, R. Essehli, R. Amin and I. Belharouak, Energy Storage Mater., 2021, 38, 309–328 CrossRef.
- Q. Deng, F. Zheng, W. Zhong, Q. Pan, Y. Liu and Y. Li, Chem. Eng. J., 2021, 404, 126446 CrossRef.
- Y. Wang, K. Tang, X. Li, R. Yu, X. Zhang, Y. Huang, G. Chen, S. Jamil, S. Cao, X. Xie, Z. Luo and X. Wang, Chem. Eng. J., 2019, 372, 1066–1076 CrossRef.
- Q. Wu, Y. Yin, S. Sun, X. Zhang, N. Wan and Y. Bai, Electrochim. Acta, 2015, 158, 73–80 CrossRef.
- H. V. Ramasamy, K. Kaliyappan, R. Thangavel, V. Aravindan, K. Kang, D. U. Kim, Y. Park, X. Sun and Y.-S. Lee, J. Mater. Chem. A, 2017, 5, 8408–8415 RSC.
- W. Liu, X. Li, D. Xiong, Y. Hao, J. Li, H. Kou, B. Yan, D. Li, S. Lu, A. Koo, K. Adair and X. Sun, Nano Energy, 2018, 44, 111–120 CrossRef.
- D. Meghnani, N. Srivastava, R. K. Tiwari, R. Mishra, A. Patel, A. Tiwari, Samriddhi, S. P. Singh, V. Yadav and R. K. Singh, Energy Fuels, 2024, 38, 694–706 CrossRef.
- Energy Harvesting System Market Analysis - 2030 | Growth Statistics (allied market research).
- Energy Harvesting System Market Size, Share, Industry Forecast by 2032 (emergen research).
- R. Roy, M. K. Ganesha, P. Dutta, D. Pal and A. K. Singh, ACS Appl. Energy Mater., 2023, 6, 11683–11693 CrossRef.
- R. Roy, G. Mahendra and A. K. Singh, Chem. Eng. J., 2024, 500, 156870 CrossRef.
Footnote |
| † Equally contributed to this work. |
|
| This journal is © The Royal Society of Chemistry 2025 |
Click here to see how this site uses Cookies. View our privacy policy here.  Open Access Article
 a,
Ganesh
Mahendra†
 ab,
Rahuldeb
Roy†
 ac,
Mukhesh K.
Ganesha†
 ac and
Ashutosh K.
Singh
 *abc
*abc


![[double bond, length as m-dash]](https://www.rsc.org/images/entities/char_e001.gif) O groups in POC with an energy gap of 2.17 eV, which matched well with the experimental result. For C60@POC, the HOMO density was transported to the tip units at POC, while the LUMO density was positioned on one of the entrapped C60, signifying a decrease in the band gap. The results also proposed radical ion pair C60@POC+ formation upon photoexcitation to facilitate the charge carrier's separation. Then, the separated photogenerated electrons and holes participated in Li+ storage, which enhanced the performance of the PARBs. The discharge/charge performances under illumination are shown in Fig. 20(e). Here it is noted that the discharge of C60@POC was increased by 0.47 V and the charge was decreased by 0.41 V, which corresponds to an extra 24.2% of round-trip efficiency, much higher than that of POC (5.6%). As shown in Fig. 20(f), the discharge voltage of C60@POC was maintained at 1.81 V at 3 mA cm−2, with the corresponding output powers of C60@POC in dark/light conditions at 3 mA cm−2 being ca. 3.06 and 5.55 mW cm−2 (Fig. 20(g)), indicating an 81.4% increase in output power under illumination. Concerning the charging process, the charging voltages at each current density of the photoassisted C60@POC electrode were at 3 mA cm−2 as seen in Fig. 20(h), with a 13.2% saving of the input power, as seen in Fig. 20(i). Fig. 20(j–k) shows that the dual-functional C60@POC enabled an extended lifetime of the photogenerated charge carriers, resulting in enhanced power density, round-trip efficiency, and solar energy storage efficiency.
O groups in POC with an energy gap of 2.17 eV, which matched well with the experimental result. For C60@POC, the HOMO density was transported to the tip units at POC, while the LUMO density was positioned on one of the entrapped C60, signifying a decrease in the band gap. The results also proposed radical ion pair C60@POC+ formation upon photoexcitation to facilitate the charge carrier's separation. Then, the separated photogenerated electrons and holes participated in Li+ storage, which enhanced the performance of the PARBs. The discharge/charge performances under illumination are shown in Fig. 20(e). Here it is noted that the discharge of C60@POC was increased by 0.47 V and the charge was decreased by 0.41 V, which corresponds to an extra 24.2% of round-trip efficiency, much higher than that of POC (5.6%). As shown in Fig. 20(f), the discharge voltage of C60@POC was maintained at 1.81 V at 3 mA cm−2, with the corresponding output powers of C60@POC in dark/light conditions at 3 mA cm−2 being ca. 3.06 and 5.55 mW cm−2 (Fig. 20(g)), indicating an 81.4% increase in output power under illumination. Concerning the charging process, the charging voltages at each current density of the photoassisted C60@POC electrode were at 3 mA cm−2 as seen in Fig. 20(h), with a 13.2% saving of the input power, as seen in Fig. 20(i). Fig. 20(j–k) shows that the dual-functional C60@POC enabled an extended lifetime of the photogenerated charge carriers, resulting in enhanced power density, round-trip efficiency, and solar energy storage efficiency.


![[thin space (1/6-em)]](https://www.rsc.org/images/entities/char_2009.gif) 500 mA h g−1 (Fig. 24(n)), and high cycling stability for 200 h could be attained by the WO3 photocathode. On the other hand, it is known that the (010) facet of BiVO4 is highly photoactive because it possesses a higher surface area available to gather the photogenerated electrons and facilitates the photogenerated electron–hole pairs separation.84,85 For example, Zhang et al.84 demonstrated {010} and {110} crystal facets of monoclinic BiVO4, in which BiVO4 crystal facets were formed using a template and surfactant-free method. Fig. 25(b) shows that BiVO4 was decahedron shaped with a truncated tetragonal bipyramid that was obtained at a higher HNO3 concentration, in which the top and bottom flat surfaces were geometrically defined as {010} facets. In comparison, the trapezoidal sides were assigned as {110} facets. The apparent decrease in thickness was due to the lower HNO3 concentration, which indicated the formation of platelike BiVO4 (Fig. 25(c)), which had greater exposure {010} facets relative to the {110}. Fig. 25(d) illustrates the steady-state fluorescence spectra of both BiVO4, exhibiting a prominent band located at 500 nm and a low-energy tail band extended to 650 nm. These emission bands originated from the recombination of radiative electron–hole pairs. It is noted that the truncated bipyramid BiVO4 has a relatively more minor area of the {010} facets than the {110} facets; thus, the number of free electrons available on the surface of photogenerated truncated bipyramid BiVO4 was less than the holes. Nevertheless, the opposite phenomenon was applied to platelike BiVO4, where the more significant {010} facets than {110} facets facilitated the photogenerated charge transfer. Also, as shown in Fig. 25(e), the decay curve showed a sharp decay, which could be attributed to ultrafast hole trapping in m-BiVO4. The platelike BiVO4 had lifetimes of 1.0 and 9.5 ns for the fast (τ1) and slow (τ2) components. In contrast, the truncated bipyramid BiVO4 had shorter lifetimes of 0.8 (τ1) and 6.8 ns (τ2), signifying a more considerable electron trapping and a faster photogenerated charge recombination rate than the platelike BiVO4. Fig. 25(f and g) compares truncated bipyramid and platelike BiVO4 regarding charge trapping and the charge transfer kinetics contributing to the different photocatalytic activities. Because of the extended {010} facets exposed on platelike BiVO4 compared with truncated bipyramid BiVO4, the more significant population of photogenerated electrons available on its surface can facilitate electron transfer, leading to better photoactivity.
500 mA h g−1 (Fig. 24(n)), and high cycling stability for 200 h could be attained by the WO3 photocathode. On the other hand, it is known that the (010) facet of BiVO4 is highly photoactive because it possesses a higher surface area available to gather the photogenerated electrons and facilitates the photogenerated electron–hole pairs separation.84,85 For example, Zhang et al.84 demonstrated {010} and {110} crystal facets of monoclinic BiVO4, in which BiVO4 crystal facets were formed using a template and surfactant-free method. Fig. 25(b) shows that BiVO4 was decahedron shaped with a truncated tetragonal bipyramid that was obtained at a higher HNO3 concentration, in which the top and bottom flat surfaces were geometrically defined as {010} facets. In comparison, the trapezoidal sides were assigned as {110} facets. The apparent decrease in thickness was due to the lower HNO3 concentration, which indicated the formation of platelike BiVO4 (Fig. 25(c)), which had greater exposure {010} facets relative to the {110}. Fig. 25(d) illustrates the steady-state fluorescence spectra of both BiVO4, exhibiting a prominent band located at 500 nm and a low-energy tail band extended to 650 nm. These emission bands originated from the recombination of radiative electron–hole pairs. It is noted that the truncated bipyramid BiVO4 has a relatively more minor area of the {010} facets than the {110} facets; thus, the number of free electrons available on the surface of photogenerated truncated bipyramid BiVO4 was less than the holes. Nevertheless, the opposite phenomenon was applied to platelike BiVO4, where the more significant {010} facets than {110} facets facilitated the photogenerated charge transfer. Also, as shown in Fig. 25(e), the decay curve showed a sharp decay, which could be attributed to ultrafast hole trapping in m-BiVO4. The platelike BiVO4 had lifetimes of 1.0 and 9.5 ns for the fast (τ1) and slow (τ2) components. In contrast, the truncated bipyramid BiVO4 had shorter lifetimes of 0.8 (τ1) and 6.8 ns (τ2), signifying a more considerable electron trapping and a faster photogenerated charge recombination rate than the platelike BiVO4. Fig. 25(f and g) compares truncated bipyramid and platelike BiVO4 regarding charge trapping and the charge transfer kinetics contributing to the different photocatalytic activities. Because of the extended {010} facets exposed on platelike BiVO4 compared with truncated bipyramid BiVO4, the more significant population of photogenerated electrons available on its surface can facilitate electron transfer, leading to better photoactivity.


