
 Open Access Article
 This Open Access Article is licensed under a
 Creative Commons Attribution 3.0 Unported Licence
Particle size distributions of wildfire aerosols in the western USA†
Siying
Lu
a,
Chiranjivi
Bhattarai
a,
Vera
Samburova
 ab and
Andrey
Khlystov
*a
ab and
Andrey
Khlystov
*a
aDivision of Atmospheric Sciences, Desert Research Institute, Reno, Nevada, USA. E-mail: andrey.khlystov@dri.edu
bDepartment of Physics, University of Nevada, Reno, Nevada, USA
First published on 13th March 2025
Abstract
Wildfires are a major source of aerosols during summer in the western United States. Aerosols emitted from wildfires could significantly affect air quality, human health, and the global climate. This study conducted a comparison of aerosol characteristics during wildfire smoke-influenced and non-smoke-influenced days. Ambient particle size distribution (PSD) data were collected in Reno, Nevada, between July 2017 and October 2020. During this period, the site was impacted by smoke from over a hundred wildfires burning in a wide range of ecosystems in the western United States located at different distances from the measurement site. The smoke-influenced days were identified using satellite images, a hazard mapping system, and wind back-trajectory. Positive matrix factorization (PMF) was applied to identify the main sources and their characteristics. The wildfire aerosols were observed to have a number mode diameter of 212 nm, which is significantly larger than aerosols on non-smoke-influenced days (61 nm). In addition to the increase in particle size, wildfires made a large contribution to PM2.5 and CO concentrations. During fire-prone months (July, August, and September) from 2016 to 2021, 56% to 65% of PM2.5 and 18% to 26% of CO concentrations could be attributed to wildfire emissions in the study area. On an annual basis, wildfire emissions were responsible for 35% to 47% of PM2.5 concentrations and 5% to 12% of CO concentrations.
Environmental significanceAs wildfire frequency and intensity continue to increase, characterizing the particle size distribution of wildfire emissions becomes increasingly vital for accurately assessing the climate effects of wildfire aerosols and evaluating potential health risks associated with smoke exposure. This study investigated aerosol particle size distributions measured in Reno, Nevada, over a 16 months period, during which the measurement site was impacted by smoke from 106 wildfires burning in a wide range of ecosystems in the western United States located at different distances from the measurement site. We show that wildfire-related aerosols are considerably larger (a number mode diameter of 212 nm) than aerosols on non-smoke-influenced days (61 nm). In addition to the increase in particle size, wildfires made a large contribution to local air pollutant concentrations. For example, wildfires contributed 35% to 47% of PM2.5 on an annual basis. The findings will enhance our ability to model and predict both the climatic and health impacts of wildfire emissions, supporting more effective air quality management strategies and public health interventions in regions affected by wildfire smoke. |
1. Introduction
Atmospheric aerosols influence the global radiation balance by directly scattering and absorbing solar radiation.1–3 They also affect cloud formation4 and albedo.5 As one of the six criteria air pollutants,6 particulate matter (PM) directly affects air quality,7–9 visibility,10 and health.11,12Biomass burning (BB), which includes wildfires, is a major source of atmospheric aerosols.13 The frequency, size, and severity of wildfires in the western United States have increased over the past two decades.14–16 Studies worldwide – such as those from the United States,17 Finland,18,19 Australia,20 Brazil,21 Mexico,22 China,23 and Russia24 – have shown that fires can generate large amounts of aerosols, raising concerns about their impact on air quality, human health, and climate. Wildfire emissions have been linked to adverse health effects,12,25,26 such as cardiorespiratory diseases,27 asthma attacks,27,28 and overall respiratory morbidity.28,29 Wildfire-emitted aerosols also influence the global and regional climate by scattering and absorbing solar radiation, and impacting clouds and precipitation.30,31 It has been demonstrated that wildfire emissions are associated with changes in atmospheric circulation,9,30 increases in Arctic sea ice,30 and other climate anomalies such as droughts.31 However, there is still significant uncertainty in the current estimates of wildfire effects on local and global climates.32–34
Aerosol particle size distribution (PSD) plays a significant role in how aerosols affect the climate35,36 and human health.37 For example, direct radiative forcing caused by wildfire aerosols is sensitive to aerosol PSD.38 Fine particles are particularly important in total optical extinction because of their high mass scattering efficiency and absorption cross-sections.39 The ability of particles to act as cloud condensation nuclei (CCN) is not only driven by their chemical composition, but also primarily by their size.40 BB aerosols can significantly elevate CCN numbers.41 Zheng et al.42 demonstrated that CCN concentration in the remote marine boundary layer could be enhanced by long-range transported wildfires. Aerosol size is also a key controlling parameter of aerosol deposition in the human respiratory tract,37,43 which influences exposure to toxic aerosol components and the resulting negative health effects. Therefore, PSD measurements of wildfire-emitted aerosols are needed to understand the effects of these aerosols on the climate and human health.
Several studies have reported PSD measurements of wildfire aerosols. Chubarova et al.24 detected an increase in the volume PSD mode radius from 0.15 μm under typical conditions to 0.24 μm during a fire event in Russia. McMeeking et al.44 observed that the volume geometric mean diameter (GMD) in Yosemite National Park, CA, was elevated by 0.06 μm during wildfire episodes compared to non-smoke periods. Veselovskii et al.17 recorded a volume PSD radius of approximately 0.27 μm in the summer, which was influenced by forest fires near Washington DC. Kleinman et al.45 demonstrated that particle size increases with downwind distance, potentially enhancing the cooling effect in the western United States. In addition, June et al.46 reported that smoke with higher initial organic aerosol concentration exhibits faster particle growth compared to smoke with lower initial organic aerosol concentration. Using a scanning mobility particle sizer (SMPS), Zheng et al.42 demonstrated a number PSD mode of aged wildfire aerosols at a diameter of 230 nm. Laing et al.47 reported that aerosols originating from wildfires in the western United States had a number GMD ranging from 138 to 229 nm. In Southern California, the number PSD mode during fire episodes were significantly larger, with diameters between 0.1 and 0.2 μm, compared to typical urban air conditions.48 Okoshi et al.49 demonstrated a number PSD mode at a diameter of ∼100 nm during small wildfire events and suggested using size measurements over mass measurements for ambient wildfire events. Studies of wildfire smoke reporting size distribution measurements covering a wide particle size range are limited with notable variations in the reported GMD or mode sizes. The underlying causes of these variations – such as differences in measurement methods, wildfire characteristics, and distances – remain uncertain.
The aim of this study was to examine the effect of wildfires on the concentration and PSD of atmospheric aerosols in the western United States using PSD data measured in the 25 to 400 nm diameter range in Reno, NV, between July 2017 and October 2020. During this period, the study area was impacted by 106 wildfires burning in a wide range of ecosystems and located at distances ranging from 24 to 700 km from the measurement site. The dataset therefore provides a robust sample of wildfire aerosols that could be encountered in the western United States. Positive matrix factorization (PMF) analysis was performed to better understand the contribution of wildfire to the ambient aerosol PSD and air quality relative to other air pollution sources.
2. Measurements and methods
2.1 Location
PSD measurements were carried out on the roof of the Desert Research Institute (DRI) building located at 39°34′20.67′′ N 119°48′06.83′′ W, in northern Reno, NV, from July 2017 to August 2018, April 2020 to May 2020, and August 2020 to October 2020. Fig. 1a shows a map depicting the locations of the measurement site and 106 fires whose smoke could have impacted the area during the study period (see Section 2.4). Most of these wildfires occurred in California, with additional events in Nevada and Oregon. Table S1† provides information on each wildfire, including the start date, end date, burned area, location, and type of vegetation burned. | ||
| Fig. 1 The left panel (a) shows a geospatial representation of wildfires that were affecting Reno, NV, during the observation period. The size of each wildfire dot represents the burned area (km2). Concentric black circles radiate from Reno, NV, with each circle representing a 100 km increment from the city, which serves as a spatial reference for distance. The right panel (b) shows a detailed map of the Reno area, including downtown Reno and DRI, which is adapted from Google Earth. | ||
Reno is a city located on the east side of the Sierra Nevada and the west of the Great Basin (Fig. 1b) with an area of approximately 289 km2 and a population of 274![[thin space (1/6-em)]](https://www.rsc.org/images/entities/char_2009.gif) 915 people in 2023.50 The elevation of this city is approximately 1300 meters above sea level. Reno has a semiarid climate with low annual precipitation (average annual accumulated precipitation from 1991 to 2020 was 187 mm according to U.S. Climate Data51). The main local sources of PM in Reno are traffic and domestic burning.52 Aerosols can also be transported from neighboring states such as California and Oregon.53–55
915 people in 2023.50 The elevation of this city is approximately 1300 meters above sea level. Reno has a semiarid climate with low annual precipitation (average annual accumulated precipitation from 1991 to 2020 was 187 mm according to U.S. Climate Data51). The main local sources of PM in Reno are traffic and domestic burning.52 Aerosols can also be transported from neighboring states such as California and Oregon.53–55
2.2 Instrumentation
The aerosols were measured with an SMPS that consists of a differential mobility analyzer (DMA) model 3081 from TSI (St Paul, MN, USA) and a condensation particle counter (CPC) model 3775 from TSI. The PSD was measured with 5 minutes upscans and 30 seconds downscans (a total of 330 seconds per one size distribution measurement) in a particle diameter range of 25 to 400 nm.Hourly and daily air pollutant concentrations of PM2.5 (aerosol particles with aerodynamic diameters of or less than 2.5 μm), ozone (O3), nitric oxide (NO), nitrogen dioxide (NO2), nitrogen oxides (NOX), carbon monoxide (CO), potassium (K), elemental carbon (EC), and organic carbon (OC) measured at the downtown Reno air quality monitoring site (Fig. 1, Environmental Protection Agency (EPA) Air Quality System identification no. 320310016 in 2017 and 2018, no. 320310031 in 2020) were downloaded from the EPA website.56
The wind back-trajectory data were processed using the National Oceanic and Atmospheric Administration (NOAA) Hybrid Single-Particle Lagrangian Integrated Trajectory (HYSPLIT) Model.57,58
Satellite images were taken from Worldview, the National Aeronautics and Space Administration (NASA) with the Fires and Thermal Anomalies (day and night) layer, which shows active fire detections and thermal anomalies, from MODIS Terra (MODIS/Terra Thermal Anomalies/Fire 5-Min L2 Swath 1 km, MOD14) and Aqua (MODIS/Aqua Thermal Anomalies/Fire 5-Min L2 Swath 1 km, MYD14) satellite product with 1 km sensor resolution and daily temporal resolution.
The daily smoke polygon product from the NOAA Hazard Mapping System Fire and Smoke Product (HMS) was used for additional identification of the presence of smoke. The HMS with 2 km nominal spatial resolution is based on two satellite products (GOES-16 and GOES-17). Ecoregions and their vegetation features for California, Oregon, and Nevada were collected from ecoregion posters on the EPA Ecoregions website.59
2.3 Data processing
The SMPS data were averaged to hourly values from which the aerosol number concentration (units: cm−3), volume concentration (units: μm3 cm−3), and the number GMD (units: nm, hereafter referred to simply as GMD) were calculated. The total number concentration was calculated by summing up the number concentration of particles over the 25 to 400 nm size bins. To get the volume concentration, the number concentration for different particle size bins was multiplied by and the cube of particle diameters, and then summed up. The following equation was used to calculate GMD:
 | (1) |
To gain insight into prevailing sources and whether they correlate with certain PSD characteristics, positive matrix factorization (PMF) implemented with the Python program scikit-learn package60 was applied to the PSD hourly data. PMF has been used extensively in ambient air quality studies.61–66 The PMF can be represented as:67–69
| X = GF + E | (2) |
The EPA PMF 5.0 program was used to quantify the contribution of air pollutant sources for an 8 year (2015 to 2022) data analysis using daily air pollutant concentrations. The program requires chemical species concentrations with uncertainties as input data and produces factor contributions, factor profiles, and residuals. The best run was selected based on the critical goodness-of-fit parameter Q, with the lowest value indicating the optimal choice. Bootstrap (BS), displacement (DISP), and BS-DISP error estimation analysis methods were used to estimate the variability of the selected run and to determine the optimal number of factors. A Student's t-test was conducted to determine the statistical significance of the differences between the means of two groups. The significance level (p-value) was set at 0.05.
2.4 Identification of smoke-influenced days
Satellite images, wind directions, and wind back-trajectories were investigated to verify that the measurement site was indeed impacted by a wildfire and to identify the fire location. Satellite images were used to observe whether smoke was affecting the area around the site. The back-trajectories were then used in conjunction with local wind directions and areas of satellite thermal anomalies to locate fires that might affect the measurement site. Fig. 2 shows examples of using satellite imagery and wind back-trajectories to identify smoke-influenced days and the fires that could have affected the measurement site. During August 19 and 20, 2020, the wind back-trajectories and the western and southwestern winds indicated that smoke generated by wildfires could have been transported to the Reno area (Fig. 2a and b). In contrast, during the non-smoke-influenced days, when the site was again subject to the westerly airflow (Fig. 2e), there were no major fires in the upwind direction, whereas the absence of smoke on the satellite images further confirmed the absence of influence from wildfire smoke (Fig. 2c). Along with satellite images and wind back-trajectory plots, HMS maps were used for additional confirmation of smoke-influenced days by checking the presence of overhead smoke in Reno, NV, during 2018 to 2020 (HMS is not available for 2017). HMS indicated medium to heavy smoke over Reno, NV, on August 19 and 20, 2020 (Fig. 2f and g), whereas no smoke was indicated on July 10, 2018 (Fig. 2h). This confirms that August 19 and 20, 2020, were smoke-influenced days, whereas July 10, 2018, was not. In addition, the HMS helped to exclude September 1, 2020, when fires and smoke were around Reno, but did not affect the city area. However, the HMS appeared to miss some smoke-influenced days. For example, HMS did not indicate the smoke impact on September 26, 2020, in the Reno area, but our analysis of satellite images and wind back-trajectories indicated that the site was impacted by fires, which was further confirmed by a high PM2.5 concentration (reaching 58 μg m−3) and a high total aerosol volume concentration (reaching 31 μm3 cm−3), which are typically in the range of 3 to 13 and 0 to 9 during non-smoke-influenced days, respectively.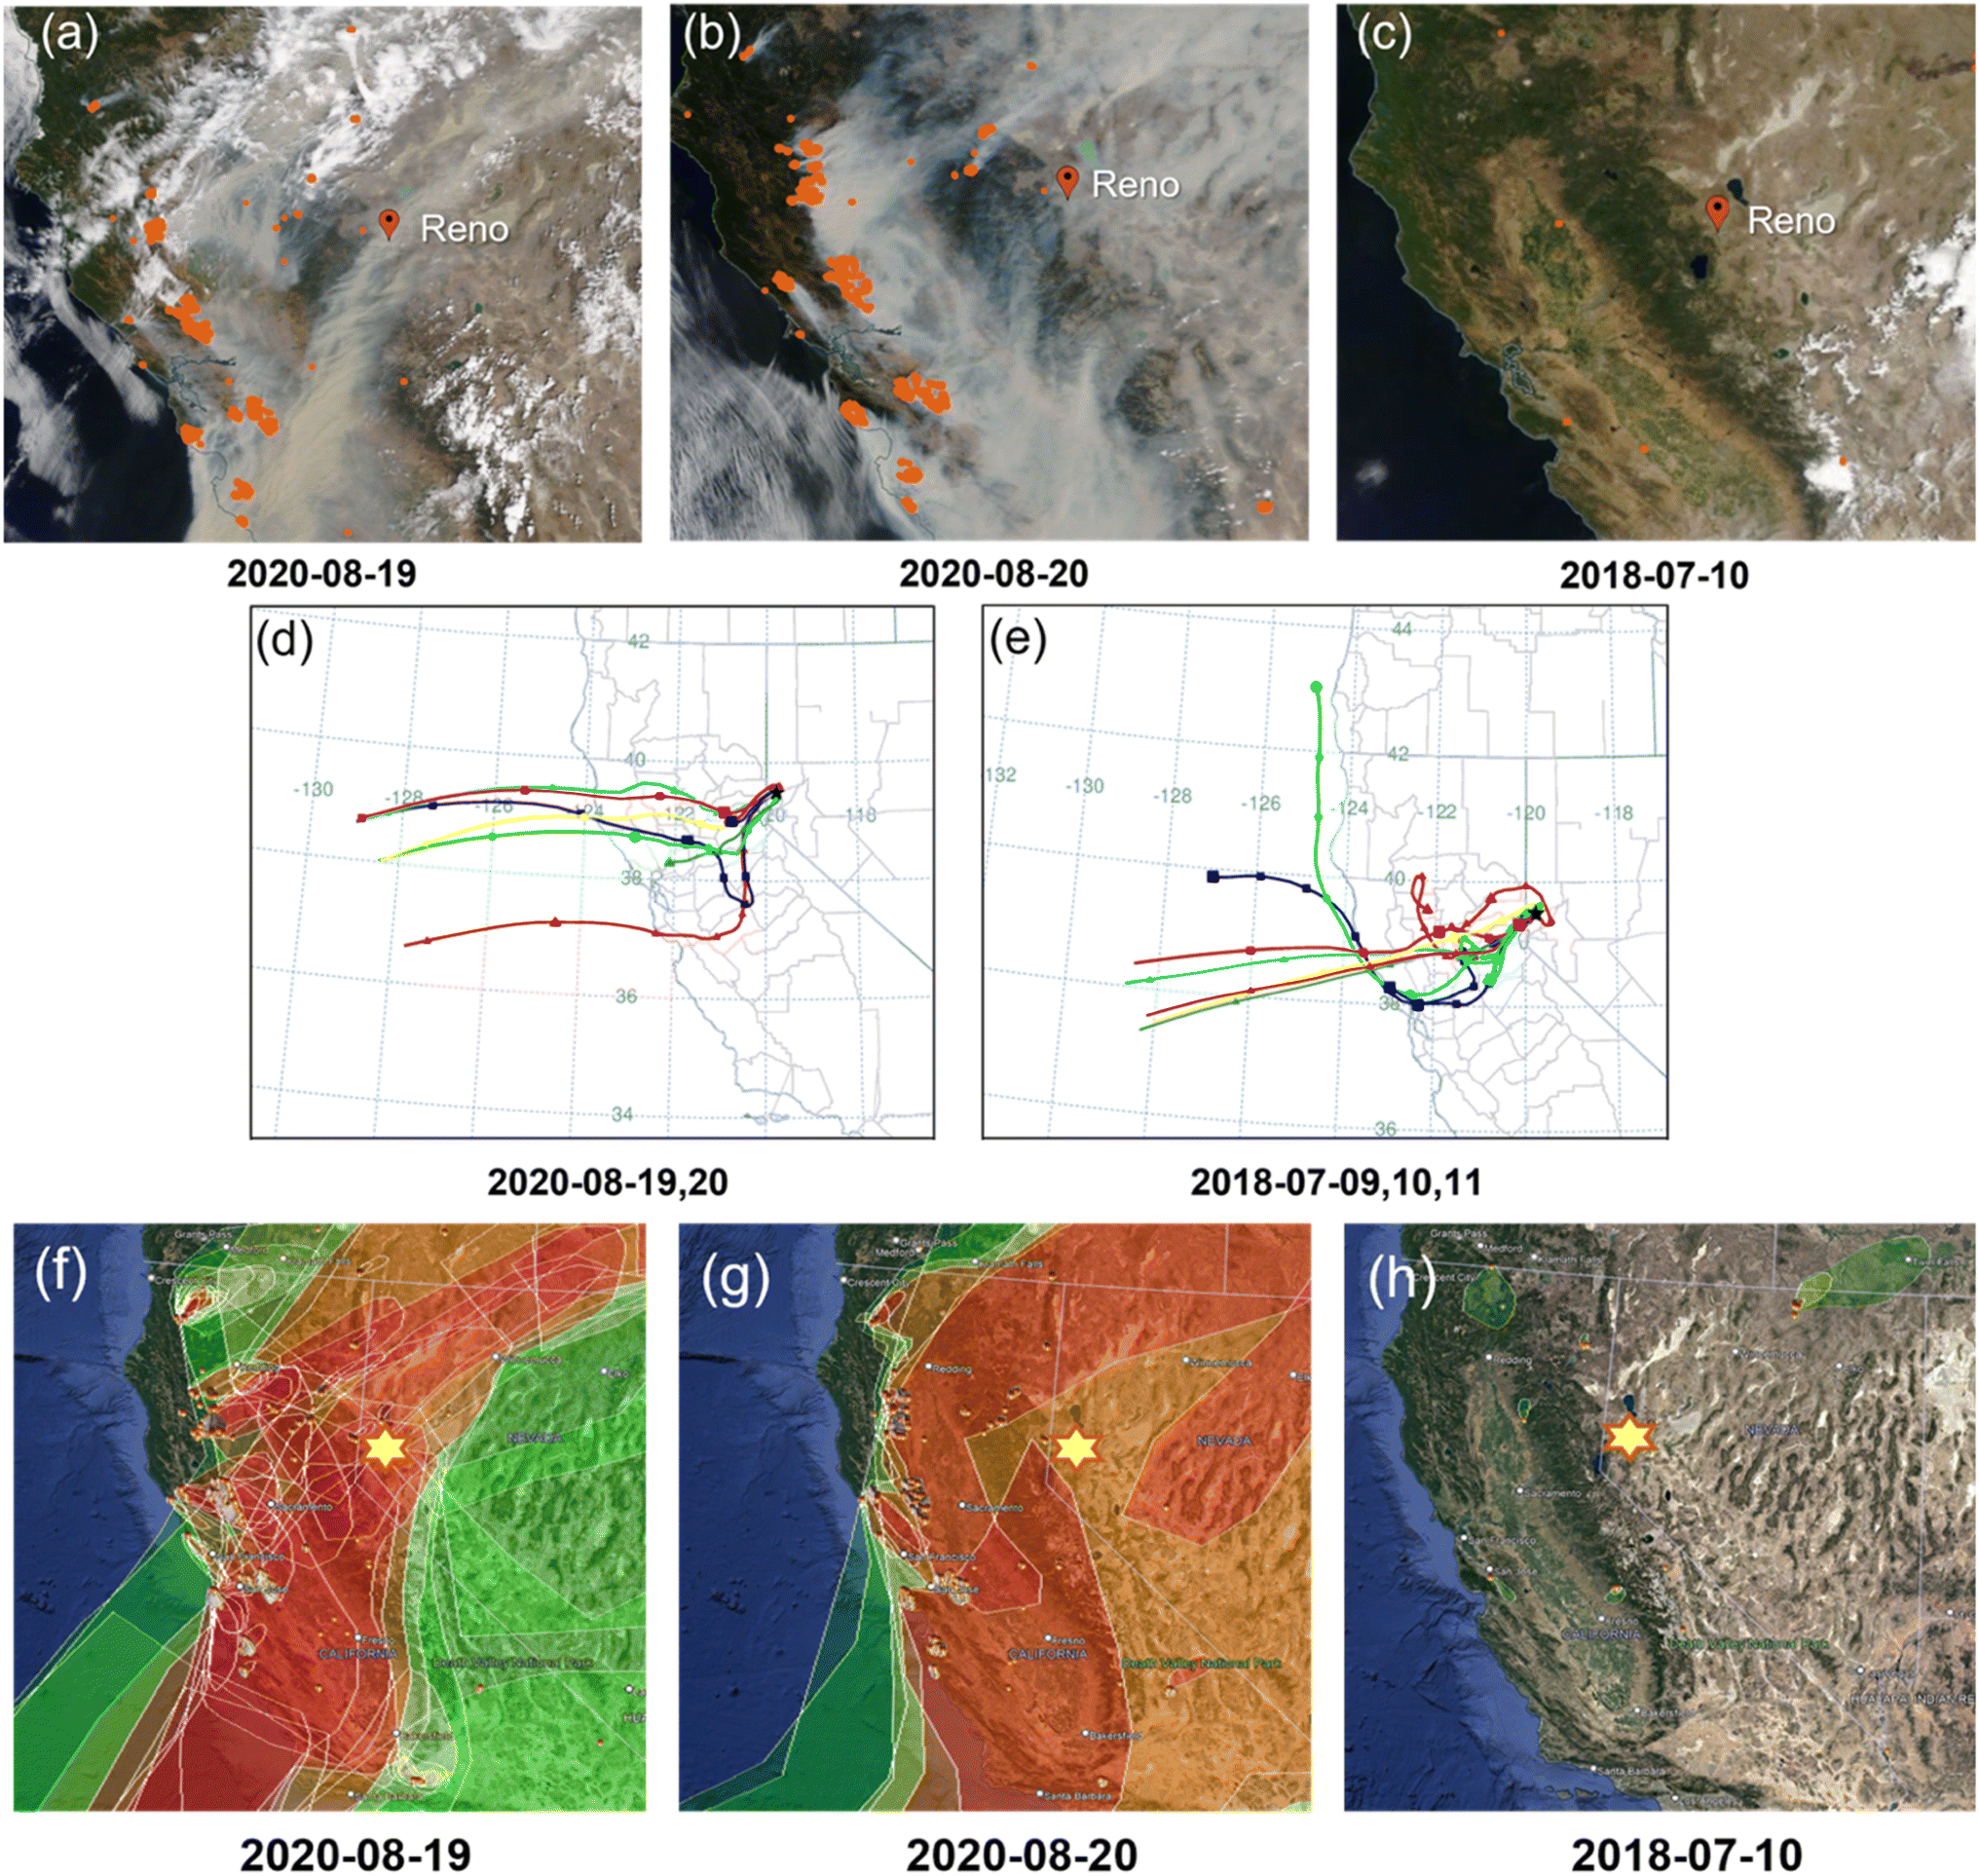 | ||
| Fig. 2 Satellite images during smoke-influenced days of (a) August 19, 2020, and (b) August 20, 2020, as well as a baseline day (c) of July 10, 2018. The small orange dots in (a)–(c) are fire and thermal anomaly spots that could have affected the Reno, NV, area. The wind back-trajectories for Reno during the smoke-influenced days (d) of August 19 and 20, 2020, and the baseline days (e) of July 9, 10, and 11, 2018, were produced at heights of 100 m, 500 m, and 1000 m starting a new trajectory every 6 hours. The HMS results during smoke-influenced days (f) of August 19, 2020, and (g) August 20, 2020, and a baseline day (h) of July 10, 2018. In (f), (g), and (h), the shadows with different colors indicate different smoke levels (green = light; yellow = medium; red = heavy). Reno, NV, is marked by a red marker in (a)–(c), a black star in (d) and (e), and a yellow hexagram in (f)–(h). | ||
The largest uncertainty in our approach in smoke-influence day identification comes from the use of satellite imagery, which provides only one snapshot per day. Thus, there is a chance that smoke influence could be missed if it occurred at a different time of day. Another uncertainty could arise from the fact that the satellite measurements provide a column-average information. If a smoke plume is transported at higher levels without affecting the ground, the image would provide a false positive indication for our ground-based measurements. However, with a few exceptions, our smoke identification correlated well with the observed differences in aerosol PSD and pollutant concentrations, as will be shown in the Results and discussion section.
In total, for the period of July 2017 to October 2020, 88 days were identified as smoke-influenced days (July 14, 16, 19–20, 25, and 30–31, 2017; August 1–5, 7, and 29–31, 2017; September 1–3, and 14–15, 2017; October 11–12, 2017; July 4, 14–15, 20–22, and 27–31, 2018, August 1–12 and 16, 2018; August 16–31, 2020; September 2–8, 10–22, 26, and 30, 2020; October 1 and 4–5, 2020). Seven days (from July 5 to 11, 2018) were used as a baseline for comparison with smoke-influenced days. These baseline days were selected in smoke-influenced months (mainly July, August, and September) in Reno, NV,70 to reduce the influence of seasonal variation in aerosol sources. Days that were not selected as the smoke-influenced days or the baseline days were assigned as “other” days.
3. Results and discussion
3.1 Comparison of smoke-influenced and non-smoke-influenced days
Fig. 3 shows a time series of the number PSD, total number concentrations (Ntot), and total volume concentrations (Vtot) measured with the SMPS at DRI as well as air pollutant concentrations (PM2.5, O3, CO, and NOX) measured in downtown Reno, NV, during the period when the SMPS measurements were done. The periods identified as smoke-influenced are shaded in red. | ||
| Fig. 3 Time-resolved (a) normalized number PSD distribution with the log-normal fit particle diameter; (b) Ntot, Vtot, and PM2.5 concentration; and (c) O3, CO, and NOX concentration. The red shadow areas represent the smoke-influenced days. | ||
Particle sizes, Vtot, and PM2.5 concentrations during smoke-influenced days tend to be significantly higher than average. Steep increases in Vtot and PM2.5 concentration were observed during the smoke-influenced days, with the highest Vtot exceeding 135 μm3 cm−3, and PM2.5 concentration reaching 292 μg m−3. Therefore, Vtot and PM2.5 concentrations can be used to confirm fire influence. CO concentrations had significant increases during both winter and the smoke-influenced days, which is reasonably following the emissions from traffic and wildfires. On the other hand, Ntot, O3, and NOX concentrations did not provide a clear indicator for the smoke-influenced days. High values of O3 concentrations are regularly observed because of the seasonal photochemical pattern. The elevated winter concentrations of particle number, NOX, and CO were likely due to lower atmospheric mixing and additional emissions from domestic wood burning.
Fig. 4 shows boxplots of GMD and air pollutant (PM2.5, CO, NOX, O3) concentrations measured during the identified smoke-influenced days, the baseline days, and the other days. Their descriptive statistics are provided in Table 1. GMD and PM2.5 concentration had considerably higher values during smoke-influenced days than during non-smoke-influenced days (baseline + other) with high statistical significance (p < 0.001). GMD during smoke-influenced days (approximately 139 nm on average) was approximately two times greater than GMD during baseline days and other days. Of the smoke-influenced days, August 19, 2020, had the largest GMD of approximately 257 nm and September 1, 2020, had the smallest GMD of approximately 42 nm. In contrast, the largest GMD during the baseline days was approximately 109 nm on July 7, 2018, and the smallest GMD was 44 nm on July 9, 2018. This shows that the smallest GMD observed during smoke-influenced and non-smoke-influenced days were similar, but most of the observed GMD during the smoke-influenced days were significantly (more than two times) larger. Portin et al.71 showed similar results during summer: higher GMDs during smoke-influenced days of 158 nm compared to the mean sizes on the other days of 76.3 nm. However, Alonso-Blanco et al.72 found smaller particle sizes during days with wildfires than days without fires, although their measurements were limited to the size range above 0.1 μm. The similarity of the smallest GMD between smoke-influenced and non-smoke-influenced days observed in this study is likely due to some periods during the smoke-influenced days having little or no fire impact. Our smoke-influenced/non-smoke-influenced designation is mostly based on daily satellite observations, whereas size distributions were measured at a much higher frequency. The smoke-influenced days may include periods of low fire smoke impact. The correlation of the observed GMD with the other pollutants will be discussed later in the paper.
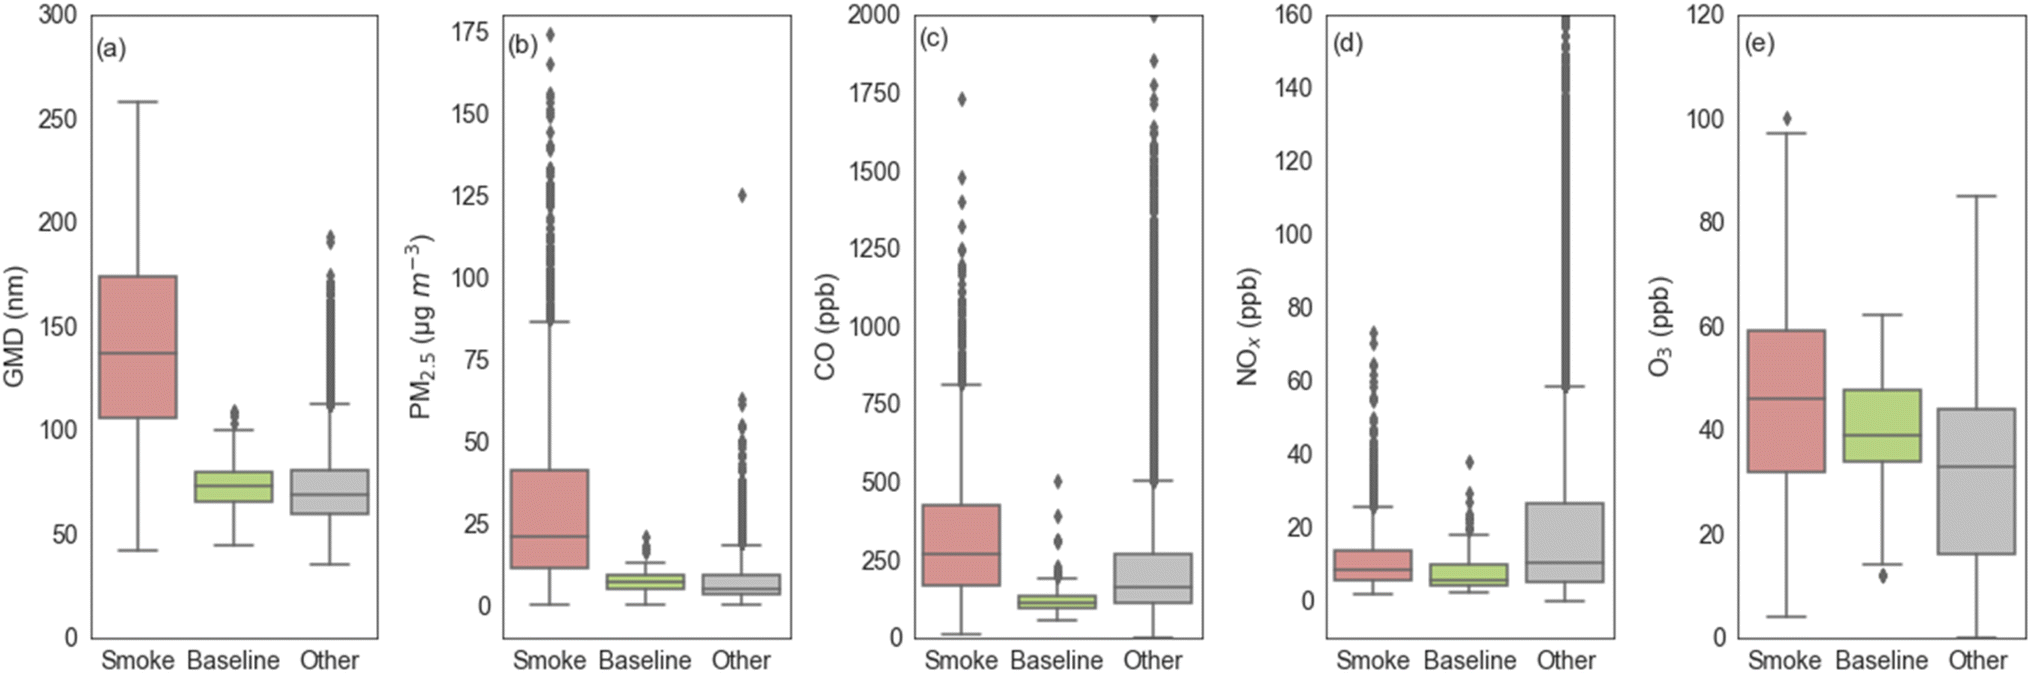 | ||
| Fig. 4 Boxplots of hourly (a) GMD, (b) PM2.5 concentration, (c) CO concentration, (d) NOX concentration, and (e) O3 concentration during the smoke-influenced days (pink on the left), the baseline days in fire month (green in the middle), and the other days (gray on the right). | ||
| Type of day | Number of data points | Mean | Std | Min | 25% | 50% | 75% | Max | |
|---|---|---|---|---|---|---|---|---|---|
| GMD (nm) | Smoke | 2097 | 139 | 45.2 | 42.0 | 106 | 136 | 174 | 257 |
| Baseline | 168 | 72.3 | 12.2 | 44.1 | 65.1 | 72.6 | 79.3 | 109 | |
| Other | 8630 | 72.2 | 19.4 | 35.4 | 59.1 | 69.6 | 80.3 | 193 | |
| PM2.5 (μg m−3) | Smoke | 1949 | 31.0 | 29.2 | 0.00 | 11.0 | 21.0 | 41.0 | 292 |
| Baseline | 143 | 7.27 | 3.43 | 0.00 | 5.00 | 7.00 | 9.00 | 21.0 | |
| Other | 19227 |
6.70 | 5.63 | 0.00 | 3.00 | 5.00 | 9.00 | 125 | |
| CO (ppb) | Smoke | 1949 | 329 | 222 | 11.0 | 166 | 266 | 424 | 2036 |
| Baseline | 143 | 126 | 59.5 | 57.0 | 94.0 | 112 | 133 | 504 | |
| Other | 19227 |
231 | 206 | 1.00 | 112 | 159 | 269 | 2747 | |
| NOx (ppb) | Smoke | 1949 | 10.9 | 8.35 | 1.90 | 5.40 | 8.40 | 13.50 | 73.2 |
| Baseline | 143 | 8.00 | 6.02 | 2.20 | 4.15 | 5.70 | 10.0 | 38.2 | |
| Other | 19227 |
21.1 | 26.2 | 0.10 | 5.40 | 10.50 | 26.7 | 395 | |
| O3 (ppb) | Smoke | 1949 | 45.6 | 18.3 | 4.00 | 32.0 | 46.0 | 59.0 | 100 |
| Baseline | 143 | 39.4 | 11.6 | 12.0 | 34.0 | 39.0 | 47.5 | 62.0 | |
| Other | 19227 |
30.6 | 17.8 | 0.00 | 16.0 | 33.0 | 44.0 | 85.0 |
The mean and median values of PM2.5 concentration during baseline and other days were approximately 1/4 to 1/3 of the values during smoke-influenced days. The maximum value of PM2.5 concentration during smoke-influenced days reached 292 μg m−3, which was more than 13 times the maximum value during the baseline days and more than 2 times the maximum value during the other days. This confirms that in the western United States, wildfire is a significant source of PM2.5 in summer.73 CO had higher concentrations during smoke-influenced days than non-smoke-influenced days as well, but not as pronounced as the differences in the GMD and PM2.5 concentrations. NOX and O3 concentrations had comparable values during smoke-influenced and baseline days, which were both lower than their values during the other days.
During smoke-influenced days, PM2.5 and CO concentrations had a good correlation (Fig. 5a) with a high r2 value (0.77, see Table 2), which is consistent with results from Jaffe et al.74 for data collected in Sparks, NV, which is located approximately 5 km to the northeast of the downtown Reno site. On smoke-influenced days, the relationship between PM2.5 and CO is clearly different from the relationship observed on non-smoke-influenced days (baseline + other) (Table 2). This indicates that the smoke-influenced days were influenced by a different air pollution source, which is yet another confirmation for the selection of smoke-influenced days.
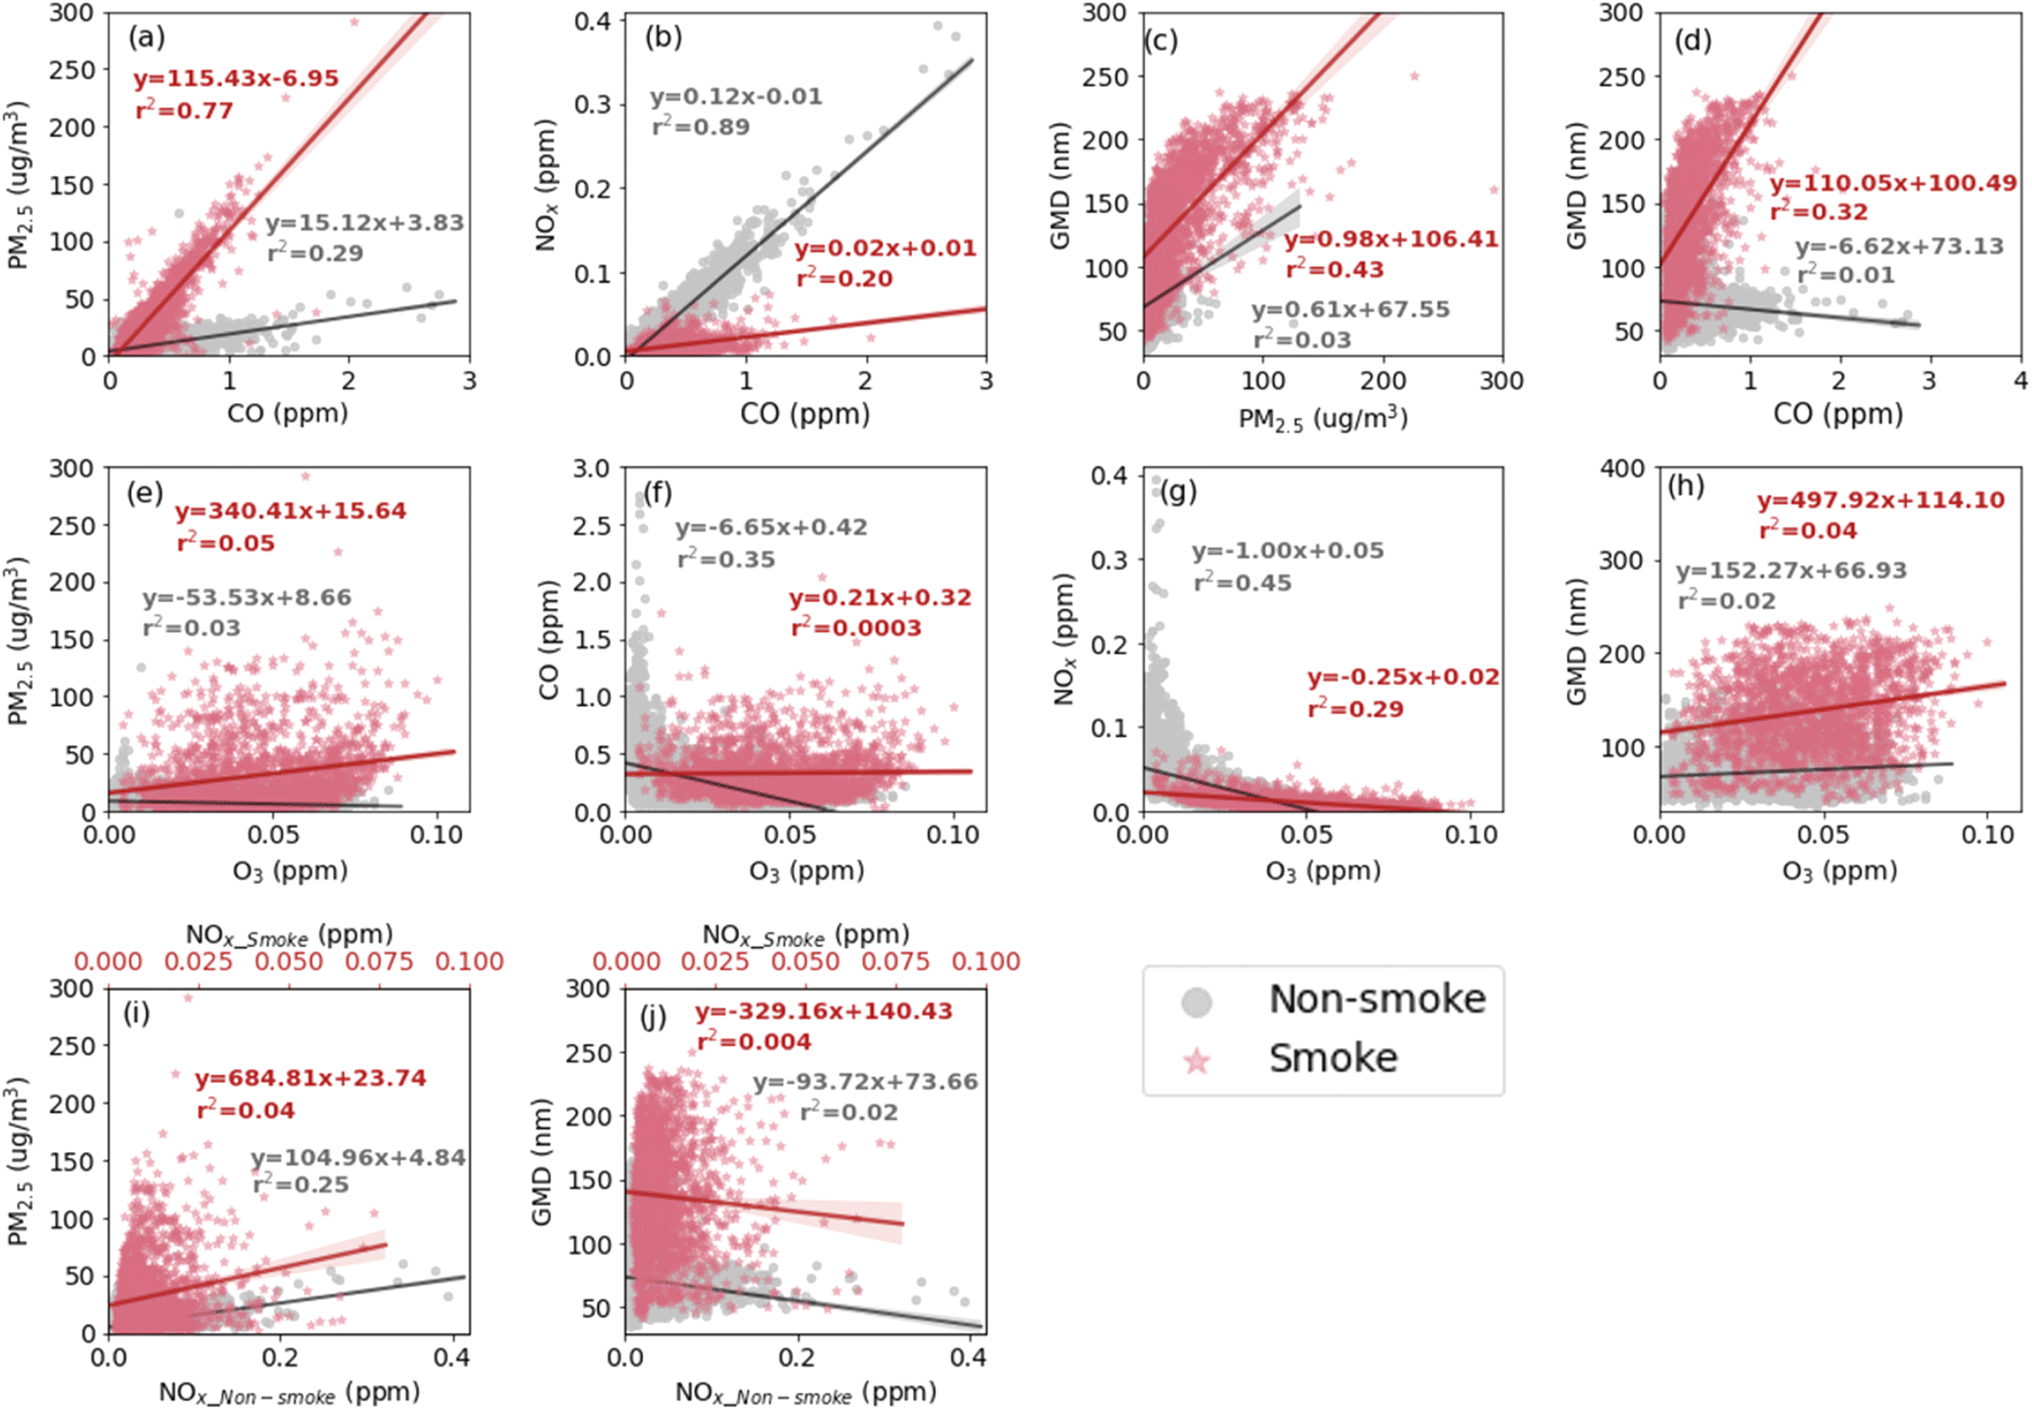 | ||
| Fig. 5 Correlation between PM2.5, CO, NOX, and O3 concentrations and GMD with linear regression lines during the smoke-influenced days (red dots) and the non-smoke-influenced days within the whole period (gray dots). The shadow around the linear regression line shows a 95% confidence interval. The linear regression information is annotated in the plot. | ||
| Axis | Smoke-influenced days | Non-smoke-influenced days | |||||||||
|---|---|---|---|---|---|---|---|---|---|---|---|
| y | x | Slope | Intercept | r 2 | slp_unc | int_unc | Slope | Intercept | r 2 | slp_unc | int_unc |
| PM2.5 | CO | 115.43 | −6.95 | 0.77 | 1.44 | 13.93 | 15.12 | 3.83 | 0.29 | 0.28 | 4.68 |
| NOX | CO | 0.02 | 0.01 | 0.20 | 0.00 | 0.01 | 0.12 | −0.01 | 0.89 | 0.00 | 0.01 |
| GMD | PM2.5 | 0.98 | 106.41 | 0.43 | 0.03 | 32.61 | 0.61 | 67.55 | 0.03 | 0.04 | 18.19 |
| GMD | CO | 110.05 | 100.49 | 0.32 | 3.68 | 35.73 | −6.62 | 73.13 | 0.01 | 1.10 | 18.46 |
| PM2.5 | O3 | 340.41 | 15.64 | 0.05 | 35.56 | 28.49 | −53.53 | 8.66 | 0.03 | 3.70 | 5.49 |
| CO | O3 | 0.21 | 0.32 | 0.00 | 0.28 | 0.22 | −6.65 | 0.42 | 0.35 | 0.11 | 0.16 |
| NOX | O3 | −0.25 | 0.02 | 0.29 | 0.01 | 0.01 | −1.00 | 0.05 | 0.45 | 0.01 | 0.01 |
| GMD | O3 | 497.92 | 114.10 | 0.04 | 52.81 | 42.31 | 152.27 | 66.93 | 0.02 | 12.34 | 18.31 |
| PM2.5 | NOX | 684.81 | 23.74 | 0.04 | 78.18 | 28.60 | 104.96 | 4.84 | 0.25 | 2.20 | 4.84 |
| GMD | NOX | −329.16 | 140.43 | 0.00 | 118.09 | 43.20 | −93.72 | 73.66 | 0.02 | 8.33 | 18.34 |
In contrast, NOX and CO showed good correlation on the non-smoke-influenced days (Fig. 5b) with a high r2 value (0.89). This is likely because urban emissions, such as those from traffic, dominated the relationship between these two pollutants on non-smoke-influenced days. In fact, the ratio of NOX and CO (0.12 ppm ppm−1) is close to that of summer emissions from light-duty vehicles (0.134 ppm ppm−1) measured in the Fort McHenry Tunnel.75 The other pollutant pairs did not show any clear correlations during smoke-influenced days or during baseline and other days (Fig. 5e–j).
GMD during smoke-influenced days increased with PM2.5 concentrations (Fig. 5c). The non-smoke-influenced days showed a similar trend, although with a weaker dependence of GMD on PM2.5 concentration. A similar relationship between CO and GMD was observed during smoke-influenced days, with a much weaker relationship observed on non-smoke-influenced days.
Fig. 6 shows the particle number distribution (Fig. 6a) and the particle volume distribution (Fig. 6b) during smoke-influenced days, baseline days, and other days. The figure also includes fitted multimode log-normal distributions and the fit parameters are provided in Table 3. During smoke-influenced days, the main mode of the number PSD (212 nm) was significantly greater than that during the baseline days and the rest of the campaign (74 nm and 48 nm, respectively). The volume PSD (339 nm) was also greater than during the baseline days (173 nm) and the other days (226 nm), which is in line with the observed differences in GMD (Fig. 4). Fig. 6 confirms that traffic and wildfires have different number and volume distributions, which is contrary to the results of Sandradewi et al.76
 | ||
| Fig. 6 Particle (a) number and (b) volume distributions during smoke-influenced days, baseline days, and the other days. Red lines represent smoke-influenced days, green lines represent baseline days, gray lines represent the other days, solid lines represent the particle size distribution from ambient data, and dashed lines represent the modeled particle size distribution. The y-axis on the left is for smoke-influenced days, and the y-axis on the right is for baseline days and other days. | ||
lgD) and volume (dV/dlgD) PSD during the smoke-influenced days, the baseline days, and the other days. GMD = geometric mean diameter; σg = geometric standard deviation; Ntot = total number concentration per mode, cm−3
| Mode | GMD | σ g | N tot | ||
|---|---|---|---|---|---|
| Number | Baseline | 1 | 36.5 | 2.184 | 1161.3 |
| 2 | 91.5 | 1.621 | 602.5 | ||
| Other | 1 | 36.5 | 1.822 | 990.3 | |
| 2 | 94.1 | 1.791 | 734.9 | ||
| Smoke | 1 | 71.1 | 2.703 | 1149.6 | |
| 2 | 228.5 | 1.534 | 1147.1 | ||
| Volume | Baseline | 1 | 196.5 | 1.784 | 1.14 |
| Other | 1 | 267.9 | 1.955 | 1.75 | |
| Smoke | 1 | 373.6 | 1.513 | 17.72 |
The particle number distribution during smoke-influenced days in this study has the mode at diameters larger than the modeled young-plume distribution (59 to 94 nm) but comparable to the ∼1 to 2 days aged distributions (230 nm) in the study from Sakamoto et al.77 Our number PSD is also comparable with the number distribution mode at approximately 200 to 250 nm in the Williams Flats Fire for smoke with ages between 1.2 and 3.1 hours.78 However, the mean number PSD measured in our study is larger than the diameter of 140 nm observed during smoke-influenced days in Spain.25 This discrepancy could probably be due to variations in the distances between the wildfires and the measurement site. The volume PSD observed in this study during smoke-influenced days is smaller than the long-range transported BB aerosols measured in Europe with a volume distribution mode between 420 and 500 nm.79 However, the measurement range of our study did not extend that far to exclude the presence of a larger mode. Our observations are slightly larger than the mode at diameters between 220 and 300 nm reported for fire seasons in the Amazon Basin.80
The larger PSD during smoke-influenced days could enhance the Fine-mode Aerosol Optical Depth (FAOD), which at least in part could be a reason for the FAOD trend observed in the western United States, as demonstrated by Luo et al.81 The higher concentrations and larger sizes of wildfire-emitted aerosols could also potentially contribute to the formation of coarse mode aerosols through processes such as coagulation and condensation, thus influencing the Coarse-mode Aerosol Optical Depth (CAOD). However, since our measurements were limited to aerosols with diameters smaller than 400 nm, such contributions cannot be confirmed.
3.2 Factor analysis
To investigate whether specific sources, including wildfires, have a characteristic PSD, the collected PSD data was analyzed using a home-written Python PMF program. The PMF was run for 5 to 13 factors, and 9 factors were chosen for the analysis presented in this paper because a higher number of factors provides only a marginal improvement in explaining the observed variability (Fig. S1†). Fig. 7 shows the PSD factors. These factors were then analyzed to assess whether they correspond to different PM sources, such as wildfires and traffic. It should be noted that the PMF results were found to be robust to measurement uncertainties, which was checked using 100 Monte Carlo simulations, where the input PSD were perturbed by 10% random errors (Fig. S2†).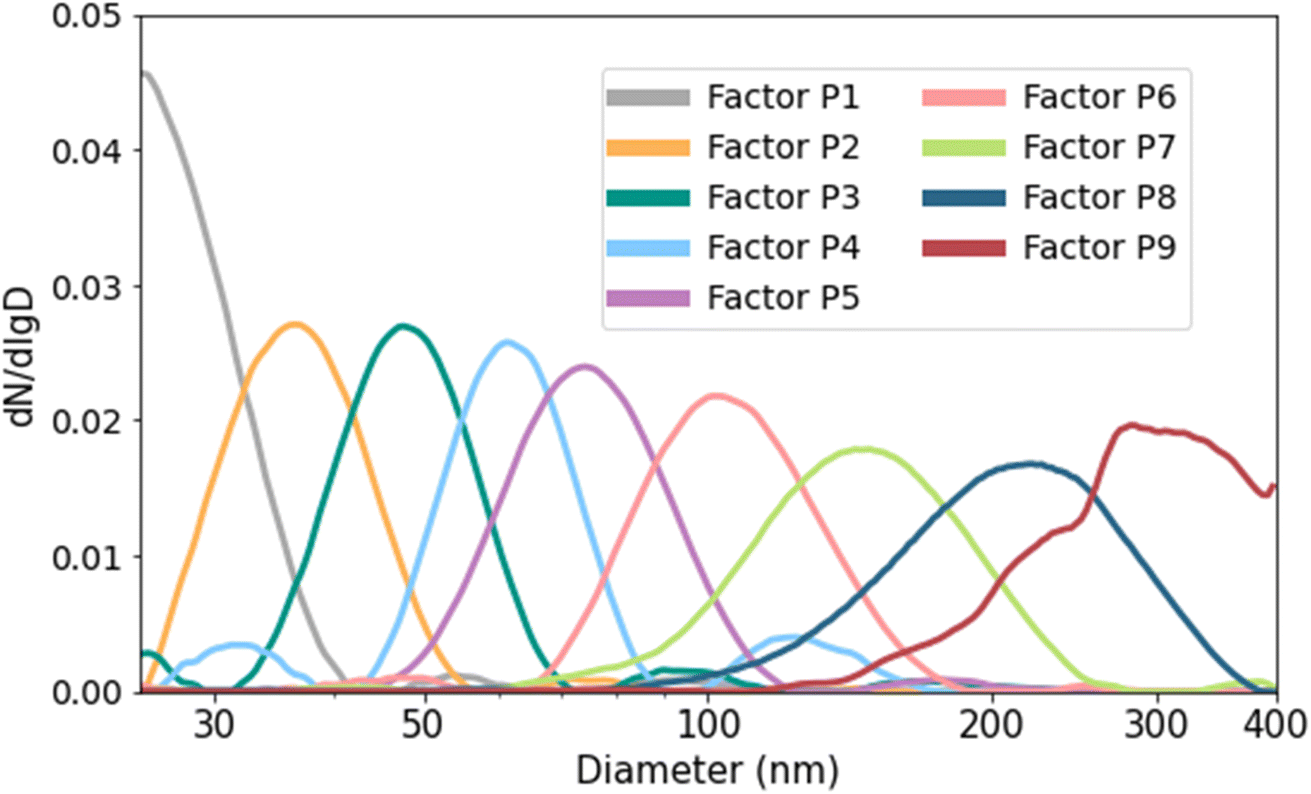 | ||
| Fig. 7 The normalized PSD of each factor in a nine-factor analysis during the whole study period. | ||
In addition to the PSD analysis, the EPA PMF was used to analyze daily pollutant concentrations (including PM2.5, CO, O3, NO, NO2, K, EC, and OC) collected from December 2015 to May 2022. The PMF factors were then fitted to hourly chemical data (including PM2.5, CO, O3, NO, NO2) using non-negative least squares (NNLS) to obtain hourly contributions of each of the PMF factors. Four factors were selected based on the results of error estimation analysis: no swap occurred in DISP, all factors had 100% mapping in BS, and a change in the goodness-of-fit parameter Q was less than 0.5% with no swap in BS-DISP.
Fig. 8 shows a comparison of PSD factor contributions during smoke-influenced days and all the other days 8. The letters “P” and “E” in front of the factor numbers stand for “PSD” and “EPA,” respectively, to distinguish factors from the Python PMF program using PSD data and the EPA PMF program using air pollutant concentrations. Contributions of Factor P8 and Factor P9 during the smoke-influenced days are significantly higher (p < 0.001) than during the other days, and therefore are likely to represent fire-emitted PSD. These factors have the largest modes and GMD, which agrees with the observation that the smoke-influenced days tended to have the mode and GMD at larger particle sizes than the baseline or other days (Fig. 4 and 6). The other factors likely represent PSD from traffic and other sources. Factor P7 had a slightly higher contribution during the smoke-influenced days than the other days, but it was excluded as a wildfire-related factor because it was considered representing a mixed source – such as a mixture of wildfire emissions, traffic emissions, and domestic wood-burning emissions – or that several sources could have a similar PSD.
 | ||
| Fig. 8 The boxplot of the contribution (weight) for each factor during smoke-influenced days (red) and non-smoke-influenced (baseline + other) days (gray). Wildfire-related factors are marked by an asterisk (*). | ||
Based on the species profile (Fig. 9; a detailed profile plot is provided in Fig. S3,† the uncertainty estimates are shown in Fig. S4†) and the contribution plots (Fig. S5†) from the EPA PMF, Factors 1 to 4 represent different emission sources. Factor E1, which is the EPA PMF wildfire-related factor, had the highest PM2.5 concentration along with the highest potassium and OC concentration. Potassium is often used as a tracer for wildfire emissions.82 The profile of Factor E2 is associated with ozone and had significant contributions during summer and low contributions during winter, indicating that this profile represents secondary sources. Factor E3 contributions showed a clear increase and decrease in winter and summer, respectively, following the variation of the vertical atmospheric mixing. The profile of Factor E3 displayed the highest values of NOX (NO + NO2) and CO. This suggests that Factor E3 is a traffic-related factor. Factor E4 had a similar contribution plot as Factor E1 but with higher contributions during winter and lower contributions during smoke-influenced months in 2017 and 2018. It had the highest EC, some OC and PM2.5, and a small amount of CO and NO2. This suggests that Factor E4 is a mixture of domestic wood burning and wildfire emissions. According to the results from the EPA PMF, during fire season (July, August, and September), wildfires (Factor E1) contributed 56% to 65% to PM2.5 concentrations, 18% to 26% to CO concentrations (Fig. S6†). This also demonstrates the significant contribution of wildfires to PM2.5 concentrations during the fire season.
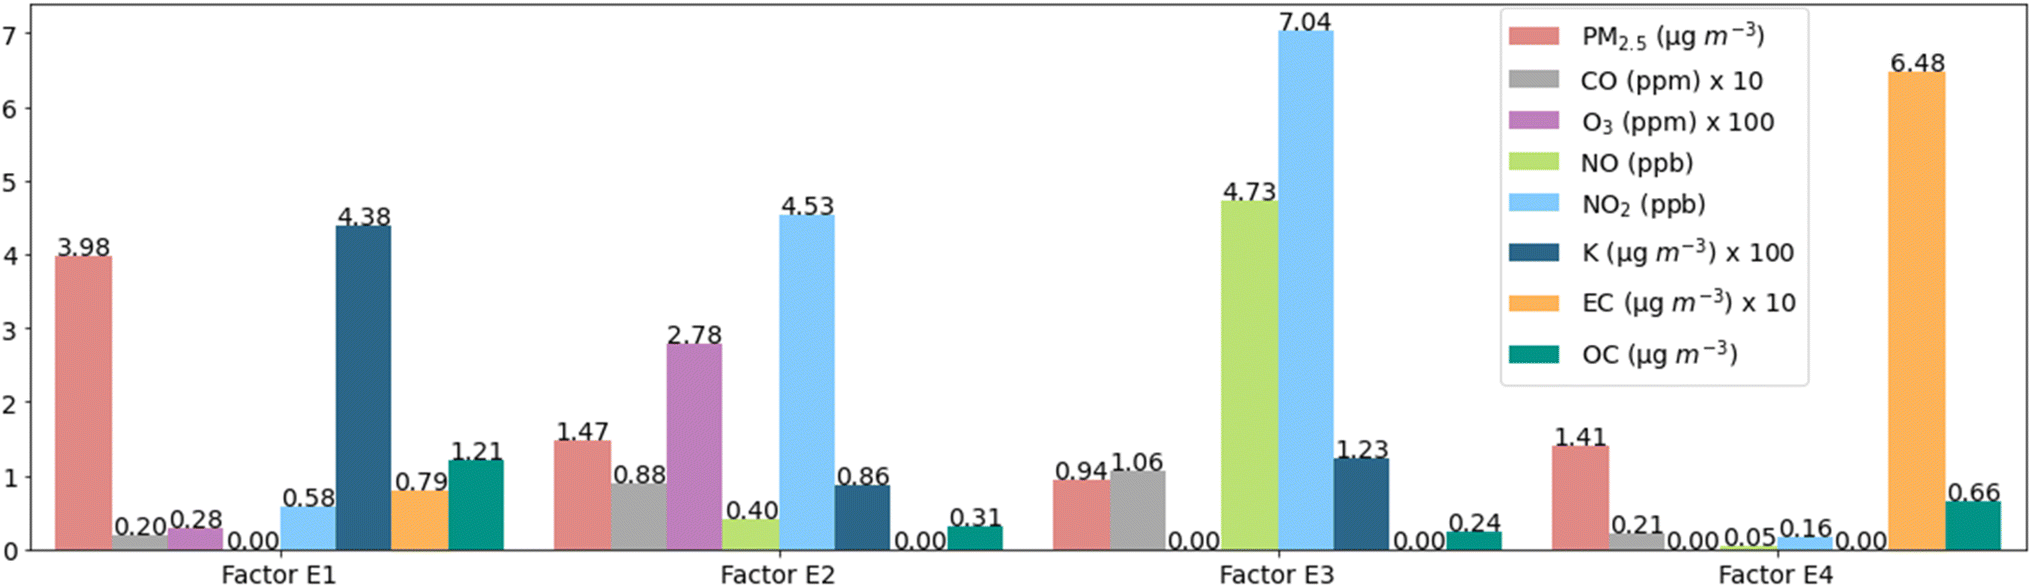 | ||
| Fig. 9 Species profile of the EPA PMF for all four factors. The approximated values of the profile are displayed on the top. O3, K, and EC were multiplied by 10 or 100 to make them easier to see. | ||
The contribution of the wildfire-related factor (Factor E1) from the EPA PMF was compared with the nine PSD factors to confirm the relationship between PSD and wildfires (Fig. 10). The temporal variability of the two wildfire-related PSD factors (Factors P9 and P8) had strong correlations with the temporal variability of the EPA PMF wildfire-related factor (Fig. 10j), with correlation coefficients of 0.84 and 0.72 respectively. This further confirms that Factor P9 and Factor P8 are very likely wildfire related. The differences between Factor P8 and Factor P9 could be caused by different distances between fires and the measurement location: a larger distance from fire can lead to larger particles due to the growth and formation of particles during the transport.83,84 In this study, isolation and quantification of distance-specific effects was challenging due to the frequent concurrent influence of multiple wildfires at varying distances on the measurement site. This will be the subject of a follow-up study.
 | ||
| Fig. 10 Hourly contribution plots of (a)–(i) factors from PSD PMF and (j) the wildfire-related factor from EPA PMF. The shadowed area represents the smoke-influenced days. | ||
Factor P7 in PSD PMF had similar contributions in August 2020 as the EPA PMF wildfire-related factor, but it had higher contributions during winter compared to the EPA PMF wildfire-related factor, which suggested that it contained other emission sources in winter, such as traffic and domestic wood burning. In addition, the correlation coefficient between Factor P7 and the EPA PMF wildfire-related factor was rather low (0.33). Therefore, Factor P7 likely represents a mixture of different sources. All non-fire-related PSD PMF factors did not match the EPA PMF wildfire-related factor (the correlation coefficient ranged from −0.14 to −0.0048). It should be noted that the Python PMF applied to the EPA data produces fire-related factors that correlate well with those from the EPA PMF (Fig. S7†). This further confirms that the two factors with the largest GMD are associated with wildfire emissions.
The impact of wildfires on air quality in Reno, NV, is notable when observing the monthly averaged data of PM2.5 and other air pollutant concentrations averaged over 6.5 years (December 2015 to May 2022), as presented in Fig. 11. The contributions of each factor from EPA PMF are also shown in the plot. The differences between the sum of factor contributions and the ambient concentrations are due to the residual matrix (E). For comparison, the pollutant concentrations measured in 2019, a relatively smoke-free year, are also shown in Fig. 11 to indicate monthly variations with little to no wildfire impact.
 | ||
| Fig. 11 Monthly averaged daily pollutant ((a) PM2.5, (b) O3, (c) NOX, and (d) CO) concentrations during 2015 to 2022 with EPA PMF contributions of each factor and 2019 in Reno, NV. The wildfire-related factor is indicated by an asterisk (*). | ||
During fire months (mainly July, August, and September in Reno, NV), especially during August and September, the mean PM2.5 concentration showed a clear increase over the 2019 concentration (by 113%, 234%, and 186% in July, August, and September, respectively), with the difference closely matching the contribution of the wildfire factor and the average sum of three non-wildfire factors (Factor E2, E3, and E4) being comparable to the 2019 values. Winter PM2.5 monthly mean concentrations were high, but still lower than concentrations during the fire months. The seasonal profile of PM2.5 concentrations in the winter followed the atmospheric mixing-driven influence of local sources.85 On a yearly basis, wildfires contributed 35–47% of PM2.5 concentrations in Reno, NV from 2016 to 2021 (the data for 2015 and 2022 covers less than a full year).
The highest concentrations of O3 were in summer (June, July, and August) and the lowest concentrations were in winter. The seasonal variations of O3 follow the photochemical activity,86–88 which is strongest in summer and weakest in winter. Wildfire emissions had a smaller contribution to O3 than to PM2.5 concentrations, as indicated by Factor E1, with increases ranging from 11% to 20% from July to September. This finding aligns with the observations reported by McClure & Jaffe.89 Wildfire emissions can contribute to photochemical reactions,90 which could contribute to O3 production. The yearly contribution of wildfire emissions to O3 concentration is estimated to be 6% to 13% during 2016–2021.
The increases in CO concentrations attributable to wildfire contributions were also relatively modest, ranging from 18% to 26% from July to September and 5% to 12% on an annual basis from 2016 to 2021. In contrast, no significant change was observed in the NOX concentration trend. In winter (December, January, and February), especially in December and January, NOX and CO concentrations were highest, reaching 36.89 ppb and 0.38 ppm in December, respectively. In general, NOX and CO seasonal profiles could be explained by seasonal variation in vertical atmospheric mixing. During winter months, atmospheric mixing is weakest,85 leading to the accumulation of pollution from local combustion sources, such as traffic.
4. Conclusion
In this study, ambient measurements in Reno, NV, from July 2017 to October 2020 were used to identify differences in PSD and air pollutant concentrations between smoke-influenced days and the non-smoke-influenced days. A PMF method was applied to identify the main source contributions, as well as the PSD and pollutant profiles corresponding to these sources. Wind back-trajectories and satellite images were used to identify the smoke-influenced days.A comparison between smoke-influenced and non-smoke-influenced days shows that wildfires have a significant influence on PSD and air pollutant concentrations. In this study, the smoke-influenced days were characterized by substantially and statistically significantly larger GMD and higher Vtot and PM2.5 concentrations than the non-smoke-influenced days. The average number GMD during the smoke-influenced days (139 nm) was approximately two times larger than that during the non-smoke-influenced days (72 nm). The smoke-influenced days showed an average PM2.5 concentration (31 μg m−3) approximately four times higher than that of non-smoke-influenced days (7 μg m−3).
The PMF techniques successfully separated wildfire emissions from other sources using both PSD data and the air pollutant concentrations. During the fire months (July, August, and September), between 52% to 58% of PM2.5 concentrations, 14% to 23% of CO concentrations, and 10% to 19% of O3 concentrations were attributed to wildfire emissions according to the PMF analysis. On an annual basis, wildfire emissions contributed 35% to 47% of PM2.5 concentrations, 5% to 12% of CO concentrations, and 6% to 13% of O3 concentrations.
Data availability
Part of the data supporting this article (information on fires) has been included as part of the ESI.† Particle size distribution data used in this article are available at Zenodo at https://doi.org/10.5281/zenodo.14740744.Author contributions
Siying Lu: writing – original draft, writing – review & editing, conceptualization, formal analysis, software, visualization. Chiranjivi Bhattarai: data curation, investigation. Vera Samburova: writing – review & editing, funding acquisition. Andrey Khlystov: writing – original draft, writing – review & editing, conceptualization, software, supervision, funding acquisition.Conflicts of interest
There are no conflicts to declare.Acknowledgements
This work was supported by the NIH [grant no. R01ES029528] and NSF EPSCoR RII Track1: Harnessing the Data Revolution for Fire Science (HDRFS) [grant no. OIA-2148788]. The authors thank Dr Hans Moosmüller (Desert Research Institute, Reno, NV, USA) and Nicole Damon for manuscript editing.References
- J. E. Penner, R. E. Dickinson and C. A. O'Neill, Science, 1992, 256, 1432–1434 CrossRef CAS PubMed.
- P. Chylek and J. Wong, Geophys. Res. Lett., 1995, 22, 929–931 CrossRef.
- IPCC, Climate Change 2007 The Physical Science Basis, 2007, vol. 59 Search PubMed.
- M. O. Andreae and D. Rosenfeld, Earth-Sci. Rev., 2008, 89, 13–41 CrossRef.
- S. Twomey, J. Atmos. Sci., 1977, 34, 1149–1152 CrossRef.
- EPA, Criteria Air Pollutants, https://www.epa.gov/criteria-air-pollutants.
- D. Kiser, W. J. Metcalf, G. Elhanan, B. Schnieder, K. Schlauch, A. Joros, C. Petersen and J. Grzymski, Environ. Health: Global Access Sci. Source, 2020, 19, 1–12 CrossRef PubMed.
- WHO, WHO Air Quality Guidelines for Particulate Matter, Ozone, Nitrogen Dioxide and Sulfur Dioxide, 2005 Search PubMed.
- A. I. Miranda, Int. J. Wildland Fire, 2004, 13, 217–226 CrossRef.
- J. G. Watson, J. Air Waste Manage. Assoc., 2002, 52, 628–713 CrossRef PubMed.
- C. A. Pope and D. W. Dockery, J. Air Waste Manage. Assoc., 2006, 56, 709–742 CrossRef CAS PubMed.
- K. Moeltner, M. K. Kim, E. Zhu and W. Yang, J. Environ. Econ. Manag., 2013, 66, 476–496 CrossRef.
- A. S. Holden, A. P. Sullivan, L. A. Munchak, S. M. Kreidenweis, B. A. Schichtel, W. C. Malm and J. L. Collett, Atmos. Environ., 2011, 45, 1986–1993 CrossRef CAS.
- A. L. Westerling, H. G. Hidalgo, D. R. Cayan and T. W. Swetnam, Science, 2006, 313, 940–943 CrossRef CAS PubMed.
- P. E. Dennison, S. C. Brewer, J. D. Arnold and M. A. Moritz, Geophys. Prospect., 2014, 6298–6305 Search PubMed.
- M. F. Wehner, J. R. Arnold, T. Knutson, K. E. Kunkel and A. N. LeGrande, in Climate Science Special Report: Fourth National Climate Assessment, U.S. Global Change Research Program, 2017, pp. 231–256 Search PubMed.
- I. Veselovskii, D. N Whiteman, M. Korenskiy, A. Suvorina, A. Kolgotin, A. Lyapustin, Y. Wang, M. Chin, H. Bian, T. L. Kucsera, D. Pérez-Ramírez and B. Holben, Atmos. Chem. Phys., 2015, 15, 1647–1660 CrossRef CAS.
- J. V. Niemi, H. Tervahattu, H. Vehkamäki, J. Martikainen, L. Laakso, M. Kulmala, P. Aarnio, T. Koskentalo, M. Sillanpää and U. Makkonen, Atmos. Chem. Phys., 2005, 5, 2299–2310 CrossRef CAS.
- U. Makkonen, H. Hellén, P. Anttila and M. Ferm, Sci. Total Environ., 2010, 408, 644–651 CrossRef CAS PubMed.
- X. Yang, C. Zhao, Y. Yang, X. Yan and H. Fan, Atmos. Chem. Phys., 2021, 21, 3833–3853 CrossRef CAS.
- J. S. Reid and P. V. Hobbs, J. Geophys. Res.:Atmos., 1998, 103, 32013–32030 CrossRef.
- R. J. Yokelson, S. P. Urbanski, E. L. Atlas, D. W. Toohey, E. C. Alvarado, J. D. Crounse, P. O. Wennberg, M. E. Fisher, C. E. Wold, T. L. Campos, K. Adachi, P. R. Buseck and W. M. Hao, Emissions from Forest Fires Near Mexico City, 2007, vol. 7 Search PubMed.
- X. Li, X. Xia, J. Song, Y. Wu, X. Zhang and R. Zhang, Aerosol Air Qual. Res., 2017, 17, 965–974 CrossRef CAS.
- N. Chubarova, Y. Nezval, I. Sviridenkov, A. Smirnov and I. Slutsker, Atmos. Meas. Tech., 2012, 5, 557–568 CrossRef.
- E. Alonso-Blanco, A. Castro, A. I. Calvo, V. Pont, M. Mallet and R. Fraile, Sci. Total Environ., 2018, 619–620, 988–1002 CrossRef CAS PubMed.
- G. G. Pfister, C. Wiedinmyer and L. K. Emmons, Geophys. Res. Lett., 2008, 35, 1–5 CrossRef.
- A. Heaney, J. D. Stowell, J. C. Liu, R. Basu, M. Marlier and P. Kinney, GeoHealth, 2022, 6, 1–14 CrossRef PubMed.
- S. Deflorio-Barker, J. Crooks, J. Reyes and A. G. Rappold, Environ. Health Perspect., 2019, 127, 037006 CrossRef CAS PubMed.
- A. Jiao, K. Headon, T. Han, W. Umer and J. Wu, Sci. Total Environ., 2024, 907, 168134 CrossRef CAS PubMed.
- Y. Jiang, X. Q. Yang, X. Liu, Y. Qian, K. Zhang, M. Wang, F. Li, Y. Wang and Z. Lu, J. Clim., 2020, 33, 3351–3366 Search PubMed.
- Y. Liu, S. Goodrick and W. Heilman, For. Ecol. Manage., 2014, 317, 80–96 CrossRef.
- T. S. Carter, C. L. Heald, J. L. Jimenez, P. Campuzano-Jost, Y. Kondo, N. Moteki, J. P. Schwarz, C. Wiedinmyer, A. S. Darmenov, A. M. Da Silva and J. W. Kaiser, Atmos. Chem. Phys., 2020, 20, 2073–2097 CrossRef CAS.
- IPCC, Climate Change 2007 Synthesis Report, 2007 Search PubMed.
- Y. Hoegh-Guldberg, O. Jacob, D. Bindi, M. Brown, S. Camillon, i I. Diedhiou, A. Djalante, R. Ebi, K. Engelbrecht, F. Guiot and J. Hijioka, in Global Warming of 1.5 °C: An IPCC Special Report, IPCC Secretariat, 2018, pp. 175–311 Search PubMed.
- A. Lacis, J. Hansen and M. Sato, Geophys. Res. Lett., 1992, 19, 1607–1610 CrossRef.
- S. Nemesure, R. Wagener and S. E. Schwartz, J. Geophys. Res., 1995, 100, 26105–26116 CrossRef.
- J. Londahl, J. Pagels, C. Boman, E. Swietlicki, A. Massling, J. Rissler, A. Blomberg, M. Bohgard and T. Sandstrom, Inhalation Toxicol., 2008, 20, 923–933 CrossRef PubMed.
- I. A. Podgorny, F. Li and V. Ramanathan, Geophys. Res. Lett., 2003, 30, 1028 Search PubMed.
- A. Molnár and E. Mészáros, Atmos. Environ., 2001, 35, 5053–5058 CrossRef.
- U. Dusek, G. P. Frank, L. Hildebrandt, J. Curtius, J. Schneider, S. Walter, D. Chand, F. Drewnick, S. Hings, D. Jung, S. Borrmann and M. O. Andreae, Science, 2006, 312, 1375–1378 CrossRef CAS PubMed.
- A. Bougiatioti, S. Bezantakos, I. Stavroulas, N. Kalivitis, P. Kokkalis, G. Biskos, N. Mihalopoulos, A. Papayannis and A. Nenes, Atmos. Chem. Phys., 2016, 16, 7389–7409 CrossRef CAS.
- G. Zheng, A. J. Sedlacek, A. C. Aiken, Y. Feng, T. B. Watson, S. Raveh-Rubin, J. Uin, E. R. Lewis and J. Wang, Environ. Int., 2020, 139, 105680 CrossRef CAS PubMed.
- R. Garaga, S. Gokhale and S. H. Kota, Chemosphere, 2020, 255, 126980 CrossRef CAS PubMed.
- G. R. McMeeking, S. M. Kreidenweis, C. M. Carrico, T. Lee, J. L. Collett and W. C. Malm, J. Geophys. Res. Atmos., 2005, 110, 1–11 Search PubMed.
- L. I. Kleinman, A. J. Sedlacek, K. Adachi, P. R. Buseck, S. Collier, M. K. Dubey, A. L. Hodshire, E. Lewis, T. B. Onasch, J. R. Pierce, J. Shilling, S. R. Springston, J. Wang, Q. Zhang, S. Zhou and R. J. Yokelson, Atmos. Chem. Phys., 2020, 20, 13319–13341 CrossRef CAS.
- N. A. June, A. L. Hodshire, E. B. Wiggins, E. L. Winstead, C. E. Robinson, K. L. Thornhill, K. J. Sanchez, R. H. Moore, D. Pagonis, H. Guo, P. Campuzano-Jost, J. L. Jimenez, M. M. Coggon, J. M. Dean-Day, T. P. Bui, J. Peischl, R. J. Yokelson, M. J. Alvarado, S. M. Kreidenweis, S. H. Jathar and J. R. Pierce, Atmos. Chem. Phys., 2022, 22, 12803–12825 CrossRef CAS.
- J. R. Laing, D. A. Jaffe and J. R. Hee, Atmos. Chem. Phys., 2016, 16, 15185–15197 CrossRef CAS.
- H. C. Phuleria, P. M. Fine, Y. Zhu and C. Sioutas, J. Geophys. Res.:Atmos., 2005, 110, 1–11 CrossRef.
- R. Okoshi, A. Rasheed, G. Chen Reddy, C. P. McCrowey and D. B. Curtis, Atmos. Environ., 2014, 89, 392–402 CrossRef CAS.
- United States Census Bureau, https://www.census.gov/.
- U.S. Climate Data, https://www.usclimatedata.com/.
- M. Gyawali, W. P. Arnott, R. A. Zaveri, C. Song, H. Moosmüller, L. Liu, M. I. Mishchenko, L. W. A. Chen, M. C. Green, J. G. Watson and J. C. Chow, Atmos. Chem. Phys., 2012, 12, 2587–2601 CrossRef CAS.
- S. M. Loría-Salazar, W. P. Arnott and H. Moosmüller, J. Geophys. Res.:Atmos., 2014, 119, 11355–11374 Search PubMed.
- S. Zhong, J. Li, C. B. Clements, S. F. J. de Wekker and X. Bian, J. Appl. Meteorol. Climatol., 2008, 47, 339–350 CrossRef.
- M. Gyawali, W. P. Arnott, K. Lewis and H. Moosmüller, Atmos. Chem. Phys., 2009, 9, 8007–8015 CrossRef CAS.
- U.S. Environmental Protection Agency, Air Data: Air Quality Data Collected at Outdoor Monitors Across the US, https://www.epa.gov/outdoor-air-quality-data.
- A. F. Stein, R. R. Draxler, G. D. Rolph, B. J. B. Stunder, M. D. Cohen and F. Ngan, Bull. Am. Meteorol. Soc., 2015, 96, 2059–2077 CrossRef.
- National Oceanic and Atmospheric Administration, Air Resources Laboratory - HYSPLIT - Hybrid Single Particle Lagrangian Integrated Trajectory model, https://www.ready.noaa.gov/HYSPLIT.php.
- U.S. Environmental Protection Agency, Ecoregions, https://www.epa.gov/eco-research/ecoregions.
- F. Pedregosa, G. Varoquaux, A. Gramfort, V. Michel, B. Thirion, O. Grisel, M. Blondel, P. Prettenhofer, R. Weiss, V. Dubourg, J. Vanderplas, A. Passos, D. Cournapeau, M. Boucher, M. Perrot and E. Douchesnay, J. Mach. Learn. Res., 2011, 12, 2825–2830 Search PubMed.
- F. Ikemori, K. Uranishi, D. Asakawa, R. Nakatsubo, M. Makino, M. Kido, N. Mitamura, K. Asano, S. Nonaka, R. Nishimura and S. Sugata, Atmos. Pollut. Res., 2021, 12, 162–172 CrossRef CAS.
- C. F. Isley and M. P. Taylor, Environ. Pollut., 2020, 267, 115400 CrossRef CAS PubMed.
- J. M. Jaeckels, M. S. Bae and J. J. Schauer, Environ. Sci. Technol., 2007, 41, 5763–5769 CrossRef CAS PubMed.
- E. Kim, P. K. Hopke and E. S. Edgerton, J. Air Waste Manage. Assoc., 2003, 53, 731–739 CrossRef CAS PubMed.
- K. G. Paterson, J. L. Sagady, D. L. Hooper, S. B. Bertman, M. A. Carroll and P. B. Shepson, Environ. Sci. Technol., 1999, 33, 635–641 CrossRef CAS.
- U. M. Sofowote, H. Hung, A. K. Rastogi, J. N. Westgate, P. F. Deluca, Y. Su and B. E. McCarry, Atmos. Environ., 2011, 45, 967–976 CrossRef CAS.
- P. Paatero and U. Tapper, Analysis of Different Modes of Factor Analysis as Least Squares Fit Problems, 1993, vol. 18 Search PubMed.
- P. Paatero and U. Tapper, Environmetrics, 1994, 5, 111–126 CrossRef.
- A. Reff, S. I. Eberly and P. V. Bhave, J. Air Waste Manage. Assoc., 2007, 57, 146–154 CrossRef CAS PubMed.
- CALFIRE, Statistics, https://www.fire.ca.gov/our-impact/statistics.
- H. Portin, T. Mielonen, A. Leskinen, A. Arola, E. Pärjälä, S. Romakkaniemi, A. Laaksonen, K. E. J. Lehtinen and M. Komppula, Atmos. Environ., 2012, 47, 269–278 CrossRef CAS.
- E. Alonso-Blanco, A. I. Calvo, R. Fraile and A. Castro, Sci. World J., 2012, 2012, 1–13 CrossRef PubMed.
- K. O’Dell, B. Ford, E. V. Fischer and J. R. Pierce, Environ. Sci. Technol., 2019, 53, 1797–1804 CrossRef PubMed.
- D. A. Jaffe, B. Schnieder and D. Inouye, Atmos. Chem. Phys., 2022, 22, 12695–12704 CrossRef CAS.
- X. Wang, A. Khlystov, K. Ho, D. Campbell, J. C. Chow, S. D. Kohl, J. G. Watson, S. F. Lee, L. A. Chen, M. Lu, S. Sai and H. Ho, Res. Reports Heal. Eff. Inst. Search PubMed.
- J. Sandradewi, A. S. H. Prévôt, E. Weingartner, R. Schmidhauser, M. Gysel and U. Baltensperger, Atmos. Environ., 2008, 42, 101–112 CrossRef CAS.
- K. M. Sakamoto, J. D. Allan, H. Coe, J. W. Taylor, T. J. Duck and J. R. Pierce, Atmos. Chem. Phys., 2015, 15, 1633–1646 CrossRef CAS.
- R. H. Moore, E. B. Wiggins, A. T. Ahern, S. Zimmerman, L. Montgomery, P. Campuzano Jost, C. E. Robinson, L. D. Ziemba, E. L. Winstead, B. E. Anderson, C. A. Brock, M. D. Brown, G. Chen, E. C. Crosbie, H. Guo, J. L. Jimenez, C. E. Jordan, M. Lyu, B. A. Nault, N. E. Rothfuss, K. J. Sanchez, M. Schueneman, T. J. Shingler, M. A. Shook, K. L. Thornhill, N. L. Wagner and J. Wang, Atmos. Meas. Tech., 2021, 14, 4517–4542 CrossRef CAS.
- P. Ortiz-Amezcua, J. Luis Guerrero-Rascado, M. J. Granados-Munõz, J. A. Benavent-Oltra, C. Böckmann, S. Samaras, I. S. Stachlewska, L. Janicka, H. Baars, S. Bohlmann and L. Alados-Arboledas, Atmos. Chem. Phys., 2017, 17, 5931–5946 CrossRef CAS.
- L. A. Remer, Y. J. Kaufman, B. N. Holben, A. M. Thompson and D. McNamara, J. Geophys. Res.:Atmos., 1998, 103, 31879–31891 CrossRef CAS.
- N. Luo, Y. Zhang, Y. Jiang, C. Zuo, J. Chen, W. Zhao, W. Shi and X. Yan, Environ. Pollut., 2024, 348, 123838 CrossRef CAS PubMed.
- J. Li, M. Pósfai, P. V. Hobbs and P. R. Buseck, J. Geophys. Res.:Atmos., 2003, 108, 1–12 Search PubMed.
- M. J. Gunsch, S. A. Schmidt, D. J. Gardner, A. L. Bondy, N. W. May, S. B. Bertman, K. A. Pratt and A. P. Ault, Atmos. Environ., 2018, 178, 255–264 CrossRef CAS.
- V. M. Kerminen, X. Chen, V. Vakkari, T. Petäjä, M. Kulmala and F. Bianchi, Environ. Res. Lett., 2018, 13, 103003 CrossRef.
- K. M. Chan and R. Wood, J. Geophys. Res.:Atmos., 2013, 118, 12422–12434 Search PubMed.
- C. A. Cardelino and W. L. Chameides, J. Geophys. Res., 1990, 95, 13971–13979 CrossRef CAS.
- S. Sillman and P. J. Samson, J. Geophys. Res., 1995, 100, 11497–11508 CrossRef CAS.
- S. Sillman, J. A. Logan and S. C. Wofsy, J. Geophys. Res., 1990, 95, 1837–1851 CrossRef.
- C. D. McClure and D. A. Jaffe, Atmos. Environ., 2018, 194, 146–157 CrossRef CAS.
- M. A. Robinson, Z. C. J. Decker, K. C. Barsanti, M. M. Coggon, F. M. Flocke, A. Franchin, C. D. Fredrickson, J. B. Gilman, G. I. Gkatzelis, C. D. Holmes, A. Lamplugh, A. Lavi, A. M. Middlebrook, D. M. Montzka, B. B. Palm, J. Peischl, B. Pierce, R. H. Schwantes, K. Sekimoto, V. Selimovic, G. S. Tyndall, J. A. Thornton, P. Van Rooy, C. Warneke, A. J. Weinheimer and S. S. Brown, Environ. Sci. Technol., 2021, 55, 10280–10290 CrossRef CAS PubMed.
Footnote |
| † Electronic supplementary information (ESI) available. See DOI: https://doi.org/10.1039/d5ea00007f |
| This journal is © The Royal Society of Chemistry 2025 |