
 Open Access Article
 This Open Access Article is licensed under a Creative Commons Attribution-Non Commercial 3.0 Unported Licence
Generation of molecular conformations using generative adversarial neural networks†
Congsheng
Xu
ab,
Xiaomei
Deng
b,
Yi
Lu
b and
Peiyuan
Yu
 *b
*b
aSchool of Chemistry and Chemical Engineering, Harbin Institute of Technology, Harbin 150001, China
bDepartment of Chemistry and Shenzhen Grubbs Institute, Research Center for Chemical Biology and Omics Analysis, College of Science, Southern University of Science and Technology, Shenzhen 518055, China. E-mail: yupy@sustech.edu.cn
First published on 19th November 2024
Abstract
The accurate determination of a molecule's accessible conformations is key to the success of studying its properties. Traditional computational methods for exploring the conformational space of molecules such as molecular dynamics simulations, however, require substantial computational resources and time. Recently, deep generative models have made significant progress in various fields, harnessing their powerful learning capabilities for complex data distributions. This makes them highly applicable in molecular conformation generation. In this study, we developed ConfGAN, a conformation generation model based on conditional generative adversarial networks. We designed an efficient molecular-motif graph representation, treating molecules composed of functional groups, capturing interactions between groups, and providing rich chemical prior knowledge for conformation generation. During adversarial training, the generator network takes molecular graphs as input and attempts to generate stable conformations with minimal potential energy. The discriminator provides feedback based on energy differences, guiding the generation of conformations that comply with chemical rules. This model explicitly encodes molecular knowledge, ensuring the physical plausibility of generated conformations. Through extensive evaluation, ConfGAN has demonstrated superior performance compared to existing deep learning-based models. Furthermore, conformations generated by ConfGAN have demonstrated potential applications in related fields such as molecular docking and electronic property calculations.
Introduction
Molecular conformation refers to the different three-dimensional arrangements of atoms within a molecule through the rotation of single bonds. Due to various degrees of freedom such as bond rotations and group rotations, molecules can have multiple distinct three-dimensional structures, which significantly influence the physical, chemical and biological properties of molecules.1,2 For instance, in computer-aided drug design, the selection and optimization of molecular conformations can affect the interaction between drug molecules and receptors.3,4 In computational studies of chemical reaction mechanisms, molecular conformation not only affects the reactivity and stability of reactants but also alters the structure and energy of the transition states.5,6 Therefore, optimizing and controlling molecular conformations can help researchers better understand the interactions between molecules and the mechanisms of reactions, leading to the design of new drugs and more efficient and selective chemical reactions. Experimentally determining molecular conformations typically involves methods such as X-ray crystallography, nuclear magnetic resonance (NMR) spectroscopy, infrared spectroscopy, and Raman spectroscopy.7–10 However, these techniques require high-quality instruments and expertise, resulting in high costs in terms of manpower and resources. Alternatively, determining molecular conformations through computational simulations is a fast and cost-effective approach. Common methods include molecular dynamics, Monte Carlo methods, and quantum mechanics.11–14 Molecular dynamics is a computationally efficient method suitable for studying long-term motion and thermal equilibrium processes of molecules. However, the probability of conformation sampling is determined by the Boltzmann distribution, so sampling rare events requires significant simulation time.15,16 In contrast, Monte Carlo methods can rapidly generate a wide range of conformations in a relatively short time, but the precision of results may not be as high as those of other methods due to their stochastic nature.11,17 Quantum mechanics-based methods can accurately calculate the energy of conformations, providing conformational information that matches or exceeds experimental results.14 However, the associated computational cost is enormous.18 Moreover, for existing traditional computational methods, the time required to obtain conformations increases exponentially as the system's degrees of freedom increase, making them unsuitable for large-scale rapid screening.Recently, there has been strong interest in deep learning-based generative algorithms, which have been applied in content generation tasks such as ChatGPT.19,20 These algorithms can learn the distribution of existing data and then generate new data similar to the original. Interestingly, generative models have also been applied in the generation of molecular conformations. GraphDG is an early-developed model that combines Variational Autoencoders (VAEs) and Distance Geometry (DG) theory to generate molecular conformations.21–23 However, this model overlooks the fact that each molecule may have multiple stable conformations around certain thermodynamically stable states, and the graph neural networks used struggle to capture long-range dependencies between atoms.24 Subsequently, methods such as CGCF, ConfVAE, ConfGF, GeoMol, SDEgen and GeoDiff were proposed.25–30 The CGCF model is a conditional graph continuous flow generative model that utilizes flow-based models to better learn the complex distribution of molecular conformations. It optimizes the generated conformations using an MCMC procedure combined with an energy-based bias model, resulting in stable conformations. The ConfVAE model is based on a conditional variational autoencoder framework and uses bilevel optimization to directly generate the three-dimensional structure of molecules, avoiding potential error accumulation in the step-by-step generation process. The ConfGF model, inspired by traditional force field methods in molecular dynamics simulations, directly estimates the gradient field of atomic coordinates' logarithmic density, generating stable conformations through Langevin dynamics. GeoMol predicts the dihedral angles and angles of molecular fragments and then assembles them to generate conformations. GeoDiff uses a diffusion-based approach to directly predict atomic coordinates and generate conformations. These methods can quickly generate molecular conformations and have shown improved efficiency in drug screening tests. However, there are still many issues that need to be addressed. For example, the current methods for obtaining molecular information are based on graph neural networks, which provide limited information molecular structures. The models only consider geometric relationships and do not incorporate chemical knowledge, resulting in inaccurate bond lengths, incorrect chiral information, and unrealistic structures in the conformations generated.
To address the aforementioned issues, this study developed a molecular conformation generation model named ConfGAN, which is based on Generative Adversarial Networks (GANs).31 GANs have already shown considerable potential in the field of molecular design. For example, MolGAN, designed by Cao and Kipf, achieved a nearly 100% valid compound generation rate in experiments with the QM9 chemical database.32 Additionally, LatentGAN, proposed by Prykhodko and colleagues, combines autoencoders and generative adversarial networks to generate a large number of new compounds, with drug similarity scores comparable to those of the training set.33 To enhance molecular encoding, we extend beyond the conventional molecular graph representation and introduce a molecular-motif graph neural network (MM-GNN). By incorporating a molecular-motif isomeric graph neural network, we capture a more comprehensive understanding of the intricate relationships within molecules, surpassing the limitations of using the molecular graph alone. To generate more accurate interatomic distances, we incorporate a pseudo-force field into the loss function, which includes a function for Lennard-Jones potential and bond energies. The parameters of the pseudo-force field are obtained from the Universal Force Field (UFF), ensuring that the atomic bond distances adhere to chemical rules.34 To address the issue of neglecting stereochemistry in previous methods, we introduce volume violation during the conformation generation stage.35 Through testing, our method can generate diverse conformations and accurately produce the lowest-energy conformations for low-degree-of-freedom molecules. Furthermore, through benchmark tests and comparisons of the generation of lowest-energy conformations, our method outperforms other generative models. Finally, we apply this method to the generation of initial conformations in molecular docking and molecular property calculations, further demonstrating its potential applications in drug discovery and related fields.
Results and discussion
Overview of the ConfGAN model
ConfGAN is a model based on Conditional Generative Adversarial Networks (CGANs) designed for generating molecular conformations (see Fig. 1). The model includes a generator and a discriminator, both implemented using multilayer perceptrons. The generator's task is to convert the molecular topology into a geometric structure, taking molecular representations and Gaussian noise as input. The discriminator evaluates whether the generated molecular conformations are physically plausible by comparing the potential energy of the generated and real conformations. The potential energy is calculated from the Lennard-Jones potential for non-bonded interactions and the harmonic potential for bonded interactions. The Lennard-Jones potential describes non-bonded forces such as van der Waals forces, while the harmonic potential describes bonded interactions such as bond length, bond angle, and dihedral angle. The discriminator provides feedback to the generator regarding the physical plausibility of the conformations by assessing the potential energy. During training, the generator and discriminator are optimized through adversarial training: the generator strives to produce conformations deemed reasonable by the discriminator, while the discriminator enhances its ability to distinguish real from generated conformations. Through this process, the model incrementally improves the quality of generated molecular conformations, making them closer to real molecules. | ||
| Fig. 1 Overview of the ConfGAN model. Given a molecule, the concatenated atomic embeddings are obtained as conditional information from the MM-GNN. In the generator part, the conditional information and Gaussian noise are used as inputs to generate the interatomic distances (d′) and calculate the generated molecular potential energy (U(d′)). In the discriminator part, the conditional information is concatenated with the real and generated molecular potential energy and used as input for updating the network weights. Finally, the generated interatomic distances are used to obtain the three-dimensional conformation through distance geometry theory and chirality volume violation. | ||
For molecular representation, we constructed a Motif-Molecular Graph Neural Network (MM-GNN), where the molecules are represented by a molecular graph and a motif graph. In the molecular graph, atoms are nodes and chemical bonds are edges, effectively describing the basic topology and direct connections between atoms. However, molecules contain functional groups or motifs with significant chemical properties and functions. Therefore, we introduced the concept of a motif graph, extracting key motifs (such as hydroxyl, carboxyl, and aromatic rings) as new nodes to build the motif graph. These motifs reflect the higher-order structural features of the molecule; for example, the presence of a hydroxyl group (–OH) often implies higher solubility due to its ability to form hydrogen bonds with water molecules. We use a message-passing mechanism to update node features, employing Gated Recurrent Units (GRUs) for node feature updates. The message-passing process involves three stages: message construction, message aggregation, and node feature updating.
In the conformation generation phase, we use the Euclidean Distance Geometry (EDG) algorithm to reconstruct the 3D coordinates of atoms from the distance matrix generated by the generator. During this process, we also consider chirality information to ensure that the generated molecular conformations have the correct spatial configuration.21
Performance testing of ConfGAN
We trained ConfGAN for 500 epochs and tracked the model's ability to generate conformations at the 5th, 50th, and 500th epochs. We randomly selected a molecule for testing, and the results are shown in Fig. 2(a). At the 5th epoch, ConfGAN could not correctly predict the three-dimensional structure of the molecule, and the generated conformation contains incorrect interatomic distances. By the 50th epoch, the molecule generated by ConfGAN could more accurately represent the molecular framework, but it still could not correctly generate the structure of the benzene ring and the distances between atoms. At the 500th epoch, we optimized the generated molecular structure through DFT and calculated the Root Mean Square Deviation (RMSD) between the generated molecular structure and the optimized molecular structure to be 0.01 Å, indicating that the model can now generate the correct molecular structure. To verify the convergence of the model, we calculated the change in the average distance difference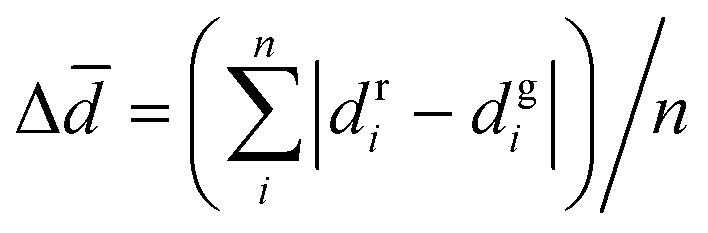 with epochs, where dgi represents the interatomic distance of the generated molecular conformation and dri represents the interatomic distance of the real conformation. The results are shown in Fig. 2(b), and by the 500th epoch, ConfGAN has reached convergence. Moreover, we compared the graph-motif method with the method that only uses graphs to represent the molecule in terms of average distance difference Δ
![[d with combining macron]](https://www.rsc.org/images/entities/i_char_0064_0304.gif) . The results show that the Δ after convergence using the graph-motif method is 0.14 Å, while the Δ after convergence using the graph method is 0.2 Å. This indicates that using the graph-motif method to predict molecular conformations has better performance.
. The results show that the Δ after convergence using the graph-motif method is 0.14 Å, while the Δ after convergence using the graph method is 0.2 Å. This indicates that using the graph-motif method to predict molecular conformations has better performance.
 | ||
| Fig. 2 Performance evaluation of the ConfGAN model in molecular conformation generation. (a) Tracking the model's ability to generate conformations at the 5th, 50th, and 500th epochs. (b) Variation of the average distance difference in molecular representation using the GNN and MM-GNN with respect to epoch. (c) The average number of valid conformations generated by ConfGAN varies with the increase in the number of rotatable bonds in the molecule. (d) Variation of the molecular potential energy surface with changes in two rotatable angles. | ||
To validate the diversity of conformations generated by ConfGAN and to test whether the model suffers from the common issue of mode collapse often seen in GAN models, a diversity test was performed. We conducted a random selection of 100 molecules, stratified by the count of rotatable bonds ranging from 1 to 10, with each count represented by 10 distinct molecules. Utilizing ConfGAN, we generated a set of 5000 conformations for each of these molecules, and the energy of each conformation was computed using the xTB-GFN2 method.36 Following this, we applied a clustering process to the generated conformations, setting an RMSD threshold of less than 0.5 Å and an energy threshold of less than 0.2 kJ mol−1. Ultimately, we quantified the average quantity of conformations following clustering for each category of rotatable bond count. The outcomes of this process are illustrated in Fig. 2(c). The quantity of conformations post-clustering gradually increases with the increase in the count of rotatable bonds. This indicates that the conformations generated by the model exhibit diversity, thereby suggesting that the issue of mode collapse is not present.
Diversity in the conformational space of molecules is crucial, as thermodynamically stable conformations typically correspond to the points of minimal potential energy. These conformations, which represent energy minima on the molecular potential energy surface, are more likely to occur in molecular thermodynamic equilibrium. Moreover, they play a key role in chemical reactions and intermolecular interactions. Therefore, we examined whether ConfGAN could generate these stable conformations. We randomly selected five molecules and scanned the two rotatable angles of each molecule using DFT calculations. The scan interval was set at 20 degrees. The potential energy surface after scanning and its projection are shown in Fig. 2(d). We used ConfGAN to generate 50 conformations for each molecule, removing duplicates. Subsequently, we applied DFT to calculate the energy of each conformation. The generated conformations, sorted by their dihedral angles and corresponding energies, are marked in Fig. 2(d) with red dots and lines.
It can be observed that the conformations generated by the model are located near the potential energy minima, demonstrating that our model can generate thermodynamically stable conformations. We also tested other molecules and arrived at similar conclusions. Detailed results can be found in ESI Fig. 2.†
Comparison between different models for the generation of conformations
For more complex molecular structures, we further tested the ability of ConfGAN to generate the most stable molecular conformations. The most stable conformations typically have the lowest energy, and predicting these can provide a better understanding of a molecule's behavior and properties. This is particularly useful for targeted research and applications in molecular design and drug development. We randomly selected five molecules from the GEOM-Drugs database and performed Molecular Dynamics (MD) simulations to thoroughly sample each molecule to obtain its most stable conformation as a reference. Concurrently, we compared ConfGAN with other deep learning-based methods and with MD runs that only sample 200 conformations for each molecule (MD-200). All deep learning-based methods generated 200 conformations, and the most stable conformation was selected by calculating the energy. Not all deep learning-based methods were tested, such as the DMGG method, as these methods do not provide suitable secondary testing code. We depicted the most stable conformation of molecular structures and their relative energy differences (ΔE = EGen − ERef) in Fig. 3.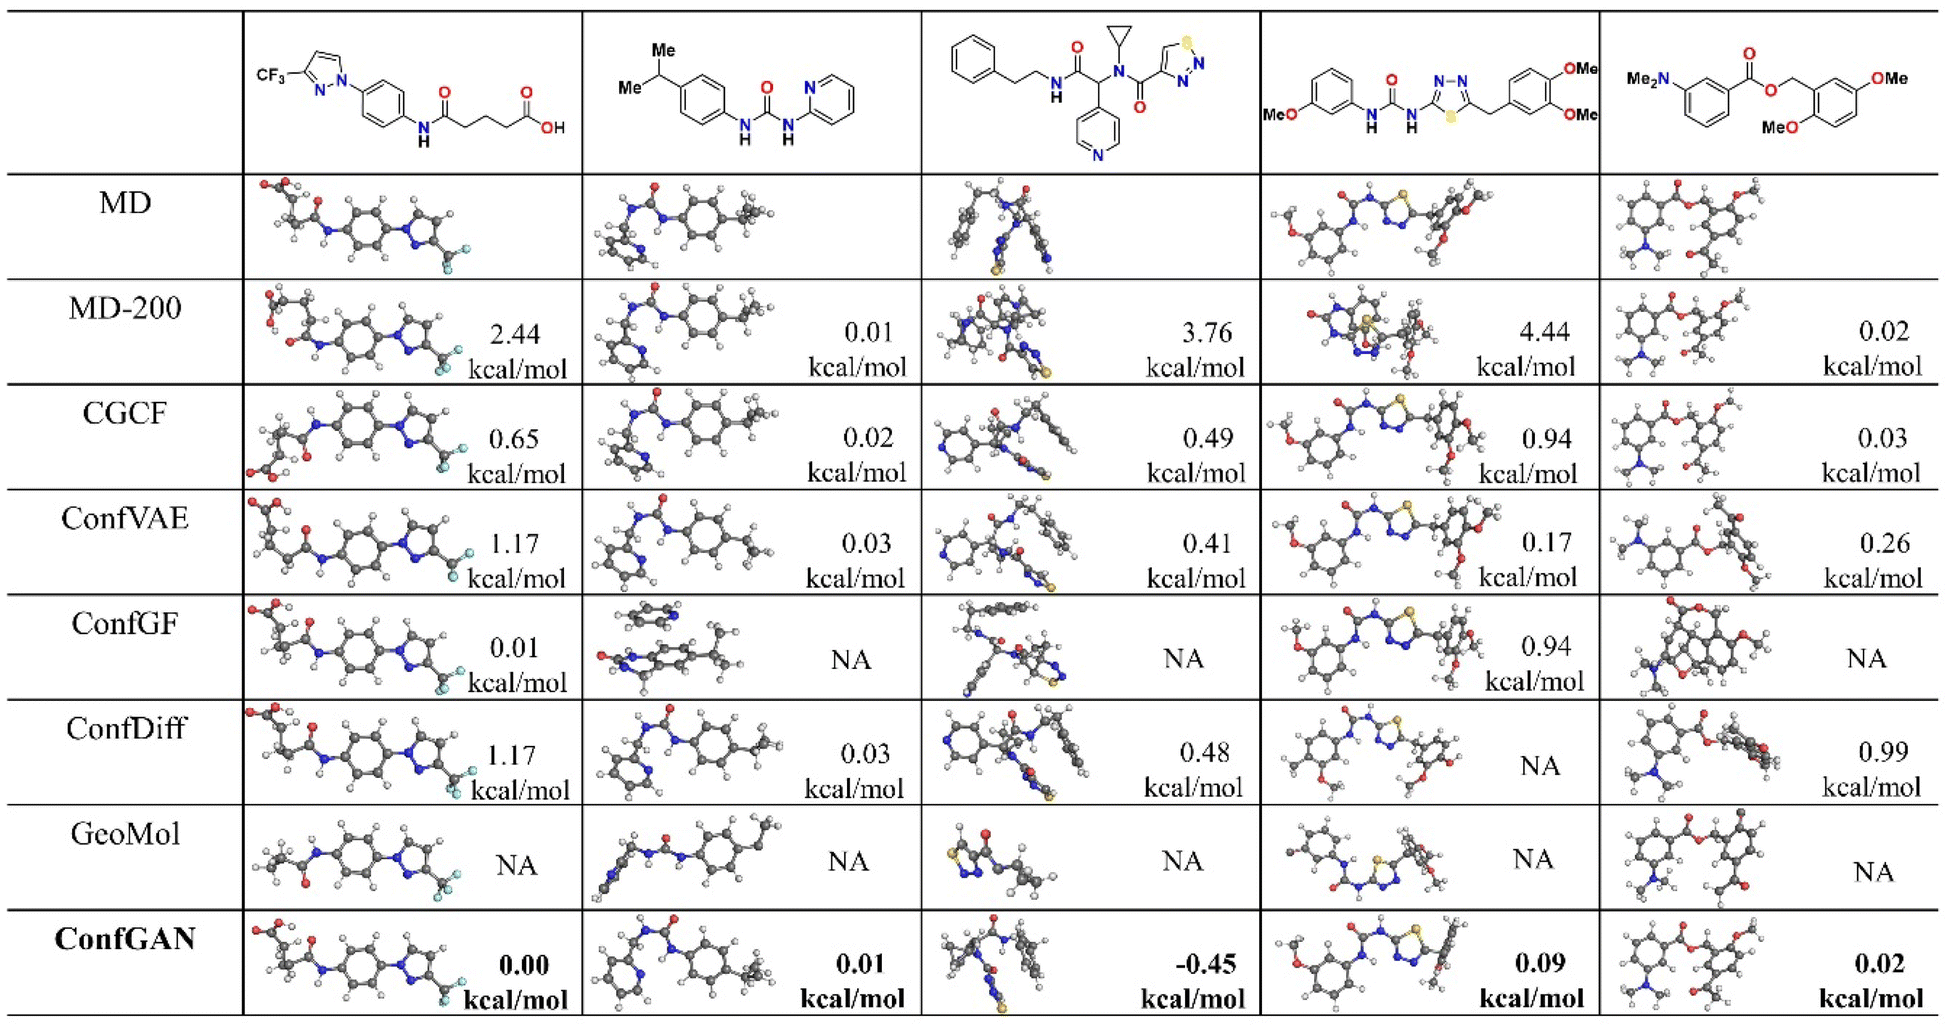 | ||
| Fig. 3 Comparison of ConfGAN with other methods in conformation generation. The reference results consist of 5000 conformations obtained from molecular dynamics (MD) simulations (250 ps). MD-200 represents 200 conformations obtained from molecular dynamics simulations with a simulation time of 10 ps. All structures shown in the figure are the lowest-energy conformations, and the energy displayed in the bottom right corner is relative to the lowest-energy conformation from molecular dynamics simulations. NA indicates that the generated structure contains errors. | ||
It can be observed that the energies obtained by most deep learning-based methods are lower than those obtained by the molecular dynamics method that only samples 200 conformations. This suggests that deep learning methods have advantages when the number of conformational samplings is limited. However, some deep learning-based methods generated incorrect conformation structures, leading to abnormally low energies. We marked these cases as NA in the Fig. 3. In our tests, the GeoMol method generated a significant number of incorrect 3D structures, primarily due to multiple atom overlapping. The ConfGF method also produced some erroneous structures, such as incorrect bond breaking and connections. These incorrect 3D structures can have a significant impact on practical applications. In our tests, our method did not generate any incorrect molecular structures, and the stable conformations it generated were closer to the reference conformations produced by molecular dynamics than those generated by other deep learning methods. This indicates that ConfGAN can effectively generate high-quality molecular conformations, demonstrating both stability and reliability.
In order to further investigate the quality and diversity of the conformations generated by the ConfGAN, we follow previous work to calculate coverage (COV) and matching (MAT).23 The coverage (COV) is used to measure the proportion of conformations in the generated set that match at least one conformation in the reference set. For each conformation in the generated set, we find the conformation in the reference set that is closest to it within a given RMSD threshold δ and mark it as a matching conformation:

 represent the generated conformation set and the reference conformation set, respectively. RMSD(·) is the root-mean-square deviation between the generated conformation R′ and the true conformation R. The δ values are set at 0.5 and 1.25 for GEOM-QM9 and GEOM-Drugs, respectively. The true conformation is the steady-state conformation obtained through molecular dynamics simulations.
Although COV can detect mode collapse, it does not guarantee the quality of the generated samples. Therefore, the MAT score is defined as a supplementary measure focusing on quality. For each conformation in the reference set, the RMSD distance to its nearest neighbor in the generated set is calculated and averaged. Lower scores indicate better quality of the generated conformations.
In the experiment, we randomly selected 100 molecules each from the GEOM-QM9 and GEOM-Drugs databases. The existing conformations in the databases were used as reference conformations, and a corresponding number of conformations were generated using ConfGAN. Additionally, we evaluated other deep learning-based methods and RDKit's conformation generation method (ETKDG) for comparison. The results are summarized in Table 1. Notably, most deep learning-based methods outperformed RDKit's conformation generation method in terms of metrics, demonstrating the advantages of deep learning-based conformation generation. For the GEOM-QM9 dataset, our model achieved the highest average scores on the COV and MAT metrics, while CGCF obtained the best median scores. The molecules in the QM9 dataset have fewer atoms, and in the Geom-Drugs dataset, the molecules have more atoms, making the conformation space more complex and the task more challenging. The results show that our method outperformed other methods across all metrics.
| Dataset | Method | COV (%) | MAT (Å) | ||
|---|---|---|---|---|---|
| Mean | Medium | Mean | Medium | ||
| QM9 | RDKit | 50.68 | 70.00 | 0.4776 | 0.5088 |
| CGCF | 63.03 | 90.00 | 0.4437 | 0.3284 | |
| ConfVAE | 63.84 | 73.86 | 0.4446 | 0.4566 | |
| ConfGF | 65.06 | 82.00 | 0.4224 | 0.4089 | |
| GeoDiff | 64.44 | 77.78 | 0.4225 | 0.4071 | |
| GeoMol | 61.49 | 76.79 | 0.4559 | 0.4235 | |
| ConfGAN | 66.58 | 85.58 | 0.4200 | 0.3987 | |
| Drugs | RDKit | 72.77 | 82.34 | 1.0443 | 1.0003 |
| CGCF | 74.20 | 81.30 | 0.9271 | 0.9305 | |
| ConfVAE | 75.52 | 81.37 | 0.9177 | 0.8982 | |
| ConfGF | 77.53 | 86.52 | 0.9104 | 0.9136 | |
| GeoDiff | 77.14 | 85.20 | 1.0220 | 0.9875 | |
| GeoMol | 72.13 | 80.52 | 1.1120 | 0.9954 | |
| SDEgen | 78.46 | 89.59 | 0.8995 | 0.8840 | |
| ConfGAN | 80.88 | 91.80 | 0.8974 | 0.8795 | |
Practical application of ConfGAN
To evaluate the practical performance of ConfGAN, we utilize it for generating initial ligand conformations in molecular docking. The initial conformation of the ligand plays a crucial role in its matching on the receptor surface and energy scoring during the docking process. Different initial conformations may lead to varying degrees of matching accuracy and energy scores. Selecting an appropriate initial conformation can reduce the searching space and computational time, thereby enhancing the accuracy of the docking results. Additionally, we tested other deep learning-based methods and the commonly used software for generating initial conformations, RDKit. During the docking process, we predicted a conformation for each ligand and calculated the corresponding affinity energy and RMSD. These computational results were then compared with those obtained using the RDKit method. Fig. 4(a) shows the relative affinity energy (Δaffinity energy) after docking. This value is calculated by subtracting the affinity energy obtained using the RDKit method from the affinity energy obtained through the deep learning method. A negative value indicates that the result from the deep learning method is better than that from the conformation generation method used by RDKit. It can be observed that all deep learning-based methods outperform the commonly used RDKit method. Our approach performs the best, with 73.37% of the docked complexes having a lower affinity energy than the RDKit method. As shown in Fig. 4(b), we calculated the RMSD between the generated conformations and those in the experiment, again using RDKit as a reference. A negative value indicates superior performance to the RDKit method. ConfGAN also surpasses the RDKit method and other deep learning methods. Upon inspection of the conformations generated by these methods, we found that they made incorrect predictions of atomic chirality in the molecular conformations, resulting in lower RMSD. This issue is due to the random generation of initial coordinates when converting distances into 3D coordinates. We addressed this problem by introducing a volume violation, which is elaborated in the Methods section. The initial conformations of some molecules generated by the GeoMol and GeoDiff methods can lead to docking failures. This is due to the generation of incorrect 3D structures, as discussed in our analysis of results shown in Fig. 3. In Table S1,† we have calculated the average affinity energy and RMSD (aligned with the experimental ligand position) for all docking results, and it is evident that our method outperforms other deep learning and the RDKit methods. These results suggest that our method holds promise for generating initial conformations for molecular docking. | ||
| Fig. 4 Performance Comparison of ConfGAN and other methods in molecular docking. For the docking results of 184 complexes, the performances of different methods were compared using the commonly used software RDKit as a reference. (a) Distribution of Δaffinity energies; (b) distribution of ΔRMSD values. ΔAffinity energies and ΔRMSD values are obtained by subtracting the docking results of RDKit from those of each method. Negative values indicate that compared to RDKit, the conformations generated by the method have lower affinity energy and RMSD (aligned to the experimental ligand position) in molecular docking, meaning that the performance is better than that of RDKit. The proportion of cases where each method outperforms RDKit is indicated in the bottom right corner of the figure. | ||
The variation in molecular conformation has a significant impact on the energy and electronic properties of molecules. Therefore, accurately determining the molecular conformation is crucial for understanding and predicting the behavior of molecules. To investigate the performance of ConfGAN-generated conformations in predicting molecular properties, we randomly selected 30 drug molecules and employed molecular dynamics, RDKit, ConfGAN, and other deep learning algorithms to generate 5000 distinct conformations for each molecule. Subsequently, following the widely used computational procedure, we computed the electronic properties of the conformations. Initially, we utilized the semi-empirical methods xTB-GFN0 and xTB-GFN2 to calculate the energy of each conformation and subsequently clustered and ranked them based on their energy values. Next, we selected the top 10 conformations with the lowest energy for each molecule. Finally, we employed a more accurate density functional theory to calculate the energy and HOMO–LUMO energy gap of the selected conformations, which were then weighted averaged using the energy-based Boltzmann equation. During the comparative analysis, we used molecular dynamics as a reference and computed the average energy difference (ΔĒ), average energy gap difference (Δ![[small epsilon, Greek, macron]](https://www.rsc.org/images/entities/i_char_e0c6.gif) ), average minimum energy difference (ΔĒmin), average minimum energy gap difference (Δmin), and average maximum energy gap difference (Δmax) between molecular dynamics and other methods. The findings, as presented in Table 2, highlight that our ConfGAN method closely approximates molecular dynamics in terms of ΔĒ, Δ, and Δmin, indicating a comparable conformational distribution. Moreover, all deep learning methods outperformed molecular dynamics in terms of the average minimum energy (ΔĒmin). This is primarily attributed to the limitations of molecular dynamics in accurately sampling molecules with a higher number of atoms. Notably, our ConfGAN method demonstrates superior performance in handling these complex molecules, generating conformations with lower energy. These results underscore the potential application of ConfGAN in preparing initial conformations for higher-level first-principle calculations of molecular properties.
), average minimum energy difference (ΔĒmin), average minimum energy gap difference (Δmin), and average maximum energy gap difference (Δmax) between molecular dynamics and other methods. The findings, as presented in Table 2, highlight that our ConfGAN method closely approximates molecular dynamics in terms of ΔĒ, Δ, and Δmin, indicating a comparable conformational distribution. Moreover, all deep learning methods outperformed molecular dynamics in terms of the average minimum energy (ΔĒmin). This is primarily attributed to the limitations of molecular dynamics in accurately sampling molecules with a higher number of atoms. Notably, our ConfGAN method demonstrates superior performance in handling these complex molecules, generating conformations with lower energy. These results underscore the potential application of ConfGAN in preparing initial conformations for higher-level first-principle calculations of molecular properties.
| Method | ΔĒ | Δ |
ΔĒmin | Δmin |
Δmax |
|---|---|---|---|---|---|
| CGCF | 4.07 | −1.34 | −5.26 | −3.35 | 1.92 |
| ConfGF | 6.67 | −0.94 | −5.08 | −7.11 | 3.77 |
| GeoDiff | −6.45 | −1.77 | −7.55 | −2.80 | 1.83 |
| ConfGAN | −0.66 | −0.59 | −7.88 | −2.36 | 2.44 |
Conclusions
In this paper, we introduce a molecular conformation generation model called ConfGAN, which is based on conditional generative adversarial networks. The model utilizes molecular motif-graphs and molecular graphs to describe molecular features and incorporates molecular potential energy functions into the objective function to achieve high-quality molecular conformation generation. Through multiple rigorous tests, we demonstrate that the model can generate high-quality and diverse molecular conformations, outperforming other deep learning-based methods in various benchmark tests. Furthermore, we successfully apply the model to molecular docking and electronic property calculations, demonstrating its potential value in practical applications.Methods
Data
We used the GEOM-QM9 and GEOM-Drugs conformational datasets for training and testing.37 The GEOM-QM9 dataset includes 133![[thin space (1/6-em)]](https://www.rsc.org/images/entities/char_2009.gif) 232 small molecules, with each molecule having a maximum of 9 heavy atoms. We divided the GEOM-QM9 dataset into a training set, validation set, and test set in a ratio of 8:1:1, with each molecule containing multiple stable conformations obtained through MD simulations. In the GEOM-Drugs dataset, there are 304340 drug molecules, with a maximum of 91 heavy atoms per molecule. The molecules in the GEOM-Drugs dataset have a higher number of atoms, resulting in a larger conformational space. Considering the limitations of computational resources, we randomly sampled a total of 62500 molecules from the original dataset and divided them into training, validation, and test sets in a ratio of 8:1:1. During the benchmark test suggested by Simm et al.,23 we randomly tested 1711 conformations from the GEOM-QM9 dataset and 9804 conformations from the GEOM-Drugs dataset. All the test datasets excluded the molecules used in the training set. For molecular docking, we used the PDB binding core set as our database, which consists of 184 complex structures obtained through experimental data.38
232 small molecules, with each molecule having a maximum of 9 heavy atoms. We divided the GEOM-QM9 dataset into a training set, validation set, and test set in a ratio of 8:1:1, with each molecule containing multiple stable conformations obtained through MD simulations. In the GEOM-Drugs dataset, there are 304340 drug molecules, with a maximum of 91 heavy atoms per molecule. The molecules in the GEOM-Drugs dataset have a higher number of atoms, resulting in a larger conformational space. Considering the limitations of computational resources, we randomly sampled a total of 62500 molecules from the original dataset and divided them into training, validation, and test sets in a ratio of 8:1:1. During the benchmark test suggested by Simm et al.,23 we randomly tested 1711 conformations from the GEOM-QM9 dataset and 9804 conformations from the GEOM-Drugs dataset. All the test datasets excluded the molecules used in the training set. For molecular docking, we used the PDB binding core set as our database, which consists of 184 complex structures obtained through experimental data.38
Input representations
In this work, we constructed a molecular-motif graph neural network where molecules are represented by molecular graphs and molecular motif graphs. The molecular graph is an undirected graph G = (V,E) where V = {v1, v2, …, vn} represents the set of nodes corresponding to atoms. E = {euv|(u,v) ⊆ V × V} represents the set of edges connecting atoms in the molecule. Each node vi ⊆ V is labeled with atom properties such as atomic charge, chirality type, element type, and aromaticity. The edges connecting u and v in E are denoted as euv and labeled with the type of bond between them. All distances between connected nodes can be represented as a vector .
.
Molecular motifs can be regarded as specific meaningful functional groups within a molecule, where each functional group is a subgraph of the molecular motif graph G′. Existing molecular graphs only focus on individual atom information, ignoring the information about groups composed of atoms. However, the functionality and properties of a molecule are influenced by its functional groups. For example, the presence of a hydroxyl (OH) functional group in small molecules often indicates higher water solubility. Therefore, using molecular motif graphs allows for the learning of richer chemical information. Additionally, reducing the number of nodes in a graph improves the ability of graph neural networks to capture long-range dependencies between atoms. In this study, molecular motifs were obtained using the BRICS (Breaking of Retrosynthetically Interesting Chemical Substructures) algorithm.39 This algorithm breaks down the molecule based on whether the bonds can be synthesized experimentally, with the aim of preserving valuable structural and functional components, such as aromatic rings. Although the BRICS algorithm was initially developed for the design and synthesis of drug-like molecules, its fundamental principles can be applied to a broader range of chemical fields. With appropriate adjustments, the method has the potential to extend to non-drug molecules. For example, in the case of organometallic compounds, we might consider incorporating the handling of metal–carbon bonds and adjusting the molecular fragmentation rules, among other things. However, the BRICS algorithm can generate numerous motifs with similar underlying structural variations, such as furan rings with different combinations of halogen atoms. This leads to a large number of different types of molecular motifs, which can decrease prediction accuracy. Therefore, it is necessary to filter and optimize the molecular motifs to obtain more accurate and meaningful chemical information. Therefore, for the fragments generated by BRICS, we further operate based on the two rules proposed by the MGSSL method: (1) disconnect a bond where one end atom is in the ring and the other end is not in the ring and (2) select a non-ring atom with three or more adjacent atoms as a new motif and disconnect the adjacent bonds.40 These two rules effectively reduce the number of motifs. In ESI Fig. 1,† we show how to obtain the molecular motifs. The molecular motif graph  is similar to the molecular graph, where the node part is a set of molecular motif nodes M = {m1, m2, …, mn}, where MPL(·) represents a multi-layer perceptron and m represents a node of a molecular motif. The edges are denoted as
  , where the connection between m and n motif nodes in
  is denoted as εmn and is labeled with the type of bond between the motifs.
Molecular-motif graph
We have constructed a MM-GNN to learn graph-based feature representations at both the atomic and motif levels. We utilize a graph neural network to learn atomic feature embeddings and a separate molecular graph to learn motif-level graph embeddings.Molecular graph
Given an input graph G, a Graph Neural Network (GNN) utilizes the graph's connectivity and node/edge features to learn the representation vector (embedding) hv for each node v ∈ G. After t iterations of aggregation, the representation vector hv(t) for node v can be computed as follows:In the given formulation, ψ serves as the aggregation function for neighborhood information in the molecular graph, extracting the neighboring information of nodes. AGGREGATE(·) represents the function used to extract the adjacent information of a node v.

 denotes the set of neighboring nodes for node v. euv refers to the feature vector of the edge between nodes u and v.
Motif graph
In the motif graph, each node m ∈ G′ represents a motif and has a representation vector or embedding xm. After t iterations of aggregation, the representation vector for node m at the t-th layer can be calculated as follows:In the given formulation,

 represents the set of neighboring nodes of the motif node m in the motif graph. εmn refers to the feature vector of the edge between the motif nodes m and n.
After several iterations between the molecular graph and the motif nodes, the nodes in the molecular graph are concatenated with the nodes in the motif graph that correspond to them:
| hfv = CONCAT(hfv,xfm), where v ∈ C(m) |

Conditional generative adversarial network
The Conditional Generative Adversarial Network (CGAN) is composed of a generator and a discriminator, both of which are made up of several multilayer perceptrons.41 The generator takes as input the concatenated information of the molecular representations and Gaussian noise and outputs the distances between atoms. The discriminator, on the other hand, takes as input the concatenated information of the molecular representations and the real potential energy, as well as the potential energy information generated by the generator from the molecular representations. The potential energy is calculated through a pseudo force field, determining the potential energy function related to the distances between atoms. This includes the Lennard-Jones potential function from non-bonded interactions and the harmonic potential function from bonded interactions. The corresponding force field parameters are based on the UFF (Universal Force Field). There are two reasons for using a pseudo force field here: first, in previous work, the generative model primarily learned the conditional distribution of the distances between two atoms, P(d′|G), while neglecting the holistic nature of the molecule. By using a pseudo potential to learn the conditional distribution of the potential energy, P(U|G), we can better capture the overall characteristics of the molecule. Second, the pseudo potential includes parameters based on the UFF, which are obtained by fitting a large amount of experimental data, thereby improving the accuracy of predicting interatomic distances. This approach avoids the potential errors that may arise from using geometric methods alone.In the loss function part, we adopt the WGAN-GP (Wasserstein Generative Adversarial Network with Gradient Penalty) method.42 The loss function is as follows:


In the expression, U represents the potential energy of the real molecular conformation, Û represents the potential energy of the molecular conformation generated by the generator, dij represents the distance between atoms i and j, d0ij represents their equilibrium distance, and the parameters kij, Aij and Bij are obtained through the UFF. The term
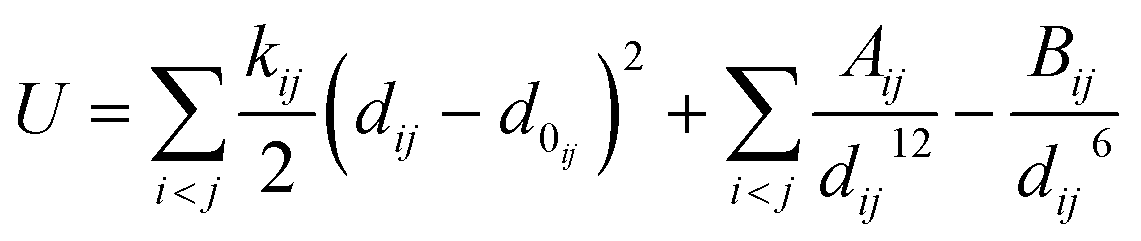
 represents the harmonic potential, describing the bond stretching around the equilibrium distance d0ij. In the Lennard-Jones potential part, the term
  describes the short-range repulsion, while the term
  describes the long-range attraction. The exponents 12 and 6 are empirical values; the 12th power term is used to model the strong repulsive force due to the Pauli exclusion principle, and the 6th power term is based on the quantum mechanical effects of dispersion forces.
  is the loss function for the discriminator, used to evaluate the difference between the generated molecular conformation and the real conformation, while
 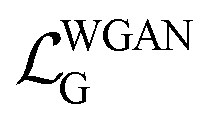 is the loss function for the generator, used to make the potential energy of the generated molecule closer to the real molecular conformation. D(U) refers to the output of the molecular conformation potential energy through the discriminator,
 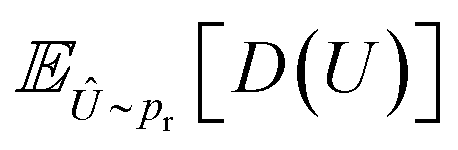 refers to the expectation of D(U) and λ and α are hyperparameters. Specifically, λ is 0.01 and α is a random number uniformly distributed between 0 and 1.
Conformation generation
The generated pairwise distances can be converted into three-dimensional structures using the classical Euclidean Distance Geometry (EDG) algorithm.21 Since previous studies did not consider the issue of chirality, this work introduces a volume violation term, Echir:In the equation, R represents the three-dimensional coordinates of the molecular conformation, ri and rj respectively represent the three-dimensional coordinates of atoms i and j, dij refers to the distance between these two atoms, and Uij refers to the potential energy between the two atoms. The chirality volume is defined by the plane spanned by three vectors in sp2-type (Vchir = 0) or in the center of a tetrahedral sp3-type atom (i.e., a stereoisomer center with a non-zero chirality volume Vchir), defined by the scalar triple product

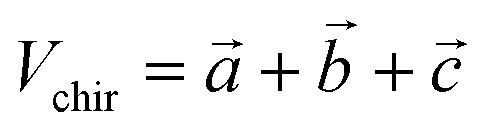 . For atom i with R configuration, the chirality volume VRi > 0 and for atom j with S configuration, the chirality volume VSi < 0 (refer to Fig. S2 for details†). Here, the chiral center is only used for the center of tetrahedral sp3-type atoms.
DFT
The dihedral angle scan is performed using the B3LYP functional and 6-31G(d) basis set for geometric optimization calculations.43 We also employed the Grimme D3BJ empirical dispersion correction (EM = GD3BJ) to account for the dispersion interactions between atoms.44 Calculations were carried out using the Gaussian 16 software package.45 All the energies of the DFT (Density Functional Theory) computational systems mentioned in the article were obtained using the B3LYP functional and 6-31G(d) basis set.MD
All MD calculations were performed using the xTB software.45 In generating the reference conformations, MD simulations were carried out at 300 K in the NVT ensemble. The generated conformations used as references were obtained by running MD continuously for 250 ps, outputting a molecular conformation every 50 fs. After the molecular dynamics run ended, xTB-GFN2 was used to optimize the structure and calculate the energy of the output molecular conformations.46 When compared with the MD method, the energies of the conformations generated by deep learning were calculated using the xTB-GFN2 method.Molecular docking
For the molecular docking part, we used the Smina software, which is redeveloped based on Autodock-vina.47,48 The conformations generated by RDKit used the Experimental-Torsion Basic Knowledge Distance Geometry (ETKDG) method.49 In the process of testing molecular docking, we generated 50 conformations for each ligand, and for each conformation, the Smina software was used to produce one ligand pose.Code availability
https://github.com/xucongs/ConfGAN.Data availability
The code for ConfGAN can be found at https://github.com/xucongs.Author contributions
This research was designed by Congsheng Xu and Peiyuan Yu. Congsheng Xu conducted machine learning modeling and analysis. Xiaomei Deng handled the data for molecular docking. Lu Yi was responsible for drawing some of the molecular 3D structure diagrams and providing suggestions for DFT calculations. Other data were processed and analyzed by Congsheng Xu. The manuscript was written by Congsheng Xu and Peiyuan Yu.Conflicts of interest
There are no conflicts to declare.Acknowledgements
General: computational work was supported by the Center for Computational Science and Engineering at the Southern University of Science and Technology and the CHEM high-performance supercomputer cluster (CHEM-HPC) located at the department of chemistry, SUSTech. Funding: we are grateful for the financial support from Shenzhen Science and Technology Program (KQTD20210811090112004).References
- J. I. Seeman, Effect of conformational change on reactivity in organic chemistry. Evaluations, applications, and extensions of Curtin-Hammett Winstein-Holness kinetics, Chem. Rev., 1983, 83, 83–134 CrossRef CAS.
- P. C. Hawkins, Conformation generation: the state of the art, J. Chem. Inf. Model., 2017, 57, 1747–1756 CrossRef CAS.
- Z. Fang, Y. n. Song, P. Zhan, Q. Zhang and X. Liu, Conformational restriction: an effective tactic in'follow-on'-based drug discovery, Future Med. Chem., 2014, 6, 885–901 CrossRef CAS PubMed.
- B. Linclau, Z. Wang, B. Jeffries, J. Graton, R. J. Carbajo, D. Sinnaeve, J. Y. Le Questel, J. S. Scott and E. Chiarparin, Relating Conformational Equilibria to Conformer-Specific Lipophilicities: New Opportunities in Drug Discovery, Angew. Chem., Int. Ed., 2022, 134, e202114862 CrossRef.
- M. B. Smith, March's advanced organic chemistry: reactions, mechanisms, and structure, John Wiley & Sons, 2020 Search PubMed.
- J. Zheng, P. Seal and D. G. Truhlar, Role of conformational structures and torsional anharmonicity in controlling chemical reaction rates and relative yields: butanal+ HO 2 reactions, Chem. Sci., 2013, 4, 200–212 RSC.
- H. Flack and G. Bernardinelli, The use of X-ray crystallography to determine absolute configuration, Chirality: The Pharmacological, Biological, and Chemical Consequences of Molecular Asymmetry, 2008, vol. 20, pp. 681–690 Search PubMed.
- M. R. Wormald, A. J. Petrescu, Y.-L. Pao, A. Glithero, T. Elliott and R. A. Dwek, Conformational studies of oligosaccharides and glycopeptides: complementarity of NMR, X-ray crystallography, and molecular modelling, Chem. Rev., 2002, 102, 371–386 CrossRef CAS PubMed.
- R. Mendelsohn, C. R. Flach and D. J. Moore, Determination of molecular conformation and permeation in skin via IR spectroscopy, microscopy, and imaging, Biochim. Biophys. Acta, Biomembr., 2006, 1758, 923–933 CrossRef CAS PubMed.
- N.-T. Yu and S. Krimm, Raman spectroscopy: a conformational probe in biochemistr, CRC Crit. Rev. Biochem., 1977, 4, 229–280 CrossRef CAS.
- W. L. Jorgensen and J. Tirado-Rives, Monte Carlo vs. molecular dynamics for conformational sampling, J. Phys. Chem., 1996, 100, 14508–14513 CrossRef CAS.
- R. E. Bruccoleri and M. Karplus, Conformational sampling using high-temperature molecular dynamics, Biopolymers, 1990, 29, 1847–1862 CrossRef CAS PubMed.
- C. F. Tormena, Conformational analysis of small molecules: NMR and quantum mechanics calculations, Prog. Nucl. Magn. Reson. Spectrosc., 2016, 96, 73–88 CrossRef CAS.
- M. Habgood, T. James and A. Heifetz, Conformational searching with quantum mechanics, Quantum Mechanics in Drug Discovery, 2020, pp. 207–229 Search PubMed.
- J. D. Durrant and J. A. McCammon, Molecular dynamics simulations and drug discovery, BMC Biol., 2011, 9, 1–9 CrossRef PubMed.
- I. G. Rodriguez-Bussey, U. Doshi and D. Hamelberg, Enhanced molecular dynamics sampling of drug target conformations, Biopolymers, 2016, 105, 35–42 CrossRef CAS PubMed.
- R. Abagyan and M. Totrov, Biased probability Monte Carlo conformational searches and electrostatic calculations for peptides and proteins, J. Mol. Biol., 1994, 235, 983–1002 CrossRef CAS PubMed.
- M. A. Ditzler, M. Otyepka, J. Sponer and N. G. Walter, Molecular dynamics and quantum mechanics of RNA: conformational and chemical change we can believe in, Acc. Chem. Res., 2010, 43, 40–47 CrossRef CAS PubMed.
- L. Ruthotto and E. Haber, An introduction to deep generative modeling, GAMM-Mitteilungen, 2021, vol. 44, p. e202100008 Search PubMed.
- P. P. Ray, ChatGPT: A comprehensive review on background, applications, key challenges, bias, ethics, limitations and future scope, Internet Things Cyber-Phys. Syst., 2023 Search PubMed.
- D. C. Spellmeyer, A. K. Wong, M. J. Bower and J. M. Blaney, Conformational analysis using distance geometry methods, J. Mol. Graphics Modell., 1997, 15, 18–36 CrossRef CAS PubMed.
- D. P. Kingma and M. Welling, An introduction to variational autoencoders, FOUND. TRENDS. MACH. LE., 2019, 12, 307–392 CrossRef.
- G. N. Simm and J. M. Hernández-Lobato, A generative model for molecular distance geometry, arXiv, 2019, preprint, arXiv:1909.11459, DOI:10.48550/arXiv.1909.11459.
- C. Xu, Y. Lu, X. Deng and P. Yu, Prediction of Molecular Conformation Using Deep Generative Neural Networks, Chin. J. Chem., 2023, 41, 3684–3688 CrossRef CAS.
- M. Xu, S. Luo, Y. Bengio, J. Peng and J. Tang, Learning neural generative dynamics for molecular conformation generation, arXiv, 2021, preprint, arXiv:2102.10240, DOI:10.48550/arXiv.2102.10240.
- M. Xu, W. Wang, S. Luo, C. Shi, Y. Bengio, R. Gomez-Bombarelli and J. Tang, An end-to-end framework for molecular conformation generation via bilevel programming, ICML, 2021, pp. 11537–11547 Search PubMed.
- C. Shi, S. Luo, M. Xu and J. Tang, Learning gradient fields for molecular conformation generation, ICML, 2021, pp. 9558–9568 Search PubMed.
- O. Ganea, L. Pattanaik, C. Coley, R. Barzilay, K. Jensen, W. Green and T. Jaakkola, Geomol: Torsional geometric generation of molecular 3d conformer ensembles, Advances in Neural Information Processing Systems, 2021, vol. 34, pp. 13757–13769 Search PubMed.
- M. Xu, L. Yu, Y. Song, C. Shi, S. Ermon and J. Tang, Geodiff: A geometric diffusion model for molecular conformation generation, arXiv, 2022, preprint, arXiv:2203.02923, DOI:10.48550/arXiv.2203.02923.
- H. Zhang, S. Li, J. Zhang, Z. Wang, J. Wang, D. Jiang, Z. Bian, Y. Zhang, Y. Deng and J. Song, SDEGen: learning to evolve molecular conformations from thermodynamic noise for conformation generation, Chem. Sci., 2023, 14, 1557–1568 RSC.
- I. Goodfellow, J. Pouget-Abadie, M. Mirza, B. Xu, D. Warde-Farley, S. Ozair, A. Courville and Y. Bengio, Generative adversarial networks, Commun. ACM, 2020, 63, 139–144 CrossRef.
- N. Cao and T. Kipf, MolGAN: An implicit generative model for small molecular graphs, arXiv, 2018, preprint, DOI:10.48550/arXiv.1805.11973.
- O. Prykhodko, S. Johansson, P. Kotsias, B. Xu, J. Arús-Pous, E. Bjerrum, O. Engkvist and H. Chen, A de novo molecular generation method using latent vector based generative adversarial network, J. Cheminform., 2019, 11, 1–13 CrossRef.
- C. Casewit, K. Colwell and A. Rappe, Application of a universal force field to organic molecules, J. Am. Chem. Soc., 1992, 114, 10035–10046 CrossRef CAS.
- M. Köck, M. Reggelin and S. Immel, The Advanced Floating Chirality Distance Geometry Approach-How Anisotropic NMR Parameters Can Support the Determination of the Relative Configuration of Natural Products, Mar. Drugs, 2020, 18, 330 CrossRef.
- S. Grimme, C. Bannwarth and P. Shushkov, A robust and accurate tight-binding quantum chemical method for structures, vibrational frequencies, and noncovalent interactions of large molecular systems parametrized for all spd-block elements (Z= 1–86), J. Chem. Theory Comput., 2017, 13, 1989–2009 CrossRef CAS PubMed.
- S. Axelrod and R. Gomez-Bombarelli, GEOM, energy-annotated molecular conformations for property prediction and molecular generation, Sci. Data, 2022, 9, 185 CrossRef CAS.
- Y. Li, M. Su, Z. Liu, J. Li, J. Liu, L. Han and R. Wang, Assessing protein–ligand interaction scoring functions with the CASF-2013 benchmark, Nat. Protoc., 2018, 13, 666–680 CrossRef CAS.
- J. Degen, C. Wegscheid-Gerlach, A. Zaliani and M. Rarey, On the Art of Compiling and Using'Drug-Like'Chemical Fragment Spaces, ChemMedChem, 2008, 3, 1503–1507 CrossRef CAS PubMed.
- Z. Zhang, Q. Liu, H. Wang, C. Lu and C.-K. Lee, Motif-based graph self-supervised learning for molecular property prediction, Adv. Neural. Inf. Process. Syst., 2021, vol. 34, pp. 15870–15882 Search PubMed.
- M. Mirza and S. Osindero, Conditional generative adversarial nets, arXiv, 2014, preprint, arXiv:1411.1784, DOI:10.48550/arXiv.1411.1784.
- I. Gulrajani, F. Ahmed, M. Arjovsky, V. Dumoulin and A. C. Courville, Improved training of wasserstein gans, Adv. Neural. Inf. Process. Syst., 2017, vol. 30 Search PubMed.
- C. Lee, W. Yang and R. G. Parr, Development of the Colle-Salvetti correlation-energy formula into a functional of the electron density, Phys. Rev. B:Condens. Matter Mater. Phys., 1988, 37, 785 CrossRef CAS PubMed.
- S. Grimme, S. Ehrlich and L. Goerigk, Effect of the damping function in dispersion corrected density functional theory, J. Comput. Chem., 2011, 32, 1456–1465 CrossRef CAS.
- M. Frisch, G. Trucks, H. Schlegel, G. Scuseria, M. Robb, J. Cheeseman, G. Scalmani, V. Barone, G. Petersson and H. Nakatsuji, Gaussian 16, Revision A. 03, Gaussian Inc., Wallingford CT, 2016, vol. 3 Search PubMed.
- S. Grimme, Exploration of chemical compound, conformer, and reaction space with meta-dynamics simulations based on tight-binding quantum chemical calculations, J. Chem. Theory Comput., 2019, 15, 2847–2862 CrossRef CAS.
- D. R. Koes, M. P. Baumgartner and C. J. Camacho, Lessons learned in empirical scoring with smina from the CSAR 2011 benchmarking exercise, J. Chem. Inf. Model., 2013, 53, 1893–1904 CrossRef CAS.
- O. Trott and A. J. Olson, AutoDock Vina: improving the speed and accuracy of docking with a new scoring function, efficient optimization, and multithreading, J. Comput. Chem., 2010, 31, 455–461 CrossRef CAS.
- G. Landrum Rdkit: Open-source cheminformatics software. 2016 Search PubMed.
Footnote |
| † Electronic supplementary information (ESI) available: Fig. S1: schematic illustration of molecular motif generation. Fig. S2: schematic illustration of chirality volume violation. Table S1: performance comparison of different methods in molecular docking. Data 1: the molecular 3D coordinates in Fig. 3. Data 2: molecular SMILES and molecular conformation counts used in benchmark testing. Data 3: 3D coordinates of molecules used in quantum computing testing (ConfGAN). See DOI: https://doi.org/10.1039/d4dd00179f |
| This journal is © The Royal Society of Chemistry 2025 |