
 Open Access Article
 This Open Access Article is licensed under a
 Creative Commons Attribution 3.0 Unported Licence
Practical issues toward high-voltage aqueous rechargeable batteries
Seongjae
Ko
 a,
Shin-ichi
Nishimura
a,
Norio
Takenaka
a,
Atsushi
Kitada
a and
Atsuo
Yamada
*ab
a,
Shin-ichi
Nishimura
a,
Norio
Takenaka
a,
Atsushi
Kitada
a and
Atsuo
Yamada
*ab
aDepartment of Chemical System Engineering, The University of Tokyo, 7-3-1, Hongo, Bunkyo-ku, Tokyo 113-8656, Japan. E-mail: yamada@chemsys.t.u-tokyo.ac.jp
bSungkyunkwan University Institute of Energy Science & Technology (SIEST), Sungkyunkwan University, Seobu-ro 2066, Jangan-gu, 16419 Suwon-si, Gyeonggi-do, Korea
First published on 18th March 2025
Abstract
This review offers a critical and exhaustive examination of the current state and innovative advances in high-voltage Li, Na, K, and Zn aqueous rechargeable batteries, an area poised for significant technological breakthroughs in energy storage systems. The practical issues that have traditionally hampered the development of aqueous batteries, such as limited operating potential windows, challenges in stable solid–electrolyte interphase (SEI) formation, the need for active materials optimized for aqueous environments, the misunderstood intercalation chemistry, the unreliable assessment techniques, and the overestimated performance and underestimated physicochemical and electrochemical drawbacks, are highlighted. We believe that this review not only brings together existing knowledge but also pushes the boundaries by providing a roadmap for future research and development efforts aimed at overcoming the longstanding challenges faced by the promising aqueous rechargeable batteries.
 Seongjae Ko | Seongjae Ko worked as a senior researcher at Samsung SDI in South Korea from 2012 to 2015. He joined Professor Atsuo Yamada's group as an academic support specialist in 2015. From 2017 to 2020, he worked as a research fellow at the Japan Society for the Promotion of Science (JSPS, DC1). He received his PhD in Engineering from the University of Tokyo in 2020. He is currently an assistant professor at the University of Tokyo, and his research interests include electrolytes, battery design, and electrochemistry. |
 Shin-ichi Nishimura | Shin-ichi Nishimura received his PhD in Science from Tokyo Institute of Technology in 2009. Since 2009, he has worked as a research scientist with Professor Atsuo Yamada. His research has focused on solid electrode materials for secondary battery applications. The synthesis of the new electrode materials and their structural analysis with X-ray and neutron scattering/diffraction are the central interests of his research. |
 Norio Takenaka | Norio Takenaka received his PhD degree in information science from Nagoya University in 2010. From the same year to 2012, he worked as a postdoctoral fellow in Prof. Nagaoka's group in Nagoya University, from 2012 to 2019 at ESICB (Elements Strategy Initiatives on Catalysts and Batteries) in Kyoto University. In 2019, he joined Professor Atsuo Yamada’s group at the University of Tokyo as an assistant professor and has been serving as a lecturer since 2022. His current research interests include theoretical calculations to elucidate the complex electrochemical reaction processes in rechargeable batteries. |
 Atsushi Kitada | Atsushi Kitada received a PhD in Engineering from Kyoto University in 2012, and subsequently worked as an assistant professor. In 2022, he joined Professor Atsuo Yamada's group at the University of Tokyo as an associate professor. He has published over 90 peer-reviewed scientific papers on magnetic, electronic, and electrochemical materials of solid and liquid systems. He won the Young Scientist Award in 2019 in recognition of his outstanding research in the non-aqueous electrodeposition and the Paper Award in 2022 for highly-concentrated aqueous electrodeposition from the Surface Finishing Society of Japan. |
 Atsuo Yamada | Atsuo Yamada has had a unique career in both academic and industrial research. After serving as the laboratory head of the Sony Research Center, he was immediately appointed as an associate professor at the Tokyo Institute of Technology in 2002, and he was then appointed as a full professor at the University of Tokyo in 2009. Among his numerous honors, he has been awarded the Spriggs Award (2010) and the Purdy Award (2016) by the American Ceramic Society, the Scientific Achievement Award (2016) by the Electrochemical Society of Japan, the IBA Research Award (2016) by the International Battery Association, and the Battery Division Research Award (2022) by the Electrochemical Society. |
1. Introduction
Chemical batteries are essential for clean and efficient energy conversion and storage, and have drawn significant attention for realizing a sustainable society. Notably, as recognized by the 2019 Nobel Prize,1–5 the development of Li-ion batteries has revolutionized the concept of “rechargeability,” potentially aiding the realization of a zero carbon footprint. These batteries have profoundly impacted our lifestyle by facilitating the development of advanced, portable electronic devices for smart communications and healthcare, and also larger-scale applications such as electric vehicles, transportation systems, and grid storage for renewable energies.Initially, battery systems utilized aqueous electrolytes (Fig. 1). The lineage of batteries dates back to the early 1800s, when the primary Voltaic pile (Cu|Zn)6 that employed an acidic H2SO4 solution as the electrolyte was used. The overall reaction is:
| Zn + 2H+ → Zn2+ + H2 (Vcell = 0.76 V, Egrav = 5–10 W h kg−1) | (1) |
 | ||
| Fig. 1 History of practical batteries, listing the year of invention or commercialization, cell notations, and overall reactions. The transition of battery electrolytes is highlighted in gray (acidic aqueous electrolyte), blue (alkaline aqueous electrolyte), and red (nonaqueous electrolyte) arrows. One of the current technical targets is the development of aqueous rechargeable batteries with high voltage (high energy density), high safety, and high sustainability. | ||
The evolution from the Voltaic pile to advanced batteries was driven by the need for a higher energy density, which can be defined as the product of the battery voltage (V) and capacity (A h kg−1). The energy density of the Leclanché battery (MnO2|Zn),7 which uses an acidic NH4Cl or NH4Cl + ZnCl2 solution, was nearly five times higher than that of the Voltaic pile. The overall reaction is:
| 2MnO2 + Zn + 2NH4Cl → 2MnOOH + Zn(NH3)2Cl2 (Vcell = 1.5 V, Egrav = 30–40 W h kg−1) | (2) |
From the 1950s to 1970s, various aqueous primary alkaline batteries featuring diverse cathode active materials, Zn-metal anodes, and strongly alkaline KOH electrolytes were developed. Representative examples include alkaline–manganese (MnO2|Zn),8 mercury (HgO|Zn),9 and Zn–air (O2|Zn)10 batteries, which achieved energy densities up to 40 times higher than that of the Voltaic pile. Among these, alkaline–manganese and Zn–air batteries are widely used because they employ non-toxic materials, have low fire and explosion risk, are easy to recycle, and exhibit high energy densities and long usage times. The overall reactions for these batteries are as follows:
| 2MnO2 + Zn → Mn2O3 + ZnO (Vcell = 1.5 V, Egrav = 100–200 W h kg−1) | (3) |
| HgO + Zn → Hg + ZnO (Vcell = 1.3–1.4 V, Egrav = 100–250 W h kg−1) | (4) |
| O2 + 2Zn → 2ZnO (Vcell = 1.3–1.5 V, Egrav = 300–400 W h kg−1) | (5) |
| PbO2 + Pb + 2H2SO4 ⇄ 2PbSO4 + 2H2O (Vcell = 2.0 V, Egrav = 30–40 W h kg−1) | (6) |
| 2NiOOH + Cd + 2H2O ⇄ 2Ni(OH)2 + Cd(OH)2 (Vcell = 1.2 V, Egrav = 40–60 W h kg−1) | (7) |
| NiOOH + MNiH ⇄ Ni(OH)2 + MNi (Vcell = 1.3 V, Egrav = 60–120 W h kg−1) | (8) |
Silver–zinc (Ag2O|Zn)14 batteries, which can be configured for use as both primary and secondary batteries, was originally developed for space and military applications.
| Ag2O + Zn ⇄ 2Ag + ZnO (Vcell = 1.5–1.8 V, Egrav = 100–150 W h kg−1) | (9) |
The demand for high-voltage batteries has significantly increased as electronic devices evolve to deliver higher power outputs. However, the narrow potential window of aqueous electrolytes, particularly their low reduction stability, which promotes the HER, has rendered the use of low-potential anode active materials challenging, thus limiting the battery output voltage. In the 1970s, a paradigm shift occurred from aqueous to nonaqueous electrolytes, leading to the commercialization of primary Li-metal batteries with voltages exceeding 3 V.15 The overall reaction is:
| MnO2 + Li → LiMnO2 (Vcell = 3.0 V, Egrav = 250–300 W h kg−1) | (10) |
Nevertheless, the high reactivity of Li metal can lead to irreversible reactions with trace amounts of moisture, impurities, or gases (e.g., H2, N2) in the electrolyte and manufacturing environment, potentially rendering the Li metal inactive and posing significant fire and explosion risks. Moreover, the development of secondary batteries using Li metal has encountered challenges such as high volume changes during Li plating/stripping and the formation of dendrites and “dead” Li due to uneven electron distribution. These phenomena eventually led to SEI damage, continuous reduction and depletion of the electrolyte, and short circuits in the internal battery.
To realize a rechargeable system based on Li chemistry, the battery chemistry was changed by utilizing the “rocking chair” mechanism (i.e., host–guest or intercalation chemistry). In this arrangement, the Li+ carrier ion initially resides in the cathode active material and shuttles between the anode and cathode through the electrolyte during the charging and discharging cycles.
This innovation allowed for the replacement of Li metal with a graphite anode, which acts as a reservoir for Li+. The overall reaction in modern Li-ion batteries (e.g., LiCoO2|graphite) is described as follows:
| 2LiCoO2 + C6 ⇄ 2Li0.5CoO2 + LiC6 (Vcell = 3.6–3.7 V, Egrav = 80–300 W h kg−1) | (11) |
Fig. 2 illustrates the timeline of advancements and challenges in secondary batteries and their electrolytes, divided into periods before (left side) and after (right side) the advent of nonaqueous Li-ion batteries in 1991. Following this “Genesis,” the major research trend shifted toward exploring various intercalation chemistries, including the pursuit of high-voltage aqueous batteries to ensure ultimate safety and low production costs.
 | ||
| Fig. 2 Transitions in battery electrolyte issues. The issue of low output voltage in traditional aqueous rechargeable batteries was overcome with the development of nonaqueous Li-ion batteries, which offer both high output voltage (4 V-class) and high cycling stability. However, they introduced problems such as safety risks and increased manufacturing costs. Significant technical efforts have been devoted to exploring highly functional aqueous electrolytes and electrode materials based on diverse carrier ions (Li+, Na+, K+, and Zn2+) toward the next generation of energy storage devices that ensure high voltage, ultimate safety, economic production, and high sustainability. This review article will focus on the research conducted after the “Genesis” on the right side of the table, providing chapter/section numbers that address the corresponding development approaches and their issues. | ||
The first prototype of an aqueous Li-ion battery was reported by Li, Dahn, and Wainwright in 1994, who achieved a reversible 1.5 V system with a LiMn2O4 cathode, a VO2(B) anode, and a 5 M LiNO3 + 0.001 M LiOH electrolyte.17 Twenty years later, the discovery of highly salt-concentrated aqueous electrolytes, which drastically widened the potential window above 3 V by significantly decreasing the water activity and forming an anion-derived SEI, revived the interest in aqueous Li-ion batteries.18–21 Similar strategies have been applied to other carrier ion-based batteries (Na+, K+, and Zn2+)22–27 and electroplating.28 Despite these advancements, achieving high-voltage aqueous batteries remains a significant challenge.
In this review, the recent progress in high-voltage aqueous rechargeable batteries will be discussed in depth, along with the fundamental science of aqueous systems, the severity of the challenges faced, and the potential strategies for system optimization. The section index corresponding to each issue is marked in Fig. 2.
2. Challenges and prospects for aqueous Li-ion batteries
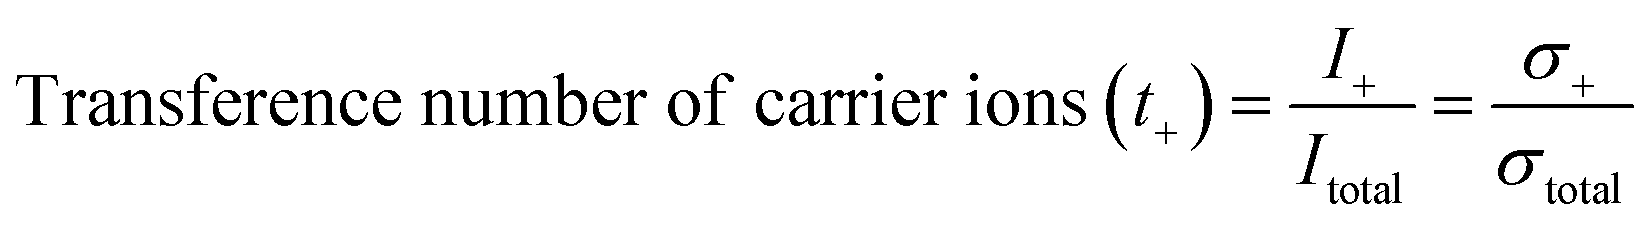
Aqueous rechargeable batteries are recognized as promising energy storage devices owing to their high safety, low product cost, and high manufacturability and scalability, which facilitate the development of green technologies.29–32 However, despite their advantages, these batteries have struggled to match the energy density and cycling performance of nonaqueous rechargeable batteries over the past three decades, impeding their commercial viability.Nonaqueous Li-ion batteries, which were first commercialized by Sony in 1991, are among the most well-developed and refined energy storage devices developed to date. The choice of Li+ as the carrier ion in rechargeable batteries is primarily driven by the low atomic mass and redox potential of Li.34–39 The nature of the carrier ions, typically present in active materials and electrolytes, plays a crucial role in determining the overall electrochemical properties of batteries. For instance, the capacity per unit weight, expressed as the charge-to-mass ratio following Faraday's law, underscores the importance of high charge-to-mass ratios for achieving lightweight yet high-capacity batteries. Among the various ions, Li+ possesses a higher charge-to-mass ratio (0.14; charge: 1, mass: 6.9) compared to Na+ (0.04; charge: 1, mass: 23.0), K+ (0.03; charge: 1, mass: 39.0), and Zn2+ (0.03; charge: 2, mass: 65.4). The operating voltage of the battery, reflecting the potential difference between the cathode and anode, is also crucial for efficient energy storage. An optimal battery configuration involves a high-potential cathode and a low-potential anode, where the minimum reaction potential of the anode is influenced by the standard redox potential of the carrier ion. Therefore, it is widely acknowledged that Li-ion batteries, with the lowest standard redox potential of Li metal 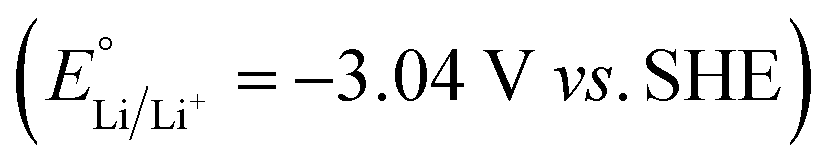 , offer the highest battery operating voltage and energy density (defined as the product of the battery operating voltage and capacity).
Sony's first-generation nonaqueous Li-ion batteries achieved an energy density of ∼80 W h kg−1 and were capable of enduring hundreds of charge and discharge cycles.40 Subsequent advancements and optimizations across all battery components, including active materials, electrolytes, carbon additives, separators, and overall electrode design, have resulted in significant performance enhancement compared to early models. The key attributes include high cathode loading (≥20 mg cm−2), limited electrolyte volume (≤3 mg mA h−1), a controlled positive-to-negative (P/N) ratio approaching 1 based on the superior initial cycling efficiency (≥90%), minimized electrolyte decomposition at electrode surfaces, and low electrolyte viscosity (≤5 mPa s) paired with sufficient ion conductivity (≥10 mS cm−1).4,41–44 Owing to these positive attributes, modern nonaqueous Li-ion batteries can achieve a two- to three-fold increase in the energy density and cycling stability. For example, LiFePO4|graphite batteries exhibit remarkable cycling stability, maintaining over 80% of their initial capacity even after several thousands of charge and discharge cycles. These batteries have a theoretical energy density of 340 W h kg−1, calculated based on the capacities of LiFePO4 (150 mA h g−1) and graphite (360 mA h g−1), with a P/N ratio of 0.9 and an average operating voltage of 3.3 V. Similarly, LiCoO2|graphite batteries exhibit excellent cycling stability, enduring over 1000 cycles. These batteries offer a theoretical energy density of 380 W h kg−1, utilizing LiCoO2 (150 mA h g−1) and graphite (360 mA h g−1), with a P/N ratio of 0.9 and an average operating voltage of 3.7 V. LiNi0.8Mn0.1Co0.1O2|graphite/Si composite batteries also exhibit stable reversibility even after several hundred cycles, with a theoretical energy density of 525 W h kg−1 achieved through the integration of LiNi0.8Mn0.1Co0.1O2 (200 mA h g−1) and graphite/Si composite (600 mA h g−1), with a P/N ratio of 0.9 and an average operating voltage of 3.6 V. With a practical energy density ranging from 150 to 300 W h kg−1, inclusive of the electrolyte, separator, cases, and other battery components, these batteries ensure reliable operation across a wide temperature range (−20 to 50 °C). Furthermore, recent developments on a laboratory scale have demonstrated the stable cycling of high-energy-density nonaqueous Li-ion batteries with high-potential cathodes and/or high-capacity anodes (e.g., 4.8 V Li2CoPO4F|graphite and 4.4 V LiNi0.5Mn1.5O4|SiOx with SiOx capacity ≥1600 mA h g−1) for over 1000 cycles.45–48 Continuous research efforts are being devoted to the development of battery materials for ensuring stable operation under extreme conditions (e.g., ≤−60 °C and/or ≥60 °C).49–52 Additionally, ongoing advancements in the cell-to-pack technology41 hold promise to further enhance the practical energy density of batteries for large-scale applications.
While the development history of aqueous Li-ion batteries parallels that of nonaqueous systems, their advancements in energy density and cycling performance have been less impressive, characterized by a low output voltage and poor long-term cycling performance at low C-rates. Moreover, stable operation under extreme conditions remains uncertain. The performance of the developed aqueous Li-ion full cells is outlined in Table 1. Notably, during our literature survey, we found several papers where “M” and “m” were used interchangeably. Further, these expressions were quoted directly without any corrections, despite the fact that “M” (molarity, mol L−1) specifies the amount of salt per unit volume of a solution (electrolyte), while “m” (molality, mol kg−1) denotes the concentration of salt dissolved in 1 kg of a solvent.
| Year | Electrolyte | Cathode | Cathode L/L (mg cm−2) | Anode | Anode L/L (mg cm−2) | Full cell cutoff (V/V) | Full cell average (V) | P/N ratio | C-rate | Capacity (mA h g−1) | Capacity calculation based | Cycle number (—) | Retention ratio (%) |
|---|---|---|---|---|---|---|---|---|---|---|---|---|---|
| 1994 | 5 M LiNO3 + LiOH/H2O or 10 M LiOAc/H2O or 10 M LiCl2/H2O17 | LiMn2O4 | 14 | VO2 (B) | — | 1.8/0.5 | 1.5 | — | 2 mA cm−2 | 50 | Cathode + anode | 20 | — |
| 1998 | 6 M LiNO3 + 0.0015 M LiOH/H2O53 | LiMn2O4 | — | Li2Mn4O9 or Li4Mn5O12 | — | 1.6/0.5 | 1.1 | — | 1 mA cm−2 | 100 | Cathode | 5 | 98 |
| 2000 | 1 M Li2SO4/H2O54 | LiNi0.81Co0.19O2 | — | LiV3O8 | — | 1.3/0.6 | 1.0 | 1.0 (mass) | 1 mA cm−2 | 20 | Cathode + anode | 100 | 40 |
| 2006 | 5 M LiNO3/H2O55 | LiMn2O4 | — | TiP2O7 or LiTi2(PO4)3 | — | 1.7/0.8 (TiP2O7) | 1.4 | 0.77 (mass) | 0.1C | 42 | Cathode + anode | 10 | 85 |
| 1.85/0.9 (LiTi2(PO4)3) | 1.5 | 0.87 (mass) | 0.1C | 45 | 10 | 75 | |||||||
| 2007 | 5 M LiNO3/H2O + LiOH (pH 11)56 | LiNi1/3Mn1/3Co1/3O2 | — | LixV2O5/polyaniline | — | 1.8/0.5 | 1.1 | 1.0 (capacity) | 0.2C | 42 | Cathode + anode | 30 | 50 |
| 2007 | 2 M Li2SO4/H2O57 | LiMn2O4 | — | LiV3O8 | — | 1.5/0.5 | 1.0 | — | 0.2C | 55 | Cathode | 400 | 18 |
| 2007 | Sat. LiNO3/H2O58 | LiCoO2 | — | LiV3O8 | — | 1.5/0.5 | 1.1 | — | 0.2 mA cm−2 | 55 | Cathode | 12 | 70 |
| 2007 | Sat. LiNO3/H2O59 | LiCoO2 | — | LiV3O8 | — | 1.5/0.5 | 1.1 | — | 3.4 mA cm−2 | 55 (0.2 mA cm−2) | Cathode | 100 | 36 |
| 2007 | 1 M Li2SO4/H2O60 | LiMn2O4 | 10 | LiTi2(PO4)3 | 10 | 1.85/0.0 | 1.5 | 1.0 (mass) | 10 mA cm−2 | 40 | Cathode + anode | 200 | 80 |
| 2007 | 5 M LiNO3/H2O61 | LiMn2O4 | — | LixV2O5 | — | 1.7/0.5 | 1.2 | 0.75 (mass) | 0.2C | 43 | Cathode + anode | 40 | 8 |
| 2008 | Sat. Li2SO4/H2O62 | LiMn2O4 | — | Polypyrrole | — | 1.6/0.0 | 0.6 | — | 0.2 mA cm−2 | 45 | Cathode | 22 | 85 |
| 2008 | 2 M Li2SO4/H2O63 | LiNi1/3Mn1/3Co1/3O2 | — | LiV3O8 | — | 1.5/0.3 | 0.8 | — | 0.2 mA cm−2 | 55 | — | 10 | 55 |
| 2009 | Sat. Li2SO4/H2O64 | LiMn0.05Ni0.05Fe0.9PO4 | — | LiTi2(PO4)3 | — | 1.2/0.6 | 0.9 | — | 0.2 mA cm−2 | 87 | Cathode | 50 | 65 |
| 2010 | 1 M Li2SO4/H2O (pH 13, O2-free)65 | LiFePO4 | 10 | LiTi2(PO4)3 | 10 | 1.4/0.0 | 0.9 | 1.0 (mass) | 0.13C | 55 (1C) | Cathode + anode | 50 | 85 |
| 6C | 1000 | 90 | |||||||||||
| 2010 | 10 mM Li2SO4/H2O66 | LiCoO2 | — | Polypyrrole | — | 1.5/0.1 | 0.9 | — | 0.1C | 48 | Cathode + anode | 130 | 63 |
| 2011 | Sat. LiNO3/H2O67 | LiMn2O4 | — | LiV3O8 | — | 1.4/0.25 | 0.9 | — | 0.2C | 120 | Cathode | 42 | 83 |
| 2012 | 0.5 M Li2SO4/H2O68 | LiMn2O4 | — | Polypyrrole coated MoO3 | — | 2.0/0.0 | 1.2 | 0.5 (mass) | 500 mA g−1 | 88 | Cathode | 150 | 90 |
| 2012 | 5 M LiNO3/H2O69 | LiNi1/3Mn1/3Co1/3O2/polypyrrole | 10 | LiV3O8 | — | 1.4/0.1 | 0.9 | — | 0.2 mA cm−2 | 70 | Cathode | 50 | 70 |
| 2012 | Sat. LiNO3/H2O70 | LiMn2O4 | — | Polyaniline | — | 1.5/0.5 | 1.1 | — | 75 mA g−1 | 110 | Anode | 100 | 82 |
| 2013 | 1 M Li2SO4/H2O71 | LiMn2O4 | 9 | TiP2O7 | 9 | 1.7/0.0 | 1.5 | 1.0 (mass) | 0.5C | 77 | Anode | 100 | 85 |
| 2013 | 9 m LiNO3/H2O (O2-free)72 | LiFePO4 | — | LiV3O8 | — | 0.8/0.0 | 0.2 | — | 1, 2, 5, 10C | 113 (1C) | Cathode | 100 | 99–100 |
| 20, 30, 50C | 200 | 99–100 | |||||||||||
| 2013 | Sat. LiNO3/H2O73 | LiFePO4 | — | VO2 | — | 1.4/0.0 | 0.3 | — | 0.33C | 106 | Cathode | 50 | 94 |
| 2014 | 5 M LiNO3/H2O74 | LiCoO2 | — | Polyimide | — | 1.8/0.0 | 1.12 | 1.2 (mass) | 500 mA g−1 | 71 | Cathode + anode | 200 | 80 |
| 2015 | 21 m LiTFSI/H2O18 | LiMn2O4 | 20 | Mo6S8 | 10 | 2.3/0.5 | 1.7 | 2.0 (mass) | 0.15C | 47 (0.15C) | Cathode + anode | 100 | 48 |
| 4.5C | 1000 | 68 | |||||||||||
| 2016 | 0.5 M Li2SO4/H2O75 | LiMn2O4 | — | Poly(naphthalene four formyl ethylenedi amine) | — | 2.4/0.0 | 1.1 | 1.2 (mass) | 10C | 69 | Cathode + anode | 1000 | 66 |
| 2016 | Li(TFSI)0.7(BETI)0.3·2H2O19 | LiCoO2 or LiNi0.5Mn1.5O4 | 3.0 or 1.4 | Li4Ti5O12 | 1.0 or 1.4 | 2.7/1.6 (LCO) | 2.4 | 1.1–1.3 (capacity, LCO) | 0.2C (LCO) | 40–55 (LCO) | Cathode + anode | 100 | 67 |
| 0.5C (LCO) | 100 | 79 | |||||||||||
| 3.4/2.8 (LNMO) | 3.1 | 2.5 (capacity, LNMO) | 10C (LCO) | 30 (LNMO) | 500 | 84 | |||||||
| 6.8C (LNMO) | 100 | 63 | |||||||||||
| 2016 | 21 m LiTFSI + 7 m LiOTf/H2O76 | LiMn2O4 | 8 | TiO2 | 4 | 2.5/0.8 | 2.1 | 2.0 (mass) | 0.5C (75 mA g−1) | 48 | Cathode + anode | 100 | 78 |
| 2017 | 2 M Li2SO4/H2O77 | LiMn2O4 | — | LiTi2(PO4)3/carbon | — | 1.85/0.0 | 1.5 | — | 0.2C | 108 | — | 200 | 88 |
| 5C | 1000 | 77 | |||||||||||
| 2017 | 2 M Li2SO4/H2O78 | LiMn2O4 | — | LiTi2(PO4)2.88F0.12 | 10–18 | 2.0/0.5 | 1.6 | 1.5–2.0 (mass) | 10C (1300 mA g−1) | 43 | Cathode + anode | 200 | 95 |
| 2015 | 5 M LiNO3/H2O79 | LiMn2O4 | 6 | Poly(1,4,5,8-naphthalene tetracarboxylic dianhydride) | 7.2 | 1.75/0.0 | 1.4 | 0.8 (mass) | 2C | 45 | Cathode + anode | 1000 | 95 |
| 2017 | 21 m LiTFSI/H2O80 | Polytriphenylamine | 1.1 | 1,4,5,8-Naphthalenetetra carboxylic dianhydride-derived polyimide | 1 | 2.1/0.05 | 1.0 | 1.1 (mass) | 4.6C (500 mA g−1) | 105 | Cathode | 700 | 86 |
| 2017 | 21 m LiTFSI/H2O81 | LiMn2O4 | 4.2 | TiS2 | 2.1 | 2.3/0.7 | 1.4 | 2.0 (mass) | 1C | 58 | Cathode + anode | 50 | 74 |
| 2017 | 2.5 M Li2SO4/H2O (pH 7 or pH 13)82 | LiMn2O4 or LiCoO2 | — | Poly(pyrene-4,5,9,10-tetraone) | 2.2 | 1.5/0.5 (LMO) | 1.1 | — | 1C | 81 | Cathode + anode | 3000 | 80 |
| 1.5/0.5 (LCO) | 1.2 | 1C | 55 | 700 | 83 | ||||||||
| 2017 | 21 m LiTFSI/H2O + HTFSI (pH 5)83 | LiNi0.5Mn1.5O4 | 20 | Mo6S8 | 8 | 2.9/0.8 | 2.4 | 2.5 (mass) | 0.5C | 34 (0.5C) | Cathode + anode | 50 | 90 |
| 5C | 400 | 75 | |||||||||||
| 2018 | 21 m LiTFSI/H2O84 | Li3V2(PO4)3 | 14 | LiTi2(PO4)3 | 7 | 1.9/0.5 | 1.3 | 2.0 (mass) | 0.1C | 124 (0.1C) | Anode | 100 | 83 |
| 1C | 1000 | 65 | |||||||||||
| 2019 | 56 m Li(PTFSI)0.6(TFSI)0.4·1H2O Li(PTFSI)0.6(TFSI)0.4·1.15H2O85 | LiCoO2 | 2–10 | Li4Ti5O12 | — | 2.7/1.7 | 2.4 | 0.7–1.0 (capacity) | 0.2C (25 °C) | 103 (0.2C) | Cathode | 100 | 77 |
| 5C (25 °C) | 100 | 84 | |||||||||||
| 1C (45 °C) | 92 (5C) | 100 | 74 | ||||||||||
| 1C (55 °C) | 100 | 67 | |||||||||||
| 2020 | 21 m LiTFSI/H2O86 | LiMn2O4 | — | Nb16W5O55 or Nb18W16O93 | 5–6 | 2.1/1.0 | 1.9 | — | 1C (Nb16W5O55) | 55 | — | 100 | 85 |
| 1C (Nb18W16O93) | 75 | 100 | 88 | ||||||||||
| 2022 | Li(TFSI)0.7(BETI)0.3·2H2O87 | Li1.2Ni0.2Mn0.6O2 | — | Li4Ti5O12 | — | 3.2/0.1 | 1.8 | 0.8 (capacity) | 0.5C | 82 | Cathode + anode | 100 | 85 |
| 100 | 87 |
In 1994, Li et al. reported a prototype aqueous Li-ion battery that exhibited a capacity of 10 mA h and operated at 1.5 V. Its composition included a LiMn2O4 cathode, a VO2(B) anode, and an electrolyte comprising 5 M LiNO3 and 0.001 M LiOH (Fig. 3).17 Despite being limited to only 20 continuous charge and discharge cycles, the theoretical energy density of this battery was 75 W h kg−1 based on the mass of the active materials, and the practical energy densities, including the electrolyte and other battery components, were predicted to be over 40–55 W h kg−1, comparable to those of the aqueous Pb acid (30–40 W h kg−1) and aqueous Ni–Cd (40–60 W h kg−1) batteries.
 | ||
| Fig. 3 Charge and discharge curves of a prototype aqueous LiMn2O4|VO2(B) battery.17,33 Reprinted with permission from Journal of The Electrochemical Society. | ||
There was no substantial improvement in the operating voltage and cycling stability of aqueous Li-ion batteries over the next 20 years, until their performance began to improve with the development of highly salt-concentrated aqueous electrolytes (Fig. 4 and 5).
 | ||
| Fig. 4 Advantages and limitations of nonaqueous, diluted aqueous, and salt-concentrated aqueous electrolytes. | ||
 | ||
| Fig. 5 (a) and (b) Broadened operating potential window in highly salt-concentrated aqueous electrolytes, such as water-in-salt (21 m LiTFSI/H2O) and dihydrate melt (28 m Li(TFSI)0.7(BETI)0.3·2H2O), contributing to an increase in output voltage of aqueous batteries.88 Reprinted with permission from Nature Energy. | ||
In 2015, Wang and Xu groups achieved the successful cycling of a LiMn2O4|Mo6S8 full cell using a water-in-salt (21 mol kg−1 (m) LiN(SO2CF3)2 (LiTFSI)/H2O) electrolyte at an operating voltage of 1.7 V (Fig. 6).18 However, notable enhancements were still necessary for achieving low C-rate cycling, as evidenced by a capacity retention less than 50% after 100 cycles at 0.15C; in contrast, stable reversibility was achieved at high C-rates, with 68% capacity retention after 1000 cycles at 4.5C. Furthermore, the cell design with high P/N ratios and a large amount of electrolyte rendered it challenging to improve the energy density of the batteries owing to the continuous loss of the electrolyte and Li+ sources at the electrode surface during charging and discharging. In 2016, Yamada et al. addressed these challenges by developing a 28 m dihydrate melt (Li(TFSI)0.7(BETI)0.3·2H2O) by exploring the eutectic points of two Li salts, LiTFSI and LiN(SO2C2F5)2 (LiBETI), thereby demonstrating the reversible cycling of 3 V-class aqueous Li-ion batteries for the first time (Fig. 7).19 A 2.4 V LiCoO2|Li4Ti5O12 battery, engineered with a P/N ratio of 1.1–1.3, exhibited a satisfactory capacity retention of 84% after 500 cycles at 10C. However, it demonstrated poor capacity retention at lower C-rates, retaining only 67% and 79% of its initial capacity after 100 cycles at 0.2 and 0.5C, respectively. The 3.1 V LiNi0.5Mn1.5O4|Li4Ti5O12 battery, configured with a high P/N ratio of 2.5 and operated at a high C-rate of 10C, demonstrated a capacity retention of only 63% after 100 cycles. In 2019, further progress was achieved by successfully operating a 2.4 V LiCoO2|Li4Ti5O12 battery with a P/N ratio close to 1 in an asymmetric imide salt (LiPTFSI; LiN(SO2CF3)(SO2C2F5))-based 56 m monohydrate-melt (Li(PTFSI)0.6(TFSI)0.4·1H2O) electrolyte (Fig. 7).85 The asymmetric structure of LiPTFSI helped in preventing crystallization and enhanced the electrochemical stability of the aqueous electrolyte, while promoting Li-ion transport owing to its improved anion-exchange ability and high rotational mobility.89–91 Consequently, 77%, 74%, and 67% of the initial capacity were retained after 100 cycles under various temperature and current conditions (25 °C/0.2C, 45 °C/1.0C, and 55 °C/1.0C, respectively). However, their reversibility still fell short of the typical standard defined in nonaqueous Li-ion batteries.
 | ||
| Fig. 6 (a) and (b) Cyclic voltammograms and galvanostatic charge and discharge curves of LiMn2O4 cathode and Mo6S8 anode in LiTFSI/H2O with various concentrations. (c) and (d) Electrochemical performance of aqueous LiMn2O4|Mo6S8 full cells in water-in-salt 21 m LiTFSI/H2O electrolyte.18 Reprinted with permission from Science. | ||
 | ||
| Fig. 7 (a) and (b) Preparation of dihydrate melt by exploring the eutectic point of Li(TFSI)x(BETI)1−x salt/water mixtures. (c) and (d) Cyclic voltammograms of Li4Ti5O12, LiCoO2, LiNi0.5Mn1.5O4 electrodes in Li(TFSI)0.7(BETI)0.3·2H2O.19 (e) and (f) Electrochemical performance of aqueous LiCoO2|Li4Ti5O12 full cells in the monohydrate-melt Li(PTFSI)0.6(TFSI)0.4·1H2O electrolyte.85 Reprinted with permission from Nature Energy and Electrochemistry Communications. | ||
Overall, owing to the development of new electrolytes and the optimization of the cell design, aqueous Li-ion batteries have achieved higher operating voltages (2–3 V) and improved cycle life (approximately 100 cycles at low C (≤0.5C), with a Coulombic efficiency of 98–99%) compared to the initial prototypes developed in 1994 (1.5 V and 20 cycles). However, the substantial loss of the electrolyte and Li+ sources at the electrode surfaces during continuous charge and discharge cycles, narrow operating temperature ranges, and other issues such as high P/N ratios, high electrolyte amounts, and susceptibility to self-discharge, highlight the need for extensive improvements in various aspects. A significant gap still exists between the operating conditions of not only traditional aqueous NiMH batteries (with energy densities of 60–120 W h kg−1 and 1000 cycles of reversibility), but also nonaqueous Li-ion batteries (operating voltage of ≥3.3 V and stable cycling under wide temperature ranges, with ≥1000 cycles at room temperature and several hundred cycles at low and high temperatures and Coulombic efficiencies ≥99.95%).
3. Sustainable alternatives to aqueous Na- and K-ion batteries: a greater challenge
Although rechargeable Li-ion batteries offer high energy density, their reliance on lithium—a resource primarily concentrated in a few geographic regions like South/North America, China, and Australia—raises concerns about global supply security, especially considering current geopolitical tensions.92–95 The widespread adoption of electric vehicles has increased the demand for Li, which, combined with the instability in the supply chain, has led to significant price fluctuations in Li, thereby aggravating concerns on the sustainability of Li-ion batteries (Fig. 8).92,93 Furthermore, the mining and extraction of Li can have adverse environmental impacts, including potential harm to groundwater resources and ecosystems.95 Given these challenges, including the limited availability and environmental concerns associated with Li resources, it becomes imperative to explore alternative battery technologies, such as aqueous Na- and K-ion batteries, which are potentially more sustainable and environmentally friendly.22–25 | ||
| Fig. 8 (a) Elemental abundance in Earth's crust,92 (b) distribution of Li resources on Earth,96 (c) evolution of the price of Li per metric ton of Li2CO3 equivalent units,97 (d) the estimated cost percentage of Li-ion electric vehicle battery components,98 (e) number of papers published on aqueous Na- and K-ion batteries.99 Reprinted with permission from Energy Storage Materials (b) and Journal of Physics: Energy (e). | ||
Practically, the battery output voltage is not solely determined by the difference in the chemical potential of the carrier ions in the cathode and anode, but is also limited by the operating potential window of the electrolyte. Failure to maintain the reaction potential range of the cathode and anode within the operating potential window of the electrolyte can result in severe electrolyte decomposition on the electrode surfaces; this aspect is detailed in Section 4.1. It is also important to consider the fast charge and discharge capabilities of batteries, commonly quantified as the battery power density (product of the battery output voltage and the maximum current that the battery can provide per unit weight or volume). The physicochemical differences in carrier ions impact essential factors such as the diffusion of ions into the bulk structure of the cathode and anode active materials, ion movement within the electrolyte, and the desolvation process of ions at the electrode surface, all of which influence the battery power density significantly. Table 2 presents the physicochemical properties of alkali ions. Ion movement within the aqueous electrolyte largely depends on the Stokes radius, representing the hydrated-ion size. Generally, an ion with a smaller Stokes radius encounters less resistance during its movement through the electrolyte, as it has fewer interactions with ions and water molecules. The Stokes radii of Na+ (1.84 Å) and K+ (1.25 Å) are smaller than that of Li+ (2.38 Å), suggesting that Na+ and K+ experience lower resistance compared to Li+ as they diffuse and migrate within the electrolyte.100
| Li+ | Na+ | K+ | |
|---|---|---|---|
| Stokes radius in water (Å) | 2.38 | 1.84 | 1.25 |
| Bond distance between H2O(O)–hydrated M+ ion (Å) | 1.90–2.17 (four coordination) | 2.34–2.50 (four–eight coordination) | 2.65–2.97 (five–eight coordination) |
| Shannon's ionic radius (Å) | 0.76 | 1.02 | 1.38 |
| LAXS&DDIR-based ionic radius (Å) | 0.60 (four coordination) | 1.02 (five coordination) | 1.38 (six coordination) |
| 0.79 (six coordination) | 1.07 (six coordination) | 1.46 (seven coordination) |
Furthermore, because of the weaker Lewis acidity of Na+ and K+ compared to that of Li+, the interactions between the ions and coordinating water molecules are significantly weaker in aqueous Na and K electrolytes. Numerous experimental101,105–112 and computer simulation107,113–116 studies have demonstrated that the bond distance between water and a hydrated alkali ion is greater for Na+ and K+, indicating that the solution viscosity and energy barrier for desolvation from the water molecules would be lower in aqueous Na and K electrolytes. All the physicochemical indicators related to hydrated ions, as discussed above, suggest that the ionic conductivity in aqueous electrolytes increases in the order K+ > Na+ > Li+.25,117,118
On the other hand, the ionic radii of Na+ (1.02–1.07 Å) and K+ (1.38–1.46 Å), determined by Shannon102 and in research using large angle X-ray scattering and double difference infrared spectroscopy,101 are larger than that of Li+ (0.60–0.79 Å), suggesting that the diffusion of Na+ and K+ into the bulk structure of the cathode and anode active materials tends to be relatively challenging compared to that of Li+. Therefore, developing active materials that facilitate rapid ion diffusion into the bulk structures is essential for the advancement of aqueous Na- and K-ion batteries.
Consequently, leveraging the advantages of Na+ and K+ as battery carrier ions would offer a competitive edge for aqueous Na- and K-ion batteries, compared to aqueous Li-ion batteries, in terms of resource strategy, cost reduction, sustainability, and high-power-density applications.
The battery performance of various aqueous Na- and K-ion full cells fabricated using diverse electrolytes and electrodes is summarized in Tables 3 and 4. In 2013, Qian and Yang's groups tested a 1.3 V aqueous Na-ion full cell composed of a Na2Ni[Fe(CN)6] cathode, NaTi2(PO4)3 anode, and 1 M Na2SO2/H2O electrolyte.119 This battery maintained 88% of its initial capacity after 250 cycles at 5C, indicating its feasibility as an aqueous Na-ion battery (Fig. 9). Subsequently, in 2018 and 2019, the groups led by Okada and Hu successfully developed 1.7 V aqueous Na-ion batteries utilizing highly salt-concentrated aqueous sodium electrolytes (Fig. 9).120,121 These included a Na2Mn[Fe(CN)6]|KMn[Cr(CN)6] battery with a 17 m NaClO4/H2O electrolyte, achieving 55% capacity retention after 100 cycles at 5C, and a Na1.88Mn[Fe(CN)6]0.97·1.35H2O|NaTiOPO4 battery with 9 m NaOTf (NaSO3CF3) and 22 m tetraethylammonium·OTf/H2O electrolytes, retaining 90% of its initial capacity after 200 cycles at 0.25C. In 2020, Li et al. reported a 1.3 V aqueous K-ion battery (Fig. 9).122 This battery was fabricated with a K1.85Fe0.33Mn0.67[Fe(CN)6]0.98·0.77H2O cathode, 3,4,9,10-perylenetetracarboxylic diimide (PTCDI) anode, and 22 m KOTf/H2O electrolyte, and exhibited 73% capacity retention after 2000 cycles at 4C.
| Year | Electrolyte | Cathode | Cathode L/L (mg cm−2) | Anode | Anode L/L (mg cm−2) | Full cell cutoff (V/V) | Full cell average (V) | P/N ratio | C-rate | Capacity (mA h g−1) | Capacity calculation based | Cycle number (—) | Retention ratio (%) |
|---|---|---|---|---|---|---|---|---|---|---|---|---|---|
| 2013 | 1 M Na2SO4/H2O123 | Na2Ni[Fe(CN)6] | 10 | NaTi2(PO4)3 | 5 | 1.6/0.2 | 1.2 | 2.0 (mass) | 5C | 90 | Anode | 250 | 88 |
| 2014 | 1 M Na2SO4/H2O124 | Na0.44MnO2 | — | Na2V6O16·nH2O | — | 1.6/0.4 | 0.8 | — | 40 mA g−1 | 30 | Cathode + anode | 30 | 80 |
| 2014 | 0.5 M Na2SO4/H2O125 | Na0.35MnO2 | — | Polypyrrole coated MoO3 | 3 | 1.7/0.0 | 1.0 | 1.0 (mass) | 550 mA g−1 | 24 | Anode | 1000 | 79 |
| 2014 | 1 M Na2SO4/H2O126 | K0.27MnO2 | — | NaTi2(PO4)3 | — | 1.8/0.0 | 0.8 | — | 200 mA g−1 | 62 | — | 100 | 85 |
| 2014 | 5 M NaNO3/H2O74 | NaVPO4F | — | Polyimide | — | 1.8/0.0 | 1.1 | 3.1 (mass) | 50 mA g−1 | 40 | Cathode + anode | 20 | 75 |
| 2014 | 10 m NaClO4 + Mn(ClO4)2/H2O127 | KCu[Fe(CN)6] | 10 | KMn[Cr(CN)6] | 10 | 1.3/0.5 | 0.9 | — | 10C | 23 | Cathode + anode | 1000 | 100 |
| 2014 | 1 M Na2SO4/H2O128 | CoCuHCF | — | Disodium naphthalenediimide | — | 1.5/0.5 | 1.1 | — | 20C charge | 34 | Cathode | 100 | 88 |
| 10C discharge | |||||||||||||
| 2015 | 1 M Na2SO4/H2O129 | (K,Na)-δ-MnO2 | — | NaTi2(PO4)3 | — | 1.8/0.0 | 0.9 | — | 200 mA g−1 | 68 | Cathode + anode | 200 | 87 |
| 2015 | 1 M Na2SO4/H2O130 | Na0.66Mn0.66Ti0.34O2 | 3.9 | NaTi2(PO4)3/C | 2.5 | 1.7/0.3 | 1.2 | 1.5 (mass) | 2C | 76 | — | 300 | 88 |
| 2015 | 1 M Na2SO4/H2O131 | NaFePO4 | — | NaTi2(PO4)3 | — | 1.3/0.4 | 0.6 | — | 1C | 70 | Cathode | 20 | 76 |
| 2015 | 1 M Na2SO4/H2O132 | Na2Co[Fe(CN)6] | — | NaTi2(PO4)3 | — | 2.0/0.5 | 1.3 | 0.8 (mass) | 5C | 95 | Cathode + anode | 100 | 98 |
| 2016 | 1 M Na2SO4/H2O133 | K0.27MnO2 | 1.2 | NaTi2(PO4)3 | 1.2 | 1.6/0.0 | 0.7 | — | 200 mA g−1 | 81 | — | 100 | 83 |
| 2016 | 1 M Na2SO4/H2O134 | Na3V2(PO4)3 | — | NaTi2(PO4)3 | — | 1.6/0.5 | 1.2 | 0.9 (mass) | 10![[thin space (1/6-em)]](https://www.rsc.org/images/entities/char_2009.gif) 000 mA g−1 000 mA g−1 |
58 | Cathode | 50 | 50 |
| 2016 | 1 M Na2SO4/H2O135 | Na3MnTi(PO4)3 | — | Na2MnTi(PO4)3 | — | 1.8/0.4 | 1.4 | 1.0 (mass) | 1C | 57 | — | 100 | 98 |
| 2017 | 9.3 m NaOTf/H2O136 | Na0.66Mn0.66Ti0.34O2 | — | NaTi2(PO4)3 | — | 1.7/0.2 | 1.0 | 2.0 (mass) | 1C | 25 | Cathode + anode | 1200 | 93 |
| 2017 | 17 m NaClO4/H2O137 | NaxMn[Fe(CN)6]y·zH2O | — | NaTi2(PO4)3 | 1.3/0.0 | 0.8 | — | 2 mA cm−2 | 117 | Cathode | 50 | 81 | |
| 2017 | 1 M NaNO3/H2O138 | Fe[Fe(CN)6] | — | Fe[Fe(CN)6] | — | 1.8/0.2 | 0.8 | 2.0 (mass) | 2C | 41 | Cathode + anode | 200 | 97 |
| 2018 | 1 M Na2SO4/H2O139 | Na0.44MnO2 | — | FePO4·2H2O | — | 1.2/0.0 | 0.6 | 2.4 (mass) | 3C | 70 | Anode | 300 | 87 |
| 2018 | 1 M Na2SO4/H2O140 | Na2VTi(PO4)3 | — | Na2VTi(PO4)3 | — | 1.5/0.2 | 1.1 | 1.1 (mass) | 10C | 41 | Cathode | 1000 | 70 |
| 2018 | 1 M Na2SO4 + 2 M MgSO4/H2O141 | Mn3O4 | — | NaTi2(PO4)3 | — | 1.85/0.4 | 1.2 | — | 1C | 103 | Cathode | 200 | 100 |
| 2018 | 8 m NaOAc + 32 m KOAc/H2O142 | Na2Mn[Fe(CN)6] | 2.3 | NaTi2(PO4)3/C | 1.9 | 1.5/0.5 | 0.9 | 1.2 (mass) | 100 mA g−1 | 57 | Anode | 85 | 65 |
| 2018 | 9.2 m NaOTf/H2O143 | Na2VTi(PO4)3 | — | Na2VTi(PO4)3/C | — | 1.5/0.5 | 1.1 | 1.0 (mass) | 20C | 25 | Cathode + anode | 1000 | 100 |
| 2018 | 1 M Na2SO4/H2O144 | Na4[Fe(CN)6] | — | NaTi2(PO4)3/C | — | 2.0/0.0 | 1.2 | 2.0 (mass) | 1C | 84 | Anode | 500 | 87 |
| 2018 | 17 m NaClO4/H2O145 | Na2Mn[Fe(CN)6] | 8 | KMn[Cr(CN)6] | 16 | 2.6/0.5 | 1.7 | 0.5 (mass) | 5C | 35 | Cathode + anode | 100 | 55 |
| 2019 | 1 M Na2SO4/H2O146 | Na0.27MnO2 | 3.5 | Na0.27MnO2 | 0.9 | 2.5/0.0 | 1.1 | 4.0 (mass) | 23C | 88 | Cathode + anode | 5000 | 100 |
| 2019 | 1 M Na2SO4 + 2 M MgSO4/H2O147 | MnO2/carbon nanotube | ∼5 | NaTi2(PO4)3 | ∼5 | 1.8/0.4 | 1.0 | 0.9 (mass) | 4C | 83 | Cathode | 1000 | 72 |
| 2019 | 5 M NaClO4/H2O148 | Na0.66Mn0.66Ti0.34O2 | 13 | Na1.5Ti1.5Fe0.5(PO4)3/C | 6.8 | 1.6/0.0 | 1.1 | 1.0 (mass) | 2C | 104 | Anode | 300 | 100 |
| 2019 | 17 m NaClO4/H2O149 | Na3V2(PO4)2F3/carbon nanotube | — | NaTi2(PO4)3/carbon nanotube | — | 2.1/0.6 | 1.5 | — | 1C | 75 | Cathode | 20 | 74 |
| 2019 | 1.5 M Na2SO4/H2O150 | NaFePO4 | 2–3 | Dissolved Na2S5 | — | 1.0/0.0 | 0.6 | — | 1C | 120 | Cathode | 200 | 38 |
| 2019 | 17 m NaClO4/H2O151 | Na2FePO4F | — | NaTi2(PO4)3 | — | 1.8/0.0 | 0.7 | 1.0 (mass) | 1 mA cm−2 | 85 | Cathode | 100 | 64 |
| 2019 | 2 M NaClO4/H2O152 | Nano Ni(OH)2 | — | NaTi2(PO4)3/C | 1–3 | 1.4/0.2 | 1.3 | 1.2 (mass) | 10C (50 °C) | 100 | Anode | 500 | 83 |
| 10C (25 °C) | 88 | 500 | 87 | ||||||||||
| 10C (−20 °C) | 83 | 500 | 100 | ||||||||||
| 2019 | 17 m NaClO4/H2O153 | Na2Mn[Fe(CN)6] | — | Na3Fe2(PO4)3 | — | 1.5/0.0 | 0.9 | 1.0 (mass) | 5C | 31 | Cathode + anode | 700 | 75 |
| 2019 | Sat. NaNO3/H2O154 | FeHCF | 2–3 | CuHCF | 2–3 | 1.5/0.0 | 0.7 | 0.8 (mass) | 5C | 50 | Cathode + anode | 250 | 96 |
| 2019 | 15 m NaClO4/H2O155 | TiS2 | 15 | NaxMny[Fe(CN)6]z | 15 | 2.6/0.8 | 1.7 | 1.0 (mass) | 1C | 40 | Cathode + anode | 150 | 90 |
| 2019 | 25 m NaFSI + 10 m NaFTFSI/H2O89 | Na3(VOPO4)2F | 4–6 | NaTi2(PO4)3 | — | 2.2/0.3 | 1.4 | 1.1–1.2 (mass) | 1C (30 °C) | 80 | Cathode | 500 | 77 |
| 0.5C (30 °C) | 83 | 100 | 85 | ||||||||||
| 0.5C (10 °C) | 81 | 100 | 75 | ||||||||||
| 0.5C (−10 °C) | 65 | 500 | 75 | ||||||||||
| 2019 | 9 m NaOTf + 22 m tetraethylammonium·OTf/H2O121 | Na1.88Mn[Fe(CN)6]0.97·1.35H2O | — | NaTiOPO4 | — | 2.6/0.6 | 1.7 | 0.5 (mass) | 0.25C | 41 (0.25C) | Cathode + anode | 200 | 90 |
| 2C | 800 | 76 | |||||||||||
| 2021 | 17 m NaClO4 + 2 m NaOTf/H2O156 | Na3V2(PO4)3 | 3 | Na3V2(PO4)3 | 5 | 1.9/0.8 | 1.7 | 1.2 (capacity) | 1C | 40 | Cathode + anode | 100 | 88 |
| 2021 | 26 m NaTFA/H2O157 | Na2VTi(PO4)3 | — | Na2VTi(PO4)3 | — | 2.0/0.0 | 1.2 | 2.0 (mass) | 2C | 32 | Cathode + anode | 300 | 85 |
| 2021 | 25 m NaFSI + 10 m NaFTFSI/H2O158 | Na3(VOPO4)2F | 2–5 | NaTi2(PO4)3 | 2–5 | 2.2/0.5 | 1.4 | 0.8 (mass) | 1C (P/N 0.8) | 85 | Cathode | 250 | 88 |
| 0.5 (mass) | 1C (P/N 0.5) | 110 | 250 | 84 | |||||||||
| 2023 | 1 M Na2SO4/H2O159 | Na3V1.3Fe0.5W0.2(PO4)3 | — | NaTi2(PO4)3 | — | 1.6/0.0 | 1.2 | 0.7 (mass) | 1000 mA g−1 | 64 | Cathode | 50 | 95 |
| Year | Electrolyte | Cathode | Cathode L/L (mg cm−2) | Anode | Anode L/L (mg cm−2) | Full cell cutoff (V/V) | Full cell average (V) | P/N ratio | C-rate | Capacity (mA h g−1) | Capacity calculation based | Cycle number (—) | Retention ratio (%) |
|---|---|---|---|---|---|---|---|---|---|---|---|---|---|
| 2016 | 3 M KCl/H2O160 | K0.22V1.74O4.37·0.82H2O | 1.6 | K0.22V1.74O4.37·0.82H2O | 1.6 | 0.6/−0.6 | 0.0 | 1.0 (mass) | 2000 mA g−1 | 62 (2000 mA g−1) | Cathode + anode | 5000 | 96 |
| 20000 mA g−1 |
42 (20000 mA g−1) |
5000 | 100 | ||||||||||
| 2019 | 22 m KOTf/H2O122 | K1.85Fe0.33Mn0.67[Fe(CN)6]0.98·0.77H2O | 5.8 | 3,4,9,10-Perylene tetracarboxylic diimide | 5.2 | 2.6/0.0 | 1.3 | 1.1–1.4 (mass) | 4C | 65 | Cathode + anode | 2000 | 73 |
| 2020 | 3 M KCl/H2O161 | Fe4[Fe(CN)6]3·3.4H2O | — | Fe4[Fe(CN)6]3·3.4H2O | — | 0.9/0.3 | 0.6 | 2.0 (mass) | — | 40 | Cathode | — | — |
| 2020 | Sat. 3.75 m KNO3/H2O162 | Fe[Fe(CN)6] | 8.5 | 1,4,5,8-Naphthalene tetracarboxylic dianhydride-derived polyimide | 5.5 | 2.0/0.0 | 0.7 | 1.5 (mass) | 2C | 56 | Cathode + anode | 300 | 74 |
| 2020 | 21 m KOTf/H2O163 | K1.93Fe[Fe(CN)6]0.97·1.82H2O | 6.5 | KiTi2(PO4)3/C | 6.5 | 2.3/0.0 | 1.5 | 1.0 (mass) | 200 mA g−1 | 73 (200 mA g−1) | Anode | 1000 | 99 |
| 500 mA g−1 | 44 (5000 mA g−1) | 3000 | 100 | ||||||||||
| 5000 mA g−1 | 30000 |
100 | |||||||||||
| 2020 | 21 m KFSI/H2O164 | Polytriphenylamine | — | 3,4,9,10-Perylene tetracarboxylic diimide | — | 1.6/0.0 | 0.7 | 1.0 (mass) | 500 mA g−1 | 48 | Cathode + anode | 900 | 95 |
| 2020 | 30 m KFSI/H2O165 | KxFey[Fe(CN)6]z | 1 | Perylene-3,4,9,10-tetracarboxylic dianhydride | 1 | 2.0/0.0 | 1.0 | 1.0 (mass) | 12.5C (2000 mA g−1) | 39 | Cathode + anode | 1000 | 89 |
| 2021 | 22 m KOTf/H2O166 | δ-K0.5V2O5 | — | 3,4,9,10-Perylene tetracarboxylic diimide | — | 1.75/0.0 | 0.9 | 1.0 (mass) | 10C | 85 | Cathode | 20000 |
77 |
| 2022 | 55 m K(FSI)0.6(OTf)0.4·1.0H2O167 | K2Fe0.5Mn0.5Fe(CN)6 | 0.5 | 3,4,9,10-Perylene tetracarboxylic diimide | 0.65 | 2.3/0.0 | 1.4 | 0.8 (mass) | 1C (156 mA g−1) | 100 | Cathode | 200 | 86 |
| 2022 | 21 m KOTf + 0.01–0.2 m Fe(OTf)3/H2O168 | K1.82Mn[Fe(CN)6]0.96·0.47H2O | 3.5 | 3,4,9,10-Perylene tetracarboxylic diimide | 3.5 | 2.2/0.0 | 1.3 | — | 1500 mA g−1 | 58 | Cathode + anode | 1500 | 82 |
 | ||
| Fig. 9 (a)–(c) Reversible cycling of the Na2Ni[Fe(CN)6] cathode, NaTi2(PO4)3 anode, and their full cell in 1 M Na2SO4/H2O.119 (d)–(f) Electrochemical performance of aqueous Na2Mn[Fe(CN)6]|KMn[Cr(CN)6] full cell in 17 m NaClO4/H2O.120 (g) and (h) Diagram representing a highly salt-concentrated aqueous electrolyte of 9 m NaOTf and 22 m tetraethylammonium·OTf/H2O, and the cycling stability of the aqueous Na1.88Mn[Fe(CN)6]0.97·1.35H2O|NaTiOPO4 full cell in this electrolyte.121 (i)–(k) Broadened operating potential window in 22 m KOTf/H2O, contributing to the stable cycling of a 1.3 V aqueous K-ion battery, K1.85Fe0.33Mn0.67[Fe(CN)6]0.98·0.77H2O|PTCDI.122 Reprinted with permission from Electrochemistry Communications (a)–(c), Small Methods (d)–(f), Advanced Materials (g) and (h), and Nature Energy (i)–(k). | ||
Nevertheless, the output voltage and cycling stability of aqueous Na- and K-ion batteries are even lower than those of the aqueous Li-ion systems. The weaker Lewis acidity and larger ionic radii of Na+ and K+ compared to those of Li+ pose challenges in widening the operating potential window of aqueous Na and K electrolytes and limit the development of suitable cathode and anode active materials (details are discussed in Sections 4.1, 5.2, and 5.3).
4. Outstanding challenges with advanced aqueous electrolytes
The critical issues with aqueous rechargeable batteries, such as the low output voltage, high P/N ratio, inferior cycling stability, and poor Coulombic efficiency even at room temperature, largely stem from the inherent limitations of aqueous electrolytes. To increase the battery output voltage and achieve stable cycling characteristics, it is imperative to suppress the continuous oxidation- and reduction-driven decomposition of the electrolyte at the cathode and anode surfaces. A conventional method to enhance the electrochemical stability of rechargeable aqueous batteries involves adjusting the pH of the electrolyte to optimize the operating potential window with the electrode reaction potentials (Fig. 10).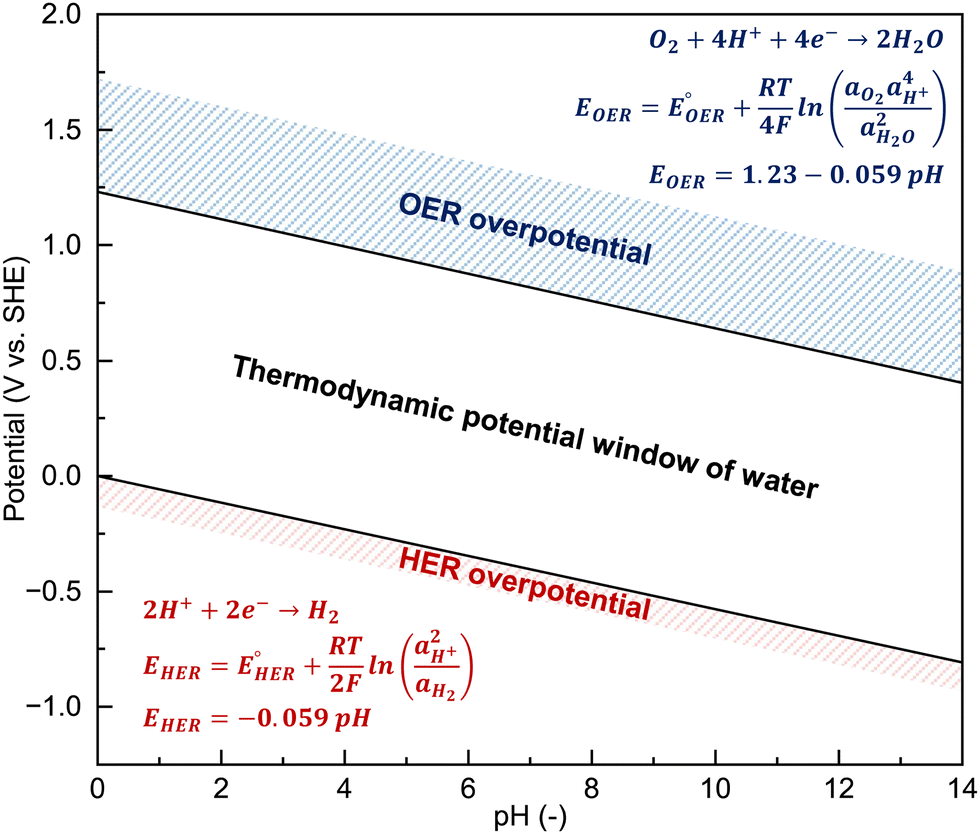 | ||
Fig. 10 pH dependency of the potential window of pure water. Thermodynamic potentials of the HER (EHER) and OER (EOER) can be estimated using the Nernst equation under ideal conditions, with standard redox potentials of the HER  and OER and OER  and the activities of water (aH2O = 1), hydrogen gas (aH2 = 1 bar), and oxygen gas (aO2 = 1 bar). and the activities of water (aH2O = 1), hydrogen gas (aH2 = 1 bar), and oxygen gas (aO2 = 1 bar). | ||
For instance, when aqueous Li-ion batteries were initially developed in 1994, an alkaline solution comprising 5 M LiNO3 and 0.001 M LiOH/H2O was employed to ensure the stable cycling of the VO2(B) anode (Table 1 and Fig. 3).17 On the other hand, an acidic, highly salt-concentrated electrolyte was utilized to enhance the cycling performance of the high-potential LiNi0.5Mn1.5O4 cathode (Table 1). However, this approach was not fundamentally effective for expanding the operating potential window of the electrolyte, as it was limited by the relatively low chemical stability of most candidate cathode and anode active materials and cell components in low- or high-pH environments.
When highly salt-concentrated aqueous electrolytes were introduced in 2015 and 2016, the elimination of free water molecules and water clusters was emphasized, which contributed to the widening of the operating potential window and thereby enhanced the battery energy density and cycling performance. The experimentally estimated operating potential windows of recently developed aqueous Li-, Na-, and K-ion electrolytes are summarized in Tables 5–7. For instance, compared to a 1.2 mol LiTFSI/H2O electrolyte, a 21 m LiTFSI/H2O electrolyte significantly improved the anodic and cathodic stabilities on stainless steel (SUS) by over 0.3 V each.18 In a 56 m Li(PTFSI)0.6(TFSI)0.4·1H2O electrolyte, the anodic stability on Pt increased by 0.6 V, while the cathodic stability on Al increased by over 1.5 V, allowing the Al–Li alloy reaction to proceed at 0.2–0.6 V vs. Li/Li+ in the aqueous system.85 Similar beneficial effects were observed in highly salt-concentrated aqueous Na- and K-ion electrolytes. The anodic and cathodic stabilities on Pt in 35 m NaFSI/H2O improved by over 0.5 and 0.2 V, respectively, compared to those on 1.2 m NaTFSI/H2O.169 The use of a 62 m K(FSI)0.55(OTf)0.45·0.9H2O electrolyte increased the anodic stability on Pt by 0.4–0.8 V compared to that of diluted aqueous electrolytes such as 1.0 m KOAc (KCH2COO)/H2O, 1.0 m KFSI (KN(SO2F)2)/H2O, and 1.3 m KTFSI/H2O, while the cathodic stability on Al increased by 0.3–1.3 V.167,170
| Year | Electrolyte | pH | Viscosity (mPa s) | Ionic conductivity (mS cm−1) | Reduction stability | Oxidation stability | |||||||||
|---|---|---|---|---|---|---|---|---|---|---|---|---|---|---|---|
| V vs. Ag/AgCl | V vs. Ag/AgCl | ||||||||||||||
| LSV scan rate, mV s−1 | LSV scan rate, mV s−1 | ||||||||||||||
| LSV cut-off condition, µm cm−2 | LSV cut-off condition, µm cm−2 | ||||||||||||||
| Pt | Al | Au | Ti | SUS | Pt | Al | Au | Ti | SUS | Carbon | |||||
| 2015 | 21 m LiTFSI/H2O18,171–174 | 6 | 51 | 10 | −0.7 V | −1.5 V | −0.5 V | 1.35 V | −1.34 V | 1.6 V | 2.1 V | 1.7 V | >2.0 V | 1.66 V | >2.0 V |
| 0.1 mV s−1 | 1 mV s−1 | 10 mV s−1 | 0.1 mV s−1 | 10 mV s−1 | 1 mV s−1 | 10 mV s−1 | 10 mV s−1 | 0.1 mV s−1 | 10 mV s−1 | 0.1 mV s−1 | |||||
| 20 µm cm−2 | 15 µm cm−2 | 50 µm cm−2 | 20 µm cm−2 | 180 µm cm−2 | 15 µm cm−2 | 50 µm cm−2 | 50 µm cm−2 | 20 µm cm−2 | 180 µm cm−2 | 20 µm cm−2 | |||||
| 2016 | 1.2 m LiTFSI/H2O19,174 | 8 | 1.5 | 42 | −0.89 V | −1.46 V | −1.19 V | −1.0 V | 1.21 V | >2.5 V | 1.3 V | ||||
| 0.1 mV s−1 | 0.1 mV s−1 | 0.1 mV s−1 | 0.1 mV s−1 | 0.1 mV s−1 | 0.1 mV s−1 | 0.1 mV s−1 | |||||||||
| 10 µm cm−2 | 10 µm cm−2 | 10 µm cm−2 | 10 µm cm−2 | 10 µm cm−2 | 10 µm cm−2 | 10 µm cm−2 | |||||||||
| Li(TFSI)0.7(BETI)0.3·2H2O19 | — | 203 | 3 | −0.89 V | −2.0 V | −1.3 V | −1.2 V | 1.81 V | 2.0 V | >2.5 V | 1.81 V | ||||
| 0.1 mV s−1 | 0.1 mV s−1 | 0.1 mV s−1 | 0.1 mV s−1 | 0.1 mV s−1 | 0.1 mV s−1 | 0.1 mV s−1 | 0.1 mV s−1 | ||||||||
| 10 µm cm−2 | 10 µm cm−2 | 10 µm cm−2 | 20 µm cm−2 | 10 µm cm−2 | 20 µm cm−2 | 10 µm cm−2 | 10 µm cm−2 | ||||||||
| 2016 | 21 m LiTFSI + 7 m LiOTf/H2O76,175 | — | — | 6.5 | −1.74 V | −1.41 V | 1.66 V | 0.86 V | |||||||
| 1 mV s−1 | 10 mV s−1 | 10 mV s−1 | 1 mV s−1 | ||||||||||||
| 2 µm cm−2 | 4000 µm cm−2 | 4000 µm cm−2 | 2 µm cm−2 | ||||||||||||
| 2018 | 1 m LiNO3/H2O176,177 | 7 | 1 | 71 | −0.89 V | 1.31 V | |||||||||
| 10 mV s−1 | 10 mV s−1 | ||||||||||||||
| 10 µm cm−2 | 10 µm cm−2 | ||||||||||||||
| 25 m LiNO3/H2O176,177 | 3.6 | — | 0.74 | −0.85 V | 1.75 V | ||||||||||
| 0.1 mV s−1 | 0.1 mV s−1 | ||||||||||||||
| 500 µm cm−2 | 500 µm cm−2 | ||||||||||||||
| Sat. LiNO3/H2O (1/2.5, n/n)176,177 | — | — | — | −0.89 V | 1.66 V | ||||||||||
| 10 mV s−1 | 10 mV s−1 | ||||||||||||||
| 10 µm cm−2 | 10 µm cm−2 | ||||||||||||||
| 2018 | 21 m LiTFSI/H2O + 3 mol% Mg(TFSI)2178 | — | 82 | 9 | −2.5 V | 1.6 V | |||||||||
| 1 mV s−1 | 1 mV s−1 | ||||||||||||||
| 15 µm cm−2 | 15 µm cm−2 | ||||||||||||||
| 21 m LiTFSI/H2O + 5 mol% Ca(TFSI)2178 | — | 90 | 6 | −2.75 V | 1.6 V | ||||||||||
| 1 mV s−1 | 1 mV s−1 | ||||||||||||||
| 15 µm cm−2 | 15 µm cm−2 | ||||||||||||||
| 2018 | 8 m LiOAc + 32 m KOAc/H2O179 | — | 374 | 5 | −1.3 V | 1.4 V | |||||||||
| 0.2 mV s−1 | 0.2 mV s−1 | ||||||||||||||
| 100 µm cm−2 | 100 µm cm−2 | ||||||||||||||
| 2019 | Li(PTFSI)0.6(TFSI)0.4·1H2O91 | — | 8555 | 0.1 | −0.89 V | −3.0 V | 1.81 V | 1.42 V | >2.8 V | ||||||
| 0.1 mV s−1 | 0.1 mV s−1 | 0.1 mV s−1 | 0.1 mV s−1 | 0.1 mV s−1 | |||||||||||
| 10 µm cm−2 | 10 µm cm−2 | 10 µm cm−2 | 10 µm cm−2 | 10 µm cm−2 | |||||||||||
| Year | Electrolyte | pH | Viscosity (mPa s) | Ionic conductivity (mS cm−1) | Reduction stability | Oxidation stability | ||||||||
|---|---|---|---|---|---|---|---|---|---|---|---|---|---|---|
| V vs. Ag/AgCl | V vs. Ag/AgCl | |||||||||||||
| LSV scan rate, mV s−1 | LSV scan rate, mV s−1 | |||||||||||||
| LSV cut-off condition, µm cm−2 | LSV cut-off condition, µm cm−2 | |||||||||||||
| Pt | Al | Au | Ti | SUS | Pt | Al | Au | Ti | SUS | |||||
| 2017 | 8 m NaTFSI/H2O180 | — | 80 | 48 | ||||||||||
| 2017 | 9 m NaOTf/H2O121,136 | — | — | 50 | −1.4 V | −1.3 V | −1.2 V | 1.3 V | 1.3 V | |||||
| 10 mV s−1 | 10 mV s−1 | 10 mV s−1 | 10 mV s−1 | 10 mV s−1 | ||||||||||
| 100 µm cm−2 | 100 µm cm−2 | 100 µm cm−2 | 100 µm cm−2 | 100 µm cm−2 | ||||||||||
| 2017 | 17 m NaClO4/H2O137,181–183 | 6 | 5 | 108 | −0.9 V | −1.1 V | −1.21 V | 1.6 V | 1.5 V | 1.59 V | ||||
| 2019 | 0.1 mV s−1 | 1 mV s−1 | 10 mV s−1 | 0.1 mV s−1 | 1 mV s−1 | 10 mV s−1 | ||||||||
| 10 µm cm−2 | 50 µm cm−2 | 100 µm cm−2 | 10 µm cm−2 | 50 µm cm−2 | 100 µm cm−2 | |||||||||
| 2018 | 8 m NaOAc + 32 m KOAc/H2O142 | 11 | — | 12 | −2.0 V | −1.7 V | >2.5 V | >2.5 V | ||||||
| 10 mV s−1 | 10 mV s−1 | 10 mV s−1 | 10 mV s−1 | |||||||||||
| 50 µm cm−2 | 50 µm cm−2 | 50 µm cm−2 | 50 µm cm−2 | |||||||||||
| 2019 | 1.2 m (1 M) NaTFSI/H2O90 | 6 | 1.5 | 43 | −0.85 V | −1.35 V | 1.15 V | >2.3 V | ||||||
| 0.5 mV s−1 | 0.5 mV s−1 | 0.5 mV s−1 | 0.5 mV s−1 | |||||||||||
| 20 µm cm−2 | 20 µm cm−2 | 20 µm cm−2 | 20 µm cm−2 | |||||||||||
| 18 m Na(PTFSI)0.65(TFSI)0.14(OTf)0.21·3H2O90 | 6 | 47 | 14 | −1.0 V | −1.65 V | 1.7 V | >2.3 V | |||||||
| 0.5 mV s−1 | 0.5 mV s−1 | 0.5 mV s−1 | 0.5 mV s−1 | |||||||||||
| 20 µm cm−2 | 20 µm cm−2 | 20 µm cm−2 | 20 µm cm−2 | |||||||||||
| 2019 | 35 m NaFSI/H2O89,169,184 | 4 | 8 | 95 | −1.1 V | −0.9 V | 1.6 V | 1.8 V | ||||||
| 0.1 mV s−1 | 0.1 mV s−1 | 0.1 mV s−1 | 0.1 mV s−1 | |||||||||||
| 5 µm cm−2 | 10 µm cm−2 | 5 µm cm−2 | 10 µm cm−2 | |||||||||||
| 2019 | 30 m NaFSI + 5 m NaFTFSI/H2O + hydroxide solution89 | 5 | 83 | 13 | −1.1 V | −1.3 V | 1.7–1.8 V | |||||||
| 25 m NaFSI + 10 m NaTFSI/H2O + hydroxide solution | 5 | 94 | 12 | 0.1 mV s−1 | 0.1 mV s−1 | 0.1 mV s−1 | ||||||||
| 5 µm cm−2 | 10 µm cm−2 | 10 µm cm−2 | ||||||||||||
| 2020 | 9 m NaOTf + 22 m tetraethylammonium·OTf/H2O121 | — | 30 | 11 | −1.7 V | −1.4 V | −1.4 V | 1.6 V | 1.5 V | |||||
| 10 mV s−1 | 10 mV s−1 | 10 mV s−1 | 10 mV s−1 | 10 mV s−1 | ||||||||||
| 100 µm cm−2 | 100 µm cm−2 | 100 µm cm−2 | 100 µm cm−2 | 100 µm cm−2 | ||||||||||
| 2021 | 26 m NaTFA/H2O (1/2.1, n/n)157 | 7 | — | 22 | −1.8 V | −1.15 V | >2.0 V | 1.65 V | ||||||
| 0.5 mV s−1 | 0.5 mV s−1 | 0.5 mV s−1 | 0.5 mV s−1 | |||||||||||
| 50 µm cm−2 | 50 µm cm−2 | 50 µm cm−2 | 50 µm cm−2 | |||||||||||
| 2023 | 28 m Na(PTFSI)0.55(HTFSI)0.45·2H2O185 | 6 | 293 | 3 | −1.1 V | −1.65 V | 1.7 V | >2.0 V | ||||||
| 0.5 mV s−1 | 0.5 mV s−1 | 0.5 mV s−1 | 0.5 mV s−1 | |||||||||||
| 20 µm cm−2 | 20 µm cm−2 | 20 µm cm−2 | 20 µm cm−2 | |||||||||||
| Year | Electrolyte | pH | Viscosity (mPa s) | Ionic conductivity (mS cm−1) | Reduction stability | Oxidation stability | ||||||||
|---|---|---|---|---|---|---|---|---|---|---|---|---|---|---|
| V vs. Ag/AgCl (sat. KCl) | V vs. Ag/AgCl (sat. KCl) | |||||||||||||
| LSV scan rate, mV s−1 | LSV scan rate, mV s−1 | |||||||||||||
| LSV cut-off condition, µm cm−2 | LSV cut-off condition, µm cm−2 | |||||||||||||
| Pt | Al | Ti | SUS | Carbon | Pt | Al | Ti | SUS | Carbon | |||||
| 2018 | 1 m (0.9 M) KOAc/H2O122,179,186,187 | 7.8–9.8 | 1 | 48–61 | −0.75 V | −0.5 V | −0.59 V | 0.8 V | 0.9 V | 0.64 V | ||||
| 2020 | 0.2 mV s−1 | 0.2 mV s−1 | 1 mV s−1 | 0.2 mV s−1 | 0.2 mV s−1 | 1 mV s−1 | ||||||||
| 100 µm cm−2 | 100 µm cm−2 | 100 µm cm−2 | 100 µm cm−2 | 100 µm cm−2 | 100 µm cm−2 | |||||||||
| 25 m (10 M) KOAc/H2O187–189 | 6.9 | 25 | 31 | −0.76 V | 0.47 V | |||||||||
| 1 mV s−1 | 1 mV s−1 | |||||||||||||
| 100 µm cm−2 | 100 µm cm−2 | |||||||||||||
| 30 m KOAc/H2O122,179,186,187,189 | — | 36 | 32 | −1.25 V | −1.7 V | 1.35 V | 1.2 V | 1.5 V | ||||||
| 0.5 mV s−1 | 1 mV s−1 | 0.5 mV s−1 | 0.5 mV s−1 | 1 mV s−1 | ||||||||||
| 10 µm cm−2 | 10 µm cm−2 | 10 µm cm−2 | 10 µm cm−2 | 10 µm cm−2 | ||||||||||
| 2019 | 40 m KOAc/H2O + 10 m LiOAc·2H2O190 | — | 185 | 11 | −1.2 V | −1.2 V | 1.65 V | |||||||
| 10 mV s−1 | 10 mV s−1 | 10 mV s−1 | ||||||||||||
| 200 µm cm−2 | 940 µm cm−2 | 200 µm cm−2 | ||||||||||||
| 2019 | 40 m KCOOH (potassium formate)/H2O (K:H2O = 1:1.38, n:n)189 |
— | — | 46 | −2.5 V | 1.5 V | ||||||||
| 10 mV s−1 | 10 mV s−1 | |||||||||||||
| 100 µm cm−2 | 100 µm cm−2 | |||||||||||||
| 2019 | 21–22 m KOTf/H2O122,167 | — | 76 | 6.5 | −0.78 V | −1.3 V | 0.76 V | 1.7 V | ||||||
| 5 mV s−1 | 10 mV s−1 | 5 mV s−1 | 10 mV s−1 | |||||||||||
| 5 µm cm−2 | 200 µm cm−2 | 5 µm cm−2 | 200 µm cm−2 | |||||||||||
| 2019 | 1.3 m (1 M) KTFSI/H2O90 | 6 | 1 | 58 | −0.85 V | −1.45 V | 1.25 V | >2.6 V | ||||||
| 0.5 mV s−1 | 0.5 mV s−1 | 0.5 mV s−1 | 0.5 mV s−1 | |||||||||||
| 20 µm cm−2 | 20 µm cm−2 | 20 µm cm−2 | 20 µm cm−2 | |||||||||||
| 28 m K(PTFSI)0.12(TFSI)0.08(OTf)0.8·2H2O90 | 6 | 26 | 35 | −0.9 V | −1.65 V | 1.6 V | >2.6 V | |||||||
| 0.5 mV s−1 | 0.5 mV s−1 | 0.5 mV s−1 | 0.5 mV s−1 | |||||||||||
| 20 µm cm−2 | 20 µm cm−2 | 20 µm cm−2 | 20 µm cm−2 | |||||||||||
| 2020 | 1 m KFSI/H2O170 | 5 | 0.9 | 61 | −0.75 V | −1.4 V | 1.15 V | 2.1 V | ||||||
| 0.5 mV s−1 | 0.5 mV s−1 | 0.5 mV s−1 | 0.5 mV s−1 | |||||||||||
| 20 µm cm−2 | 20 µm cm−2 | 20 µm cm−2 | 20 µm cm−2 | |||||||||||
| 30–31 m KFSI/H2O165,167,170 | — | 17 | 40 | −1.5 V | −1.51 V | 1.0 V | 2.46 V | |||||||
| 5 mV s−1 | 10 mV s−1 | 5 mV s−1 | 10 mV s−1 | |||||||||||
| 5 µm cm−2 | 20 µm cm−2 | 5 µm cm−2 | 20 µm cm−2 | |||||||||||
| 62 m K(FSI)0.55(OTf)0.45·0.9H2O170 | 5 | 98 | 12 | −1.05 V | −1.8 V | 1.65 V | >2.4 V | |||||||
| 0.5 mV s−1 | 0.5 mV s−1 | 0.5 mV s−1 | 0.5 mV s−1 | |||||||||||
| 20 µm cm−2 | 20 µm cm−2 | 20 µm cm−2 | 20 µm cm−2 | |||||||||||
However, most studies have approximately estimated the operating potential window of aqueous electrolytes using potentiostatic methods such as linear sweep voltammetry (LSV). The stability of the electrolyte depends on various factors, including the type of electrodes and the test conditions (e.g., scan rate and cut-off current density). Kühnel et al. estimated the potential window of aqueous electrolytes using LSV at 0.1 mV s−1 and noted significant variations depending on the types of substrates and cut-off current conditions (Fig. 11).171 For instance, the potential window of 21 m LiTFSI/H2O exceeded 3.5 V when substrates like Al and Ti were combined, offering high overpotentials toward water hydrolysis and a high cut-off current density of 250 µA cm−2. However, the potential window was less than 1.0 V with substrates like Pt, which has a low overpotential and a small cut-off current density of 2 µA cm−2. Moreover, the surface areas of active materials and carbon additives are typically ten to thousand times larger than those of Al or Ti electrodes, and such materials exhibit much stronger catalytic effects on water electrolysis.19,21,91,191 Generally, batteries operate in the galvanostatic mode and are often stored in a charged state for extended periods, subjecting them to harsher conditions compared to those in the potentiostatic mode. Consequently, despite the wide estimated operating potential window of highly salt-concentrated aqueous electrolytes, which ranges from 3 to 5 V as determined by LSV, aqueous rechargeable batteries exhibit significantly lower output voltages and poorer cycling stabilities.
 | ||
| Fig. 11 (a)–(d) Results of LSV conducted at 0.1 mV s−1 in LiTFSI/H2O with various salt concentrations, using SUS for the anode and gold for the cathode substrates. (b)–(d) Estimated potential window of 21 m LiTFSI/H2O (pH 5) with different cut-off current densities and substrates.171 Reprinted with permission from Journal of The Electrochemical Society. | ||
This discrepancy indicates that the fundamental issues with aqueous electrolytes and battery systems must be carefully examined under appropriate experimental conditions.
4.1. Thermodynamic and kinetic limitations in expanding the operating potential window
A comprehensive understanding of the science behind the operating potential window is paramount. The thermodynamic potential window of pure water is only 1.23 V; surpassing this range typically leads to the oxygen evolution reaction (OER) at the cathode and the HER at the anode surfaces, disrupting the role of the electrolyte as a mediator for carrier ion transport. In dilute solutions, carrier ions and anions are surrounded by multiple water molecules, forming solvent-separated ion-pair structures. Concurrently, the water molecules tend to form clusters through hydrogen-bonded networks.As the salt concentration increases, a distinct solution structure is generated. In this structure, the carrier ions intricately coordinate with anions and water molecules, altering the electron state of anions and water molecules and disrupting the formation of hydrogen bonds between the water molecules. Importantly, differences in the Lewis acidity of the carrier ions (Li+, Na+, and K+) significantly influence the thermodynamic and kinetic factors related to the operating potential windows of aqueous electrolytes, as discussed later.
In highly salt-concentrated electrolytes, the robust coordination between the strong Lewis acid Li+ and water molecules serves as a potent force in disrupting the hydrogen bonds among water molecules. For instance, in 56 m Li(PTFSI)0.6(TFSI)0.4·1H2O, water clusters almost disappear, and only hydrated water molecules coordinated to Li+ remain.85 This was evidenced by the disappearance of the O–H stretching vibration peaks of free water molecules (2900–3800 cm−1), with only a sharp peak remaining at 3565 cm−1 (Fig. 12). Density functional theory-based molecular dynamics (DFT-MD) calculations have further confirmed these observations in the solution structure (Fig. 12). These calculations indicated a decrease in the water activity and the existence of strong interactions between water molecules and Li+, contributing to an increased oxidation potential of water and thermodynamically improved anodic stability in the electrolyte.
 | ||
| Fig. 12 (a) Raman spectra of LiPTFSI solutions and the monohydrate melt, Li(PTFSI)0.6(TFSI)0.4·1H2O. (b) Solution structure of the monohydrate melt obtained through DFT-MD simulations. (c) Number of hydrogen bonds and coordination to cations around a water molecule in the given electrolytes.85 Reprinted with permission from Electrochemistry Communications. | ||
However, while the anodic stability improves, the reduction potential of water also increases. The strong interaction between Li+ and H2O facilitates the release of H+ from H2O.192,193 Consequently, as the concentration of the Li salt in the solution increases, the activity of H+ increases (resulting in a decrease in pH), and the thermodynamic HER potential is upshifted (Fig. 13). The detailed implications of these shifts in the electrode potentials related to the variation in the activity of carrier ions in the electrolyte are discussed in Section 6.1.
 | ||
| Fig. 13 Electrode potential shifts (a) without and (b) with consideration of the H+ activity in LiTFSI/H2O electrolytes.192,193 Reprinted with permission from The Journal of Chemical Physics. | ||
The development of aqueous Li electrolytes, particularly with an emphasis on enhancing the kinetic hindrance of the HER through the formation of a protective surface film, known as the SEI, on the anode surface, is of utmost importance. Initial studies involving aqueous electrolytes with concentrated LiNO3 or Li2SO4 showed no evidence of the formation of a functional SEI, leading to the operating potential window of such solutions being largely dependent on the thermodynamic potential of water reduction.194–196 The significance of the SEI in aqueous electrolytes has been increasingly recognized with the introduction of highly salt-concentrated electrolytes containing imide salts.18
However, the formation and stable maintenance of the SEI pose significant challenges in aqueous electrolytes. The competitive reduction of water, leading to the generation of hydrogen gas bubbles, can impede the stable growth of the SEI from anion reduction on the anode surface.21,197 Additionally, most components of an anion-derived SEI are susceptible to water. For example, NO3− anions are reduced to NHxOy and N2, while SO42− anions are reduced to SOx and H2S, all of which readily dissolve in or react with water, thus impeding the stable maintenance of the SEI.195,196 In conventional dilute solutions, which contain many water clusters with high water activity, the formation of a stable SEI is exceedingly challenging.21,197
In contrast, in highly salt-concentrated aqueous Li electrolytes based on imide salts, the stability of the SEI is significantly enhanced. In these electrolytes, two critical changes occur. The lowest unoccupied molecular orbital levels of the anions become lower than those of the water molecules, allowing the rapid formation of an SEI with the reduction of the anions at a higher potential than that of the HER (Fig. 14).198–202
 | ||
| Fig. 14 (a) Normalized partial density of states (PDOS, per ion and/or molecule) of the dihydrate melt, Li(TFSI)0.7(BETI)0.3·2H2O.198,199 (b) Suppressed solubility of model components in the SEI within the dihydrate melt.21 (c) Histograms showing water cluster distribution in hydrate melts with various carrier ions.198 Reprinted with permission from The Journal of Chemical Physics Letters (a), ACS Applied Materials & Interfaces (b) and (c). | ||
The maintenance of the SEI is also improved because the reduction products of the imide salts, such as LiF and LixHyNSO2CF3, exhibit low solubility or low reactivity with water.203–205 Moreover, the unique solution structure of these electrolytes, with minimal formation of water clusters owing to the strong Lewis acidity of Li+, substantially stabilizes the SEI (Fig. 14).198,199 Consequently, highly salt-concentrated aqueous Li electrolytes based on imide salts offer an expanded operating potential window that is more than twice as wide as that of diluted solutions, with thermodynamically and kinetically improved oxidation and reduction stabilities, respectively (Fig. 14).
On the other hand, the weaker Lewis acidity of Na+ and K+ presents challenges in expanding the operating potential window of aqueous electrolytes. The interactions among carrier ions (Na+ and K+), anions, and water molecules are relatively weak, resulting in several limitations: (1) the degree of variation in the electronic states of water molecules and anions is limited, leading to lower oxidation stability of the electrolyte.198–202 (2) It is difficult to achieve an anion reduction potential that is higher than the HER potential, thereby hindering the formation of an anion-derived SEI on the anode surface (Fig. 15).198–202 (3) Owing to the weak coordination of Na+ or K+ with water molecules, a relatively large number of free water molecules (large water clusters) are present, as evident from computational simulations wherein larger sizes of water clusters were observed in Na and K hydrate melts than in Li hydrate melts (Fig. 14).198 The presence of many free water molecules (large water clusters) in aqueous electrolytes hinders the growth and maintenance of the SEI, posing significant challenges in expanding the operating potential window at the anode. This issue persists even if the increase in the H+ activity, which is typically seen with high salt concentrations, is relatively suppressed in highly salt-concentrated aqueous Na and K electrolytes compared to that in Li+-based systems. Consequently, while highly salt-concentrated aqueous Na and K electrolytes provide improved electrochemical stability, the degree of extension of their operating potential window is still lower than that of Li-based electrolytes (Fig. 15).
 | ||
| Fig. 15 (a) Carrier ion-dependent electrochemical and physicochemical properties of hydrate melts.198 Reprinted with permission from ACS Applied Materials & Interfaces. (b) Comparison of aqueous electrolytes based on salt concentration and carrier ion types. The plot was created based on the LSV results obtained using Al and Pt as working electrodes. The areas marked with bold colors and diagonal lines represent the operating potential window of each electrolyte and the kinetic (SEI) contributions within it, respectively.91,170,185 | ||
Despite efforts to enhance the kinetic hindrance of the HER by forming stable SEI layers at the anode, highly salt-concentrated electrolytes still exhibit a significantly narrower potential window compared to nonaqueous systems. Specifically, electrolyte decomposition and hydrogen gas evolution at the anode necessitate the use of anode active materials with relatively high reaction potentials, resulting in a decreased output voltage of aqueous batteries. For instance, while nonaqueous rechargeable batteries typically use carbon materials such as graphite and hard carbon, which have average reaction potentials ranging from 0.1 to 0.3 V (vs. M/M+, where M = Li, Na, and K), aqueous batteries have been limited to testing with 1.5 V-class active materials like Li4Ti5O12, NaTiOPO4, and KTi2(PO4)3, even in highly salt-concentrated aqueous electrolytes like the 56 m Li electrolyte (Li(PTFSI)0.6(TFSI)0.4·1H2O),85 28 m Na electrolyte (Na(PTFSI)0.55(HTFSI)0.45·2H2O (HTFSI is N(SO2C3F7)(SO2CF3)),185 and 62 m K electrolyte (62 m K(FSI)0.55(OTf)0.45·0.9H2O)170 (Tables 1, 3 and 4).
These limitations are particularly pronounced in tests conducted at elevated temperatures, where electrolyte decomposition is accelerated, and there are few reports on full-cell tests in such conditions. These factors indicate the limitation of SEI functionalities in aqueous electrolytes. Additionally, consuming large amounts of carrier ion sources for SEI formation and maintenance hinders the achievement of an ideal P/N ratio (close to 1), thereby limiting the maximization of the battery energy density. This underscores the necessity for developing new strategies, beyond simply increasing salt concentrations, to enhance the stability of aqueous electrolytes.
4.2. Increase in viscosity and decrease in ionic conductivity
While increasing the salt concentration in aqueous electrolytes can enhance interactions among carrier ions, anions, and water molecules, thereby contributing to expanding the operating potential windows both thermodynamically and kinetically, it also leads to the formation of bulky ion-solvent aggregates. These aggregates critically increase the viscosity of the electrolyte, as reflected in Tables 5–7. This increase in viscosity poses significant challenges, not only for the mass production of batteries, but also for the transport of carrier ions within the electrolyte itself.In state-of-the-art nonaqueous Li-ion batteries, the electrode loading level exceeds 20 mg cm−2. Even for electrolytes with viscosities lower than 5 mPa s, the electrode-wetting process is slow, necessitating an additional long-period aging process. This aging process, which includes wetting and formation steps, is one of the longest production processes in battery manufacturing, typically requiring 1 to 2 weeks. Such lengthy processes significantly impede the reduction of battery production costs.206–208 Considering these factors, the use of highly salt-concentrated aqueous electrolytes with viscosities ranging from tens to thousands of mPa s is impractical.
Recent research on highly salt-concentrated aqueous electrolytes has revealed a distinct ion transport mechanism that involves a disproportionation of cation solvation, leading to the formation of water-rich and anion-rich nanodomains, and switching between a vehicle-type and hopping-type ion transport mechanism in the respective regions (Fig. 16).209–213
 | ||
| Fig. 16 (a) and (b) Carrier ion transport via vehicle-type and/or hopping-type mechanism in highly salt-concentrated aqueous electrolytes.213,214 Reprinted with permission from ACS Nano (a) and Journal of the American Chemical Society (b). | ||
As more salt and less water are used to prepare the highly salt-concentrated aqueous electrolytes to increase their operating potential windows, the decrease in the water-rich domain reduces ion movement in the vehicle mode and the hopping speed (Fig. 16).214–222
The reduced mobility of carrier ions in highly salt-concentrated aqueous electrolytes can also be understood through the classical Stokes–Einstein–Sutherland equation.223–225
 | (12) |
 | (13) |
 | ||
| Fig. 17 (a) Ionic conductivity and (b) viscosity of various aqueous electrolytes.226 Reprinted with permission from Energy & Environmental Science. | ||
4.3. Poor wide-temperature-range performance
As shown in Tables 1, 3 and 4, highly salt-concentrated electrolytes exhibit poor performance in wide-temperature-range battery applications. Primarily, they tend to undergo partial crystallization below room temperature because they utilize the maximum salt-to-solvent solubility achievable at room temperature. Lu et al. analyzed the theoretical relationship between the phase-transition temperature (Tp; below this temperature, aqueous electrolytes undergo crystallization and ice/hydrated-salt precipitation, ultimately leading to degradation in the battery performance) of aqueous electrolytes and their salt concentration.227Fig. 18 illustrates the equilibrium and non-equilibrium phase diagrams of a typical salt/H2O binary solution. | ||
| Fig. 18 (a) Equilibrium binary H2O-salt and (b) non-equilibrium binary H2O-salt phase diagrams of aqueous solutions.227 Reprinted with permission from Nano Research Energy. | ||
In the equilibrium binary system, the lowest phase-transition temperature (Tp) of aqueous electrolytes is obtained at the eutectic point (E in Fig. 18a), which can be understood based on the competitive relationship between the enthalpy and entropy, as described in eqn (14).
 | (14) |
salt, Ssolution, Sice, Shydratedsalt are the enthalpies and entropies of the solution, ice, and hydrated salt (S·nH2O and S·bH2O in Fig. 18a), respectively. As the salt concentration increases, the phase-transition temperature (Tp) of the solution initially decreases owing to an increase in the entropy change (ΔS), and then increases owing to a large increase in the enthalpy change (ΔH).
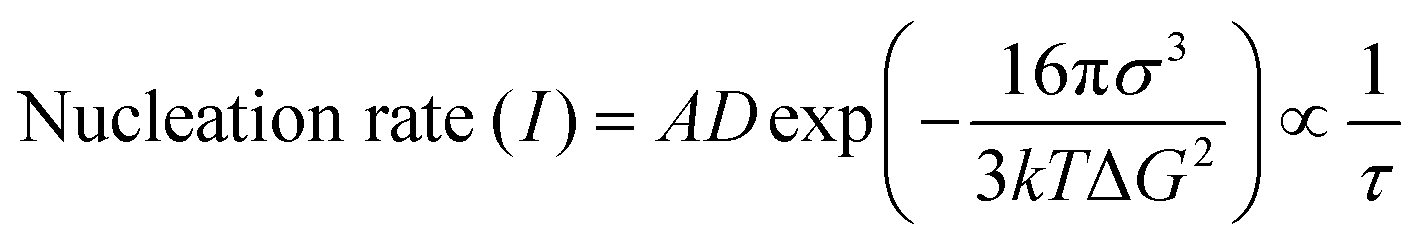
A non-equilibrium system achieves a supercooling zone and a glass-state zone, where crystallization and precipitation of the electrolyte components barely occur even at extremely low temperatures (Fig. 18b). Theoretically, a solution with a longer crystallization time (τ) provides a stronger liquid supercooling ability.228–230 The crystallization time (τ) is proportional to the reciprocal of the nucleation rate (I), as demonstrated in eqn (15).229
 | (15) |
 | ||
| Fig. 19 (a) Thermal stability of LiPTFSI-based aqueous electrolytes evaluated by differential scanning calorimetry at a rate of 5 °C min−1.85 Phase diagrams of (b) NaFSI–H2O89 and (c) KCl–H2O binary systems.231 Reprinted with permission from Electrochemistry Communications (a), ACS Materials Letters (b), and Calphad (c). | ||
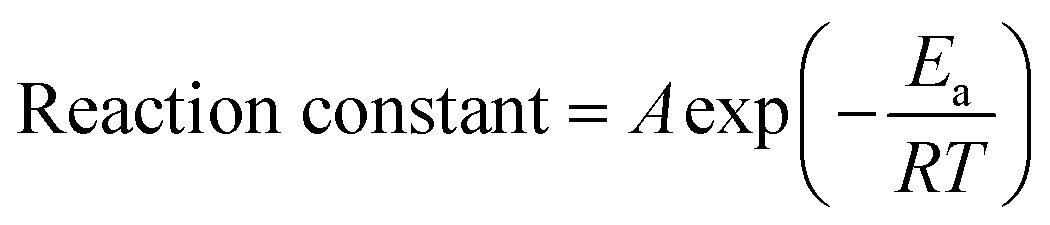
The cycling performance of aqueous batteries at high temperatures is even worse than at low temperatures (Tables 1, 3 and 4). The side reactions, such as the HER and OER, are strongly dependent on the temperature according to the Arrhenius equation:232,233
 | (16) |
4.4. Constraints of material selection
Salts containing PF6− and BF4− anions are known for their high oxidation stability, low cost, and high passivation capabilities for the Al cathode current collector. However, they cannot be used in aqueous electrolytes because these salts tend to hydrolyze, rendering the electrolyte solution acidic and forming harmful compounds like hydrogen fluoride.169,234–239 This limitation necessitates the use of imide salts, which are resistant to hydrolysis but significantly more expensive than PF6− and BF4− anion-based salts. Moreover, the pronounced dissolution of Al at relatively low potentials (≤4 V vs. Li/Li+) in imide-based aqueous electrolytes renders Ti the only viable choice as a cathode current collector.240–243 Ti is preferred because it forms a stable passivating oxide layer of TiO2 on its surface, protecting itself from corrosion and oxidative dissolution.244–246 Notably, the oxidation stabilities of Al measured by LSV are often overestimated, as discussed in Section 4.1. This is also apparent from the rarity of full cells using Al as a cathode current collector in aqueous electrolytes.247 However, Ti is not an ideal choice for a battery current collector. Currently, batteries are commonly assembled in cylindrical, prismatic, and pouch formats. The performance of these batteries largely depends on the type of current collector used.248–252 For instance, the production process of most modern batteries involves several key steps. Initially, a slurry is coated onto the current collector and the prepared electrode is dried. This is followed by a calendering process to press the electrodes and reduce their porosity, thereby enhancing the energy density of the battery. After an additional vacuum drying process to remove any remaining solvents from the electrodes, a winding process is conducted to tightly roll the electrodes and separators into a jelly-roll configuration suitable for each battery type. During these processes, the current collector must remain undamaged and intact. Additionally, thin and flexible current collectors enhance the battery energy density and enable the fabrication of batteries with various sizes and shapes. However, using Ti is challenging because of its high deformation resistance and limited ductility, which endow low flexibility and pose substantial difficulties in refining and processing compared to those for Al and Cu, which are commonly used as cathode and anode current collectors, respectively, in nonaqueous systems.253 This not only limits the available battery form factors (i.e., rendering it difficult to achieve the jelly-roll configuration), but also leads to an increased production cost of thin Ti foils (several hundred times higher than those of Al and Cu foils).254–256 Additionally, the electrical conductivity of Ti foils is approximately one-tenth that of Al and Cu foils, potentially reducing the power density of the battery.257 These limitations affect not only the current collectors but all battery components, resulting in increased overall costs and poor battery performance.Aqueous batteries also encounter an obstacle in terms of separator compatibility, owing to the limited wettability of aqueous electrolytes with traditional separators. Separators made of polypropylene or polyethylene, which are widely used in nonaqueous batteries and are often thinner than 20 µm, cannot be adequately wetted by aqueous electrolytes. This limitation led researchers to use glass fiber-based separators, which typically have a thickness of several hundred micrometers. The increased thickness not only requires more space within the battery but also necessitates a greater volume of electrolyte to ensure that the separator is fully saturated, thereby leading to a decrease in the energy density of the battery. As an alternative, cellulose-based separators, which are thin and environmentally friendly as well as offer better wettability with aqueous electrolytes, can be used. However, they face challenges such as low strength, high flammability, and susceptibility to dissolution or degradation, especially when exposed to electrolytes with extreme pH levels.258,259
Consequently, aqueous electrolytes with high salt concentrations face issues such as limited expansion of the potential window, increased viscosity, decreased ion conductivity, compromised performance at low temperatures, restrictions on battery materials, and higher production costs. These factors collectively raise doubts about their viability for practical use. Without innovative solutions to these significant challenges, the commercialization of advanced aqueous rechargeable batteries remains uncertain.
5. Issues with active materials for aqueous batteries
In the development of cathode and anode active materials for aqueous rechargeable batteries, careful consideration of their reaction potential and chemical stability is essential. Fig. 20 illustrates the thermodynamic potential window of pure water and the electrode reaction potentials. For instance, if the reaction potential of the cathode surpasses the oxidation potential of the electrolyte, oxygen is likely to be produced on the cathode surface, potentially hindering the deintercalation reaction. Similarly, if the reaction potential of the anode is below the reduction potential of the electrolyte, hydrogen is likely to be generated on the anode surface, disrupting the intercalation process. These factors lead to a rapid decline in the battery capacity, often accompanied by significant electrolyte depletion. Therefore, it is imperative to select active materials with optimized reaction potentials that are within the operating potential window of the aqueous electrolyte.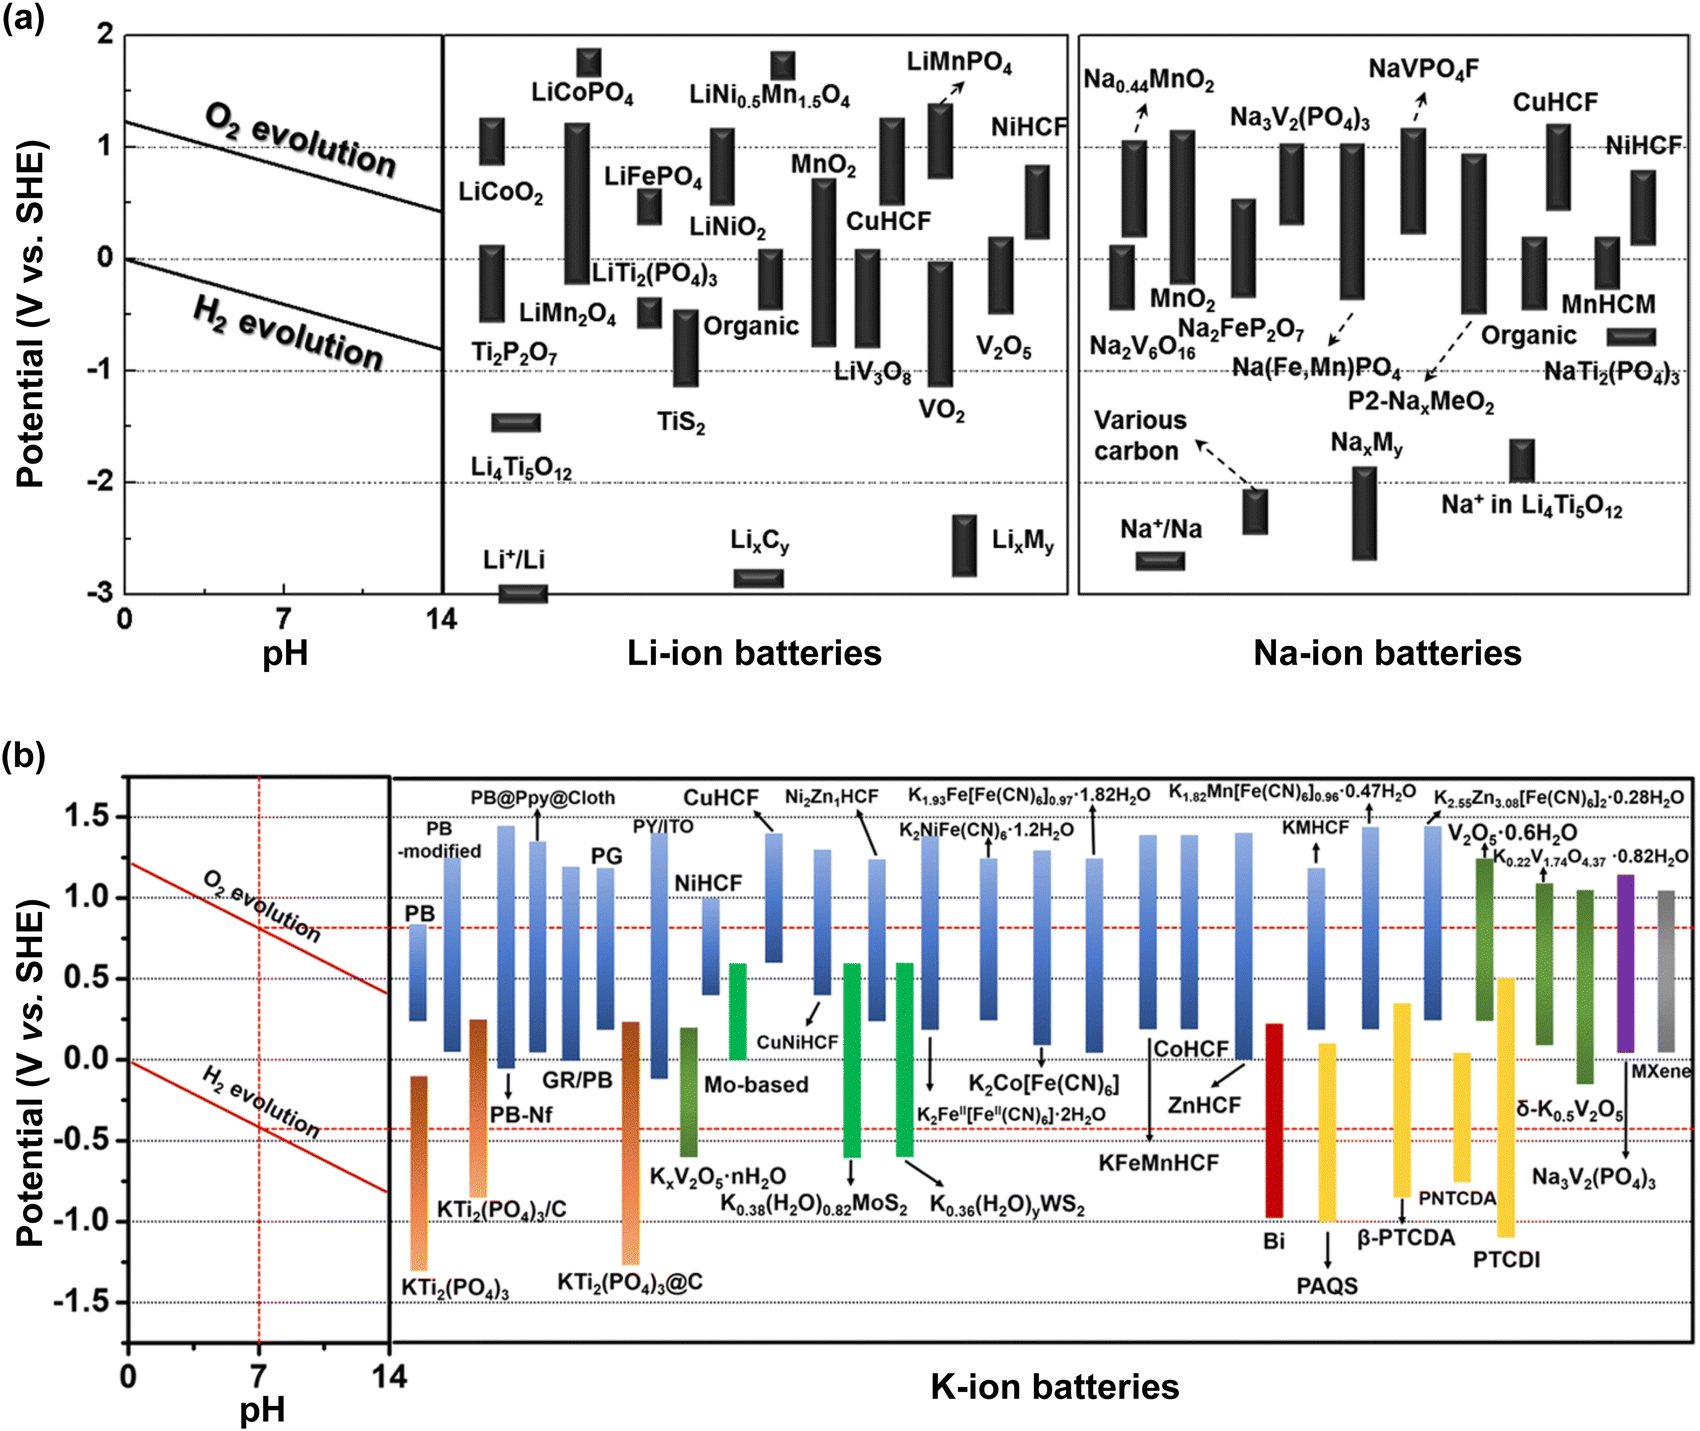 | ||
| Fig. 20 Thermodynamic potential window of water and redox potentials of cathode and anode active materials for (a) Li-, Na-, and (b) K-ion batteries.260,261 Reprinted with permission from Chemical Reviews (a) and Energy & Environmental Science (b). | ||
Moreover, the active materials must exhibit high chemical stability across a wide pH range. This would enable pH adjustments in the electrolyte for enhancing the battery performance by fine-tuning the overall potential diagram. Additionally, the catalytic effect of electrode materials, particularly transition metals, on water electrolysis should be considered. The overpotential of water electrolysis typically depends on the relative activity of water-splitting catalysts. To maximize the overpotential for the OER and HER, materials with relatively low catalytic activity should be used.
Another critical consideration is the co-intercalation of proton and/or water into the active materials. In addition to the insertion of carrier ions (such as Li+, Na+, or K+), which are responsible for energy storage and release, co-intercalation of proton and/or water is observed, especially in materials with layered structures.262 The presence of substituted proton and/or water within the bulk structure of active materials, even those with high chemical stability across a wide pH range, can obstruct the insertion pathways of carrier ions, leading to reduced cycling stability and battery energy density.263 While proton insertion can be mitigated by increasing the electrolyte pH, this approach is only viable when active materials and battery components provide high chemical stability at high pH levels. Therefore, the development of active materials with minimal proton insertion is paramount to the advancement of aqueous rechargeable battery technology.
Additional attention should be paid to the dissolution of transition metals from the active materials. During the charge and discharge processes, transition metal ions in the active material serve as centers for oxidation and reduction reactions, counterbalancing the charge changes associated with the insertion and extraction of carrier ions. The transition metal ions must remain stably anchored within the structure of the active material throughout the repeated cycles of insertion and extraction of carrier ions. However, the high permittivity and ion conductivity of aqueous electrolytes accelerate the rapid diffusion of transition metal ions into the bulk electrolyte and the reduction of dissolved transition metal ions on the anode surface, leading to critical issues such as bulk structural damage of the active material, increased resistance on the electrode surfaces, and overall degradation of the battery performance.
5.1. Active materials for aqueous Li-ion batteries
One of the most extensively studied cathode materials in aqueous Li-ion batteries is lithium manganese oxide, LiMn2O4. Since the prototype battery demonstrating the stable reversibility of LiMn2O4 in a 5 M LiNO3 + 0.001 M LiOH solution was reported in 1994,17 LiMn2O4 has been widely utilized in aqueous Li-ion batteries. LiMn2O4 features a spinel structure, with oxygen ions forming a face-centered cubic lattice.264,265 Within this lattice, lithium occupies one-eighth of the tetrahedral sites between oxygen ions, while manganese occupies half of the octahedral sites (Fig. 21).264,265 LiMn2O4 exhibits a theoretical capacity of 148 mA h g−1 with a redox potential of 3.9 V vs. Li/Li+ based on the Mn3+/Mn4+ redox reaction, which is within the operating potential window of most aqueous electrolytes.264,265 Moreover, its catalytic effect on water electrolysis is relatively low, and it exhibits low activation energies (23–25 kJ mol−1) for interfacial Li+ transfer reactions in aqueous solutions (Fig. 21).266 The dissolution of the transition metal from LiMn2O4 into the electrolyte can be sufficiently suppressed even in a mildly concentrated 5 M LiNO3 solution (Fig. 21).267 Owing to these advantages, LiMn2O4 remains a mainstream cathode material for aqueous Li-ion batteries to date. | ||
| Fig. 21 Crystal structure and Li+ diffusion pathway in spinel LiMn2O4.268 (b) Activation energies for interfacial Li+ ion transfer reactions,266 (c) charge/discharge curves, and (d) cycling stability of LiMn2O4 in the given electrolytes.267 Reprinted with permission from Progress in Natural Science: Materials International (a) and Journal of Power Sources (b)–(d). | ||
Lithium nickel manganese oxide, LiNi0.5Mn1.5O4, with the same spinel structure, offers a theoretical capacity of 147 mA h g−1, which is comparable to that of LiMn2O4. Additionally, its high redox potential of 4.7 V vs. Li/Li+ based on the Ni2+/Ni4+ redox reaction contributes to an increased battery output voltage.269 However, achieving stable cycling with it is challenging because its reaction potential does not lie within the operating potential window, even in highly salt-concentrated aqueous Li electrolytes (Table 1).
In 2009, Ruffo et al. introduced lithium cobalt oxide (LiCoO2) in aqueous systems, a material long used in nonaqueous Li-ion batteries.270 LiCoO2 possesses an α-NaFeO2-type structure, characterized by layered cationic ordering within a NaCl-type prototype (Fig. 22).271,272 It offers a theoretical capacity of 137 mA h g−1 based on the Co3+/Co3.5+ redox couple [i.e., LixCoO2 (0.5 ≤ x ≤ 1)], with a reaction potential of 3.7 V vs. Li/Li+.271,272 In 2016, Yushin and co-workers reported that LiCoO2 could achieve high reversibility in a saturated Li2SO4/H2O solution, with over 90% capacity retention after 1500 cycles at 1C (Fig. 22),273 highlighting its potential as a cathode material in aqueous Li-ion batteries.
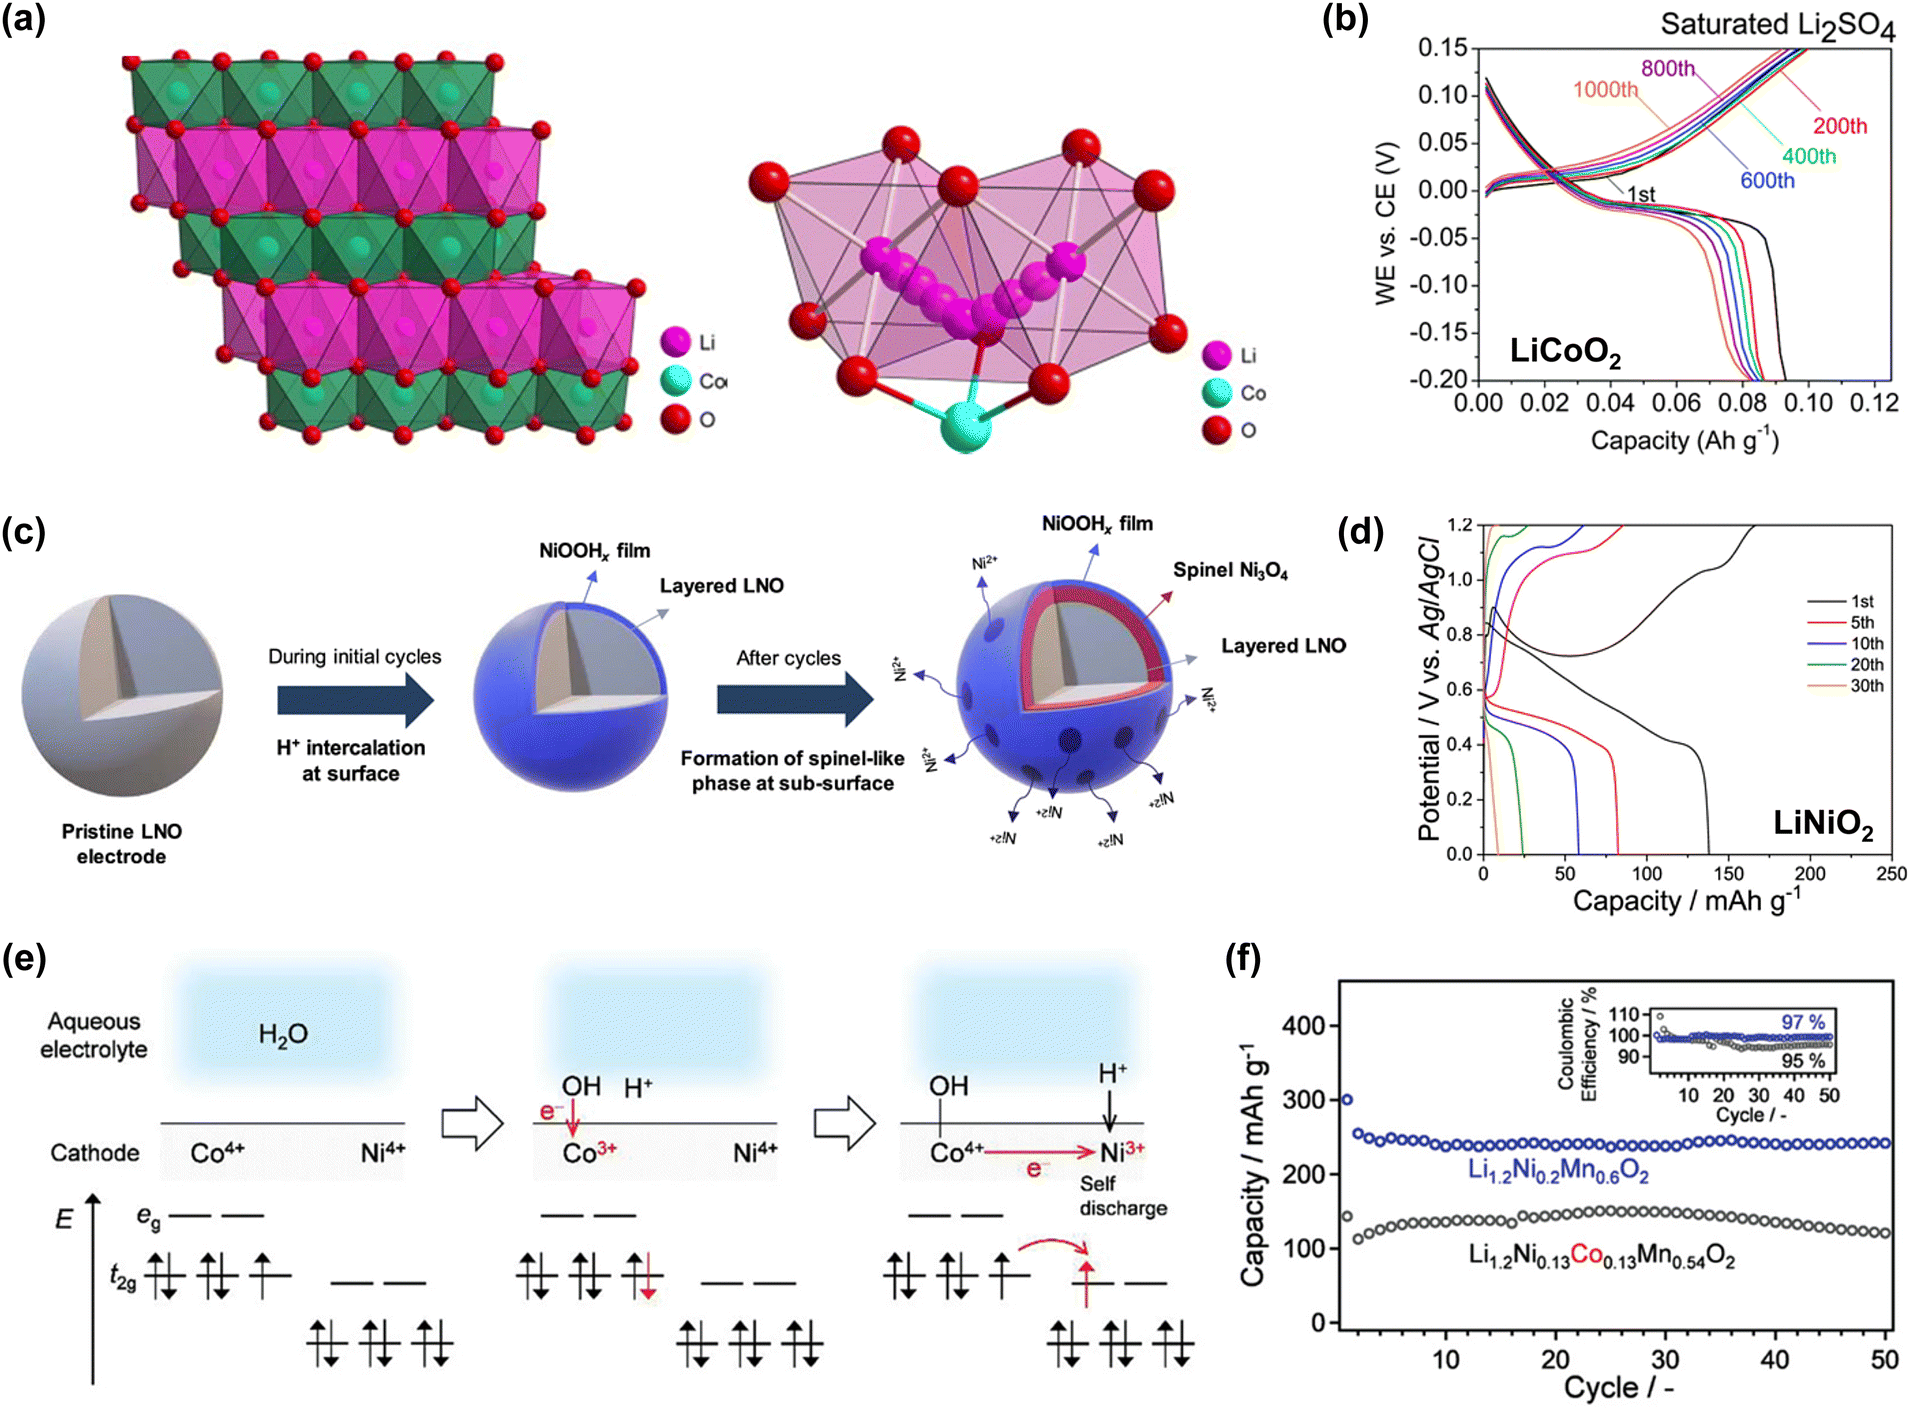 | ||
| Fig. 22 (a) Crystal structure and Li+ diffusion pathway in layered LiCoO2.268 (b) Long-term cycling of LiCoO2 in a sat. Li2SO4 solution.273 (c) Degradation mechanism of LiNiO2 in the aqueous electrolyte.274 (d) Charge/discharge curves of LiNiO2 in 1.0 M LiNO3/H2O.274 (e) Schematic of the self-discharge process in the Co-doped layered oxide, Li1.2Ni0.13Co0.13Mn0.54O2.275 (f) Cycling stability of Li1.2Ni0.2Mn0.6O2 and Li1.2Ni0.13Co0.13Mn0.54O2 in the dihydrate melt, Li(TFSI)0.7(BETI)0.3·2H2O.275 Reprinted with permission from Progress in Natural Science: Materials International (a), Energy & Environmental Science (b), ACS Applied Materials & Interfaces (c), and Advanced Science (d). | ||
In contrast, experiments on the aqueous full cell utilizing lithium nickel oxide, LiNiO2, whose structure is similar to that of LiCoO2, have not been as successful. Lee et al. demonstrated that LiNiO2 undergoes consecutive H+ intercalation and transition metal dissolution in aqueous electrolytes, forming a thick NiOOHx film on the LiNiO2 surface. This film impedes the insertion and extraction of Li+ (Fig. 22).274,276–280
On the other hand, recent reports have highlighted high-capacity aqueous batteries utilizing the oxygen redox of Li-rich layered oxides.275 A full cell comprising Li1.2Ni0.2Mn0.6O2|Li4Ti5O12 exhibited reversible cycling for over 100 cycles in a 28 m Li(TFSI)0.7(BETI)0.3·2H2O dihydrate melt, with an initial capacity close to 250–300 mA h g−1 based on the cathode mass, surpassing the performance in nonaqueous electrolytes (Fig. 22). The study also emphasized the significance of transition metal types in active materials. For example, doping a small amount of Co into Li1.2Ni0.2Mn0.6O2 (forming Li1.2Ni0.13Co0.13Mn0.54O2) led to a notable decrease in the capacity, to less than half that of Li1.2Ni0.2Mn0.6O2. It was suggested that the coexistence of Co4+ and Ni4+ in the Li-rich layered oxide triggered a rapid self-discharge process (Co4+ + Ni4+ + H2O → Co3+–OH + Ni4+ + H+ → Co4+–OH + Ni3+ + H+), thereby resulting in significant degradation of the reversible capacity. Notably, the stable cycling of LiCoO2 in an aqueous electrolyte can be achieved despite the high catalytic effect of Con+ toward water electrolysis. This suggests that the catalytic effect of transition metals can vary significantly depending on the bulk and surface structures of the active material, the oxidation state of oxygen, the type of electrolyte, and other relevant factors.
Lithium iron phosphate, LiFePO4, has emerged as a useful cathode active material in aqueous electrolytes. LiFePO4 comprises PO4 tetrahedra and FeO6 octahedra, with lithium atoms aligned in a one-dimensional [010] direction within the octahedral interstitial spaces. Since 1997, when Goodenough et al. first reported the Fe2+/Fe3+ redox reaction generating 3.4 V vs. Li/Li+,281,282 LiFePO4 has remained one of the prominent cathode materials for nonaqueous Li-ion batteries because of its high theoretical capacity (170 mA h g−1), substantial cycling stability without bulk structure degradation, and excellent thermal stability (limited oxygen generation even at temperatures above 700 °C).283,284 In 2010, Xia et al. introduced carbon-coated LiFePO4 and an O2-free alkali 1 M Li2SO4 electrolyte to suppress side reactions such as proton insertion and Fe2O3 formation. This enabled the stable charge and discharge of an aqueous LiFePO4|LiTi2(PO4)3 full cell for over 1000 cycles (800 h) (Fig. 23).65,285,286
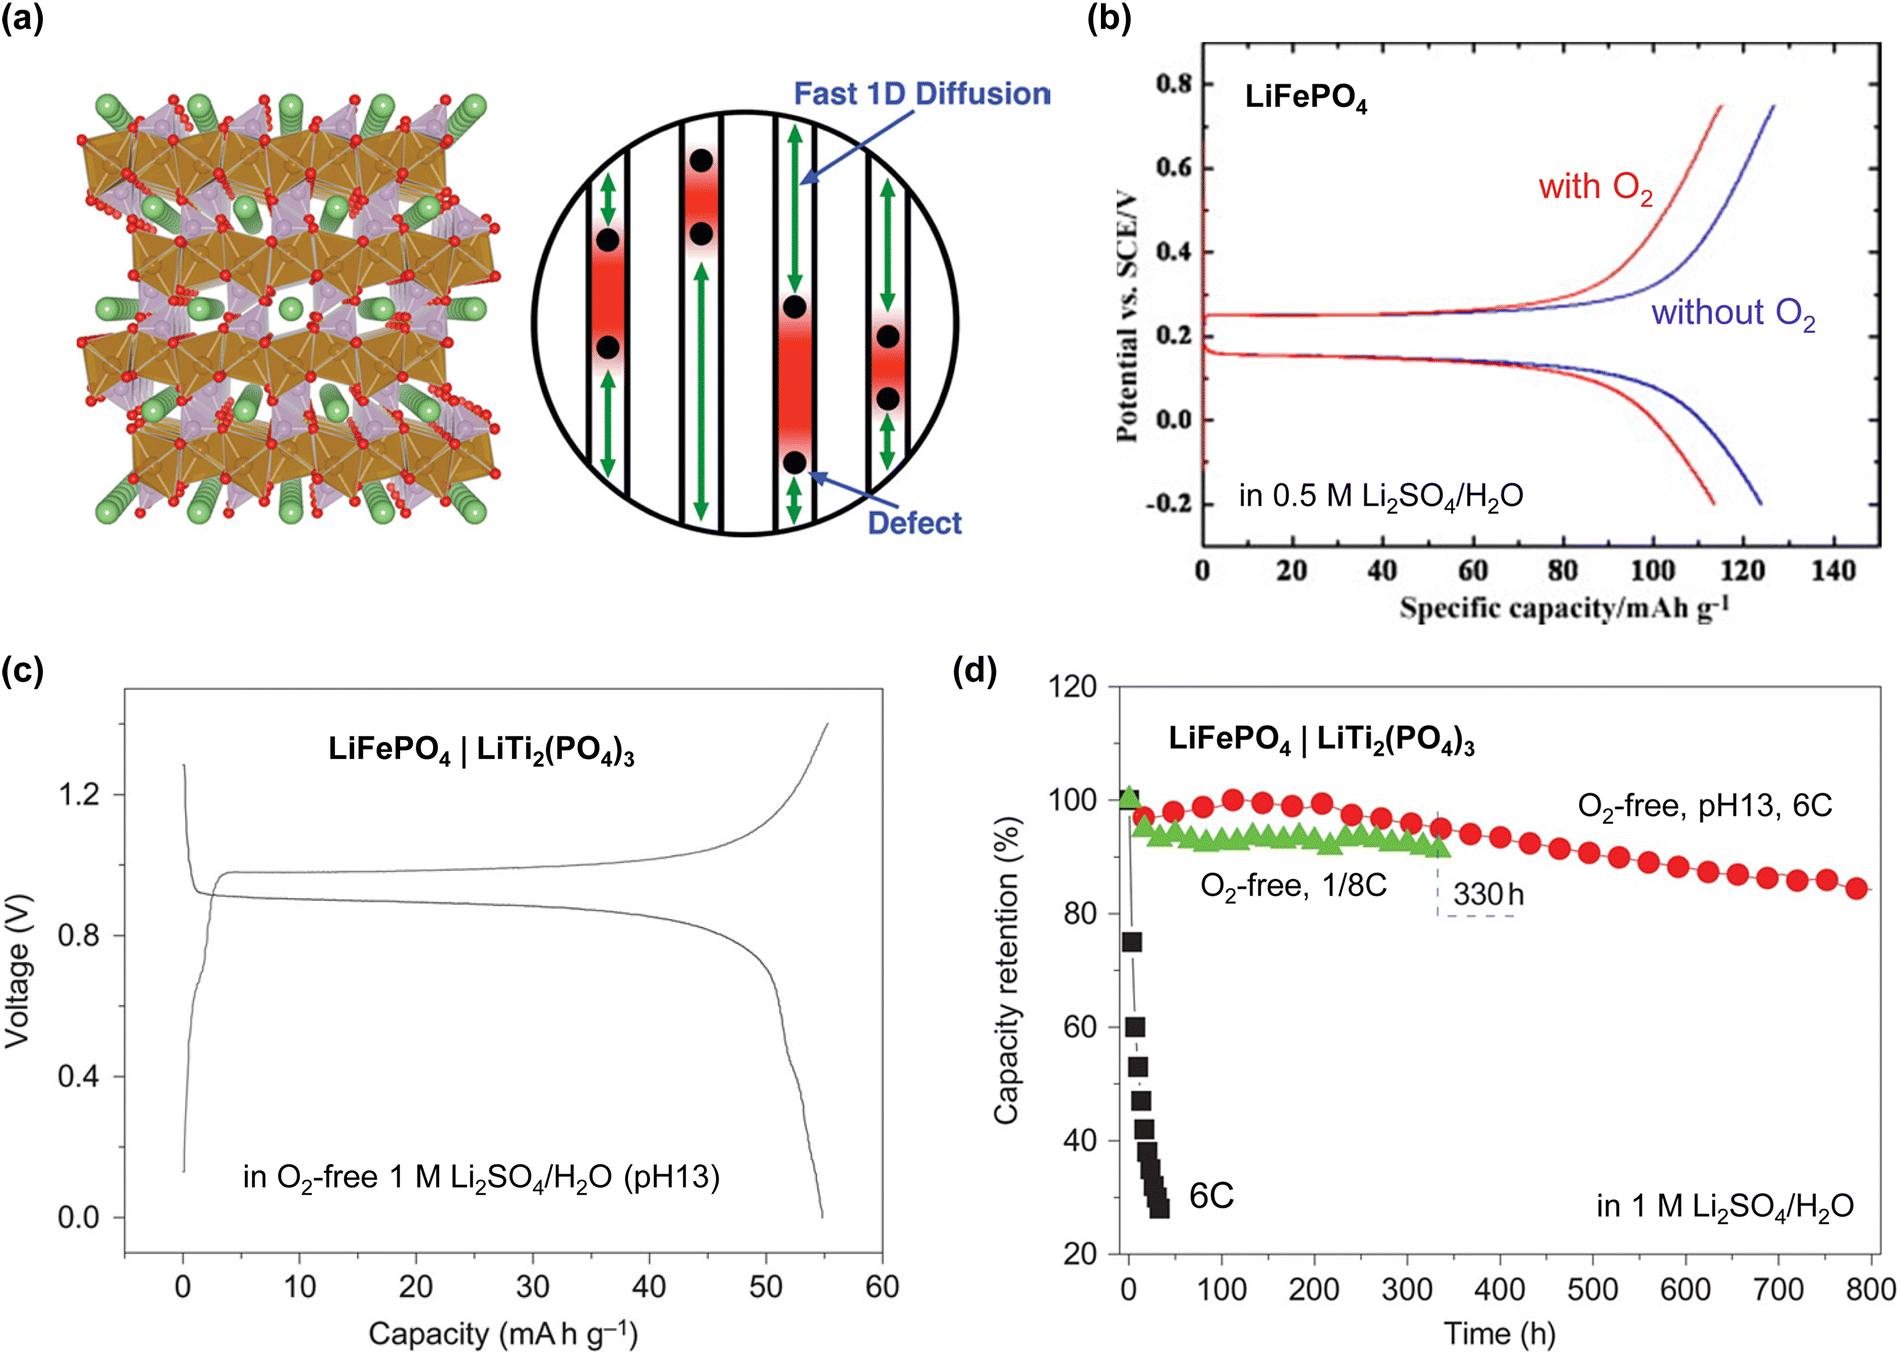 | ||
| Fig. 23 (a) Crystal structure and Li+ diffusion pathway in olivine LiFePO4.287 (b) Increased reversible capacity of LiFePO4 in an O2-free aqueous electrolyte.286 (c) Charge/discharge curves and (d) long-term cycling of aqueous LiFePO4|LiTi2(PO4)3 full cells under the given conditions.65 Reprinted with permission from Nano Letters (a), Electrochimica Acta (b) and Nature Chemistry (c) and (d). | ||
Additionally, lithium manganese phosphate, LiMnPO4, was evaluated in aqueous systems and was expected to exhibit a low catalytic effect owing to manganese, as well as offer high cycling stability because of a robust polyanion structure similar to that of LiFePO4. However, the use of this material resulted in high battery resistance, low capacity, and poor cyclability, which could be attributed to the Jahn–Teller distortion. This distortion caused stronger local deformations and higher Li+ migration barriers than LiFePO4, highlighting the complex interplay between the material structure and battery performance.288,289
A crucial factor in selecting anode active materials for aqueous Li-ion batteries is their compatibility with the operating potential window of the electrolyte, as HER typically has lower overpotential than OER (Fig. 10). Early research explored layered vanadium oxide, VO2(B), which features a monoclinic structure with tunnels that facilitate fast Li+ insertion and deintercalation. VO2(B) offers a high theoretical capacity exceeding 320 mA h g−1 and a reaction potential (2.5 V vs. Li/Li+) close to the HER potential at neutral pH (Fig. 24).290–292 Zhang and Dahn demonstrated that the reversibility of VO2(B) was strongly dependent on the electrolyte pH.293 Using 4 M LiNO3 solutions across a wide pH range, they revealed that electrolyte reduction at the anode surface occurred under nearly neutral conditions (pH 6), while strong alkaline environments (pH > 11) promoted V dissolution, resulting in rapid capacity fading. Although mildly alkaline solutions (pH 8–10) improved the capacity retention, significant electrode dissolution occurred, with over 20% of the VO2(B) material dissolving in the electrolyte after just 10 cycles in a pH 8 solution. This led to a substantially low practical capacity of 80–160 mA h g−1 and a low Coulombic efficiency (Fig. 24). The vulnerability to air oxidation and the complex synthesis of VO2(B) further hindered its practical application in aqueous batteries.
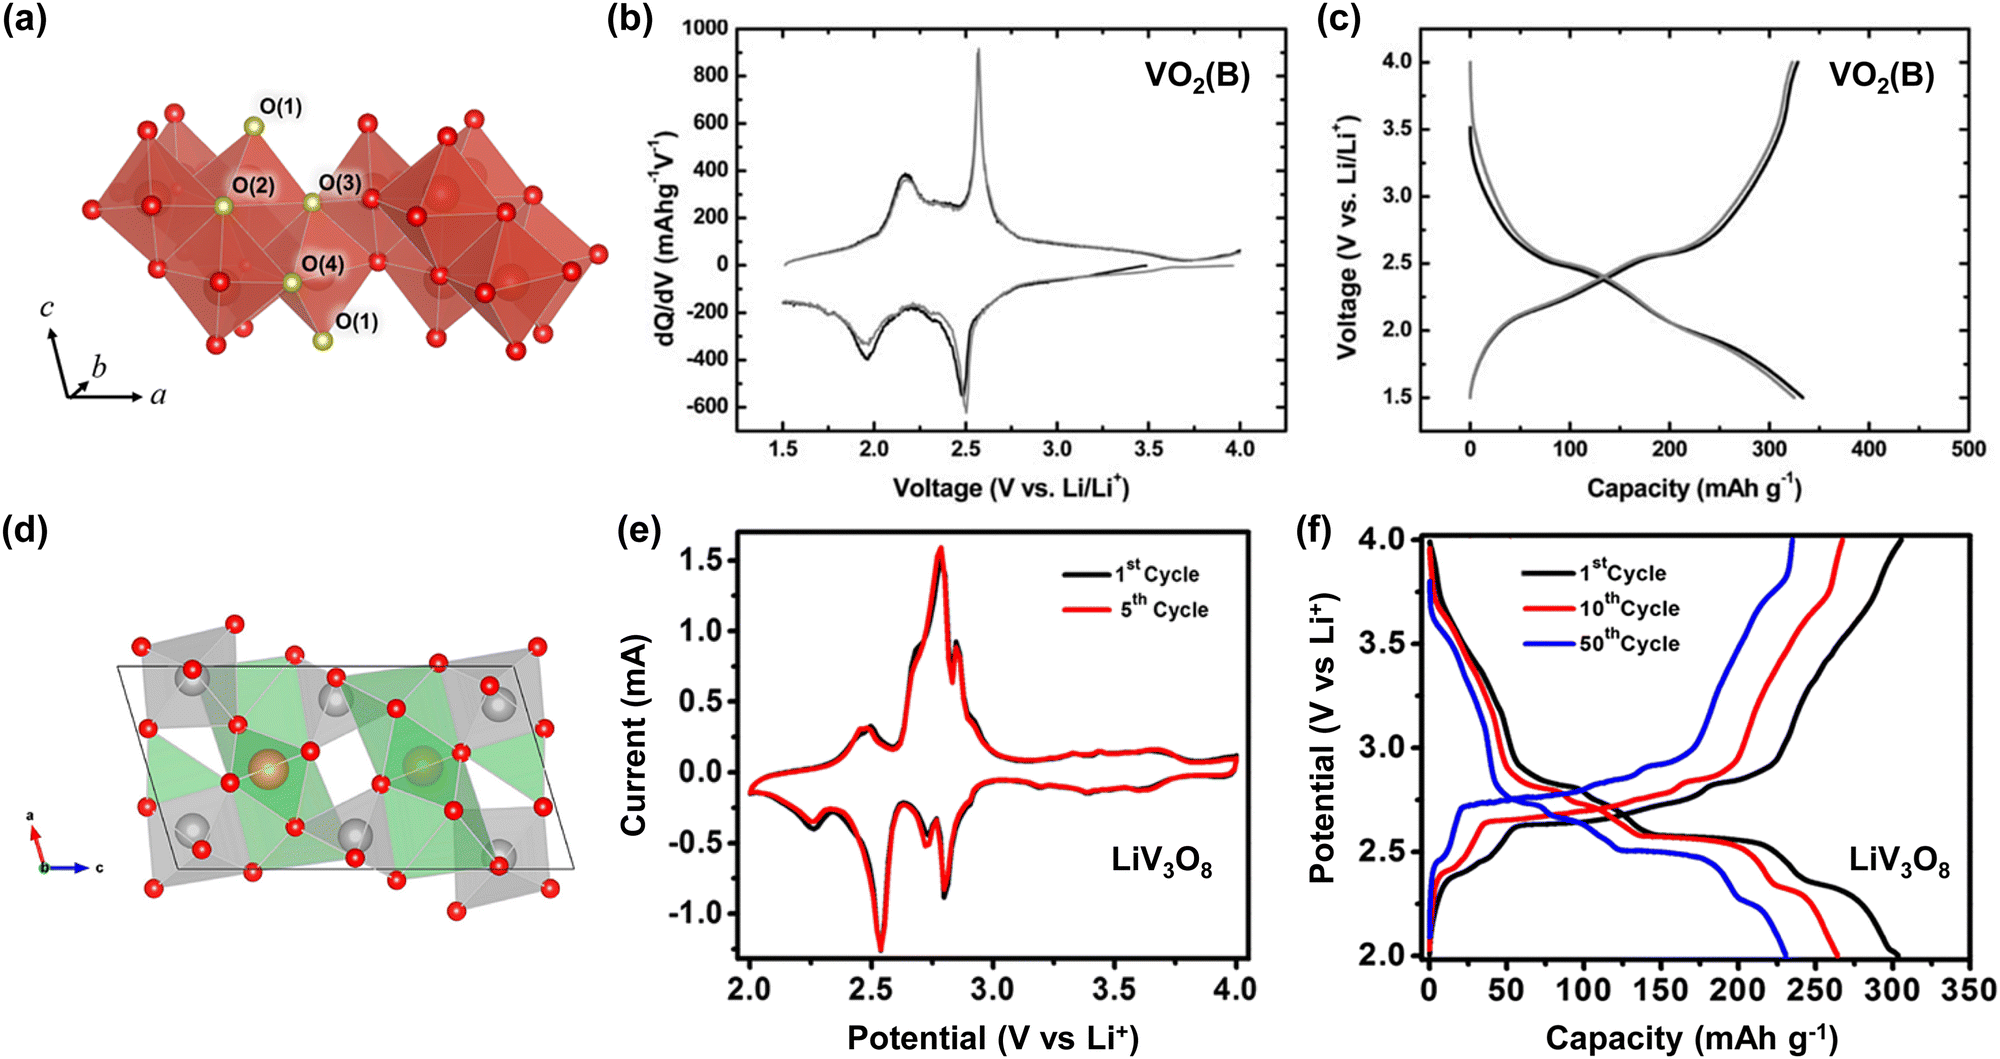 | ||
| Fig. 24 Crystal structures and electrochemical properties of (a)–(c) VO2(B),292,294 and (d)–(f) LiV3O8.294,295 The lithiation/delithiation curves of VO2(B) and LiV3O8 were obtained in 1 M LiClO4/ethylene carbonate:diethyl carbonate (1:1, v:v) and 1.0 M LiPF6/ethylene carbonate:dimethyl carbonate (1:1, v:v), respectively. Reprinted with permission from ACS Applied Energy Materials (a), Journal of Materials Chemistry (b) and (c), ACS Energy Letters (d), and Journal of Materials Science (e) and (f). | ||
To address the limitations of VO2(B), Kohler et al. explored layered lithium vanadium oxide, LiV3O8, as a potential alternative.54 LiV3O8 offers a higher reaction potential (2.8 V vs. Li/Li+) than VO2(B), ensuring improved capacity retention in aqueous electrolytes, while reducing electrolyte decomposition at the anode surface. To evaluate the feasibility of LiV3O8 in practical battery configurations, researchers assembled aqueous Li-ion full cells with various cathode active materials, including common materials like LiNi0.81Co0.19O2, LiNi1/3Mn1/3Co1/3O2, LiCoO2, LiMn2O4, and LiFePO4. For example, an aqueous full cell utilizing LiNi0.81Co0.19O2 cathodes and LiV3O8 anodes exhibited a capacity retention of 20% after 100 cycles at a constant current rate of 1 mA cm−2, with a specific capacity of 20 mA h g−1 based on the total mass of the cathode and anode materials (Fig. 24).54 In 2013, Zhao et al. reported significant advancements in the development of a highly reversible aqueous LiFePO4|LiV3O8 full cell, achieving a remarkable capacity retention of over 99% after 100 cycles at a current density of 1C in an oxygen-free 9 m LiNO3/H2O electrolyte (Fig. 24).296 However, the average discharge voltage of LiV3O8-based full cells is inherently low (0.2–1.0 V) because of the high reaction potential of LiV3O8, which limits the increase in the battery energy density.
The range of viable anode active materials has broadened significantly with the advent of highly salt-concentrated aqueous electrolytes. In 2015, the research group led by Wang and Xu demonstrated the feasibility of using Chevrel phase consisting of molybdenum sulfide clusters, Mo6S8, as an anode active material in these electrolytes, despite the previously assumed non-reversibility of this compound in typical aqueous electrolytes due to lower reaction potentials.18 Mo6S8 exhibits a practical capacity of over 100 mA h g−1 in LixMo6S8 (0 < x < 3.6) between 2.5 and 2.1 V vs. Li/Li+ (Fig. 25).297,298 However, the high catalytic effect of Mon+ poses challenges in maintaining high cycling stability, even in highly salt-concentrated aqueous electrolytes.
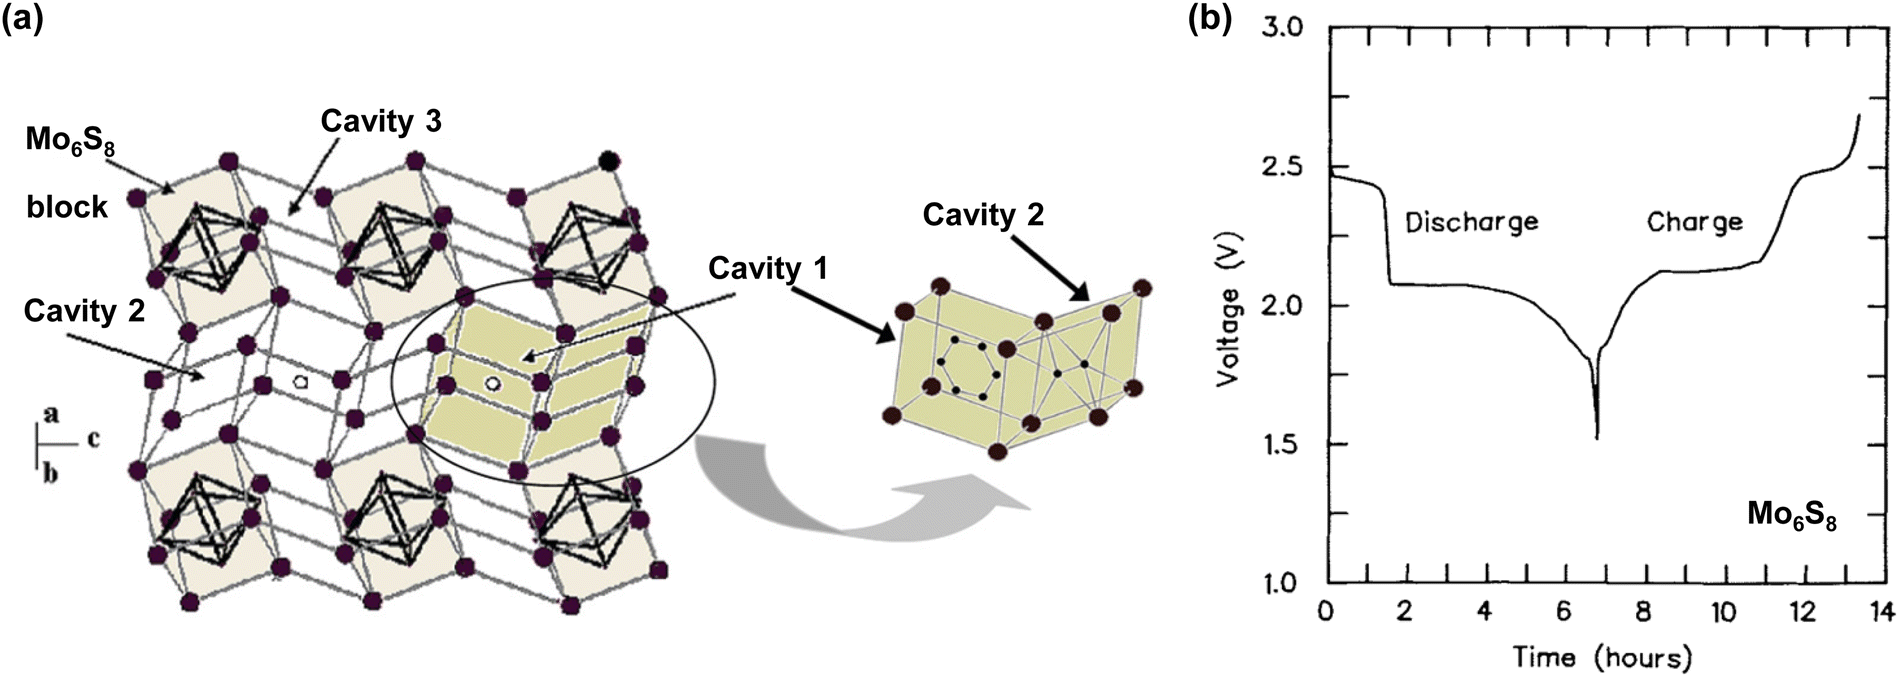 | ||
| Fig. 25 (a) and (b) Crystal structure and electrochemical properties of Mo6S8.297–299 Reprinted with permission from Inorganic Chemistry (a) and Canadian Journal of Physics (b). | ||
Anode active materials based on Ti are favored for aqueous batteries owing to their weak catalytic effect toward the HER. For instance, in the study by Wang et al. in 2006, lithium titanium phosphate, LiTi2(PO4)3, featuring a Na super-ionic conductor (NASICON)-type structure, exhibited reversible Li+ intercalation and deintercalation in aqueous electrolytes, despite a slightly lower reaction potential of 2.5 V vs. Li/Li+ compared to the theoretical HER potential (Fig. 26).300 In 2007, Luo and Xia successfully operated a 1.5 V aqueous LiMn2O4|LiTi2(PO4)3 full cell, achieving a capacity retention of 80% after 200 cycles at 10 mA cm−2 in 1 M Li2SO2/H2O (Fig. 26).60
 | ||
| Fig. 26 Crystal structures and electrochemical properties of (a) and (b) LiTi2(PO4)360,301 and (c) and (d) Li4Ti5O12.302,303 Lithiation/delithiation curves of LiTi2(PO4)3 and Li4Ti5O12 were obtained in 1 M LiPF6/ethylene carbonate:dimethyl carbonate:ethyl methyl carbonate (1:1:1, v:v:v) and 1 M LiClO4/ethylene carbonate:1,2-dimethoxyethane (1:1, v:v), respectively. Reprinted with permission from Energy Storage Materials (a), Advanced Functional Materials (b), Advanced Composites and Hybrid Materials (c), and Journal of The Electrochemical Society (d). | ||
In 2016, Yamada et al. introduced spinel lithium titanium oxide, Li4Ti5O12, into the aqueous system,19 a material previously tested as an anode in nonaqueous Li-ion batteries by Ohzuku and Thackeray in 1994.304,305 Li4Ti5O12 has a face-centered cubic structure in which the 32e site of space group Fd![[3 with combining macron]](https://www.rsc.org/images/entities/char_0033_0304.gif) m is occupied by oxygen anions, the tetrahedral 8a sites are occupied by Li+, and the octahedral 16d sites are occupied by Ti4+. The remaining Li+ are randomly distributed into the 16d sites at a Li/Ti weight ratio of 1/5 (Fig. 26).302,306–308 Li4Ti5O12 exhibits a flat charge and discharge potential around 1.5–1.6 V vs. Li/Li+ and possesses a theoretical capacity of 175 mA h g−1. Ohzuku et al. reported that the overall variation in the lattice parameter of Li4Ti5O12 was less than 0.1% before and after Li+ intercalation (Fig. 26),303,308,309 exemplifying its “zero strain” characteristic, which is advantageous for maintaining SEI stability during battery cycling in aqueous electrolytes.310 Although the reaction potential of Li4Ti5O12 is lower than the HER potential in typical aqueous electrolytes, reversible Li+ intercalation and deintercalation over hundreds of cycles are achievable in the highly-salt concentrated aqueous electrolytes due to its weak catalytic effect and upshifted reaction potentials (Fig. 7) (details of electrode potential shift will be further discussed in Section 6.1). However, the cycling stability of Li4Ti5O12 rapidly decreases under harsh operating conditions such as low C-rates and elevated temperatures, which accelerate electrolyte decomposition on the anode surface. Moreover, its low ionic conductivity necessitates nano-size engineering and carbon coating, which ultimately increase the reaction area, thus making it challenging to inhibit the reduction decomposition of aqueous electrolytes.
m is occupied by oxygen anions, the tetrahedral 8a sites are occupied by Li+, and the octahedral 16d sites are occupied by Ti4+. The remaining Li+ are randomly distributed into the 16d sites at a Li/Ti weight ratio of 1/5 (Fig. 26).302,306–308 Li4Ti5O12 exhibits a flat charge and discharge potential around 1.5–1.6 V vs. Li/Li+ and possesses a theoretical capacity of 175 mA h g−1. Ohzuku et al. reported that the overall variation in the lattice parameter of Li4Ti5O12 was less than 0.1% before and after Li+ intercalation (Fig. 26),303,308,309 exemplifying its “zero strain” characteristic, which is advantageous for maintaining SEI stability during battery cycling in aqueous electrolytes.310 Although the reaction potential of Li4Ti5O12 is lower than the HER potential in typical aqueous electrolytes, reversible Li+ intercalation and deintercalation over hundreds of cycles are achievable in the highly-salt concentrated aqueous electrolytes due to its weak catalytic effect and upshifted reaction potentials (Fig. 7) (details of electrode potential shift will be further discussed in Section 6.1). However, the cycling stability of Li4Ti5O12 rapidly decreases under harsh operating conditions such as low C-rates and elevated temperatures, which accelerate electrolyte decomposition on the anode surface. Moreover, its low ionic conductivity necessitates nano-size engineering and carbon coating, which ultimately increase the reaction area, thus making it challenging to inhibit the reduction decomposition of aqueous electrolytes.
5.2. Active materials for aqueous Na-ion batteries
Mn-based oxides and V-based phosphates have emerged as promising candidates for cathode active materials in aqueous Na-ion batteries, primarily because of their favorable reaction potential (Table 3). The electrochemical behavior of sodium manganese oxide, Na0.44MnO2, was first explored by Sauvage et al. in 2007.311 This material features an orthorhombic crystal structure with Na+ tunnels that facilitate rapid Na+ diffusion within the material (Fig. 27). However, its limited capacity, which ranges from 35 to 55 mA h g−1 in aqueous electrolytes, has restricted its practical application.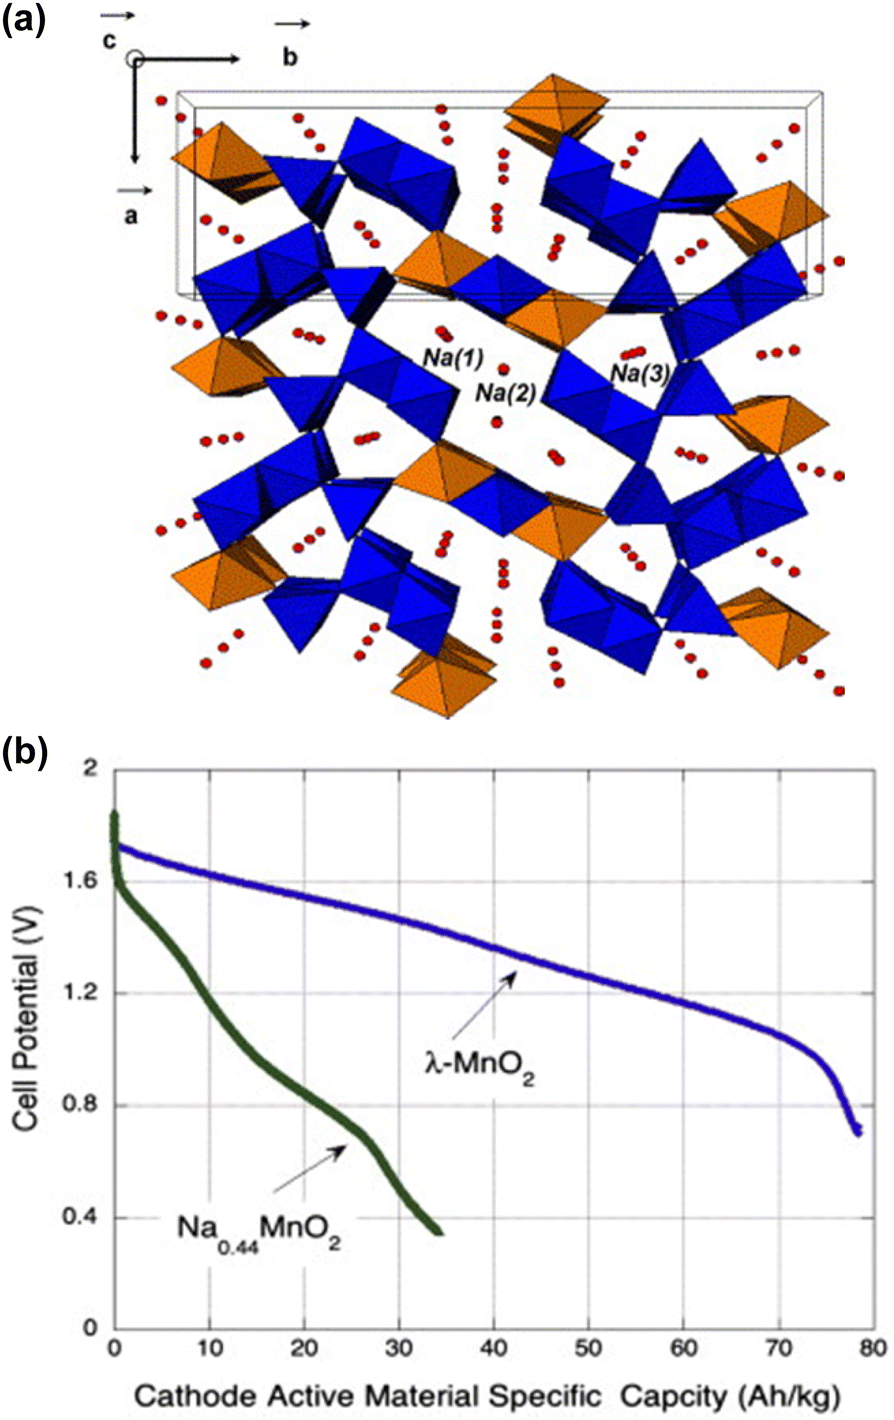 | ||
| Fig. 27 Crystal structure of Na0.44MnO2.311 (b) Galvanostatic discharge curves of Na0.44MnO2 and λ-MnO2 in 1 M Na2SO4/H2O.312 Reprinted with permission from Sensors and Actuators B (a) and Journal of Power Sources (b). | ||
To address this limitation, researchers incorporated delithiated spinel manganese oxide, λ-MnO2, which offers a capacity of 80 mA h g−1 in 1 M Na2SO4/H2O.312 This capacity enhancement is attributed to an irreversible structural change upon initial Na+ insertion, and is thought to result in the formation of a layered structure, followed by subsequent reversible cycling involving 0.6 Na atoms per formula unit (Fig. 27). Nevertheless, the absence of Na sources within λ-MnO2 necessitates a pre-sodiation process before its practical utilization. Moreover, the high catalytic activity of λ-MnO2 in water splitting leads to oxygen generation at its surface. This reaction consumes the electrolyte and Na sources and significantly degrades the battery performance.
Since 2014, when Song et al. initiated the study on the reversible reaction of sodium vanadium phosphate, Na3V2(PO4)3, various V-based phosphates in aqueous Na electrolytes have been extensively explored (Fig. 28).313 Carbon-coated Na3V2(PO4)3 exhibits a capacity exceeding 110 mA h g−1, with a redox potential of 3.4 V vs. Na/Na+ based on the V3+/V4+ redox couple. Jin et al. achieved the stable cycling of Na3V2(PO4)3 (V3+/V4+ redox)|Na3V2(PO4)3 (V3+/V2+ redox) symmetric batteries, which retained 88% of the initial capacity after 100 cycles at 1C, with a reversible capacity of 40 mA h g−1 (based on the cathode and anode masses) and an output voltage of 1.7 V in a highly salt-concentrated aqueous Na electrolyte (17 m NaClO4 + 2 m NaOTf/H2O).156 However, its overcharge stability, linked to the partial utilization of the V4+/V5+ redox couple, was inferior, leading to the substantial dissolution of V5+ into the electrolyte. This impeded the utilization of thick cathode electrodes, fast charge protocols, and wide-temperature-window operation in the aqueous system.314,315
 | ||
| Fig. 28 Crystal structures and electrochemical properties of (a) and (b) Na3V2(PO4)3313,316 and (c) and (d) Na3(VOPO4)2F.317 Reprinted with permission from Electrochemistry (a), ChemElectroChem (b), and Joule (c) and (d). | ||
The research group led by Croguennec investigated the water stability and overcharge resistance of Na3(VPO4)2F3–Na3(VOPO4)2F solid solutions, which achieved a high redox potential of 3.8 V vs. Na/Na+ and a high theoretical capacity of ∼130 mA h g−1 with two Na+ per formula unit during reversible charge and discharge processes.314 Their investigations revealed that a series of solid solution compounds, denoted as Na3V2−x3+Vx4+(PO4)2F3−xOx (where 0 ≤ x ≤ 2), demonstrated complete water stability. Even a water wash could effectively remove the soluble and undesirable impurities formed during synthesis, without compromising their electrochemical performance in batteries. This indicated the potential use of this solid solution as a cathode active material in aqueous Na-ion batteries. Moreover, it was found that oxygen-rich compositions, such as Na3(VOPO4)2F, remained stable during overcharging, with neither the local environment of V nor its oxidation state being altered. Indeed, a test on the Na3(VOPO4)2F|NaTi2(PO4)3 full cell conducted by Rebel et al. demonstrated long-term cycling over 500 cycles at both, a low temperature (−10 °C) and room temperature (30 °C), in a 25 m NaFSI + 10 m NaFTFSI (NaN(SO2F)(SO2CF3))/H2O electrolyte.89
Sodium titanium phosphate, NaTi2(PO4)3, has been extensively studied as an anode active material for aqueous Na-ion batteries, showing significant promise owing to its efficient electrochemical performance and good chemical stability (Table 3 and Fig. 29).318 This material features a three-dimensional framework that allows the reversible intercalation of two Na+ at potentials close to 2.1 and 2.2 V vs. Na/Na+ (corresponding to the Ti4+/Ti3+ redox reaction), aligning closely with the HER potential in aqueous Na electrolytes. The use of carbon coating and nanoparticle engineering has further enhanced its capacity to an impressive value of ∼130 mA h g−1, which approaches its theoretical limit while ensuring rapid charge and discharge performance.
 | ||
| Fig. 29 (a) and (b) Crystal structure and electrochemical properties of NaTi2(PO4)3.318,319 The sodiation/desodiation curves of NaTi2(PO4)3 were obtained in 1 M NaClO4/ethylene carbonate:dimethyl carbonate (1:1, v:v) and 2 M Na2SO4/H2O. Reprinted with permission from Nano-micro Letters (a) and Journal of The Electrochemical Society (b). | ||
Suo et al. demonstrated the remarkable stability of the NaTi2(PO4)3 anode in an aqueous Na full cell paired with a Na0.66Mn0.66Ti0.34O2 cathode in a 9.3 m NaOTf/H2O solution. Their findings showed that 93% of the initial capacity was retained after 1200 cycles at 1C.136 However, challenges remain, primarily owing to the increased surface area associated with nanosizing, which exacerbates electrolyte decomposition on the anode surface.
Layered vanadium oxides, VxOy·nH2O, have been evaluated as potential anode materials in aqueous Na-ion batteries.124,320 Wu et al. conducted the galvanostatic cycling of V2O5·0.6H2O within a potential range of 0–1.0 V vs. the saturated calomel electrode (SCE) at a constant current of 100 mA g−1.320 They observed reversible capacities of 37, 43, and 50 mA h g−1 in Li2SO4, Na2SO4, and K2SO4 solutions, respectively. Furthermore, Deng et al. demonstrated that Na2V6O16·nH2O provided a reversible capacity of 40 mA h g−1 in 1 M Na2SO4/H2O under operating potentials in the range from −0.05 to −0.65 V vs. SCE at a constant current of 40 mA g−1.124 However, layered vanadium oxides generally exhibit poor capacity retention and Coulombic efficiency owing to irreversible structural changes upon Na+ insertion and the dissolution of vanadium ions into the bulk electrolyte. Additionally, as noted in Table 3, most aqueous Na-ion batteries exhibit output voltages below 1.7 V, which is considerably lower than those of their nonaqueous counterparts (which typically exceed 3 V). This discrepancy is largely attributed to the narrow operating potential window of aqueous Na electrolytes (Table 3), necessitating the use of anode active materials like NaTi2(PO4)3 and VxOy·nH2O, which offer a substantially higher reaction potential compared to those used in nonaqueous systems, such as hard carbons (0.3 V vs. Na/Na+).
5.3. Active materials for aqueous K-ion batteries
For aqueous K-ion batteries, Prussian blue, Fe4[Fe(CN)6]3, and its analogs, AxTm1Tm2(CN)6(H2O)n, where A represents alkali metal ions (Li, Na, or K) and Tm1, Tm2 represent transition metal ions (e.g., Fe, Mn, Ni, Co),321 have been primarily employed as cathode active materials. This choice is influenced by the considerably larger ionic radius of K+ (1.38–1.46 Å) compared to those of Li+ (0.60–0.79 Å) and Na+ (1.02–1.07 Å) (Table 2).322–324 Their open and flexible frameworks provide ample void sites for the rapid transport and storage of large metal ions like K+.322–324Neff et al. first reported the electrochemical activity of Prussian blue in aqueous electrolytes in 1978 (Fig. 30).325 Subsequent developments of its analogs have aimed to achieve higher capacity, redox potential, and faster charge/discharge properties. For instance, K1.85Fe0.33Mn0.67[Fe(CN)6]0.98·0.77H2O demonstrated a high capacity of 130 mA h g−1 with a redox potential exceeding 4 V (vs. K/K+). It retained 70% of its initial capacity at 100C in a 22 m KOTf aqueous solution (Fig. 30).122 However, challenges persist during synthesis, particularly in achieving uniform control over the contents and distribution of structural water, alkali metal, and transition metal ions, often leading to defect formation in the framework and deteriorating the electrochemical performance. Furthermore, most organic materials exhibit high solubility in water, and the dissolution of transition metals during charge and discharge processes can occur. Notably, the calendar life of Prussian blue and most of its analogs is less than 30 days, suggesting that their impressive cycling numbers may have been overestimated under high-rate cycling conditions, masking issues of dissolution and parasitic reactions.326
 | ||
| Fig. 30 (a) Crystal structure of Prussian blue and its analogues.327 Electrochemical properties of (b) Prussian blue in 0.1 M KCl/H2O325 and (c) K1.85Fe0.33Mn0.67[Fe(CN)6]0.98·0.77H2O in 22 m KOTf/H2O.122 (d) SEM images and (e) X-ray diffraction (XRD) patterns of K2Fe0.5Mn0.5[Fe(CN)6] electrodes before and after 200 cycles in diverse aqueous K electrolytes.167 (f) Inductively coupled plasma-atomic emission spectrometry results for the electrolytes used in the K2Fe0.5Mn0.5[Fe(CN)6] cell test.167 KFSA and KFSI refer to the same chemical compound, KN(SO2F)2. Reprinted with permission from ACS Applied Materials & Interfaces (a), Journal of The Electrochemical Society (b), Nature Energy (c), and Journal of Power Sources (d)–(f). | ||
To address the stability issue in aqueous K-ion batteries, Hosaka et al. explored the use of highly salt-concentrated aqueous electrolytes. They tested the electrochemical stability of a K2Fe0.5Mn0.5[Fe(CN)6] electrode in 20 m KOTf·2.8H2O, 31 m KFSI·1.8H2O, and 55 m K(FSI)0.6(OTf)0.4·1.0H2O electrolytes.167 The results demonstrated that a higher salt concentration in the electrolyte provides better stability. For instance, a capacity retention of 72% after 200 cycles at 1C was achieved in the 55 m K(FSI)0.6(OTf)0.4·1.0H2O electrolyte, significantly surpassing the results achieved with 20 m KOTf·2.8H2O (21%) and 31 m KFSI·1.8H2O (36%). Scanning electron microscopy (SEM) observations and inductively coupled plasma-atomic emission spectroscopy tests indicated that the highly salt-concentrated K(FSI)0.6(OTf)0.4·1.0H2O electrolyte helped prevent the dissolution of both, transition metals from the cathode active material and the cathode active material itself (Fig. 30).
However, despite these advancements, achieving perfect control over dissolution remains a significant challenge, as evidenced by the relatively poor cycling stability compared to those of metal oxide-based cathode active materials in Li and Na aqueous electrolytes (Tables 1, 3 and 4). Furthermore, the presence of large void volumes in Prussian blue and its analogs decreases the battery energy density per unit volume (W h L−1), necessitating the further development of cathode active materials for aqueous K-ion batteries.
In the realm of anode active materials for aqueous K-ion batteries, PTCDI, a dark red pigment with a monoclinic lattice structure characterized by the P21/n space group, has been the primary focus of studies.328,329 In 2019, the team led by Hu showcased its electrochemical activation in an aqueous K electrolyte, highlighting several advantageous features, including a high reversible capacity exceeding 120 mA h g−1 within a reaction potential range of 1.7–3.0 V vs. K/K+, limited solubility in water, and high ionic conductivity, which enabled rapid K+ insertion and extraction over a broad temperature range.122 An aqueous K-ion full cell coupled with a K1.85Fe0.33Mn0.67[Fe(CN)6]0.98·0.77H2O cathode and a PTCDI anode delivered a high capacity of 65 mA h g−1 based on the total mass of the cathode and anode, with an output voltage of 1.3 V, and demonstrated high cycling stability, retaining 77% of the initial capacity after 2000 cycles at 4C (Fig. 31).122
 | ||
| Fig. 31 (a) and (b) Molecular structure and electrochemical properties of PTCDI.122 (c) and (d) Crystal structure and electrochemical properties of KTi2(PO4)3 in 30 m KOAc/H2O.188,330 Reprinted with permission from Nature Energy (a) and (b), Chemical Communications (c) and ACS Energy Letters (d). | ||
Another noteworthy candidate is potassium titanium phosphate, KTi2(PO4)3, which features a three-dimensional framework composed of PO4 tetrahedra and TiO6 octahedra, offering ample interstitial sites for K+ insertion.330,331 This material exhibits lower potential hysteresis in aqueous electrolytes compared to nonaqueous systems and offers a low reaction potential of 1.6–2.0 V vs. K/K+ with the Ti4+/Ti3+ redox couple (Fig. 31).188 However, the notably low ionic and electronic conductivities of KTi2(PO4)3 necessitate enhancements such as carbon coating and nanoparticle engineering. These modifications, while beneficial for the conductivity, reduce the battery energy density and increase surface reaction areas, leading to severe electrolyte decomposition. Furthermore, the reaction potential of both PTCDI and KTi2(PO4)3 is still significantly higher than those of the anode active materials used in nonaqueous K-ion batteries (e.g., graphite; ∼0.1 V vs. K/K+) owing to the narrow operating potential window of aqueous K electrolytes (Table 7).332 This limits the output voltage of the aqueous K-ion full cell under 1.5 V, which is not comparable with that of nonaqueous batteries providing an output of over 3 V.
Indeed, the cathode and anode active materials currently demonstrated in aqueous batteries are primarily borrowed from those employed in nonaqueous batteries. The practical utilization and performance improvement of aqueous batteries may remain largely limited unless distinct design strategies for active materials are developed. Effective methods must be developed to enhance ionic and electronic conductivities, without increasing the surface reaction areas, and to mitigate issues such as water solubility, transition metal dissolution, catalytic effects on water electrolysis, carrier ion-blocking oxide film formation, and proton intercalation under various operating conditions like extreme temperatures, low C-rates, and long-term storage in a charged state.
6. Strategies for overcoming challenges with aqueous batteries
The challenges of enhancing the narrow operating potential window, low output voltage, and cycling performance of aqueous rechargeable batteries have led to the development of various strategies, each with its own challenges and potential benefits. Initial efforts focused on manipulating the thermodynamic potential of the HER and OER by adjusting the pH of the electrolyte. Subsequent strategies involved the ex situ coating of electrodes with inorganic materials such as Al2O3, TiO2, SiO2, or organic compounds like carbons and polymers. These coating layers are intended to prevent direct contact between the electrode and the aqueous electrolyte, thereby helping to reduce electrolyte decomposition, kinetically. However, the approach faces several challenges, including non-uniformity in the coatings, inadequate ion conductivity of the coating layer, and reduced electrical conductivity of the electrode. Additionally, the continuous expansion and contraction of active materials during charging and discharging can damage the coating. The risk of dissolution or breakdown of the coating materials in aqueous electrolytes also remains, thereby questioning the universal applicability of coating techniques across various carrier ions.For instance, Droguet et al. tested the chemical stability of a LiF coating in a standard nonaqueous electrolyte (1 M LiPF6 in ethylene carbonate:dimethyl carbonate) and in highly salt-concentrated aqueous electrolytes (20 m LiTFSI/H2O and 28 m Li(TFSI)0.7(BETI)0.3·2H2O) (Fig. 32).333 The result indicated minimal gas release when the LiF-coated Li metal encountered the nonaqueous electrolyte (approximately 0.5 × 10⁻²%), nearing the detection limit of a gas chromatography-flame ionization detector. In contrast, when the LiF-coated Li metal was exposed to a 20 m LiTFSI solution, significant amounts of hydrogen gas (4–8%) were detected, accompanied by nearly 80% depletion of the Li metal. Similarly, ∼1% of hydrogen gas was continuously detected with 28 m Li(TFSI)0.7(BETI)0.3·2H2O, resulting in ∼22% of the Li metal being consumed after 2 h.
 | ||
| Fig. 32 Estimated gas evolution during exposure of LiF-protected Li metal to (a) nonaqueous and (b) highly salt-concentrated aqueous electrolytes.333 Reprinted with permission from ACS Energy Letters. | ||
These findings suggest that while highly salt-concentrated aqueous electrolytes lower the solubility of inorganic (LiF) coatings, such coatings remain stable only in nonaqueous systems and are fundamentally unstable in aqueous solutions.
Strategies to completely separate the electrode and electrolyte have also been introduced. In 2005, Visco et al. demonstrated aqueous Li-ion batteries based on a glass-protected Li metal.334,335 In 2013, Holze et al. inserted a lithium super-ionic conductor (LISICON, Li2O–Al2O3–SiO2–P2O5–TiO2–GeO2) between the cathode and Li metal anode, through which aqueous electrolytes could not pass.336 They constructed a full cell with a LiMn2O4|0.5 M Li2SO4 aqueous solution|LISICON|Li configuration and cycled it between 3.7 and 4.25 V at a constant current of 100 mA g−1. This setup demonstrated high initial Coulombic efficiency (88.5%) and negligible capacity degradation over 30 cycles, showcasing performance levels similar to those of nonaqueous systems (Fig. 33).
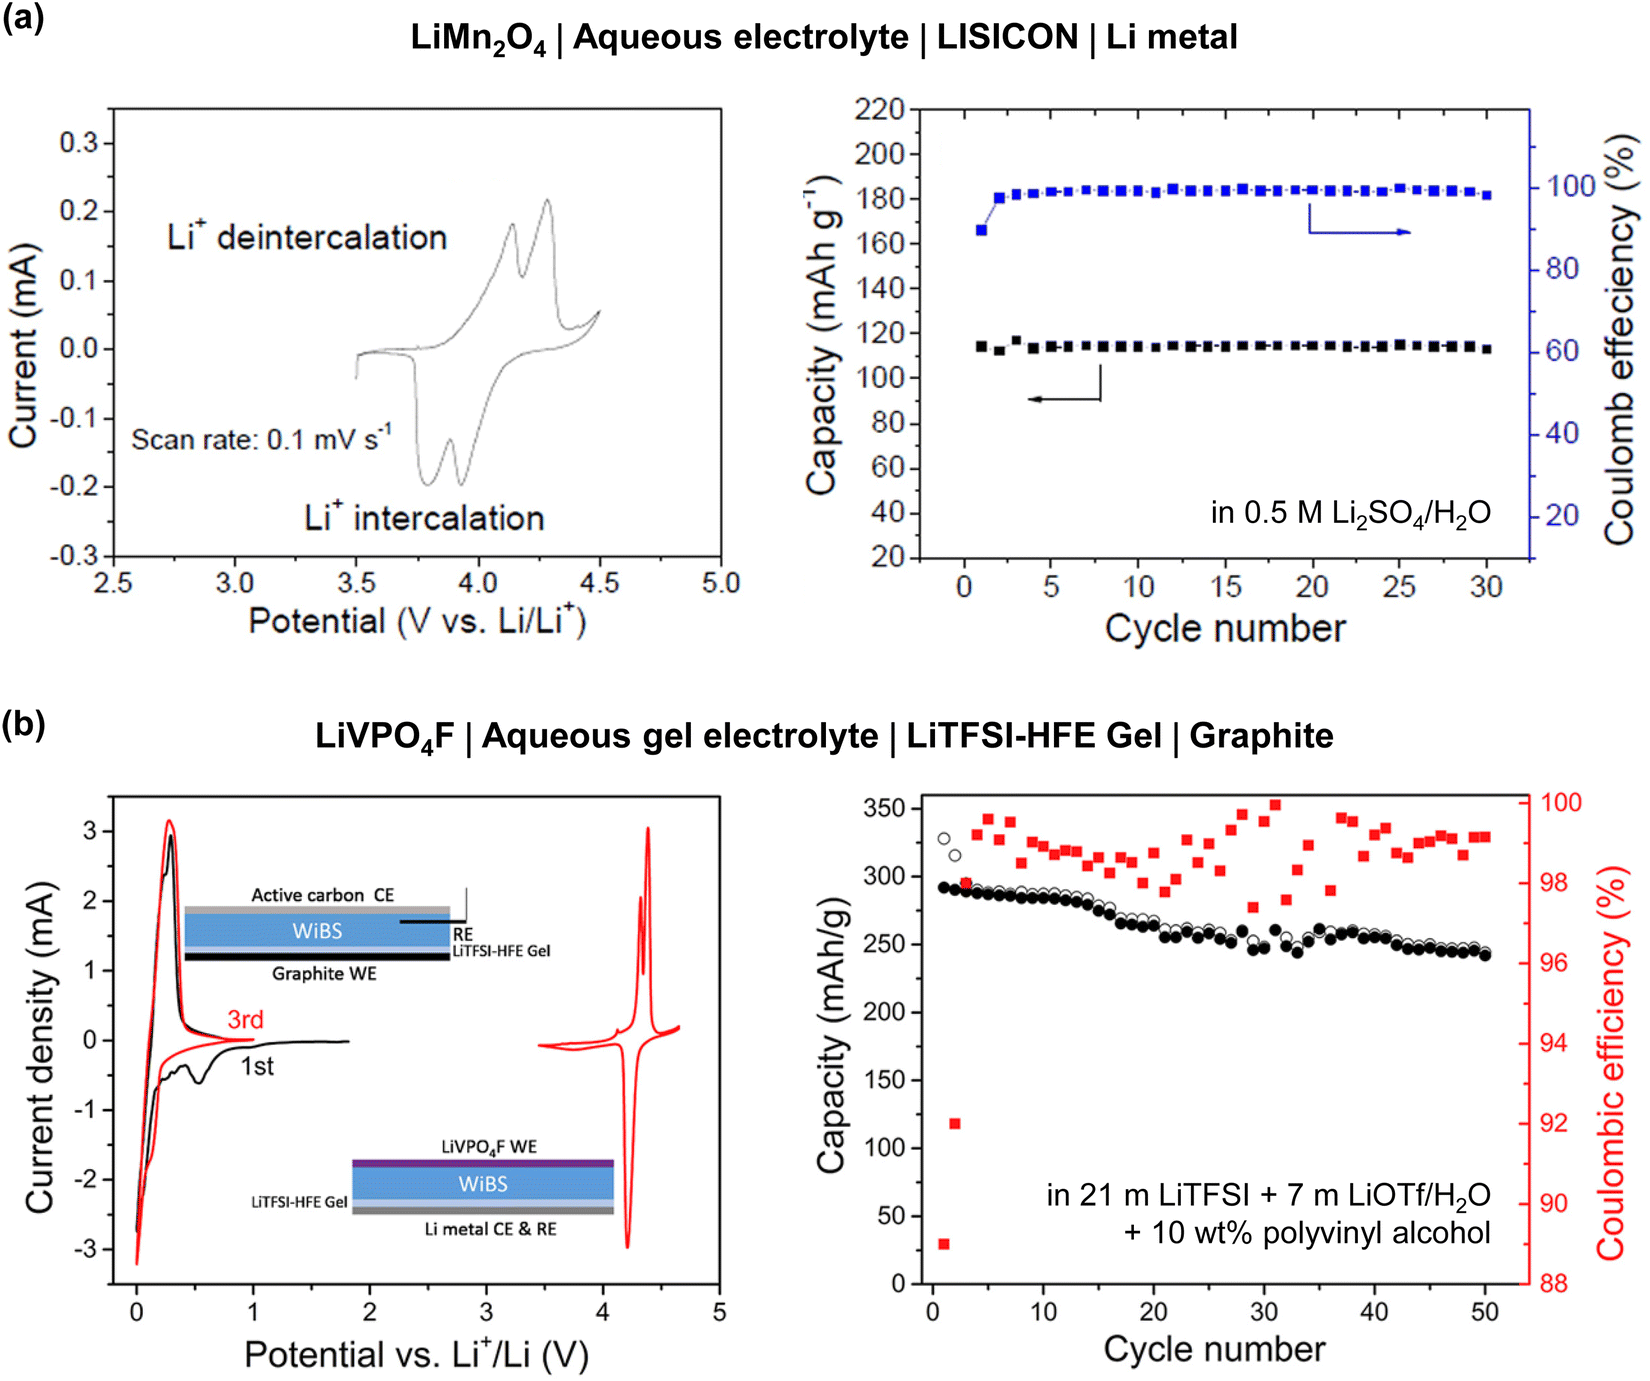 | ||
| Fig. 33 Electrochemical properties of the (a) LiMn2O4|LISICON|Li full cell in 0.5 M Li2SO4/H2O336 and (b) LiVPO4F|LiTFSI-HFE gel|graphite full cell in 21 m LiTFSI + 7 m LiOTf/H2O + 10 wt% polyvinyl alcohol electrolyte.337 Reprinted with permission from Scientific Reports (a) and Joule (b). | ||
In a similar vein, in 2017, Wang and Xu groups devised a Li+-conducting hydrophobic layer by mixing 0.5 M LiTFSI/highly fluorinated ether (1,1,2,2-tetrafluoroethyl-2,2,2-trifluoroethyl ether, HFE) with 10 wt% polyethylene oxide at 70 °C. This layer was then applied over anodes made of Li metal or graphite (Fig. 33).337 Fifty cycles in various 4 V-class full cells, including LiVPO4F|HFE-based layer|Li, LiVPO4F|HFE-based layer|graphite and LiMn2O4|HFE-based layer|Li configurations, were achieved using a constant current of 0.3C in a 21 m LiTFSI + 7 m LiOTf/H2O + 10 wt% polyvinyl alcohol electrolyte. Despite achieving multiple cycles, the systems showed low Coulombic efficiency (98–99.5%) and continuous capacity degradation.
Although employing a Li+-conducting layer to fully isolate the electrode from the electrolyte offers the potential to achieve higher output voltages in aqueous battery systems, its effectiveness is significantly constrained. Challenges include the existence of a thick coating layer that drastically reduces ion conductivity, chemical instability under extreme pH conditions, and the complexity and high cost of manufacturing processes. These issues echo the difficulties encountered with previously discussed ex situ coating methods, motivating researchers to develop functional electrolytes and optimize the battery potential diagram to address the limitations effectively.
6.1. Optimization of potential diagram
To maximize the battery performance, the potential diagram between the electrode reaction potential and the electrolyte potential window must be considered carefully. For example, the reaction potential of the Li4Ti5O12 anode (1.5–1.6 V vs. Li/Li+) is lower than the HER potential in most aqueous electrolytes. Nevertheless, Yamada et al. demonstrated in 2016 and 2019 that reversible lithiation and delithiation of the Li4Ti5O12 anodes are achievable using highly salt-concentrated aqueous electrolytes, specifically 28 m Li(TFSI)0.7(BETI)0.3·2H2O and 56 m Li(PTFSI)0.6(TFSI)0.4·1H2O electrolytes.19,91 This is attributed to not only a significant decrease in the water activity, facilitating the rapid growth and maintenance of the SEI, but also an upward shift in the reaction potential of the Li4Ti5O12 anode within these electrolytes (Fig. 34). Importantly, this upshifted electrode potential reduces the thermodynamic driving force for the electrolyte reduction and alleviates the burden on the kinetic support provided by the SEI, thereby largely suppressing electrolyte degradation on the anode surface.48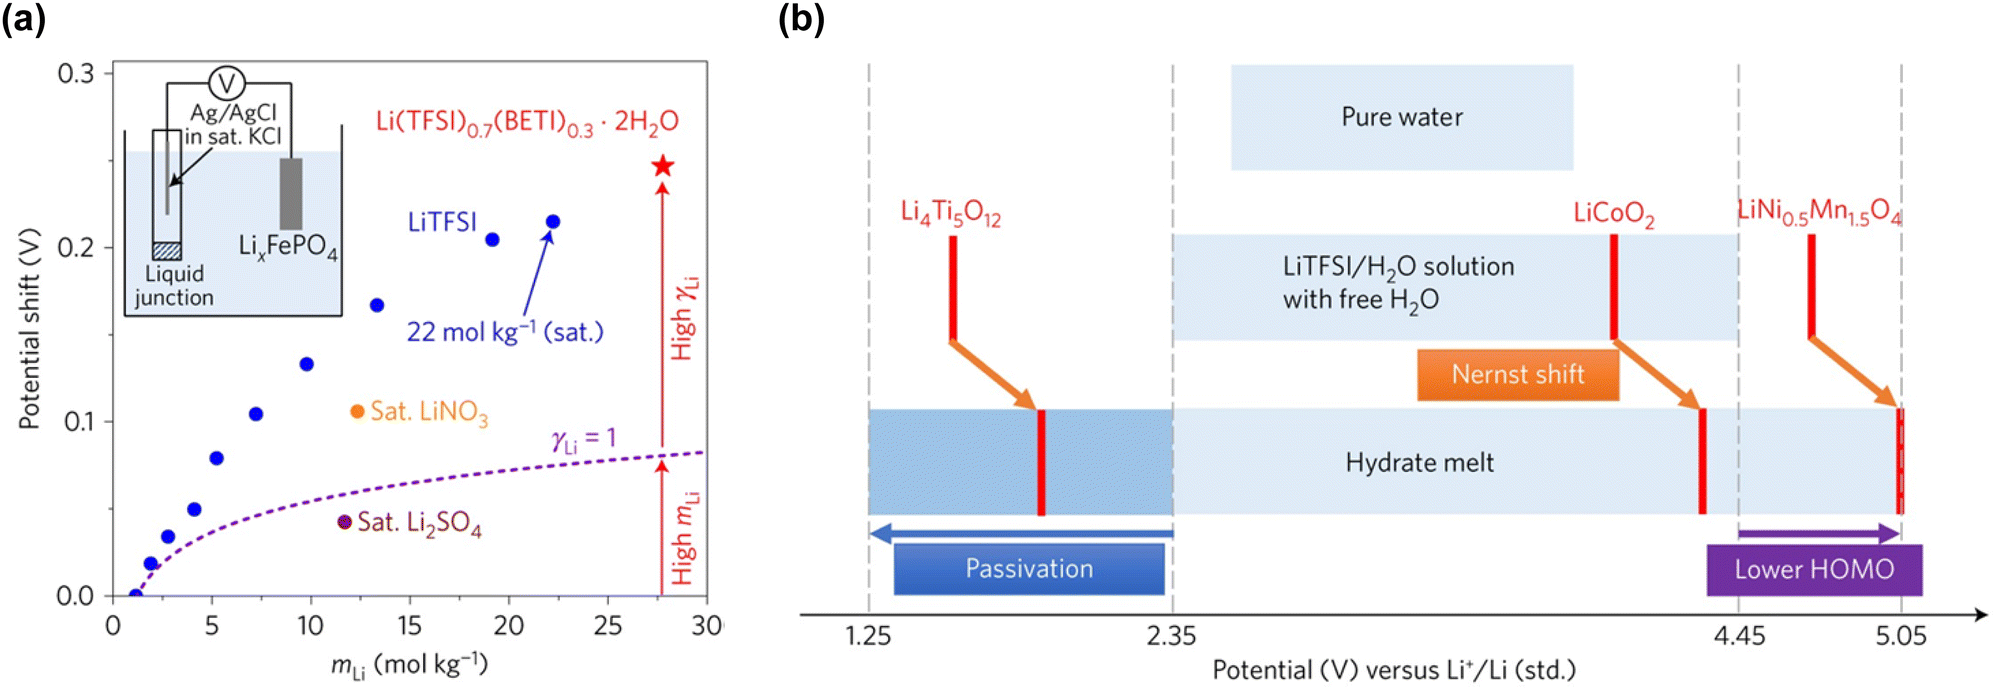 | ||
| Fig. 34 (a) Electrode potential shift depending on the electrolyte concentration. (b) Relationship between the operating potential windows of aqueous electrolytes and the reaction potentials of electrodes. The upshifted electrode potential in the hydrate melt contributes to mitigating electrolyte reduction on the Li4Ti5O12 surface.19 Reprinted with permission from Nature Energy. | ||
The equilibrium potential (E) of an electrode reaction (i.e., the intercalation and deintercalation of carrier ions into active materials) is influenced by the activity (a) of carrier ions in the electrolyte.338–340 For instance, according to the Nernst equation (eqn (17)), the value of E in a highly salt-concentrated aqueous electrolyte, 56 m Li(PTFSI)0.6(TFSI)0.4·1H2O, is expected to be higher than that in a 1 m solution, 1 m LiTFSI/H2O.85
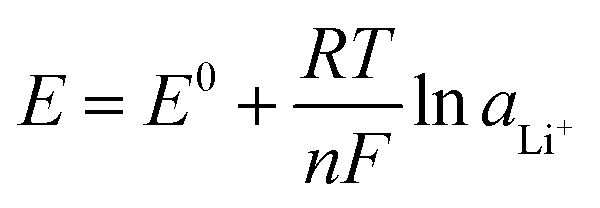 | (17) |
 | (18) |
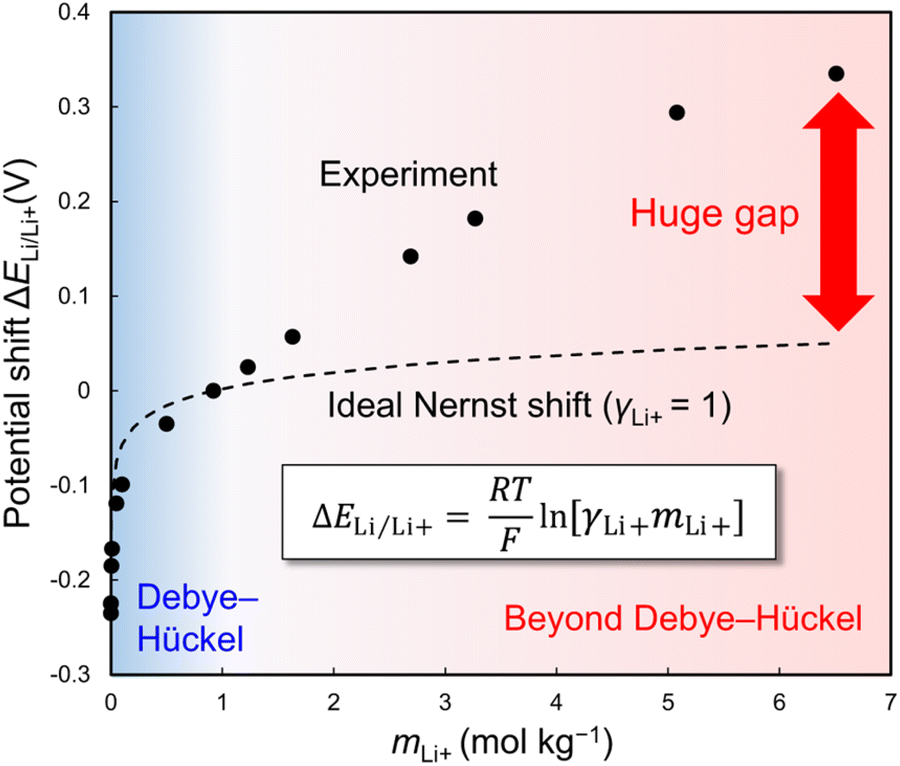 | ||
| Fig. 35 Anomalous shift in the Li/Li+ redox potential. The large gap between the experimentally obtained and calculated potential shifts cannot be explained by either the classical Debye–Hückel theory or its phenomenological extensions.342,343 Reprinted with permission from Nature Communications. | ||
Recently, Yamada et al., proposed the concept of the “liquid Madelung potential” to quantitatively correlate the local coordination structure and thermodynamics within the system.343 This liquid Madelung potential for carrier ions, such as Li+, is derived by summing all the electrostatic interactions of the surrounding solvents and ions for each atom individually (Fig. 36 and eqn (19)):
 | (19) |
 | ||
| Fig. 36 Concept of the (a) classical Madelung potential for inorganic crystals, (b) and (c) liquid Madelung (Ewald) potential, represented by the sum of overall electrostatic interactions between the surrounding ions and/or solvents and the central Li+ in the electrolyte.343 Reprinted with permission from Nature Communications. | ||
The variation in the “liquid Madelung potential” is attributed to the coordination environment of the carrier ion within the electrolyte. Therefore, three factors are worth considering in this regard. First, as the salt concentration increases, the carrier ion tends to be predominantly coordinated by anions to form contact ion pairs and/or ion-pair aggregates, rather than by solvents to form solvent-separated ion pairs. Second, the electrostatic stability of the carrier ion is enhanced when it is strongly solvated by electron-localized species, whereas it decreases when coordinated by electron-delocalized species within the electrolyte. This is primarily because the higher electron density largely influences the Coulombic energy in the first-coordination sphere, although the “liquid Madelung potential” is a converged value obtained by considering the Coulombic interactions of all constituent atoms up to infinite distances. Third, electrons, in general, are strongly localized on oxygen atoms in the solvent, whereas they are delocalized in bulky and weak Lewis basic anions such as TFSI−. With increasing salt concentration, the dominant first-coordination species shifts from electron-localized solvents to the electron-delocalized anions. This transition destabilizes the “liquid Madelung potential” of the carrier ion, resulting in a substantial upshift in the electrode potential (Fig. 36). Another critical consideration is the electrode potential shift, which simultaneously alters the redox potentials of both the cathode and anode by equal magnitudes (Fig. 37). Since these parallel shifts offer a constant battery voltage, they are challenging to detect in typical two-electrode batteries, leading to frequent oversights.
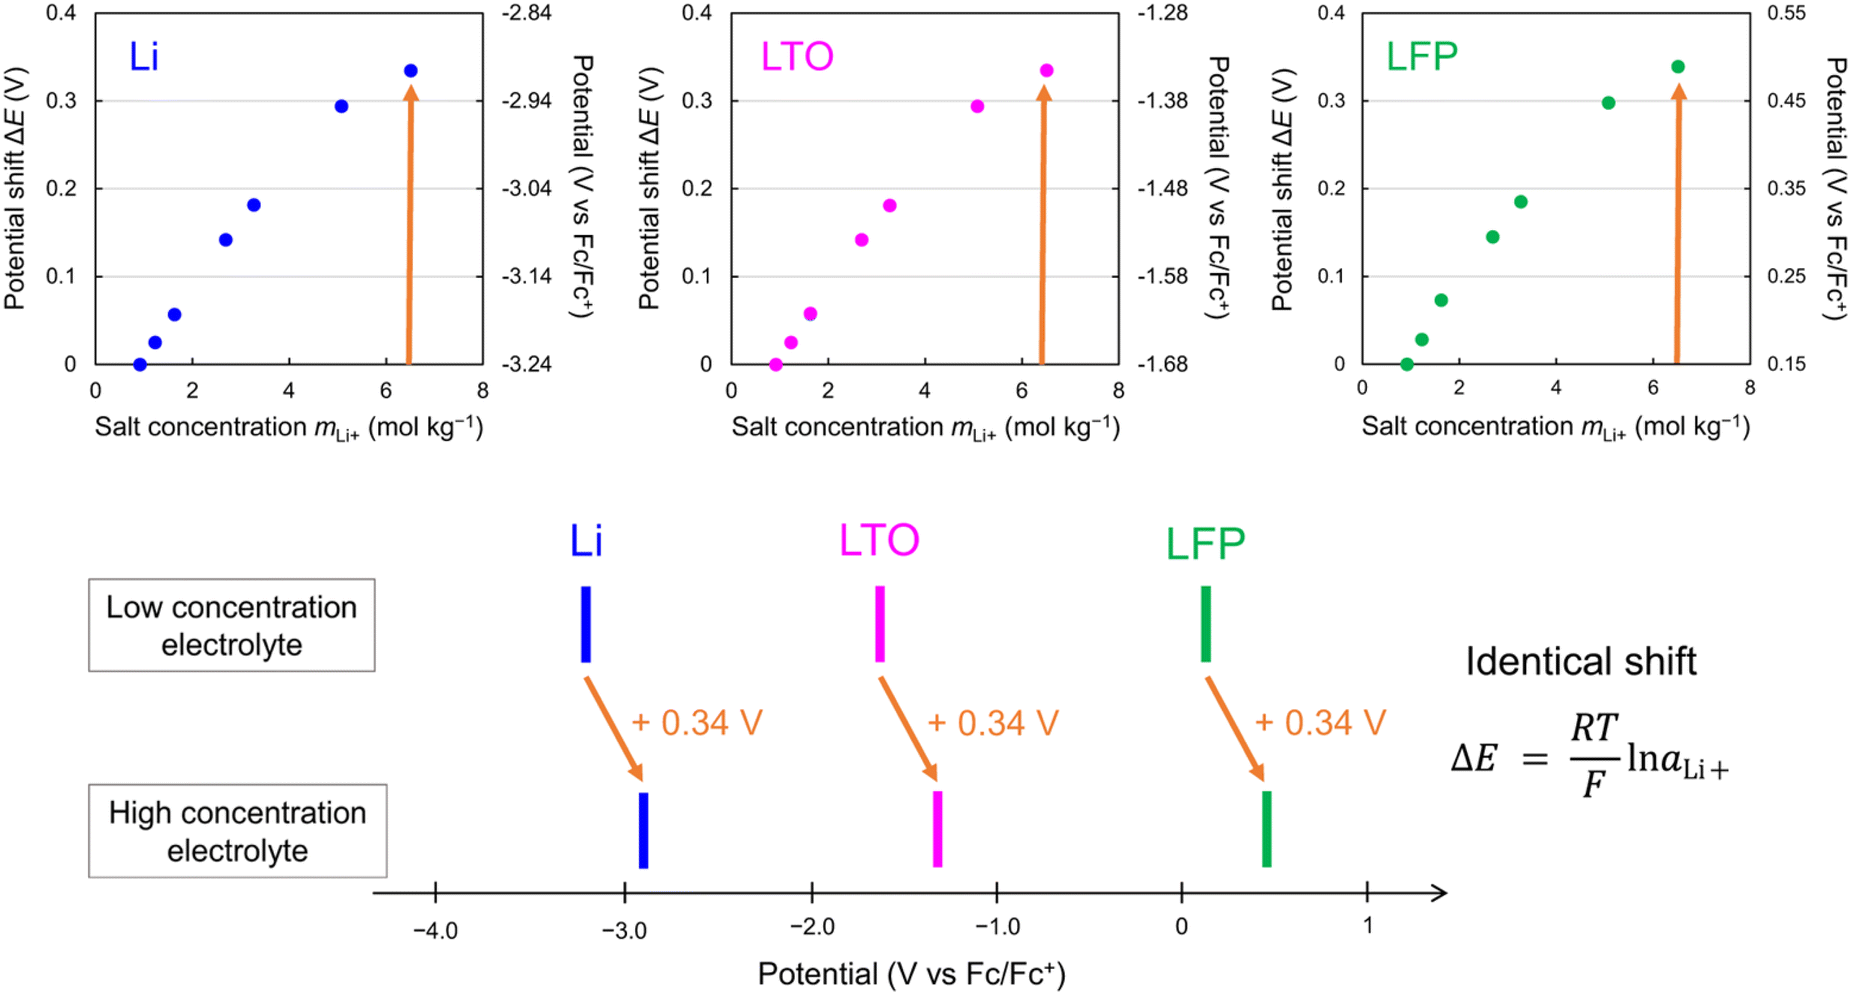 | ||
| Fig. 37 Simultaneous shift in the redox/reaction potentials with identical magnitude.343 To maximize the battery performance, the overall potential diagram of full cells and the operating potential window of electrolytes should be optimized.48,342,343 Reprinted with permission from Nature Communications. | ||
Consequently, in addition to conventional strategies such as expanding the operating potential window of electrolytes using highly oxidation- and reduction-tolerant co-solvents and salts and addressing kinetic limitations induced by the formation of surface passivation films, it is crucial to consider the electrode potential shift depending on the electrolyte solution structure. Without a comprehensive understanding of the overall potential diagram of full cells (including the parallel shift of the reaction potentials of cathode and anode) and the operating potential window of electrolytes, stable battery performance cannot be ensured, as demonstrated by recent studies.48,342,343
6.2. Utilization of functional anions
The electrochemical stability of aqueous electrolytes largely depends on the choice of anions (Fig. 38).226,346 The selection criteria for anions in aqueous electrolytes encompass several aspects:19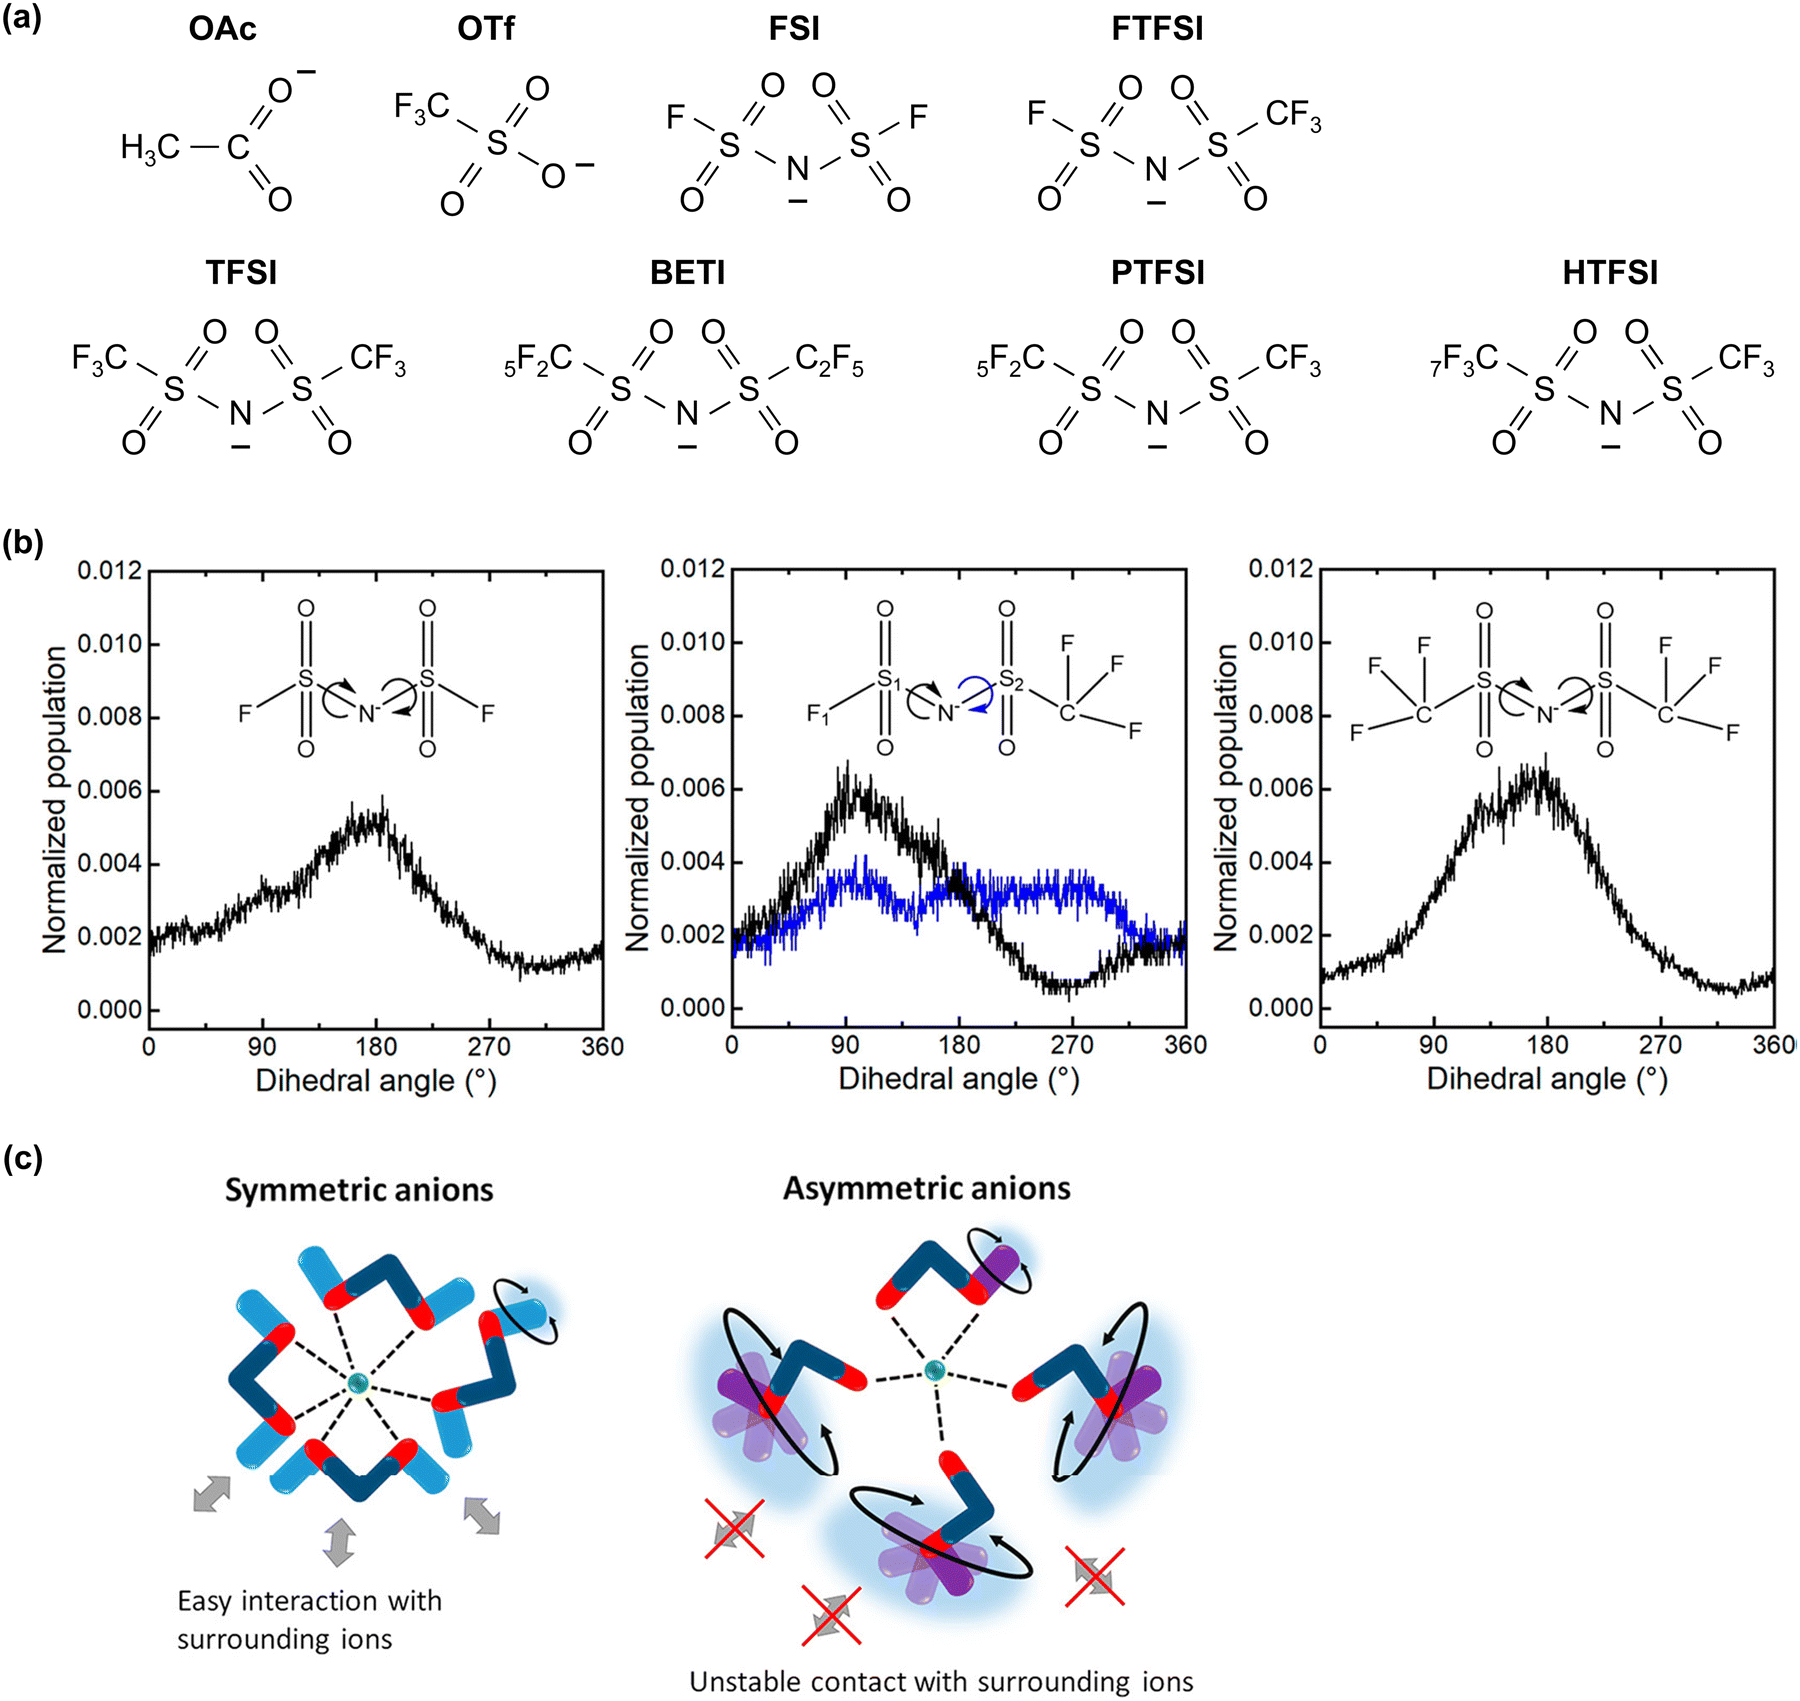 | ||
| Fig. 38 (a) Chemical structures of anions introduced into aqueous electrolytes. (b) Normalized distribution of dihedral angles in 35 m LiFSI (symmetric), LiFTFSI (asymmetric), and LiTFSI (symmetric) solutions.91 The homogeneous distribution of the dihedral angle in the SO2CF3 group of the FTFSI anion, highlighted in blue, indicates high anion exchange and rotational mobility, which facilitate fast ion hopping and suppress electrolyte crystallization at low temperatures.89–92,185 (c) Schematic showing the differences in local coordination between symmetric TFSI and asymmetric FTFSI anions.91 Reprinted with permission from The Journal of Physical Chemistry Letters (b) and (c). | ||
(1) A high hydrolysis resistance is required to maintain the pH and a stable electrolyte composition.
(2) In aqueous batteries, the SEI is primarily formed by anion reduction. Therefore, the ability to form a functional SEI with low solubility and reactivity toward water while providing high carrier ion conductivity is essential.20,21,85,333 This helps broaden the reduction stability of the electrolyte by preventing direct contact between the electrolyte and electrode, thereby suppressing electrolyte decomposition at the anode kinetically.
(3) A high salt solubility is necessary to create a unique solution structure that stabilizes the SEI and prevents transition metal and electrode dissolution.
(4) A plasticizing effect that prevents electrolyte crystallization and maintains an amorphous liquid state with minimal water content broadens the operating temperature range of the battery.347
(5) Bulky organic anions are preferred over small-size inorganic anions because they occupy a larger volume, thereby improving the electrochemical stability of the electrolyte by reducing water concentration on the electrode surface.90,346,348,349
(6) A high oxidation stability is crucial to broaden the operating potential window of the electrolyte.
For example, commonly used salts in nonaqueous batteries, such as LiPF6, LiBF4, LiBOB (LiB(C2O4)2), and LiDFOB (LiB(C2O4)F2), are susceptible to hydrolysis, and are hence unsuitable for use in aqueous systems.169,234–239,350 Inorganic salts such as LiCl, LiNO3, and Li2SO4 typically offer low salt solubility and/or poor SEI formation ability.21,194 Using perchlorate complexes (e.g., LiClO4) at high concentrations poses safety risks as they are prone to explosion.351,352 As an alternative, lithium acetate (LiOAc) exhibits poor oxidation stability and SEI-forming ability, making it challenging to expand the operating potential window of the electrolyte.353
As a result, the preparation of aqueous electrolytes predominantly relies on imide salts, which offer high resistance to hydrolysis and exhibit high salt solubility, good SEI-forming ability, a plasticizing effect, and high oxidation stability. The introduction of multiple imide salts with symmetric (e.g., LiTFSI, LiBETI) and asymmetric structures (e.g., LiPTFSI, LiHTFSI) helps suppress crystallization and improve the electrochemical stability of the aqueous electrolyte, while also allowing a high ionic conductivity with enhanced anion exchange and rotational mobility (Fig. 38).42–44
However, as noted previously, imide salts, especially those with asymmetric structures, are significantly more expensive than the typical PF6- and BF4-based salts. Additionally, they can only provide a particle-type SEI including inorganic compounds like LiF and Li2CO3, which is unfavorable for the complete coverage of the anode surface compared to that in a film (polymer)-type or particle-film-mixed-type SEI obtained in nonaqueous electrolytes.354–356 This restricts the improvement of the reduction stability in aqueous electrolytes.
The selection of anions can vary based on the Lewis acidity of carrier ions. For instance, the FSI− anion is more susceptible to hydrolysis than the TFSI− anion because the S–F bond in the former is weaker than the C–F bond in the latter. However, as illustrated in Fig. 39, minimal pH reduction with suppressed hydrolysis of the FSI− anion was demonstrated in aqueous Na and K electrolytes.169,170 This stable condition was maintained for extended periods exceeding 3000 h in a 62 m K(FSI)0.55(OTf)0.45·0.9H2O hydrate melt with extremely low water concentration. The strong interaction between the strong Lewis acid Li+ and the Lewis basic sulfonyl oxygen of the FSI− anion reduced the electron density around the sulfonyl group, thereby weakening the S–F bond. This catalytic effect of Li+ increased the susceptibility of the S–F bond to cleavage when in contact with water molecules. In contrast, in electrolytes containing the weak Lewis acidic K+, which exhibits a weaker catalytic effect, the stability of the FSI− anions was improved. Nevertheless, the use of FSI− as an anion in aqueous electrolytes is only feasible below room temperature, as interactions between carrier ions and anions become more pronounced at elevated temperatures, leading to a severe reduction in the electrolyte pH with accelerated FSI− hydrolysis (Fig. 39).
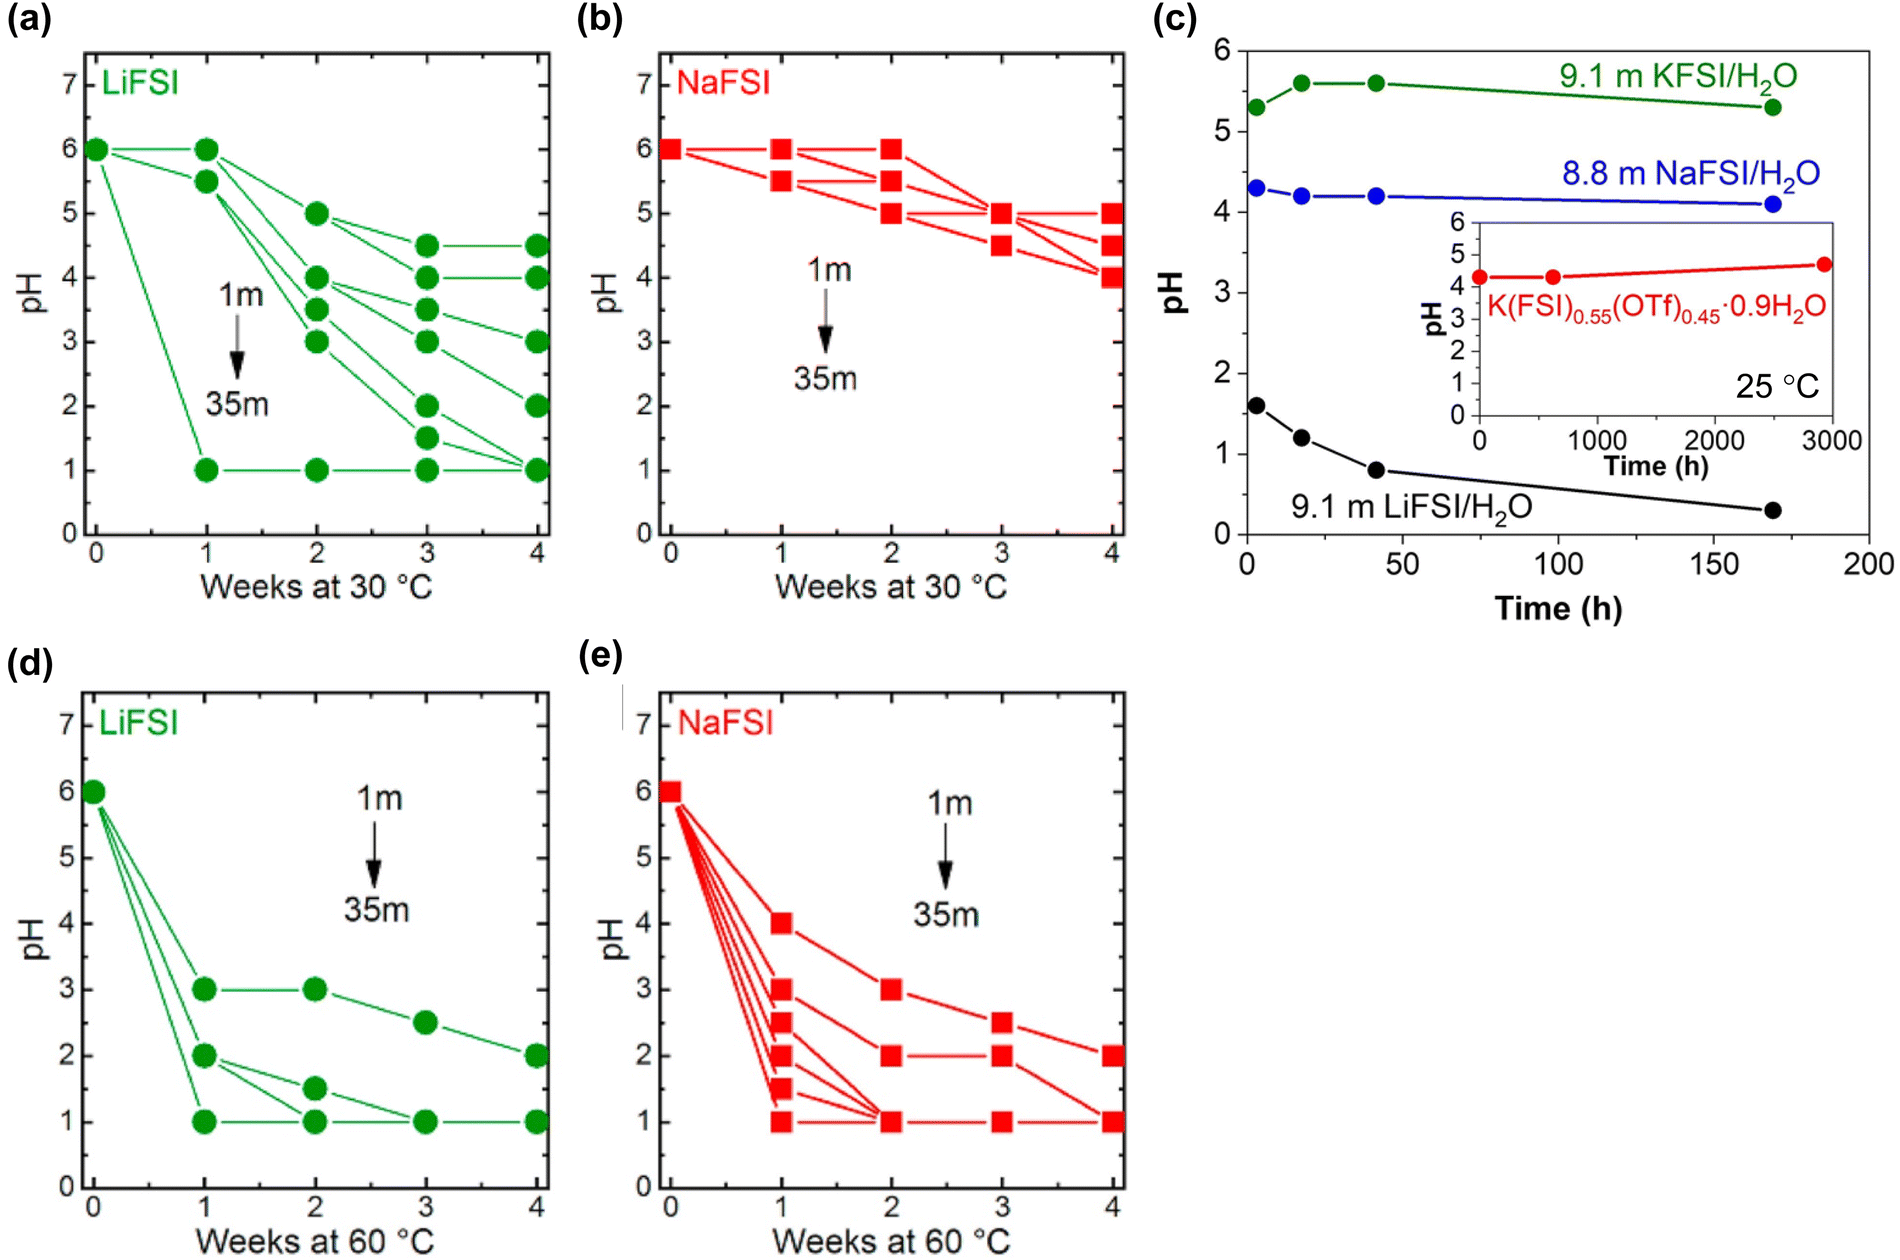 | ||
| Fig. 39 pH levels of FSI− anion-based aqueous electrolytes under various salt concentrations and temperature conditions.169,170 Reprinted with permission from Electrochimica Acta (a), (b), (d) and (e) and Electrochemistry Communications (c). | ||
6.3. Hybrid aqueous/nonaqueous systems
This review underscores the critical role of SEI design on the anode surface in enhancing the output voltage of aqueous batteries. The SEI must completely envelop the anode surface before the HER and remain stable throughout battery cycling. The use of highly salt-concentrated aqueous electrolytes increases the SEI formation potential and aids in stabilizing the SEI with their distinctive solution structure, which significantly reduces the water activity. However, employing such electrolytes, which necessitates dissolving a large amount of salts, increases the electrolyte viscosity and decreases the ion conductivity. These factors present challenges in battery manufacturing, elevate production costs, diminish the battery power density, and impair performance across a wide temperature range. Additionally, the SEI formed in aqueous electrolytes primarily consists of inorganic particles such as LiF and Li2CO3, derived from anions, leading to only partial coverage of the surface (Fig. 40).20,21,201,357 This is in contrast to the SEI obtained in nonaqueous electrolytes, which contains a mix of film-type species, such as alkylcarbonate and alkoxide-based organic polymers, along with inorganic particles.358–361 This composition significantly limits the access of the electrolyte to the anode surface, providing high battery cycling stability and high Coulombic efficiency (Fig. 40). | ||
| Fig. 40 Schematic comparison of SEI components in aqueous and nonaqueous electrolytes across various salt concentrations. | ||
To address the aforementioned issues, the introduction of organic solvents into aqueous electrolytes has been explored, as detailed in Tables 8–10.362 In 2009, Mentus et al. developed an electrolyte by incorporating 1 wt% of vinylene carbonate, a known electrolyte additive for promoting robust SEI formation in nonaqueous Li-ion batteries, into a saturated LiNO3/H2O solution.363 They assessed the reversibility of a V2O5 anode using an excess LiMn2O4 cathode as a counter electrode in this additive-containing electrolyte and confirmed no capacity degradation over 25 cycles at a current density of 50 mA cm−2. In 2018, Xu and Wang groups introduced dimethyl carbonate as a co-solvent.364 They prepared a hybrid aqueous/nonaqueous electrolyte by mixing 9.25 m of nonaqueous LiTFSI/dimethyl carbonate electrolyte into a highly salt-concentrated 21 m LiTFSI/H2O aqueous electrolyte. This blending of organic solvents with aqueous electrolytes can modify solvation structures by introducing competitive interactions between H2O and nonaqueous species, including organic solvents, carrier ions, and anions. In this hybrid electrolyte, the organic solvent substituted some of the Li+ ligands. As a result, a robust SEI was formed on the anode surface through the continuous reduction of Li+(TFSI−)n and Li+(dimethyl carbonate)n complexes. Furthermore, as the carrier ion (Li+) was surrounded by a limited number of water molecules, the approach of the water molecules to the electrode surface was restricted, which enhanced both, the anodic and cathodic stabilities. They successfully cycled a LiNi0.5Mn1.5O4|Li4Ti5O12 full cell, achieving a high output voltage of 3.2 V, which was comparable to those of nonaqueous batteries, and maintaining stable cycling (90% capacity retention after 100 cycles) at a low constant current of 0.5C.
| Year | Electrolyte | Cathode | Cathode L/L (mg cm−2) | Anode | Anode L/L (mg cm−2) | Full cell cutoff (V/V) | Full cell average (V) | P/N ratio | C-rate | Capacity (mA h g−1) | Capacity calculation based | Cycle number (—) | Retention ratio (%) |
|---|---|---|---|---|---|---|---|---|---|---|---|---|---|
| 2011 | Sat. LiNO3/H2O + 1 wt% vinylene carbonate363 | LiMn2O4 or Li1.05Cr0.10Mn1.85O4 | — | V2O5 | — | 1.0/0.0 | 0.9 | — | 50 mA g−1 | 65 | Anode | 25 | 100 |
| 2016 | 21 m LiTFSI/H2O + 0.1 wt% tris(trimethylsilyl) borate365 | LiCoO2 | — | Mo6S8 | — | 2.5/1.0 | 1.8 | 1.0 (mass) | 0.5C | 66 (0.5C) | Cathode + anode | 100 | 92 |
| 2.5C | 1000 | 87 | |||||||||||
| 2017 | 21 m LiTFS + 7 m LiOTf/H2O + 10 wt% polyvinyl alcohol366 | LiMn2O4 or LiCoO2 | — | Sulfur-Ketjchen black | 8 | 2.2/0.5 (LMO) | 1.6 (LMO) | 1.0 (capacity) | 0.2C (LMO) | 84 (LMO, 0.2C) | Cathode + anode | 100 | 91 |
| 2.5/0.6 (LCO) | 1.6 (LCO) | 1C (LMO) | 119 (LCO, 0.2C) | 100 | 86 | ||||||||
| 1C (LCO) | 100 | 93 | |||||||||||
| 2018 | 21 m LiTFSI/H2O + 9.25 m LiTFSI/dimethylcarbonate364 | LiNi0.5Mn1.5O4 | — | Li4Ti5O12 | — | 3.5/2.0 | 3.2 | 2.0 (mass) | 0.5C | 162 (0.5C) | Anode | 100 | 90 |
| 6.5C | 1000 | 78 | |||||||||||
| 2019 | 56 m LiClO4:methylsulfonylmethane:H2O (1:1.8:1, n:n:n)367 |
LiMn2O4 | 3.6 | Li4Ti5O12 | 1.2 | 2.7/0.8 | 2.4 | 3.0 (mass) | 4.5C | 67 | Cathode + anode | 1000 | 72 |
| 2020 | 2 m LiTFSI/polyethylene glycol:H2O (94:6, w:w)368 |
LiMn2O4 | 3 | Li1.3Al0.3Ti1.7(PO4)3 coated Li4Ti5O12 | 2.5 | 3.2/1.0 | 2.3 | 1.2 (mass) | 1C | 49 | Cathode + anode | 300 | 68 |
| 2020 | 42 m LiTFSI/H2O + 21 m trimethylethylammonium·TFSI369 | LiMn2O4 | 0.55 mA h cm−2 | Li4Ti5O12 | 0.5 mA h cm−2 | 2.8/1.8 | 2.5 | 1.1 (capacity) | 1C | 56 | Cathode + anode | 100 | 88 |
| 2020 | LiTFSI:tetraethylene glycol dimethyl ether:H2O (4:1:7, n:n:n)370 |
LiMn2O4 | 2–4 | Li4Ti5O12 | 1–2 | 2.8/1.0 | 2.5 | 2 (mass) | 3C | 49 (3C) | Cathode + anode | 500 | <50 |
| 10C | 300 | 55 | |||||||||||
| 2020 | 21 m LiTFSI/H2O + 9.25 m LiTFSI/dimethylcarbonate371 | Graphite | 4.3 | LiTi2(PO4)3 or Li4Ti5O12 | 2.4 | 2.05/0.0 | 1.5 (LTP) | 1.8 (mass) | 200 mA g−1 | 36 | Cathode + anode | 500 | 71 |
| 2.5 (LTO) | 200 mA g−1 | 27 | 50 | 84 | |||||||||
| 2020 | 15.3 m LiTFSI/acetonitrile:H2O (1:1, n:n)372 |
LiMn2O4 or LiNi0.8Co0.15Al0.05O2 | 5 | Li4Ti5O12 | 2 | 2.8/1.5 (LMO) | 2.3 (LMO) | 2.5 (mass, LMO) | 1C (LMO, 25 °C) | 46 (LMO/LTO) | Cathode + anode | 300 | 98 |
| 5C (LMO, 25 °C) | 1000 | 69 | |||||||||||
| 1C (LMO, 0 °C) | 100 | 95 | |||||||||||
| —/— (NCA) | 2.1 (NCA) | 1.0 (mass, NCA) | 81 (NCA/LTO) | ||||||||||
| 1C (NCA, 25 °C) | 100 | 91 | |||||||||||
| 2020 | LiClO4:urea:H2O (1:2:3, n:n:n)373 |
LiMn2O4 | — | Mo6S8 | — | 2.3/0.8 | 2.0 | 1.0 (mass) | 0.1C | 45 (0.1C) | Cathode + anode | 500 | 75 |
| 10C | 2000 | 86 | |||||||||||
| 2021 | 12.5 m LiNO3/1,5-pentanediol:H2O (1:1, w:w) + 6 wt% tetraethylene glycol dimethyl ether + 0.5 wt% 2-hydroxy-2-methylpropiophenone (polymerization)176 |
LiMn2O4 | 3 | Mo6S8 | 2 | 2.3/0.5 | 1.8 | 1.5 (mass) | 1C | 105 | Anode | 250 | 70 |
| 2021 | 3.6 m LiTFSI/sulfolane:H2O (1:1, n:n)374 |
LiMn2O4 | 2.3 | LiAlO2 coated Li4Ti5O12 | 2.3 | 3.0/1.5 | 2.5 | 1.0 (mass) | 1C | 56 | Cathode + anode | 300 | 70 |
| 5C | 1000 | 70 | |||||||||||
| 2021 | 33 m LiNO3/H2O + 10 wt% polyvinyl alcohol (vs. H2O)375 | LiNi0.5Mn1.5O4 or LiMn2O4 | 3.5 | VO2 | 2 | 2.5/1.1 (LNMO) | 2.4 | 1.75 (mass) | 1C (LNMO, 25 °C) | 72 | Cathode + anode | 100 | 78 |
| 2.0/0.8 (LMO) | 1.3 | 3C (LMO, 60 °C) | 74 | 220 | 73 | ||||||||
| 2021 | 40 m LiTFSI/H2O + 20 m 1-ethyl-3-ethylimidazolium·TFSI175 | LiNi0.8Mn0.1Co0.1O2 or LiMn2O4 | — | TiO2 or Li4Ti5O12 | 1.7 (TiO2) | 2.45/0.5 (NMC/TiO2) | 1.8 | 1.3 (capacity) | 0.5C (NMC/TiO2) | 67 | Cathode + anode | 500 | 60 |
| 2.75/0.5 (NMC/LTO) | 2.1 | 0.5C (NMC/LTO) | 72 | 200 | 65 | ||||||||
| 40 m LiTFSI/H2O + 20 m 1-ethyl-3-methylimidazolium·OTf | 1.8–3.2 (LTO) | 3.0/0.8 (LMO/LTO) | 2.3 | 1C (NMC/LTO) | 66 | 300 | 68 | ||||||
| 1C (LMO/LTO) | 59 | 300 | 65 | ||||||||||
| 2021 | 1.9 m LiTFSI/H2O:1,4-dioxane LiTFSI:H2O:1,4-dioxane (1:2.6:5.2, n:n:n)376 |
LiMn2O4 | 10 | Li4Ti5O12 | 5 | 2.6/1.0 | 2.5 | 2.0 (mass) | 0.57C (100 mA g−1) | 165 | Anode | 200 | 89 |
| 2022 | 2 m LiTFSI/polyethylene glycol dimethyl ether:H2O (94:6, w:w)377 |
LiMn2O4 | — | Li1.3Al0.3Ti1.7(PO4)3 coated Li4Ti5O12 | — | 3.2/1.0 | 2.4 | — | 1C | 50 | Cathode + anode | 300 | 65 |
| 5C | 32 | 800 | 68 | ||||||||||
| 2022 | 21 m LiTFSI/H2O + 5 mol% acrylamide or polyacrylamide378 | LiMn2O4 | 4 | LiTi2(PO4)3 coated TiO2 | 2 | 2.5/0.8 | 2.2 | 2.0 (mass) | 1C | 157 | Anode | 200 | 80 |
| 5C | 500 | 78 | |||||||||||
| 2022 | LiTFSI:1,3-dioxolane:H2O (1:1.08:1.08, n:n:n)379 |
LiMn2O4 | 5 or 2.5 | Li4Ti5O12 | 2 or 1 | 2.8/1.5 | 2.4 | 2.5 (mass) | 1C (25 °C) | 164 | Anode | 100 | 99 |
| 5C (25 °C) | 110 | 2000 | 50 | ||||||||||
| 0.5C (−20 °C) | 105 | 100 | 94 | ||||||||||
| 2022 | LiClO4:urea:H2O (1:2:3, n:n:n)380 |
LiMn2O4 | 20 or 60 | Li4Ti5O12 | 14 or 42 | 2.5/1.0 | 2.2 | 1.4 (mass) | 0.5C | 105 (0.5C) | Cathode | 100 | 85 |
| 10C | 1000 | 90 | |||||||||||
| 0.25C (12 A h pouch) | 400 | 75 | |||||||||||
| 2022 | 4.5 m LiTFSI + 0.1 m KOH/[urea:H2O (8.6:1, v:v)]381 |
LiMn2O4 or LiVPO4F | 14 or 24 | Li4Ti5O12 | 9 or 16 | 3.0/1.8 (LMO) | 2.4 | 1.14 (mass) | 0.5C (LMO) | 61 | Cathode + anode | 1000 | 87 |
| 0.5C (LVPF) | 59 | 500 | 80 | ||||||||||
| 3.0/1.8 (LVPF) | 2.5 | 1C (LMO, pouch, low L/L) | 61 | 1000 | 88 | ||||||||
| 1C (LMO, pouch, high L/L) | 61 | 500 | 70 | ||||||||||
| 2022 | LiTFSI/methylurea:H2O (1:2.7, n:n)382 |
LiMn2O4 | 7–10 | NbO2 | 4–5 | 3.3/1.5 | 2.3 | 0.9–1.0 (capacity) | 0.35C | 225 (0.35C) | Anode | 100 | 80 |
| 0.7C | 300 | 95 | |||||||||||
| 3.5C | 1500 | 100 | |||||||||||
| 2022 | LiFSI:1-methyl-1-propylpiperidinium·FSI:H2O (1:4:1, n:n:n)383 |
LiMn2O4 | 4 | LiAlO2 coated Li4Ti5O12 | 2 | 2.8/1.6 | 2.5 | 2.0 (mass) | 2C | 160 | Anode | 1000 | 70 |
| Year | Electrolyte | Cathode | Cathode L/L (mg cm−2) | Anode | Anode L/L (mg cm−2) | Full cell cutoff (V/V) | Full cell average (V) | P/N ratio | C-rate | Capacity (mA h g−1) | Capacity calculation based | Cycle number (—) | Retention ratio (%) |
|---|---|---|---|---|---|---|---|---|---|---|---|---|---|
| 2016 | 10 M NaClO4/H2O + 2 vol% VC384 | Na3V2O2(PO4)2F/carbon nanotube | — | NaTi2(PO4)3/carbon nanotube | — | 1.8/1.0 | 1.5 | — | 1C | 53 | — | 100 | 80 |
| 2019 | 10 M NaClO4/H2O + 2 vol% VC385 | Na4MnV(PO4)3/graphene oxide | 0.8 | NaTi2(PO4)3/carbon nanotube | 1.5 | 1.65/0.8 | 1.3 | 0.5 (mass) | 10C | 97 | Cathode | 100 | 52 |
| 2020 | NaClO4:H2O:urea:N,N-dimethylformamide (1:2:2:1, n:n:n:n)386 |
Na3V2(PO4)2F3 | 4–6 | NaTi2(PO4)3/C | 4–6 | 1.6/0.6 | 1.2 | 1.1 (mass) | 10C | 68 | Cathode + anode | 100 | 86 |
| 2021 | 80 m NaOTf/H2O + 1-ethyl-3-methylimidazolium·OTf158 | Na2Mn[Fe(CN)6] | 2–5 | NaTi2(PO4)3 | 2–5 | 2.2/0.5 | 1.2–1.3 | 0.5 (mass) | 1C (OTf-based) | 88 | Cathode | 300 | 68 |
| 80 m NaTFSI/H2O + 1-ethyl-3-methylimidazolium·TFSI | 1C (TFSI-based) | 98 | 300 | 78 | |||||||||
| 2021 | 2 m NaClO4/H2O + dimethyl sulfoxide (H2O:dimethyl sulfoxide = 1:1, n:n)387 |
Na3V2(PO4)3 | 1.2–2.4 | Na3V2(PO4)3 | 1.2–2.4 | 2.1/0.0 | 1.7 | 0.8 (capacity) | 5C | 90 | Cathode | 300 | 90 |
| 2023 | 18 m NaClO4/H2O + Na4Fe(CN)6388 | Na1.58Fe0.07Mn0.97Fe(CN)6·2.65H2O | — | 3,4,9,10-Perylene tetracarboxylic diimide | — | 2.2/0.0 | 1.3 | 0.8 (mass) | 500 mA g−1 | 157 | Cathode | 300 | 100 |
| 2021 | 20 m KOTf + 30 m KFSI/H2O + acrylamide389 | KMnFe(CN)6 | — | KiTi2(PO4)3/C | — | 2.8/0.0 | 1.5 | 1.5 (mass) | 100 mA g−1 | 135 (100 mA g−1) | Anode | 100 | 98 |
| 1000 mA g−1 | 70 (1000 mA g−1) | 3000 | 88 | ||||||||||
| 2021 | 2 m KFSI/N,N-dimethylformamide:H2O (1:1, n:n)390 |
K2Zn3[Fe(CN)6]2 | — | KiTi2(PO4)3/C | — | 2.2/0.01 | 1.2 | 2.0 (mass) | 200 mA g−1 | 57 (200 mA g−1) | Cathode | 200 | 67 |
| 1000 mA g−1 | 44 (1000 mA g−1) | 10000 |
73 | ||||||||||
| 2023 | KOTf:trimethyl phosphate:H2O (12:56:32, n:n:n)391 |
K1.5Mn0.61Fe0.39[Fe(CN)6]0.77·H2O | — | 3,4,9,10-Perylene tetracarboxylic diimide | — | 2.5/0.0 | 1.6 | — | 0.8C (pouch) | 40 | Cathode + anode | 600 | 85 |
| 2024 | 5.6 m KFSI/succinonitrile:H2O (2:1, n:n)392 |
Precycled KVPO4F | — | Precycled 3,4,9,10-perylene tetracarboxylic diimide | — | 3.2/0.0 | 2.0 | 1.5 (mass) | 500 mA g−1 (25 °C) | 50 (25 °C) | Cathode + anode | 10000 |
78 |
| 100 mA g−1 (0 °C) | 500 | 74 | |||||||||||
| 50 mA g−1 (−20 °C) | 46 (0 °C) | 500 | 70 | ||||||||||
| 1.7 (mass, pouch) | 40 (−20 °C) | ||||||||||||
| 150 mA g−1 (pouch, 25 °C) | 300 | 80 |
| Year | Electrolyte | pH | Viscosity (mPa s) | Ionic conductivity (mS cm−1) | Reduction stability | Oxidation stability | |||||||
|---|---|---|---|---|---|---|---|---|---|---|---|---|---|
| V vs. Ag/AgCl | V vs. Ag/AgCl | ||||||||||||
| LSV scan rate, mV s−1 | LSV scan rate, mV s−1 | ||||||||||||
| LSV cut-off condition, µm cm−2 | LSV cut-off condition, µm cm−2 | ||||||||||||
| Pt | Al | Ti | SUS | Pt | Al | Ti | SUS | Carbon | |||||
| 2018 | 21 m LiTFSI/H2O + 9.25 m LiTFSI/dimethylcarbonate364 | — | — | 1 | −2.24 V | 1.86 V | |||||||
| 5 mV s−1 | 5 mV s−1 | ||||||||||||
| 10 µm cm−2 | 10 µm cm−2 | ||||||||||||
| 2019 | 56 m LiClO4:methylsulfonylmethane:H2O (1:1.8:1, n:n:n)367 |
— | 148 | 3.7 | −1.4 V | 2.1 V | |||||||
| 0.2 mV s−1 | 0.2 mV s−1 | ||||||||||||
| 30 µm cm−2 | 30 µm cm−2 | ||||||||||||
| 2020 | 2 m LiTFSI/polyethylene glycol:H2O (94:6, w:w)368 |
— | — | 0.8 | (Carbon coated) | (Carbon coated) | |||||||
| −1.94 V | 1.26 V | ||||||||||||
| 0.2 mV s−1 | 0.2 mV s−1 | ||||||||||||
| 30000 µm g−1 |
30000 µm g−1 |
||||||||||||
| 2020 | 42 m LiTFSI/H2O + 21 m trimethylethylammonium·TFSI369 | — | 407 | 0.9 | −1.49 V | 1.76 V | |||||||
| 0.2 mV s−1 | 0.2 mV s−1 | ||||||||||||
| 50 µm cm−2 | 50 µm cm−2 | ||||||||||||
| 2020 | 15 m LiTFSI:tetraethylene glycol dimethyl ether:H2O (4:7:1, n:n:n)370 |
— | — | 0.6 | −2.64 V | 1.56 V | |||||||
| 5 mV s−1 | 5 mV s−1 | ||||||||||||
| 10 µm cm−2 | 10 µm cm−2 | ||||||||||||
| 2020 | 15.3 m LiTFSI/acetonitrile:H2O (1:1, n:n)372 |
— | — | 3 | −2.54 V | 1.96 V | |||||||
| 5 mV s−1 | 5 mV s−1 | ||||||||||||
| 50 µm cm−2 | 50 µm cm−2 | ||||||||||||
| 2020 | LiClO4:urea:H2O (1:2:3, n:n:n)373,380 |
— | 35 | 26 | −1.24 V | −1.6 V | 1.7 V | 1.3 V | |||||
| 0.05 mV s−1 | 0.1 mV s−1 | 0.1 mV s−1 | 0.1 mV s−1 | ||||||||||
| 500 µm cm−2 | 50 µm cm−2 | 500 µm cm−2 | 100 µm cm−2 | ||||||||||
| 2021 | 3.6 m LiTFSI/sulfolane:H2O (1:1, n:n)374 |
— | — | 2.5 | (Carbon coated) | (Carbon coated) | |||||||
| −1.94 V | 1.46 V | ||||||||||||
| 0.2 mV s−1 | 0.2 mV s−1 | ||||||||||||
| 30000 µm g−1 |
30000 µm g−1 |
||||||||||||
| 2021 | 33 m LiNO3/H2O + 10 wt% polyvinyl alcohol (vs. H2O)375 | — | 12000 |
0.25 | −1.25 V | 1.95 V | |||||||
| 1 mV s−1 | 1 mV s−1 | ||||||||||||
| 1000 µm cm−2 | 1000 µm cm−2 | ||||||||||||
| 2021 | 1.9 m LiTFSI/H2O:1,4-dioxane LiTFSI:H2O:1,4-dioxane (1:2.6:5.2, n:n:n)376 |
— | 17 | 8 | −1.5 V | 2.0 V | |||||||
| 0.1 mV s−1 | 0.1 mV s−1 | ||||||||||||
| 50 µm cm−2 | 50 µm cm−2 | ||||||||||||
| 2021 | 12.5 m LiNO3/1,5-pentanediol:H2O (1:1, w:w) + 6 wt% tetraethylene glycol dimethyl ether + 0.5 wt% 2-hydroxy-2-methylpropiophenone (polymerization)176 |
— | 52 | 0.16 | −1.0 V | 2.0 V | |||||||
| 0.1 mV s−1 | 0.1 mV s−1 | ||||||||||||
| 500 µm cm−2 | 500 µm cm−2 | ||||||||||||
| 12.5 m LiNO3/1,5-pentanediol:H2O (1:1, w:w)176 |
3.4 | 22 | 0.23 | −1.0 V | 1.9 V | ||||||||
| 0.1 mV s−1 | 0.1 mV s−1 | ||||||||||||
| 500 µm cm−2 | 500 µm cm−2 | ||||||||||||
| 10.5 m LiTFSI/ethylene carbonate:H2O (1:1, w:w)176 |
3.9 | — | — | −0.5 V | 1.8 V | ||||||||
| 0.1 mV s−1 | 0.1 mV s−1 | ||||||||||||
| 500 µm cm−2 | 500 µm cm−2 | ||||||||||||
| 12.5 m LiNO3/ethylene carbonate:H2O (1:1, w:w)176 |
3.6 | — | — | −0.8 V | 1.9 V | ||||||||
| 0.1 mV s−1 | 0.1 mV s−1 | ||||||||||||
| 500 µm cm−2 | 500 µm cm−2 | ||||||||||||
| 2021 | 40 m LiTFSI/H2O + 20 m 1-ethyl-3-methylimidazolium·TFSI175 | 6 | 293 | 1.2 | −1.94 V | 1.46 V | |||||||
| 1 mV s−1 | 1 mV s−1 | ||||||||||||
| 2 µm cm−2 | 2 µm cm−2 | ||||||||||||
| 40 m LiTFSI/H2O + 20 m 1-ethyl-3-methylimidazolium·OTf175 | 7 | 302 | 1.4 | −2.44 V | 0.76 V | ||||||||
| 1 mV s−1 | 1 mV s−1 | ||||||||||||
| 2 µm cm−2 | 2 µm cm−2 | ||||||||||||
| 2022 | 21 m LiTFSI/H2O + 5 mol% acrylamide378 | — | 45 | 10 | −1.34 V | 1.66 V | |||||||
| 10 mV s−1 | 10 mV s−1 | ||||||||||||
| 200 µm cm−2 | 10 µm cm−2 | ||||||||||||
| 2022 | 4.5 m LiTFSI + 0.1 m KOH/[urea:H2O (8.6:1, v:v)]381 |
— | 320 | 1 | −1.74 V | 1.56 V | 1.0–1.6 V | ||||||
| 0.2 mV s−1 | 0.2 mV s−1 | 1 mV s−1 | |||||||||||
| 200 µm cm−2 | 50 µm cm−2 | 50 µm cm−2 | |||||||||||
| 2022 | LiTFSI/methylurea:H2O (1:2.7, n:n)382 |
— | 646 | 3.2 | (Carbon coated) | (Carbon coated) | |||||||
| −2.74 V | 1.76 V | ||||||||||||
| 5 mV s−1 | 5 mV s−1 | ||||||||||||
| 50 µm cm−2 | 50 µm cm−2 | ||||||||||||
| 2022 | LiFSI:1-methyl-1-propylpiperidinium bis(fluorosulfonyl) imide:H2O (1:4:1, n:n:n)383 |
— | — | 2.9 | −2.44 V | 2.46 V | |||||||
| 5 mV s−1 | 5 mV s−1 | ||||||||||||
| 2 µm cm−2 | 5 µm cm−2 | ||||||||||||
| Year | Electrolyte | pH | Viscosity (mPa s) | Ionic conductivity (mS cm−1) | Reduction stability | Oxidation stability | ||||||||
|---|---|---|---|---|---|---|---|---|---|---|---|---|---|---|
| V vs. Ag/AgCl | V vs. Ag/AgCl | |||||||||||||
| LSV scan rate, mV s−1 | LSV scan rate, mV s−1 | |||||||||||||
| LSV cut-off condition, µm cm−2 | LSV cut-off condition, µm cm−2 | |||||||||||||
| Pt | Al | Au | Ti | SUS | Pt | Al | Au | Ti | SUS | |||||
| 2020 | NaClO4:H2O:urea:![[thin space (1/6-em)]](https://www.rsc.org/images/entities/i_char_2009.gif) N,N-dimethylformamide (1:2:2:1, n:n:n:n)386 N,N-dimethylformamide (1:2:2:1, n:n:n:n)386 |
— | — | 9 | −1.4 V | 1.4 V | ||||||||
| 1 mV s−1 | 1 mV s−1 | |||||||||||||
| 150 µm cm−2 | 150 µm cm−2 | |||||||||||||
| 2021 | 2 m NaClO4/H2O + dimethyl sulfoxide (H2O:dimethyl sulfoxide = 1:1, n:n)387 |
— | — | — | −1.6 V | 1.5 V | ||||||||
| 10 mV s−1 | 10 mV s−1 | |||||||||||||
| 1500 µm cm−2 | 1500 µm cm−2 | |||||||||||||
| Year | Electrolyte | pH | Viscosity (mPa s) | Ionic conductivity (mS cm−1) | Reduction stability | Oxidation stability | ||||||||
|---|---|---|---|---|---|---|---|---|---|---|---|---|---|---|
| V vs. Ag/AgCl (sat. KCl) | V vs. Ag/AgCl (sat. KCl) | |||||||||||||
| LSV scan rate, mV s−1 | LSV scan rate, mV s−1 | |||||||||||||
| LSV cut-off condition, µm cm−2 | LSV cut-off condition, µm cm−2 | |||||||||||||
| Pt | Al | Ti | SUS | Carbon | Pt | Al | Ti | SUS | Carbon | |||||
| 2020 | 20 m KOAc/H2O + 2 wt% Na-carboxymethyl cellulose187 | 9.5 | 3275 | 4.3 | −1.6 V | >4 V | ||||||||
| 0.5 mV s−1 | 0.5 mV s−1 | |||||||||||||
| 10 µm cm−2 | 10 µm cm−2 | |||||||||||||
| 2021 | 2 m KFSI/N,N-dimethylformamide:H2O (1:1, n:n)390 |
— | 25 | 3 | −1.2 V | 1.7 V | ||||||||
| 10 mV s−1 | 10 mV s−1 | |||||||||||||
| 10 µm cm−2 | 10 µm cm−2 | |||||||||||||
| 2023 | KOTf:trimethyl phosphate:H2O (12:56:32, n:n:n)391 |
— | 45 | 8 | −1.8 V | 1.6 V | ||||||||
| 5 mV s−1 | 5 mV s−1 | |||||||||||||
| 10 µm cm−2 | 10 µm cm−2 | |||||||||||||
| 2024 | 5.6 m KFSI/succinonitrile:H2O (2:1, n:n)392 |
— | 10 | 22 | −1.9 V | 2.1 V | ||||||||
| 1 mV s−1 | 1 mV s−1 | |||||||||||||
| 30 µm cm−2 | 30 µm cm−2 | |||||||||||||
Since 2018, various developments in hybrid aqueous/nonaqueous electrolytes have been achieved from diverse perspectives (Fig. 41). For example, (i) solvents that strongly solvate carrier ions (e.g., dimethyl carbonate,364 tetraethylene glycol dimethyl ether,370 glymes,393–395 acetonitrile,372 dimethyl sulfoxide,396–399 1,3-dioxolane379) have been integrated to limit the approach of water to the electrode surface. Moreover, to lower the water activity in the electrolyte, (ii) weakly solvating solvents (e.g., 1,5-pentanediol,176 1,4-dioxane376,400), modifying the solution structure similar to that of locally salt-concentrated nonaqueous electrolytes; (iii) hydrogen-bond-anchoring solvents (e.g., propylene carbonate,401 sulfolane,374,402 organic phosphates,391,403–408 dimethylacetamide409–412), disrupting hydrogen bonds between water molecules; (iv) deep eutectic solvents (e.g., methylsulfonylmethane,367,413 urea,373,380,381,414–416 methylurea382), providing a lower melting point compared to that of each electrolyte component and possessing functional groups that can serve as both donors and acceptors, thus breaking hydrogen bonds between water molecules; (v) molecular crowding agents (e.g., polyethylene glycol,368,417,418 polyethylene glycol dimethyl ether377); and (vi) ionic liquids (e.g., trimethylethylammonium·TFSI,369 1-ethyl-3-ethylimidazolium·TFSI,175 1-ethyl-3-ethylimidazolium·OTf,175 1-methyl-1-propylpiperidinium·FSI383), offering nonflammability, high-temperature stability, and low vapor pressure, have been introduced. These hybrid aqueous/nonaqueous electrolytes have enabled the reversible cycling of 2 V-class batteries such as LiMn2O4|Li4Ti5O12 and LiMn2O4|Mo6S8 for hundreds of cycles (Table 8). These examples include cases where the carrier ion is an alkali ion (Li+, Na+, and K+) and Zn2+.362,419
 | ||
| Fig. 41 Schematic comparison of the solution structures of aqueous and hybrid aqueous/nonaqueous electrolytes using diverse strategies. | ||
Hybrid aqueous/nonaqueous electrolytes also help improve the wide-temperature-range performance of aqueous batteries. In 2019, Xing et al. developed a 15.3 m LiTFSI/acetonitrile:H2O (1:1, n) electrolyte by incorporating acetonitrile, which has a low freezing point (−48 °C) and low viscosity.188 This electrolyte remained non-crystallized even at −20 °C, providing an ion conductivity of 0.6 mS cm−1. Moreover, the robust SEI, which included nitrile (C![[triple bond, length as m-dash]](https://www.rsc.org/images/entities/char_e002.gif) N) and sulfamide (R–S–N–S) species resulting from the reduction of acetonitrile, enhanced the reduction stability of the electrolyte. Consequently, the stable operation of 2 V-class full cells consisting of LiMn2O4 or LiNi0.8Co0.15Al0.05O2 cathodes and Li4Ti5O12 anodes for hundreds of cycles was achieved at 25 and 0 °C. In 2022, Ma et al. introduced 1,3-dioxolane, which has an even lower freezing point (−95 °C) than acetonitrile, into an aqueous electrolyte.379 By employing the developed LiTFSI:1,3-dioxolane:H2O (1:1.08:1.08, n:n:n) electrolyte, high cycling performance of the 2 V-class LiMn2O4|Li4Ti5O12 full cells was achieved, with a capacity retention of 94% after 100 cycles at a low C-rate (0.5C) and low temperature (−20 °C). However, these hybrid aqueous/nonaqueous electrolytes still exhibited higher viscosity compared to nonaqueous electrolytes.
N) and sulfamide (R–S–N–S) species resulting from the reduction of acetonitrile, enhanced the reduction stability of the electrolyte. Consequently, the stable operation of 2 V-class full cells consisting of LiMn2O4 or LiNi0.8Co0.15Al0.05O2 cathodes and Li4Ti5O12 anodes for hundreds of cycles was achieved at 25 and 0 °C. In 2022, Ma et al. introduced 1,3-dioxolane, which has an even lower freezing point (−95 °C) than acetonitrile, into an aqueous electrolyte.379 By employing the developed LiTFSI:1,3-dioxolane:H2O (1:1.08:1.08, n:n:n) electrolyte, high cycling performance of the 2 V-class LiMn2O4|Li4Ti5O12 full cells was achieved, with a capacity retention of 94% after 100 cycles at a low C-rate (0.5C) and low temperature (−20 °C). However, these hybrid aqueous/nonaqueous electrolytes still exhibited higher viscosity compared to nonaqueous electrolytes.
Gas-assisted SEI formation technology was developed to tackle this challenge, as depicted in Fig. 42. In 2022, Suo and Xu's group prepared 5.0 m LiTFSI/H2O electrolytes saturated with air, O2, Ar, and CO2 gases.420 They observed that Li2CO3 formation was accelerated in the electrolyte saturated with CO2 gas, effectively passivating the anode surface. By utilizing this electrolyte (5 m LiTFSI/H2O + sat. CO2 gas), stable LiMn2O4|Mo6S8 full cells were achieved, offering a capacity retention of over 90% after 100 cycles at both 25 and −40 °C at a low constant current of 0.5C.
 | ||
| Fig. 42 (a)–(c) Electrochemical performance of an aqueous LiMn2O4|Mo6S8 full cell in 5 m LiTFSI/H2O saturated by various gases, and (d) the schematic of the SEI formation mechanism in a 5 m LiTFSI/H2O + sat. CO2 electrolyte.420 Reprinted with permission from Nature Chemistry. | ||
While there has been some progress in overcoming low-temperature limitations, the issue of electrolyte decomposition at high temperatures remains a significant challenge. Most organic solvents are prone to hydrolysis, a vulnerability that is exacerbated under non-neutral pH conditions and elevated temperatures. Moreover, it is important to recognize that although the development of hybrid aqueous/nonaqueous electrolytes with various types of organic solvents and salts has improved the cycling performance of batteries, this enhancement has not sufficed to increase the battery energy density, particularly in terms of the output voltage. The batteries tested with these hybrid electrolytes mostly operated within the 2 V-class range, significantly lagging behind the 4 V-class typical of nonaqueous batteries. This notable difference is primarily due to the poor reduction stability of the electrolyte, which necessitates the selection of anode active materials with higher reaction potentials. Indeed, since 2016, when Li4Ti5O12 was first introduced as an anode material in aqueous batteries, there has been negligible progress in employing anode materials that offer lower potentials than the reaction potentials of 1.5–1.6 V vs. Li/Li+ (Tables 1 and 8).
Addressing these challenges requires a deeper understanding of the solution structure of electrolytes at a molecular level, which is particularly challenging in aqueous and hybrid aqueous/nonaqueous electrolytes. Techniques such as Raman and Fourier transform infrared spectroscopy are frequently utilized to estimate the solution structure of nonaqueous electrolytes, as demonstrated in Fig. 43.421,422 For example, when the FSI− anion forms a solvent-separated ion pair with aprotic solvents—indicating weak interactions—the corresponding Raman peak for the S–N–S vibration appears at ∼720 cm−1. As the interaction between the Lewis acidic carrier ion and the FSI− anion strengthens, leading to ion pairing, the Raman peak shifts to higher wavenumbers: 725–735 cm−1 for a contact ion pair and further to 745–760 cm−1 for an ion-pair aggregate. This technique helps trace the interactions between the anion and the molecules in the electrolyte, indirectly determining the ligands of the carrier ion based on the assumption that the anion interacts weakly with the aprotic solvent.
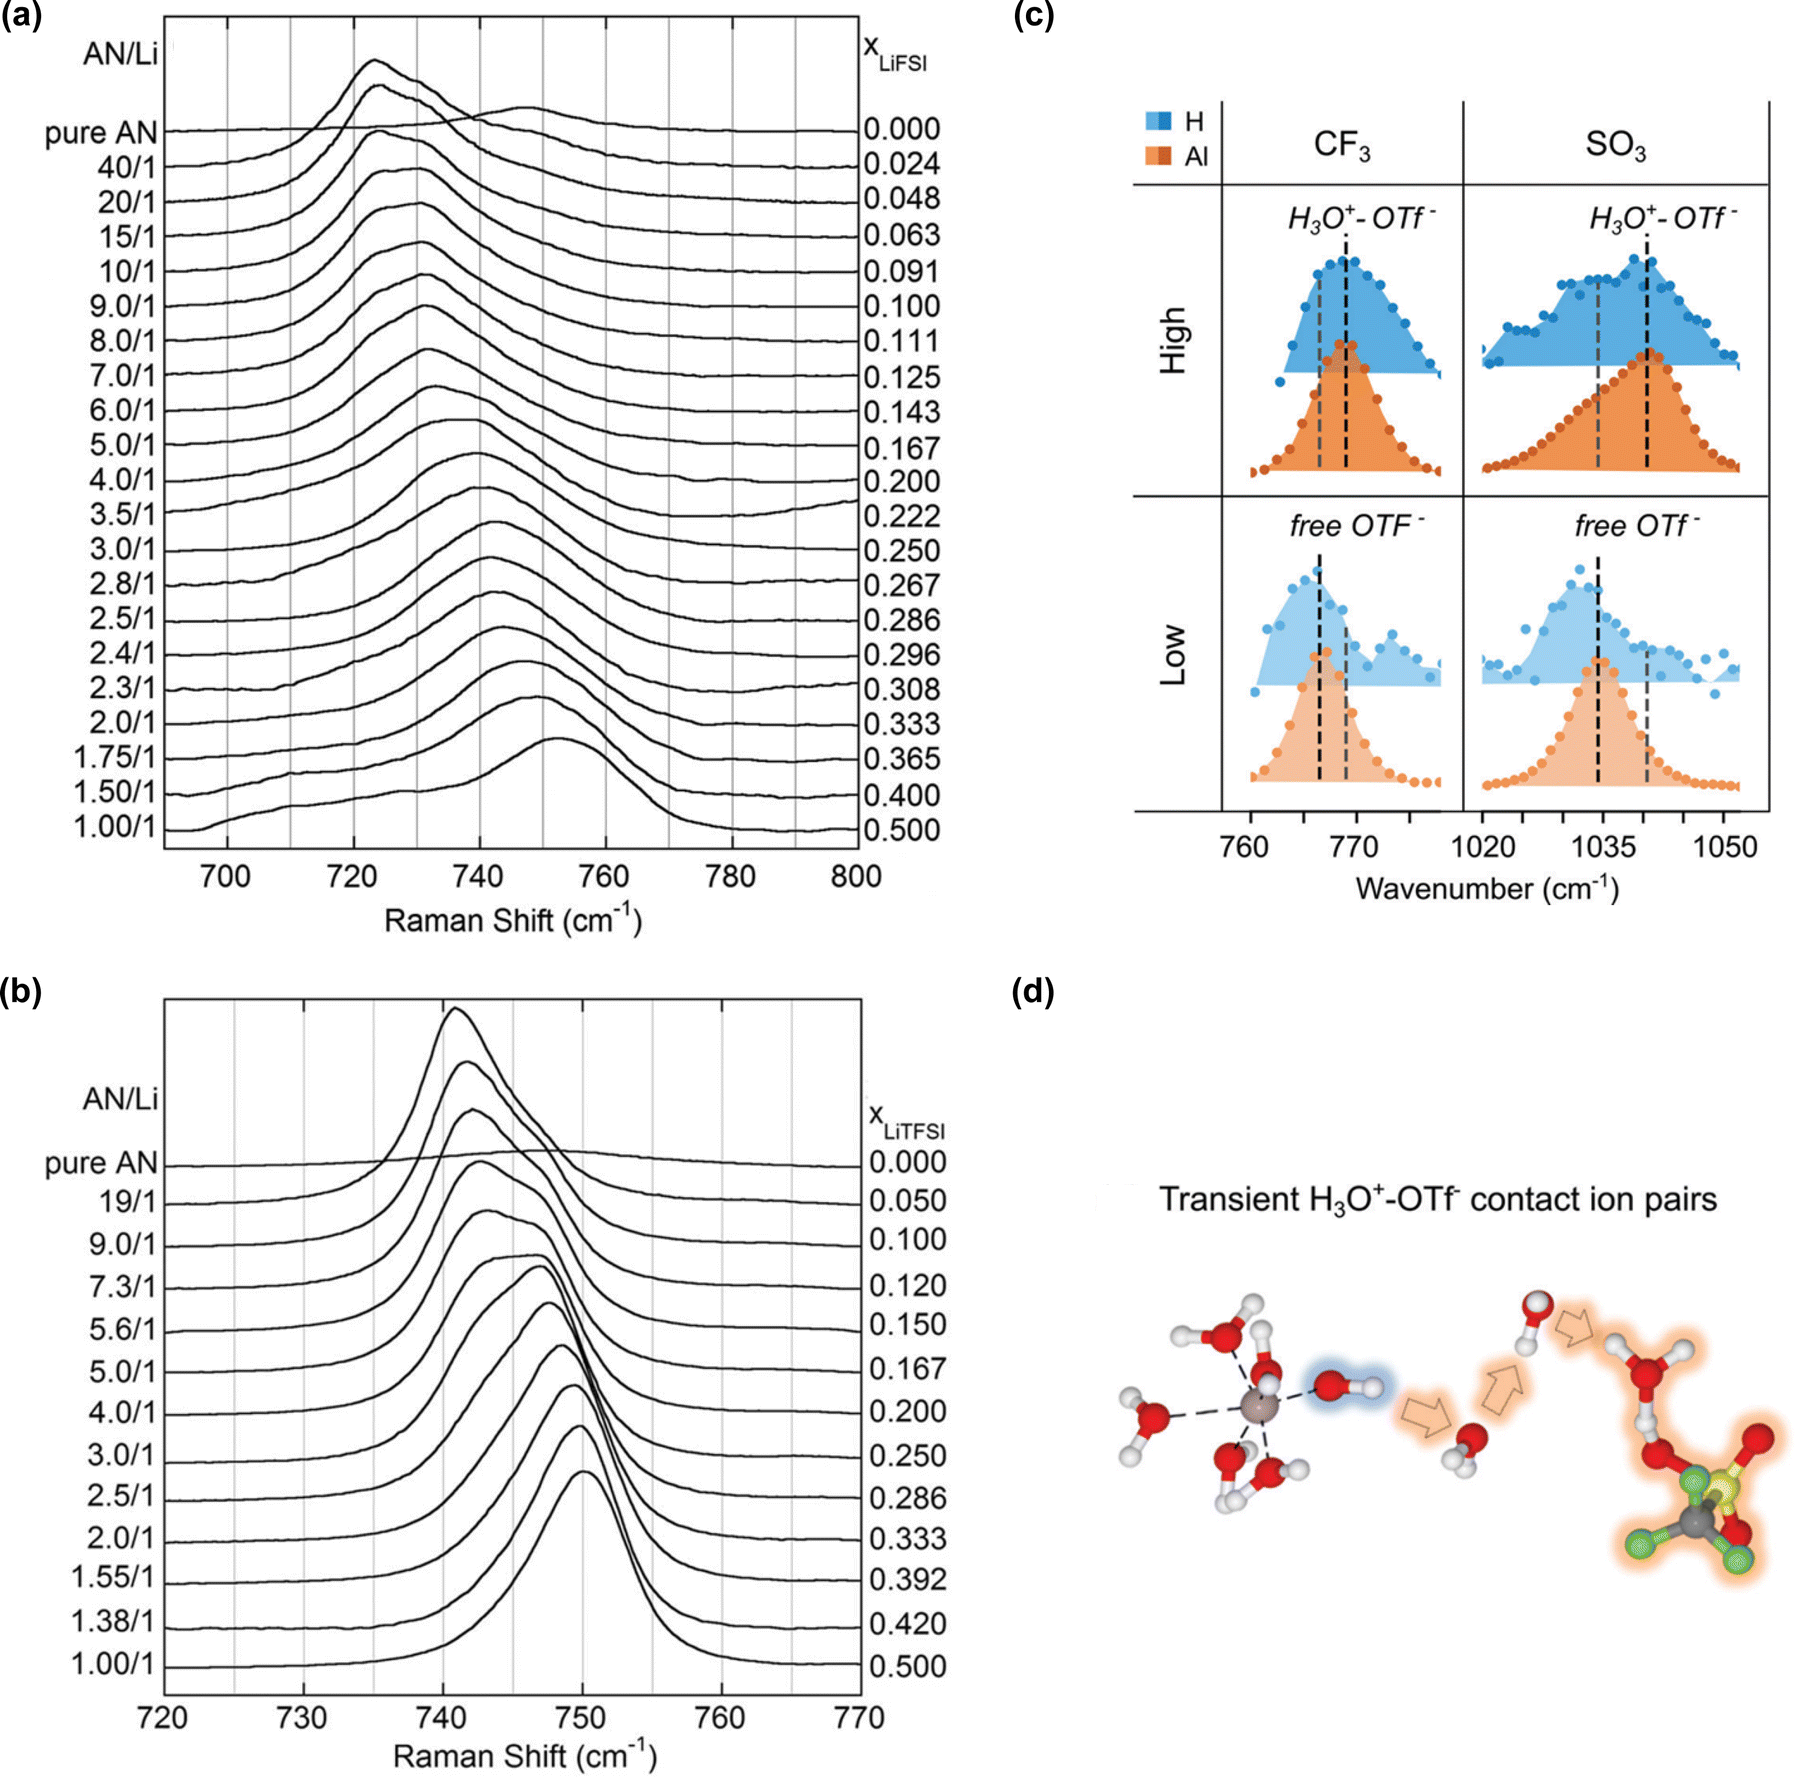 | ||
| Fig. 43 Representative Raman spectra of (a) FSI−421 and (b) TFSI− anions423 in nonaqueous electrolytes, illustrating variational bands of the anion in LiFSI/acetonitrile and LiTFSI/acetonitrile electrolytes. (c) Raman spectra of CF3 and SO3 vibrational bands in Al(OTf)3 and HOTf solutions at different salt concentrations, labelled “low” and “high” in the figure.424 (d) Schematic of H3O+–OTf− ion pairing.424 Reprinted with permission from Journal of The Electrochemical Society (a) and (b) and Energy & Environmental Science (c) and (d). | ||
However, these spectroscopic techniques are less effective for aqueous and hybrid aqueous/nonaqueous electrolytes. For the TFSI− anion, the Raman shift corresponding to the transformation of the solvent-separated ion pair to ion-pair aggregate was only ∼10 cm−1, ranging from 740 to 750 cm−1, thus requiring high-resolution spectroscopy measurements, as illustrated in Fig. 43.423,425 Additionally, water, being a highly protic solvent with a high dielectric constant (78 at 25 °C)426 and a high acceptor number (AN = 55),427,428 strongly coordinates with the anion. This implies that even when the anion is surrounded by water molecules (i.e., solvent-separated ion pair), their interactions are sufficiently strong to cause a shift in the Raman spectra. Considering that the Lewis acidic carrier ion and protic water compete to coordinate with the anion and that the electrolyte pH influences the Raman spectra, identifying the ligands of the carrier ion becomes significantly more complex (Fig. 43).424 Moreover, highly salt-concentrated aqueous electrolytes and hybrid aqueous/nonaqueous electrolytes typically contain only a small amount of water—less than 10 wt% relative to the salts and co-solvents—making it difficult to detect the O–H vibrational changes in water. This poses additional challenges in understanding the hydrogen bonding and clustering of water molecules in these electrolytes.
7. Substantial challenges with aqueous Zn-metal batteries
Aqueous rechargeable Zn-metal batteries, employing Zn-metal anodes, are emerging as promising candidates for next-generation energy storage systems, offering cost efficiency, environmental advantages, and safety, as shown in Fig. 44. Zn metal offers a high theoretical capacity (820 mA h g−1, 5855 mA h cm−3), has abundant availability, and is almost non-reactive with water. The mild reduction potential of Zn/Zn2+ (−0.76 V vs. SHE), closely aligned with the HER potential, further underscores its suitability for aqueous rechargeable batteries. Research on aqueous Zn-metal batteries is primarily driven by the hope that such batteries can overcome the constraints associated with Li+ and other carrier ion-based batteries. However, recent studies have revealed critical misunderstandings in the intercalation chemistry of Zn cathode active materials in aqueous electrolytes.429–431 Moreover, the thermodynamic and kinetic limitations in suppressing electrochemical and chemical side reactions during Zn plating and stripping, which lead to significant consumption of the electrolyte and Zn resources and is accompanied by the irreversible formation of byproducts, present substantial challenges for the development of high-performance aqueous Zn-metal batteries. The following sections will delve into common misunderstandings and overlooked aspects of aqueous Zn-metal batteries. | ||
| Fig. 44 (a) Advantages of aqueous Zn-metal batteries. (b) and (c) Number and proportion of research publications on aqueous Zn-metal batteries from 2011 to 2022.432 Reprinted with permission from Advanced Functional Materials. | ||
7.1. Complex intercalation chemistry of Zn cathode active materials
The type of cathode active material significantly influences the energy density of aqueous Zn-metal batteries. Extensive research has been conducted to explore high-capacity and high-potential Zn2+-intercalation cathode active materials, as outlined in Table 11. However, a misunderstanding of the intercalation chemistry and unreasonable design concepts have misdirected research efforts and material development. While initial assumptions based on the small radius of Zn2+ (∼0.9 Å) suggested that it should facilitate solid-state transport and storage,433 its high charge density results in strong interactions with lattice oxide ions in the active materials. This makes solid-state transport much more challenging than for monovalent ions, as depicted in Fig. 45.434–437 Moreover, most proposed Zn cathode active materials have been evaluated under extremely high C-rates, and their electrochemical properties, as detailed in Table 11, are considered to be primarily derived from the intercalation of protons and/or water-coordinated Zn2+ rather than pure (desolvated) Zn2+.430,438–443 The issue is that proton and water co-intercalation increase the complexity of active material and cell design, leading to unexpected electrochemical reactions. For instance, the increased electrolyte pH due to proton intercalation, which occurs even under nearly neutral conditions, damages the cathode active materials and leads to the formation/precipitation of byproducts (e.g., Zn(OH)2 and Zn(anion)x(OH)y) on the Zn-metal anode surface.444 Additionally, water co-intercalation causes significant volume changes in the cathode active materials during charge and discharge processes, thereby reducing their structural integrity. This section will introduce the representative cathode active materials tested in aqueous Zn-metal batteries, highlighting their structural features, intercalation chemistry, and practical feasibility. As we demonstrated in Section 1, “M” and “m” were used interchangeably in several papers. Further, these expressions were quoted directly without any corrections, despite the fact that “M” (molarity, mol L−1) specifies the amount of salt per unit volume of a solution (electrolyte), while “m” (molality, mol kg−1) denotes the concentration of salt dissolved in 1 kg of a solvent.| Year | Electrolyte | Cathode | Cathode L/L (mg cm−2) | Anode | Anode L/L (mg cm−2) | Full cell cutoff (V/V) | Full cell average (V) | N/P ratio | C-rate | Capacity (mA h g−1) | Capacity calculation based | Cycle number (—) | Retention ratio (%) |
|---|---|---|---|---|---|---|---|---|---|---|---|---|---|
| 2012 | 0.1 M Zn(NO3)2/H2O (pH 5.2)445 | α-MnO2 | — | Zn foil | — | 1.9/1.0 | 1.3 | — | 6C | 132 | Cathode | 100 | 74 |
| 2013 | 1 M ZnSO4/H2O446 | Todorokite-type-MnO2 or α-MnO2 | 50 | Zn foil | 10 µm | 2.0/0.7 | 1.4 or 1.3 | — | 50 mA g−1 | 108 (todorokite-type-MnO2) | Cathode | 50 | 83 |
| 227 (α-MnO2) | 50 | 56 | |||||||||||
| 2014 | 1 M ZnSO4/H2O447 | α-MnO2 | 5 | Zn foil | — | 2.0/0.7 | 1.3 | — | 0.2C | 205 | Cathode | 30 | 63 |
| 2014 | 0.5 M Zn(OAc)2 + 0.5 M NaOAc/H2O448 | Na0.95MnO2 | — | Zn foil | — | 2.0/1.0 | 1.4 | — | 4C | 40 | Cathode | 1000 | 92 |
| 2014 | 2 M ZnSO4/H2O449 | Mn3O4 | — | Zn foil | — | 1.9/0.8 | 1.3 | — | 500 mA g−1 | 147 | Cathode | 300 | 72 |
| 2015 | 1 M ZnSO4/H2O (pH 4)450 | γ-MnO2 | — | Zn foil | — | 1.8/0.8 | 1.3 | — | 0.5 mA cm−2 | 250 | Cathode | 40 | 63 |
| 2016 | 2 M ZnSO4 + 0.1 M MnSO4/H2O451 | α-MnO2 | 1–5 | Zn foil | — | 1.8/1.0 | 1.4 | — | 5C | 161 | Cathode | 5000 | 92 |
| 2016 | 1–4 M Zn(OTf)2/H2O452 | ZnMn2O4 | 2 | Zn foil | — | 1.9/0.8 | 1.4 | — | 500 mA g−1 | 90 | Cathode | 500 | 94 |
| 2017 | 2 M ZnSO4 + 0.1 M MnSO4/H2O453 | Mn2O3 | — | Zn foil | — | 1.9/1.0 | 1.4 | — | 2000 mA g−1 | 89 | Cathode | 2000 | 49 |
| 2017 | 3 M LiCl + 2 M ZnCl2 + 0.4 M MnSO4/H2O + lignocellulose + poly(vinyl alcohol)454 | Poly(3,4-ethylenedioxy thiophene) coated MnO2 | — | Zn foil | — | 1.8/1.0 | 1.3 | — | 1860 mA g−1 | 150 | Cathode | 300 | 78 |
| 2017 | 2 M ZnSO4 + 0.2 M MnSO4/H2O455 | α-MnO2/carbon fiber | — | Zn foil | — | 1.8/1.0 | 1.3 | — | 1.3C | 260 | Cathode | 300 | 58 |
| 6.5C | 70 | 10000 |
71 | ||||||||||
| 2017 | 3 M Zn(OTf)2 + 0.1 M Mn(OTf)2/H2O456 | β-MnO2 | 2 | Zn foil | — | 1.9/0.8 | 1.2 | — | 0.65C | 258 | Cathode | 100 | 87 |
| 6.5C | 151 | 2000 | 94 | ||||||||||
| 2018 | Polyacrylamide polymer soaked in 2 M ZnSO4 + 0.1 M MnSO4/H2O457 | α-MnO2 | 2.5–5 | Zn/carbon nanotube | 7–10 | 1.85/0.8 | 1.3 | — | 2000 mA g−1 | 103 | Cathode | 500 | 98.5 |
| 2018 | 2 M ZnSO4 + 0.2 M MnSO4/H2O458 | Graphene coated α-MnO2 | — | Zn foil | — | 1.85/1.0 | 1.4 | — | 300 mA g−1 | 382 (300 mA g−1) | Cathode | 100 | 95 |
| 1000 mA g−1 | 166 (3000 mA g−1) | 100 | 100 | ||||||||||
| 3000 mA g−1 | 3000 | 94 | |||||||||||
| 2018 | 1 M ZnSO4 + 0.1 M MnSO4/H2O459 | MgMn2O4 | 3–3.5 | Zn foil | — | 1.9/0.5 | 1.5 | — | 50 mA g−1 | 120 | Cathode | 500 | 80 |
| 2018 | 2 M ZnSO4 + 0.1 M MnSO4/H2O460 | Mn3O4 | — | Zn foil | — | 1.8/1.0 | 1.4 | — | 500 mA g−1 | 239 | Cathode | 500 | 82 |
| 2017 | 1 M ZnSO4/H2O (pH 4)461 | LiV3O8 | — | Zn foil | — | 1.2/0.6 | 0.8 | — | 133 mA g−1 | 188 | Cathode | 65 | 75 |
| 2017 | 1 M Zn(OTf)2 + 21 m LiTFSI/H2O462 | V2O5 | — | Zn foil | — | 1.6/0.2 | 1.0 | — | 100 mA g−1 | 215 (100 mA g−1) | Cathode | 160 | 95 |
| 500 mA g−1 | 137 (2000 mA g−1) | 240 | 85 | ||||||||||
| 2000 mA g−1 | 2000 | 80 | |||||||||||
| 2018 | 3 M Zn(OTf)2/H2O443 | V2O5·nH2O/graphene | 2.5 | Zn foil | — | 1.5/0.3 | 0.8 | — | 6000 mA g−1 | ∼290 | Cathode | 900 | 71 |
| 2018 | 3 M Zn(OTf)2/H2O463 | V2O5 | 2–10 | Zn foil | — | 1.6/0.2 | 0.7 | — | 200 mA g−1 | 470 | Cathode | 100 | 100 |
| 500 mA g−1 | 465 | 100 | 100 | ||||||||||
| 1000 mA g−1 | 455 | 100 | 100 | ||||||||||
| 5000 mA g−1 | 408 | 4000 | 91 | ||||||||||
| 2018 | 3 M ZnSO4 or 3 M ZnCl2 or 3 M Zn(OAc)2 or 3 M Zn(NO3)2/H2O464 | V2O5 | — | Zn foil | — | 1.4/0.4 | 0.7 | — | 100 mA g−1 | 224 | Cathode | 30 | 81 |
| 1000 mA g−1 | 121 | 400 | 99 | ||||||||||
| 2000 mA g−1 | 113 | 400 | 100 | ||||||||||
| 2018 | 3 M Zn(OTf)2/H2O465 | V10O24·12H2O | — | Zn foil | — | 1.7/0.7 | 1.0 | — | 500 mA g−1 | 135 (500 mA g−1) | Cathode | 200 | 83 |
| 5000 mA g−1 | 1000 | 81 | |||||||||||
| 10000 mA g−1 |
3000 | 80 | |||||||||||
| 2018 | 2 M ZnSO4/H2O466 | LixV2O5·nH2O | ∼2.8 | Zn foil | — | 1.4/0.4 | 0.7 | — | 1000 mA g−1 | 408 (1000 mA g−1) | Cathode | 50 | 68 |
| 5000 mA g−1 | 304 (5000 mA g−1) | 500 | 76 | ||||||||||
| 10000 mA g−1 |
1000 | 62 | |||||||||||
| 2018 | 3 M Zn(OTf)2/H2O467 | Na0.33V2O5 | — | Zn foil | — | 1.6/0.2 | 0.6 | — | 200 mA g−1 | 277 | Cathode | 100 | 91 |
| 1000 mA g−1 | 235 | 1000 | 93 | ||||||||||
| 2018 | 1 M ZnSO4/H2O468 | Na2V6O16·3H2O | 3–3.5 | Zn foil | — | 1.4/0.4 | 0.8 | — | 5C | ∼305 | Cathode | 400 | 80 |
| 15C | ∼242 | 300 | 94 | ||||||||||
| 40C | ∼154 | 1000 | 83 | ||||||||||
| 2018 | 3 M Zn(OTf)2/H2O469 | Mg0.34V2O5·0.84H2O | 5–7 | Zn foil | — | 1.8/0.1 | 0.8 | — | 100 mA g−1 | 330 | Cathode | 200 | 100 |
| 1000 mA g−1 | 264 | 1000 | 95 | ||||||||||
| 5000 mA g−1 | 81 | 5000 | 97 | ||||||||||
| 2018 | 3 M Zn(OTf)2/H2O (pH 4)470 | NH4V4O10 | 2 | Zn foil | — | 1.7/0.8 | 1.0 | — | 200 mA g−1 | 126 | Cathode | 200 | 98 |
| 2000 mA g−1 | 72 | 5000 | 70 | ||||||||||
| 2018 | 2 M ZnSO4/H2O471 | (NH4)2V10O25·8H2O | — | Zn foil | — | 1.7/0.7 | 1.0 | — | 100 mA g−1 | 229 | Cathode | 100 | 95 |
| 500 mA g−1 | 196 | 1000 | 94 | ||||||||||
| 5000 mA g−1 | 124 | 5000 | 90 | ||||||||||
| 2019 | 1 M ZnSO4/H2O472 | VO2 | — | Zn foil | — | 1.2/0.2 | 0.6 | — | 50 mA g−1 | 326 | Cathode | 100 | 85 |
| 3000 mA g−1 | 97 | 5000 | 86 | ||||||||||
| 2019 | 1 M ZnSO4/H2O473 | VO2 | — | Zn foil | — | 1.3/0.2 | 0.6 | — | 4.5C (1000 mA g−1) | 353 | Cathode | 844 | 66 |
| 9C (2000 mA g−1) | 306 | 565 | 76 | ||||||||||
| 13C (3000 mA g−1) | 272 | 945 | 76 | ||||||||||
| 2019 | 3 M ZnSO4/H2O474 | VO2 (D) | 1.2–1.5 | Zn foil | — | 1.5/0.2 | 0.8 | — | 3000 mA g−1 | 380 | Cathode | 1200 | 78 |
| 10000 mA g−1 |
292 | 30000 |
30 | ||||||||||
| 15000 mA g−1 |
228 | 20000 |
51 | ||||||||||
| 2019 | 3 M Zn(OTf)2/H2O475 | V2O3 | — | Zn foil | — | 1.5/0.3 | 0.7 | — | 100 mA g−1 | 350 (100 mA g−1) | Cathode | 100 | 77 |
| 5000 mA g−1 | 4000 | 90 | |||||||||||
| 2019 | 2 M ZnSO4/H2O476 | V2O5 | 3 | Zn foil | — | 1.6/0.2 | 0.7 | — | 1000 mA g−1 | 341 | Cathode | 100 | 98 |
| 10000 mA g−1 |
219 | 500 | 77 | ||||||||||
| 2019 | 3 M Zn(OTf)2/H2O477 | V2O5 | 2 | Zn foil | — | 1.5/0.5 | 0.9 | — | 2C | 205 | Cathode | 500 | 81 |
| 2019 | 3 M Zn(OTf)2/H2O478 | V6O13·nH2O | 7.2 | Zn foil | — | 1.4/0.2 | 0.7 | — | 5000 mA g−1 | 300 | Cathode | 1000 | 87 |
| 2019 | 2 M ZnSO4/H2O429 | V10O24·12H2O | — | Zn foil | — | 1.5/0.5 | 0.9 | — | 1000 mA g−1 | 200 | Cathode | 3000 | 58 |
| 2019 | 3 M Zn(OTf)2/H2O479 | Al doped V10O24·12H2O | 1.8 | Zn foil | — | 1.6/0.3 | 0.9 | — | 1000 mA g−1 | 355 | Cathode | 300 | 89 |
| 5000 mA g−1 | 307 | 3000 | 98 | ||||||||||
| 2019 | 3 M Zn(OTf)2/H2O480 | V3O7·nH2O | 1–2 | Zn foil | — | 1.7/0.05 | 0.7 | — | 1000 mA g−1 | 365 | Cathode | 300 | 82 |
| 5000 mA g−1 | 172 | 1000 | 85 | ||||||||||
| 2019 | 1 M Zn(OTf)2 + 21 m LiTFSI/H2O481 | V2O5·nH2O/V3O7·nH2O | — | Zn foil | — | 1.6/0.4 | 0.7 | — | 500 mA g−1 | 250 | Cathode | 1200 | 80 |
| 2019 | 3 M Zn(OTf)2/H2O482 | V5O12·6H2O | 4.5 | Zn foil | — | 1.6/0.2 | 0.7 | — | 500 mA g−1 | 356 | Cathode | 100 | 97 |
| 2000 mA g−1 | 297 | 1000 | 94 | ||||||||||
| 2019 | 3 M Zn(ClO4)2/H2O483 | V5O12·6H2O/graphene oxide | 1.1 | Zn foil | — | 1.6/0.2 | 0.7 | — | 5000 mA g−1 | 347 (5000 mA g−1) | Cathode | 3500 | 97 |
| 10000 mA g−1 |
10000 |
85 | |||||||||||
| 2019 | 3 M Zn(OTf)2/H2O484 | V6O13 | 1.0–1.5 | Zn foil | — | 1.5/0.2 | 0.7 | — | 4000 mA g−1 | 250 | Cathode | 2000 | 92 |
| 2019 | 3 M ZnSO4/H2O485 | V6O13 | — | Zn foil | — | 1.4/0.3 | 0.7 | — | 5000 mA g−1 | 345 | Cathode | 1000 | 86 |
| 10000 mA g−1 |
275 | 3000 | 75 | ||||||||||
| 2019 | 1 M ZnSO4·7H2O + 0.2 M Na2SO4/H2O486 | Na2V6O12·2.14H2O | 1.5 | Zn foil | — | 1.6/0.2 | 0.8 | — | 5000 mA g−1 | 250 | Cathode | 500 | 84 |
| 20000 mA g−1 |
145 | 2000 | 90 | ||||||||||
| 2019 | 3 M Zn(OTf)2/H2O487 | Ca0.67V8O20·3.5H2O | 0.8 | Zn foil | — | 1.5/0.4 | 0.7 | — | 5000 mA g−1 | 291 | Cathode | 2000 | 74 |
| 2019 | 3 M ZnSO4/H2O488 | Ag0.4V2O5 | — | Zn foil | — | 1.4/0.4 | 0.7 | — | 5000 mA g−1 | 283 | Cathode | 1000 | 76 |
| 10000 mA g−1 |
155 | 4000 | 93 | ||||||||||
| 2019 | 1 M Zn(TFSI)2 + 20 m LiTFSI/H2O489 | Co0.25V2O5·0.94H2O | 1–3 | Zn foil | — | 2.2/0.6 | 1.0 | — | 4000 mA g−1 | 215 | Cathode | 7500 | 90 |
| 2019 | 1 M ZnSO4/H2O490 | KxV2O5 | 3 | Zn foil | — | 1.4/0.4 | 0.7 | — | 3000 mA g−1 | 91 | Cathode | 500 | 91 |
| 8000 mA g−1 | 156 | 1500 | 96 | ||||||||||
| 2019 | 3 M Zn(OTf)2/H2O491 | CuV2O6 | 1.5 | Zn foil | — | 1.6/0.2 | 0.8 | — | 5000 mA g−1 | 300 | Cathode | 3000 | 100 |
| 2019 | 2 M ZnSO4/H2O492 | (NH4)2V6O16·1.5H2O | 1–2 | Zn foil | — | 1.6/0.2 | 0.8 | — | 3000 mA g−1 | 221 (3000 mA g−1) | Cathode | 1000 | 95 |
| 5000 mA g−1 | 3000 | 60 | |||||||||||
| 2019 | 3 M Zn(OTf)2/H2O493 | (NH4)2V6O16·1.5H2O | — | Zn foil | — | 1.6/0.4 | 0.8 | — | 2000 mA g−1 | 213 | Cathode | 5000 | 90 |
| 8000 mA g−1 | 139 | 100000 |
75 | ||||||||||
| 2019 | 3 M Zn(OTf)2/H2O494 | NaCa0.6V6O16·3H2O | 1.1 | Zn foil | — | 1.5/0.4 | 0.8 | — | 300 mA g−1 | 317 | Cathode | 300 | 85 |
| 2000 mA g−1 | 231 | 2000 | 94 | ||||||||||
| 5000 mA g−1 | 189 | 10000 |
66 | ||||||||||
| 2020 | 3 M Zn(OTf)2/H2O495 | Polypyrrole coated VO2 (A) | 1.2 | Zn foil | — | 1.4/0.2 | 0.8 | — | 100 mA g−1 | 440 | Cathode | 100 | 68 |
| 1000 mA g−1 | 300 | 860 | 48 | ||||||||||
| 2020 | 3 M Zn(OTf)2/H2O496 | VO2 (B)/graphene oxide | 1 | Zn foil | — | 1.4/0.2 | 0.7 | — | 200 mA g−1 | 440 | Cathode | 100 | 83 |
| 5000 mA g−1 | 320 | 1000 | 90 | ||||||||||
| 2020 | 2 M Zn(OTf)2/H2O497 | V2O3 | 2 | Zn foil | — | 1.6/0.2 | 0.7 | — | 5000 mA g−1 | 560 (5000 mA g−1) | Cathode | 1000 | 98 |
| 10000 mA g−1 |
10000 |
100 | |||||||||||
| 2020 | 2 M ZnSO4/H2O498 | V6O13 | 1.5 | Zn/carbon cloth | 2.5 | 1.4/0.2 | 1.0 | 1.7 (mass) | 2000 mA g−1 | 393 | Cathode | 1000 | 85 |
| 2020 | 3 M Zn(TFSI)2/H2O499 | Oxygen deficient V6O13 | 2 | Zn foil | — | 1.5/0.2 | 0.8 | — | 200 mA g−1 | 413 | Cathode | 200 | 95 |
| 2000 mA g−1 | ∼305 | 2000 | 86 | ||||||||||
| 2020 | 2 M Zn(OTf)2/H2O (pH 4)500 | K0.23V2O5 | — | Zn foil | — | 1.7/0.1 | 0.7 | — | 100 mA g−1 | ∼245 | Cathode | 50 | 85 |
| 2000 mA g−1 | 111 | 500 | 93 | ||||||||||
| 2020 | 2 M Zn(TFSI)2/H2O501 | MbV2O4 | 1–1.5 | Zn foil | — | 1.4/0.2 | 0.8 | — | 200 mA g−1 | 293 | Cathode | 50 | 93 |
| 4000 mA g−1 | 192 | 500 | 67 | ||||||||||
| 2020 | 3 M Zn(OTf)2/H2O502 | PEDOT/NH4V3O8 | 2 | Zn foil | — | 1.6/0.4 | 0.7 | — | 200 mA g−1 | 346 | Cathode | 100 | 95 |
| 10000 mA g−1 |
171 | 5000 | 94 | ||||||||||
| 2020 | 3 M Zn(OTf)2/H2O503 | (NH4)2V3O8 | — | Zn foil | — | 1.6/0.4 | 0.8 | — | 100 mA g−1 | 310 | Cathode | 50 | 69 |
| 200 mA g−1 | 290 | 100 | 74 | ||||||||||
| 1000 mA g−1 | 266 | 2000 | 51 | ||||||||||
| 2020 | 3 M ZnSO4/H2O504 | δ-Ni0.25V2O5·nH2O | 2.5–3.5 | Zn foil | — | 1.7/0.3 | 0.7 | — | 200 mA g−1 | 385 | Cathode | 50 | 90 |
| 5000 mA g−1 | 152 | 1200 | 98 | ||||||||||
| 2021 | 3 M Zn(OTf)2/H2O505 | Nsutitle-type VO2 | 1–2 | Zn foil | — | 1.4/0.2 | 0.8 | — | 1000 mA g−1 | 318 | Cathode | 100 | 99 |
| 5000 mA g−1 | 195 | 5000 | 84 | ||||||||||
| 2021 | 2 M ZnSO4/H2O506 | Polypyrrole coated oxygen deficient VO2·nH2O | 1–3 | Zn foil | — | 1.6/0.2 | 0.8 | — | 200 mA g−1 | 337 | Cathode | 500 | 87 |
| 10000 mA g−1 |
206 | 1000 | 76 | ||||||||||
| 2021 | 3 M ZnSO4/H2O507 | N doped carbon coated V2O3 | 1.8 | Zn foil | 1.6/0.3 | — | — | 100 mA g−1 | 428 | Cathode | 152 | 93 | |
| 10000 mA g−1 |
351 | 4000 | 92 | ||||||||||
| 2021 | 3 M Zn(OTf)2/H2O508 | Oxygen deficient V2O5 | 1 | Zn foil | — | 1.6/0.1 | 0.8 | — | 200 mA g−1 | 361 | Cathode | 200 | 82 |
| 2000 mA g−1 | 251 | 1000 | 85 | ||||||||||
| 2021 | 2 M Zn(OTf)2/H2O509 | Oxygen deficient V2O5 | — | Zn foil | — | 1.5/0.4 | 0.8 | — | 2000 mA g−1 | 275 | Cathode | 2000 | 87 |
| 20000 mA g−1 |
108 | 5000 | 95 | ||||||||||
| 2021 | 2.5 M Zn(OTf)2/H2O510 | V2O5 | — | Zn foil | — | 1.6/0.2 | 0.8 | — | 500 mA g−1 | 361 | Cathode | 2000 | 71 |
| 2021 | 3 M Zn(OTf)2/H2O511 | V2O5/graphene oxide | 2 | Zn foil | — | 1.6/0.3 | 0.8 | — | 100 mA g−1 | 528 | Cathode | 50 | 79 |
| 20000 mA g−1 |
212 | 10000 |
91 | ||||||||||
| 40000 mA g−1 |
114 | 1000 | 100 | ||||||||||
| 2021 | 3 M Zn(OTf)2/H2O512 | V2O5·nH2O | — | Zn foil | — | 1.6/0.3 | 0.7 | — | 5000 mA g−1 | 342 | Cathode | 1000 | 97 |
| 2021 | 3 M Zn(OTf)2/H2O513 | V3O7·H2O | 5 | Zn foil | — | 1.1/0.4 | 0.8 | — | 100 mA g−1 | 323 (100 mA g−1) | Cathode | 50 | 92 |
| 2000 mA g−1 | 800 | 83 | |||||||||||
| 2021 | 3 M Zn(OTf)2/H2O514 | V6O13/carbon nanotubes | 1 | Zn foil | — | 1.5/0.3 | 0.8 | — | 500 mA g−1 | ∼325 | Cathode | 500 | 95 |
| 5000 mA g−1 | 165 | 5000 | 91 | ||||||||||
| 2021 | 3 M Zn(OTf)2/H2O515 | CO2 modified V6O13 | 1–2 | Zn foil | — | 1.5/0.3 | 0.7 | — | 2000 mA g−1 | 305 | Cathode | 4000 | 80 |
| 2021 | 3 M ZnSO4/H2O516 | Na1.2V3O8/K2V6O16·1.5H2O | 1 | Zn foil | — | 1.4/0.4 | 0.8 | — | 500 mA g−1 | 350 | Cathode | 100 | 86 |
| 5000 mA g−1 | 288 | 800 | 94 | ||||||||||
| 2023 | 3 M Zn(OTf)2/H2O + 1-ethyl-3-methylimidazolium·FSI517 | Zn0.25V2O5·nH2O | 3 or 13 | Zn foil | Excess or 10 µm | 1.4/0.5 | 0.7 | Zn excess | 100 mA g−1 (3 mg cm−2, 30 °C) | 170 | Cathode | 500 | 88 |
| Zn excess | 1000 mA g−1 (3 mg cm−2, 60 °C) | 149 | 400 | 85 | |||||||||
| DOD of Zn > 29% | 50 mA g−1 (13 mg cm−2, 30 °C) | — | 120 | 80 | |||||||||
| 2023 | 2 m Zn(OTf)2/H2O + ether (pH 4) [ether; 15-crown-5 or 12-crown-4 or triglyme] H2O:ether = 8:2, w:w518 |
Zn0.25V2O5·nH2O | 3.2 mA h cm−2 | Zn foil | — | 1.6/0.2 | 0.7 | 2.0 (capacity) | 2C | 275 (2C) | Cathode | 3200 | 80 |
| 13 mA h cm−2 | 2.2 (capacity) | 0.16C | 160 | 70 | |||||||||
| 2016 | 0.5 M Zn(OAc)2/H2O519 | Na3V2(PO4)3 | — | Zn foil | — | 1.7/0.8 | 1.2 | — | 0.5C | 97 | Cathode | 100 | 74 |
| 2016 | 1 M Zn(OAc)2 + 0.5 M NaOAc/H2O520 | Na3V2(PO4)3 | — | Zn foil | — | 1.7/0.8 | 1.4 | — | 0.5C | 93 | Cathode | 200 | 77 |
| 2016 | 2 M ZnSO4 + 1 M Li2SO4/H2O (pH 4)521 | Li3V2(PO4)3 or Na3V2(PO4)3 | 6 | Zn foil | — | 2.1/0.7 | 1.2 (LVP) | — | 0.2C | 114 | Cathode | 200 | 85 |
| 1.1 (NVP) | 0.2C | 96 | 200 | 84 | |||||||||
| 2016 | 0.5 M ZnSO4 + 21 m LiTFSI/H2O522 | LiMn0.8Fe0.2PO4 | — | Zn foil | — | 2.35/1.0 | 1.8 | 50 wt% Zn excess | 0.3C | 112 | Cathode | 150 | 97 |
| 2018 | 2 M Zn(OTf)2/H2O523 | Na3V2(PO4)2F3 | 10 | Zn powder/carbon/PTFE | 1 | 1.9/0.8 | 1.6 | 0.1 (mass) | 200 mA g−1 | 64 | Cathode | 600 | 98 |
| 1000 mA g−1 | 48 | 4000 | 95 | ||||||||||
| 2019 | 1 M Zn(OTf)2 + 21 m LiTFSI/H2O524 | VOPO4/carbon nanotube | 2 | Zn foil | — | 2.1/0.8 | 1.6 | — | 1000 mA g−1 | 82 | Cathode | 1000 | 93 |
| 2019 | 13 m ZnCl2 + 0.8 m H3PO4/H2O525 | VOPO4·nH2O | — | Zn foil | — | 1.9/0.7 | 1.4 | — | 2000 mA g−1 | 98 | Cathode | 500 | 92 |
| 2019 | 1 M Zn(OTf)2/H2O:acetonitrile (90:10, v:v)526 |
Polypyrrole intercalated VOPO4 | 0.7–1.5 | Zn foil | — | 1.7/0.6 | 1.4 | — | 100 mA g−1 | 86 | Cathode | 350 | 91 |
| 2019 | 2 M Zn(OTf)2/H2O527 | Na3V2(PO4)3/graphene oxide | — | Zn foil | — | 1.8/0.6 | 1.2 | — | 50 mA g−1 | 114 | Cathode | 50 | 83 |
| 500 mA g−1 | 101 | 200 | 75 | ||||||||||
| 2020 | 2 M Zn(OTf)2/H2O528 | Zn0.4VOPO4·0.8H2O | 2 | Zn foil | — | 1.9/0.2 | 1.5 | — | 100 mA g−1 | 161 | Cathode | 1000 | 71 |
| 2020 | 0.5 M Zn(OAc)2/H2O529 | Na3V2(PO4)3 | — | Zn foil | — | 1.6/0.6 | 1.2 | — | 1C | 90 | Cathode | 100 | 80 |
| 2020 | 25 m ZnCl2 + 5 m NH4Cl/H2O530 | Na3V2(PO4)2O1.6F1.4 | 2.9 | Zn foil | — | 2.1/0.4 | 1.5 | 500 mA g−1 | 139 | Cathode | 2000 | 83 | |
| 2000 mA g−1 | 83 | 7000 | 74 | ||||||||||
| 2021 | 2 M ZnSO4/H2O531 | VOPO4·2H2O | 2 | Zn foil | — | 1.9/0.2 | 1.1 | — | 100 mA g−1 | 313 | Cathode | 500 | 95 |
| 5000 mA g−1 | 206 | 2000 | 77 | ||||||||||
| 2021 | 2 M Zn(OTf)2/H2O532 | Phenylamine intercalated VOPO4·2H2O | 2 | Zn foil | — | 1.9/0.2 | 1.2 | — | 5000 mA g−1 | 201 | Cathode | 2000 | 92 |
| 2021 | 1 m Zn(ClO4)2/H2O:acetonitrile (89:11, v:v)533 |
Li3V2(PO4)3 | 2–2.3 | Zn foil | — | 2.2/0.7 | 1.5 | — | 2C | 125 | Cathode | 200 | 95 |
| 5C | 106 | 1000 | 89 | ||||||||||
| 2021 | 1 M Zn(OTf)2 + 15 m LiTFSI/H2O534 | Li3V2(PO4)3 | 2 | Zn foil | — | 2.1/0.6 | 1.8 | — | 200 mA g−1 | 127 | Cathode | 200 | 100 |
| 1000 mA g−1 | 109 | 2000 | 82 | ||||||||||
| 2022 | 2 M Zn(OTf)2/H2O + 70 wt% polyethylene glycol535 | LiV2(PO4)3 | 3 | Zn foil | — | 1.9/0.2 | 1.4 | — | 0.2C | 102 (0.5C) | Cathode | 100 | 84 |
| 0.5C | 300 | 75 | |||||||||||
| 2022 | 2 M Zn(OTf)2 + 1 M NaOTf/H2O + polyethylene glycol536 | Na3V2(PO4)3 | 2 | Zn foil | — | 1.6/0.6 | 1.4 | — | 50 mA g−1 | 90 | Cathode | 300 | 67 |
| 2023 | 30 m ZnCl2 + 5 m LiCl + 10 m trimethylammonium·Cl/H2O537 | VOPO4·2H2O | 3 or 25 (swagelok) | Zn foil | — | 1.9/0.2 | 1.1 | 2.0–2.3 (capacity) | 2000 mA g−1 (swagelok, 3 mg cm−2) | 85 (swagelok, 3 mg cm−2) | Cathode + anode | 4000 | 85 |
| 22.5 (pouch) | 300 mA g−1 (swagelok, 25 mg cm−2) | 1600 | 79 | ||||||||||
| 40–50 mA g−1 (pouch, 22.5 mg cm−2) | 500 | 75 | |||||||||||
| 2023 | 30 m ZnCl2/H2O + vanillin (5 mg vs. 1 mL H2O)538 | VOPO4·2H2O | 16 | Zn foil | — | 1.9/0.2 | 1.3 | 2.0 (capacity) | 100 mA g−1 | ∼170 | Cathode | 800 | 90 |
| 2015 | 20 mM ZnSO4/H2O (pH 6)539 | Cu[Fe(CN)6] | 5 | Zn foil | — | — | 1.7 | — | 1C (60 mA g−1) | 55 | Cathode | 100 | 96 |
| 2015 | 1 M ZnSO4/H2O540 | Zn3[Fe(CN)6]2 | 8 | Zn powder/carbon/PVDF | 0.7 | 2.0/0.8 | 1.7 | 0.1 (mass) | 1C (60 mA g−1) | 65 | Cathode | 100 | 76 |
| 5C (300 mA g−1) | 53 | 81 | |||||||||||
| 2016 | 1 M Zn(OAc)2 in [Ch]OAc + 30 wt% H2O541 | K0.05Fe[Fe(CN)6]·2.6H2O | — | Zn foil | — | 2.0/1.0 | 1.1 | — | 10 mA g−1 | 121 | Cathode | 10 | 95 |
| 2016 | 1 M ZnSO4 + 0.01 M H2SO4/H2O542 | Cu[Fe(CN)6] | 4 | Hyper dendritic Zn | — | 2.1/1.4 | 1.7 | — | 5C | 61 | Cathode | 500 | 82 |
| 2017 | 1 M ZnSO4/H2O + additives sodium dodecyl sulfate sodium carboxymethylcellulose sodium dodecylbenzenesulfonate dodecyl trimethylammonium bromide543 | Na2Mn[Fe(CN)6] | 10 | Zn foil | — | 2.0/1.0 | 1.6 | — | 0.5C (80 mA g−1) | 125 (0.5C) | Cathode | 400 | 90 |
| 5C (800 mA g−1) | 2000 | 75 | |||||||||||
| 2023 | 0.3 M ZnSO4/H2O544 | Fe4[Fe(CN)6]3 | 6.8 | Zn foil | 80 µm (56 mg cm−2) | 2.3/1.4 | 1.9 | — | 2000 mA g−1 | 30 | Cathode | 200 | 60 |
| 2016 | 1 M ZnSO4/H2O545 | Mo6S8 | — | Zn foil | — | 1.0/0.25 | 0.5 | — | 180 mA g−1 | 63 | Cathode | 150 | 94 |
| 2009 | 0.1 M ZnCl2 + 0.1 M NH4Cl/H2O546 | Poly(2,2,6,6-tetramethyl piperidinyloxy-4-yl vinyl ether) | — | Zn foil | — | 2.0/1.4 | 1.7 | — | 60C | 131 | Cathode | 500 | 65 |
| 2011 | 1 M ZnCl2/H2O547 | Polyindole | — | Zn foil | — | 2.0/1.0 | 1.5 | — | (60% discharge) 5000 mA cm−2 | 70 | Cathode | 200 | 98 |
| 2015 | 1 M ZnCl2/H2O (pH 6)548 | Poly(5-cyanoindole) | — | Zn foil | — | 2.2/1.0 | 1.8 | — | (60% discharge) 0.2C | 100 | Cathode | 800 | 75 |
| 1C | 91 | 800 | 68 | ||||||||||
| 2C | 82 | 800 | 63 | ||||||||||
| 2016 | 1 M Zn(BF4)2·nH2O (pH 6)549 | 9,10-Di(1,3-dithiol-2-ylidene)-9,10-dihydroanthracene | 1.5 | Zn foil | — | 1.7/0.6 | 1.1 | — | 10C | 100 | Cathode | 9400 | 86 |
| 120C | 111 | 1000 | 95 | ||||||||||
| 2018 | 1 M Zn(OTf)2/H2O or 1 M Zn(OTf)2/H2O + poly(vinyl alcohol)550 | Polyaniline/carbon nanofiber | 1.5 | Zn foil | 11–2500 mg | 1.5/0.5 | 1.1 | — | 500 mA g−1 | 109 | Cathode | 200 | 93 |
| 5000 mA g−1 | 89 | 3000 | 92 | ||||||||||
| 2018 | 1 M ZnCl2/H2O551 | Polyaniline/carbon fiber | — | Zn foil | — | 1.7/0.7 | 1.1 | — | 1C | 162 | Cathode | 65 | 85 |
| 2018 | 1 M ZnSO4/H2O552 | Sulfo-doped-polyaniline | — | Zn foil | — | 1.6/0.5 | 1.1 | — | 10000 mA g−1 |
130 | Cathode | 2000 | 85 |
| 2018 | 3 M Zn(OTf)2/H2O553 | Calix[4]quinone | 10 | Zn foil | 13 | 1.8/0.2 | 1.0 | 1.2 (mass) | 100 mA g−1 | 250 | Cathode | 50 | 93 |
| 500 mA g−1 | 160 | 1000 | 87 | ||||||||||
| 2018 | 3 M Zn(OTf)2/H2O554 | Poly(benzoquinonyl sulfide) | 1 | Zn foil | — | 1.8/0.2 | 1.0 | — | 0.2C | 166 | Cathode | 50 | 86 |
| 2018 | 2 M ZnSO4/H2O555 | Pyrene-4,5,9,10-tetraone | — | Zn foil | — | 1.5/0.4 | 0.8 | — | 3000 mA g−1 | 210 | Cathode | 1000 | 70 |
| 2018 | 1 M Zn(OTf)2/H2O (pH 4)556 | Tetrachloro-1,4-benzoquinone/mesoporous carbon | 3–5 | Zn foil | — | 1.4/0.8 | 1.1 | — | 0.2C | 170 (0.2C) | Cathode | 100 | 53 |
| 1C | 118 (1C) | 200 | 70 | ||||||||||
| 2020 | 2 M ZnSO4/H2O557 | Sulfur heterocyclic quinone dibenzo[b,i]thian threne-5,7,12,14-tetraone | 5 | Zn foil | — | 1.3/0.3 | 0.8 | — | 100 mA g−1 | 190 | Cathode | 150 | 99 |
| 2000 mA g−1 | 105 | 23000 |
75 | ||||||||||
| 2023 | 10 m Zn(OAc)2 + 15 m KOAc/H2O558 | Pyrene-4,5,9,10-tetraone | 2 | Zn foil | — | 1.6/0.2 | 0.9 | 1.2 (mass) | 10C | 200 | Cathode | 4000 | 70 |
| 10 m Zn(OAc)2/H2O + 24 m CO(NH2)2 | |||||||||||||
| 10 m Zn(OAc)2/H2O + 30 m C2H5NO | |||||||||||||
| 2023 | 0.3 M ZnSO4/H2O544 | Polyaniline | 11 | Zn foil | 80 µm (56 mg cm−2) | 1.5/0.5 | 1.1 | — | 1000 mA g−1 | 62 | Cathode | 200 | 68 |
 | ||
| Fig. 45 Computational calculation results for the migration energies of monovalent and multivalent ions in (a) spinel Mn2O4, (b) olivine FePO4, (c) layered NiO2, and (d) orthorhombic δ-V2O5 structures.435 Reprinted with permission from Chemistry of Materials. | ||
Manganese oxide (MnO2) was first utilized in primary Zn alkaline batteries (Fig. 46).559 Among its various polymorphs, α- and δ-MnO2 facilitate water co-intercalation owing to their large tunnels, interlayer spaces, and flexible structural interstitials, which provide sufficient tolerance for large guest ions.445,560,561 Conversely, γ-MnO2, with its limited structural interstitials and tunnel sizes, tends to prevent water co-intercalation. However, in acidic and neutral electrolytes, the intercalation of protons into all MnO2 polymorphs occurs kinetically much faster than that of Zn2+. Additionally, MnO2 dissolves easily into the bulk electrolyte, a degradation mode that is accelerated in alkaline conditions by forming OH-ranked complex ions, [Mn(OH)n+2]n−.562 Although aqueous Zn electrolytes containing Mn2+ salts such as MnSO4 mitigate the issue of MnO2 dissolution,451 the presence of Mn2+ in the electrolyte can cause anodic electrolysis of Mn2+, producing additional γ-MnO2 deposits while consuming water, which would alter the initial electrolyte formulation. As another degradation mechanism, Laberty-Robert, Balland, and Limoges et al. demonstrated that weak acid proton donors (e.g. [Zn(H2O)6]2+), which readily form in aqueous Zn solutions, facilitate the electrodissolution of various MnOx.563,564
 | ||
| Fig. 46 Schematics of proposed energy storage mechanisms in Zn cathode active materials;31 (a) pure (desolvated) Zn2+ intercalation, (b) conversion reaction, and (c) Zn2+/H+ co-intercalation in MnO2. (d) Cyclic voltammograms of Mo6S8 for Zn2+ intercalation/deintercalation in protic aqueous and aprotic nonaqueous electrolytes.545 Reprinted with permission from Joule (a)–(c) and ACS Applied Materials & Interfaces (d). | ||
Based on the rich chemistry of V, diverse types of vanadium oxides (VxOy) have been explored and tested for aqueous Zn-metal batteries. VxOy provides a large capacity owing to its multiple electron reactions (V3+/V5+). A layered structure of Zn0.25V2O5·nH2O, consisting of V2O5 bilayers with interlayer Zn2+ and water molecules, allows for water co-intercalation.438 In contrast, bronze-type VO2 is expected to restrict water co-intercalation due to geometrical limitations arising from its bridged interlayer gap.565 However, bronze-type VO2 undergoes hydrolysis in aqueous electrolytes and transforms into a water-inserted layered structure.566 Similar to MnO2, proton intercalation into VxOy is much faster than Zn2+ intercalation.473,567 These observations indicate that the reported electrochemical properties of VxOy largely originate from proton and water co-intercalation rather than Zn2+ intercalation.
The strong interactions between Zn2+ and lattice oxide ions create a significant diffusion barrier, fundamentally limiting the use of oxide materials as Zn cathode active materials.435 In contrast, sulfides and selenides, such as MS2 (M = Ti, V, Mo), ZnxMo6S8, and their sulfur–selenium substitutions,568–573 have weaker interactions with hard cations, including divalent Zn2+, Mg2+, and Al3+, and possess robust, flexible frameworks, thus presenting viable alternatives.545,570,574,575 Notably, ZnxMo6S8 exhibits identical charge and discharge curves in aprotic nonaqueous and protic aqueous Zn electrolytes, as shown in Fig. 46.545,570 Crystallographic analysis with ex situ powder X-ray diffraction (XRD) confirmed Zn2+ insertion, and Fourier synthesis revealed the presence of electron density in interstitial voids, further validating the Zn2+ insertion.570
Prussian blue analogs, AxMy[Fe(CN)6]·nH2O, have also been studied as Zn2+ host materials.576 The octahedrally coordinated M and Fe are interconnected by linear CN−, forming an expanded ReO3-like structure (Fig. 30). The A cations occupy the interstitials corresponding to the A-site of the perovskite structure. This expanded ReO3 framework provides three-dimensional open channels that allow the diffusion of Zn2+. The rich chemistry of Prussian blue analogs, along with their intrinsic structural flexibility and high redox potentials (e.g., 1.7 V vs. Zn/Zn2+ in Zn3[Fe(CN)6]2),540 render Zn2+ promising as host materials. However, the large but sparse open channel structure allows water co-intercalation and limits the battery energy density per unit weight and unit volume.
Beyond adapting known materials from monovalent-ion systems, unique designs to accommodate Zn2+ are necessary to develop Zn cathode active materials. The first step involves gaining a deeper understanding of the topochemical interactions and the deconvolution of Zn2+ and other intercalants (proton and water co-intercalation) through direct analysis to validate Zn2+ intercalation in active materials. This can be achieved using methods like electrochemical quartz crystal micro-balance measurements and by quantitative evaluations of the atomistic structure, structure factors, and elemental composition. Additionally, electrochemical tests with aprotic nonaqueous electrolytes, which exclude proton and water co-intercalation, will help understand Zn2+ intercalation/deintercalation reactions in the material.
7.2. Dilemma in pH selection
The pH of the electrolyte significantly impacts the thermodynamic HER potential and the kinetics of byproduct formation during the Zn plating and stripping processes. Therefore, thoroughly understanding the influence of the electrolyte pH on these electrochemical and chemical side reactions is crucial for enhancing the performance and safety of aqueous Zn-metal batteries. Elevated pH levels help reduce hydrogen gas evolution by lowering the thermodynamic HER potential, as illustrated in Fig. 10. However, according to the Pourbaix diagram for Zn (Fig. 47),577 undesirable byproducts such as zinc oxide (ZnO) and zinc hydroxide (Zn(OH)2) can form at pH 8–11. This problem is often exacerbated by precipitates of Zn–anion complexes, such as Zn4(OH)6SO4·nH2O, Zn5(OH)8Cl2·nH2O, and Zn4(OH)7ClO4·nH2O.483,578,579 These byproducts exhibit poor electrical and Zn2+ ionic conductivities, which result in poor Coulombic efficiency during Zn plating and stripping. At high pH levels (pH > 11), the formation of soluble zincate ions (Zn(OH)3− and Zn(OH)42−) is promoted, which can lead to severe chemical self-corrosion and create uneven electrode surfaces. This not only poses risks of short-circuiting but can also severely undermine the overall battery performance. | ||
| Fig. 47 Pourbaix diagram of Zn in aqueous electrolytes.577,580 Reprinted with permission from Journal of Materials Chemistry A. | ||
On the other hand, a decreased pH level in the electrolyte can inhibit the formation of insoluble byproducts, which is expected to significantly enhance the Coulombic efficiency of Zn plating and stripping by eliminating surface contamination and improving the Zn2+ conductivity. However, this advantage is offset by a competing dynamic, namely, an increase in the thermodynamic HER potential. Under acidic conditions, a significant portion of the electrons intended for Zn deposition may instead be consumed by the HER, thereby diminishing the energy efficiency of the battery. Moreover, the hydrogen gas bubbles and OH− produced alongside the HER contribute to several detrimental effects. Some of these effects are listed below:
(1) Safety risks, such as the generation of large amounts of highly flammable hydrogen gas, which can lead to explosion or fire hazards, negating the safety benefits of aqueous batteries.
(2) Blocking of contact between the electrolyte and Zn-metal anode.
(3) Triggering the formation of byproducts such as Zn(OH)2.
(4) Facilitation of battery short-circuiting through dendrite formation, ultimately decreasing the overall battery performance.
Additionally, in an acidic electrolyte, the intercalation of H+ into the cathode active materials might be favored over that of Zn2+. The smaller size and higher mobility of H+ allow them to migrate more readily within the electrolyte and intercalate into the lattice structure of cathode active materials, thus redirecting the energy storage mechanism of the battery toward H+-based reactions, and deviating from the expected Zn2+-based redox reactions. Besides, acidic conditions accelerate the dissolution of transition metals from the cathode, thereby deteriorating the cycling stability of the battery. Note that H+ can also originate from Brønsted weak acids (e.g. aquo metal ion complexes; [Zn(H2O)6]2+ ⇄ [Zn(H2O)5(OH)]+ + H+, pKa ∼ 9), present in the electrolyte with strong Lewis acids (e.g. Zn2+).563,564,581
Overall, the pH of the electrolyte plays an essential role in determining the electrochemical and chemical dynamics, as well as the overall performance of aqueous Zn-metal batteries. Higher pH levels can facilitate the formation of insoluble byproducts with poor Zn2+ conductivity, thereby reducing the cycling efficiency and increasing the internal resistance of batteries. On the other hand, lower pH levels may accelerate the HER, trigger unexpected H+-based redox reactions, and cause severe side reactions, which degrade both the battery performance and safety. This intricate balance among pH levels, electrochemical reactions, and battery performance underscores the critical need for alternative methods to mitigate all side reactions, ensuring the efficiency and safety of Zn-metal batteries.
7.3. Limited options for Zn salts
The type of Zn salt used in the electrolyte significantly influences the electrochemical and chemical properties, thereby affecting the battery performance, and impacting practical aspects such as battery safety and cost. However, the limited variety of available Zn salts presents a significant challenge in addressing the broad range of issues faced by aqueous Zn-metal batteries. Table 12 outlines the properties of various Zn salts, providing insights into their potential advantages and disadvantages.| Salts | Molecular weight (g mol−1) | Solubility (mol kg−1) | Cost | Advantages | Concerns |
|---|---|---|---|---|---|
| ZnSO4 | 161.4 | 3.4 | Low | Low cost, moderate Zn plating/stripping efficiency | Poor oxidation stability, byproduct formation |
| ZnCl2 | 136.3 | 31 | Low | Low cost, high solubility | Poor oxidation stability, corrosive |
| ZnF2 | 103.4 | <0.1 | Low | Low cost | Low solubility |
| Zn(OAc)2 | 183.4 | 1.6 | Low | Low cost, pH control | Poor oxidation stability |
| Zn(ClO4)2 | 261.8 | 4.6 | Low | Low cost | Explosive |
| Zn(NO3)2 | 189.3 | 6.2 | Low | Low cost | An oxidizing agent |
| Zn(PF6)2 | 355.3 | — | Moderate | High oxidation stability | Hydrolysis |
| Zn(BF4)2 | 239.0 | — | Moderate | High oxidation stability | Hydrolysis |
| Zn(OTf)2 | 363.5 | 4.2 | High | High Zn plating/stripping efficiency | Cost, purity |
| Zn(TFSI)2 | 625.7 | 3.7 | High | High Zn plating/stripping efficiency | Cost, purity |
Zinc sulfate (ZnSO4) is one of the most frequently used salts in aqueous Zn-metal batteries, as highlighted in Table 11. Its popularity stems from its moderate solubility in water, low cost, high ionic conductivity, and mildly acidic electrolyte pH (pH 4–6).582,583 These characteristics are favorable for achieving high Coulombic efficiency in Zn plating and stripping processes. However, the interactions among Zn metal, SO4−, and OH− can lead to the formation of insoluble zinc hydroxide compounds, such as Zn4(OH)6SO4·nH2O, which obstruct effective Zn2+ transport and contribute to capacity fading over continuous cycles (Fig. 48). While ex situ coating on Zn metal can mitigate this issue, ensuring the stability of the coating materials during the extensive volume changes associated with Zn plating and stripping remains challenging. Details of this approach and its challenges will be further discussed in Section 7.5.
 | ||
| Fig. 48 (a) Photographs and SEM images and (b) XRD patterns before and after soaking Zn metal in a 1 m ZnSO4 solution for several days. (c) Crystal structure of the byproduct, Zn4SO4(OH)6·3H2O.444 Reprinted with permission from Advanced Functional Materials. | ||
The high solubility and ionic conductivity of zinc chloride (ZnCl2) render it a preferred choice in aqueous Zn-metal batteries.584 In 2020, Chen's group developed low-temperature aqueous Zn-metal batteries using a mildly salt-concentrated 7.5 m ZnCl2 solution, which remained liquid even at extremely low temperatures (−114 °C) (Fig. 49).585 They investigated the relationships among the ZnCl2 concentration, solution structure, and phase-transition temperature of the electrolyte. MD simulations showed that the dissolution of 7.5 m ZnCl2 in water was thermodynamically favorable compared to the separate existence of solid ZnCl2 and liquid water at 300 K (27 °C). When the temperature was lowered to 100 K (−173 °C), the formation of crystallized ZnCl2 and ice became more energetically favorable than the formation of a metastable amorphous glass. However, an energy barrier must be overcome to transition from the amorphous glass state to a crystalline structure, and this is hindered by the reduced thermal motion at such low temperatures (as demonstrated by the supercooling phenomenon discussed in Section 4.3). For instance, at 100 K (−173 °C), the mobility of Zn2+ was significantly restricted, with the ions moving less than 0.5 Å from their original positions. This was in stark contrast to the distance traversed (8.3 Å) at 300 K (27 °C). As for the stability of the liquid phase, low-temperature Raman spectroscopy confirmed that the water and ions remained interconnected, similar to the case in their liquid state, preventing the crystallization of ZnCl2 even at a temperature as low as −150 °C. The superior supercooling ability of the 7.5 m ZnCl2/H2O electrolyte allowed the stable cycling of aqueous polyaniline|Zn full cells over 2000 cycles, with nearly 100% capacity retention at a constant current of 200 mA g−1 and temperature of −70 °C.
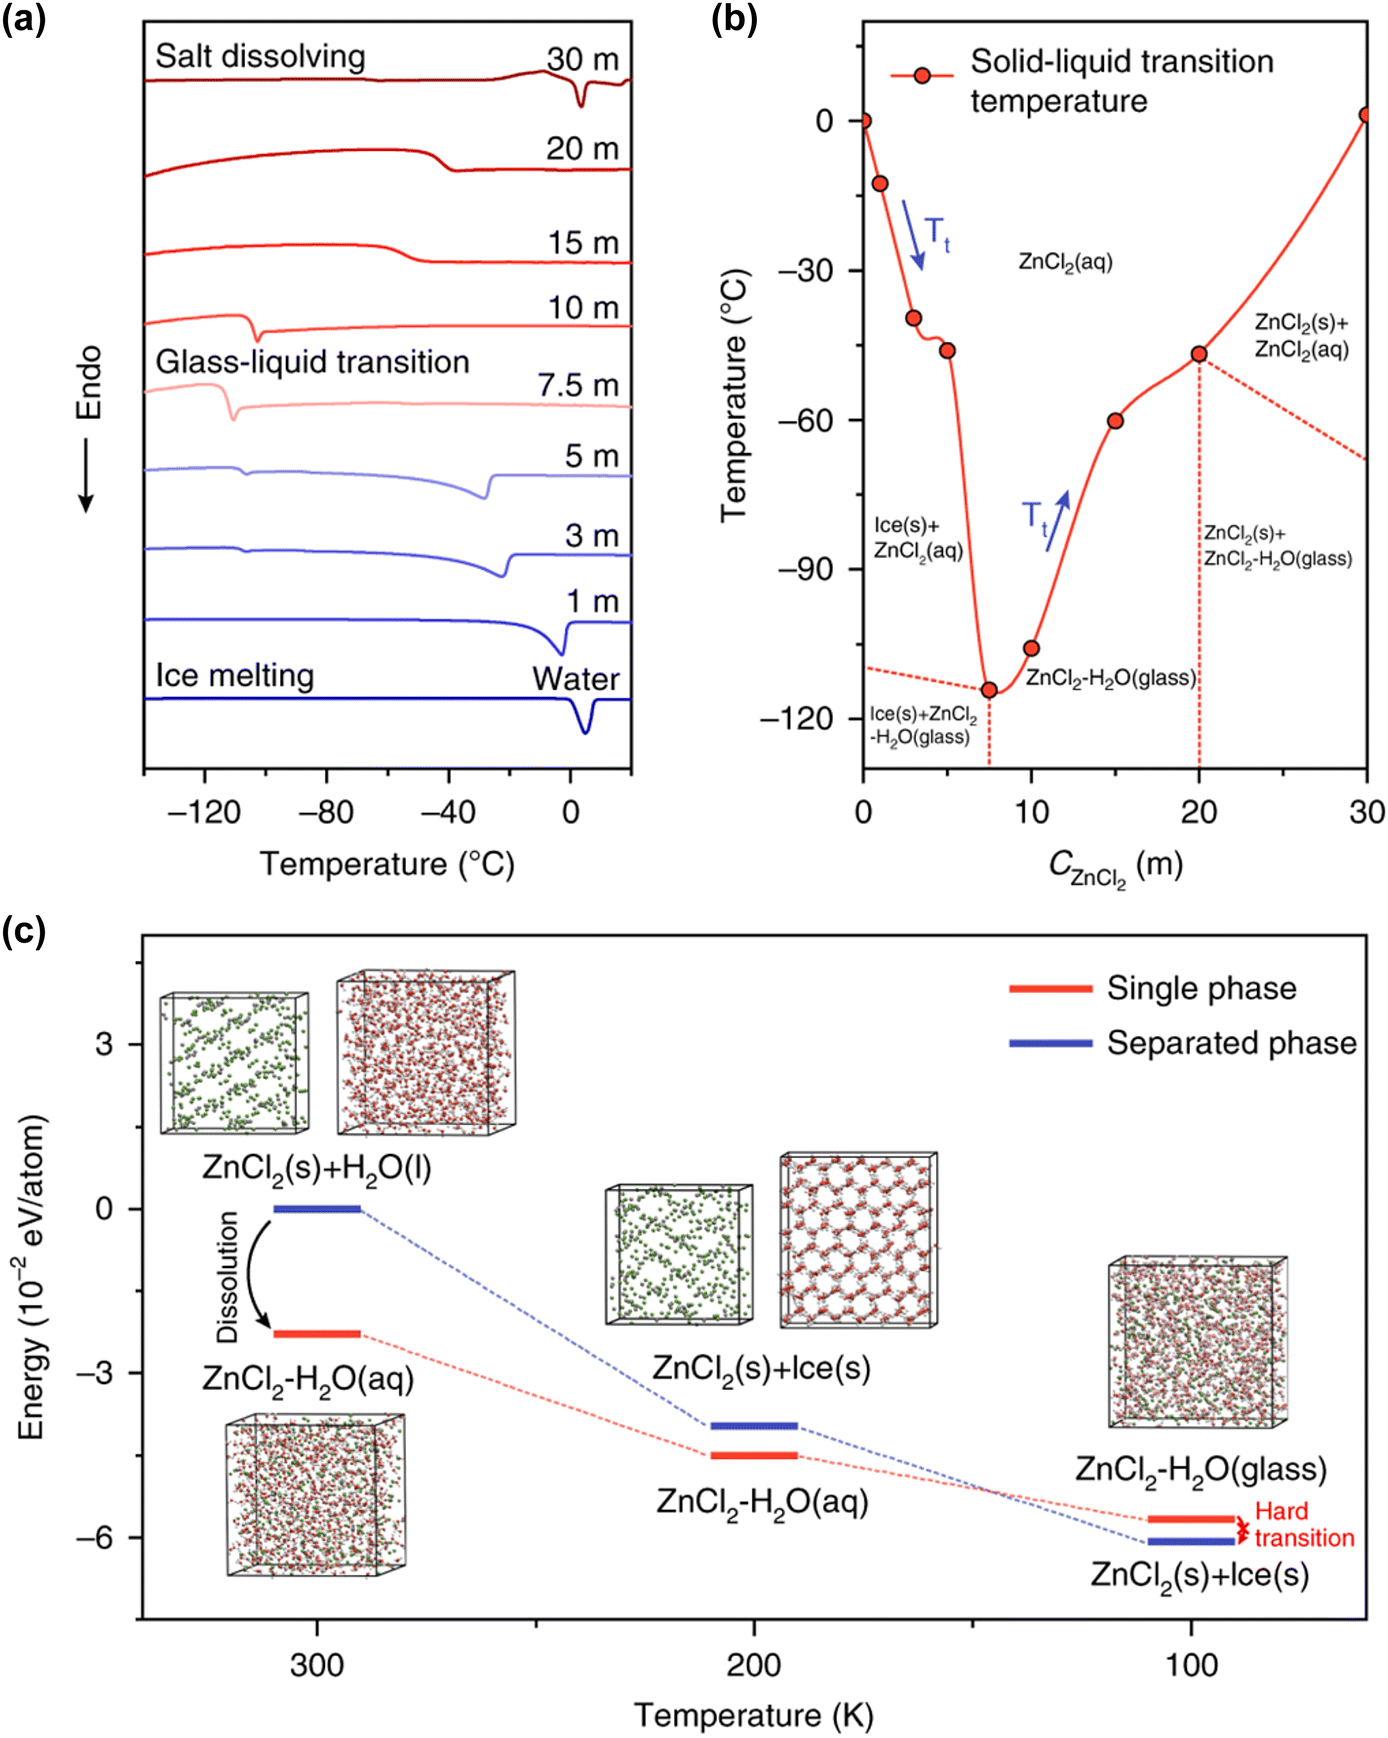 | ||
| Fig. 49 (a) Differential scanning calorimetry curves and (b) obtained phase transition diagram of a ZnCl2/water binary system. (c) Calculated transition state in the transformation from the glass state to the separated crystalline state of a 7.5 m ZnCl2/H2O solution.585 Reprinted with permission from Nature Communications. | ||
In 2023, Borodin et al. developed a high-entropy Li2ZnCl4·9H2O electrolyte by adding LiCl as a supporting salt to the aqueous ZnCl2 solution (Fig. 50).586 In this electrolyte, the pronounced acidity allowed ZnCl2 to accept donated Cl−, leading to the formation of ZnCl42− anions, while the water molecules either remained within the free solvent network or were coordinated with Li+. This contributed to enhancing the ionic conductivity of the electrolytes over a wide temperature range (−80 to +80 °C), resulting in these electrolytes outperforming conventional aqueous electrolytes. The assembled Zn–air battery sustained stable cycling for 800 h at a current density of 0.4 mA cm−2 between −60 and +80 °C.
 | ||
| Fig. 50 (a) Illustration of solution structures in different electrolytes: salt-in-water, water-in-salt, and high-entropy electrolytes. (b) Ionic conductivity of the Li2ZnCl4·9H2O electrolyte compared with those of different concentrated and diluted aqueous solutions.586 Reprinted with permission from Nature Sustainability. | ||
However, ZnCl2-based electrolytes exhibit strong corrosiveness toward metals such as Al, Cu, and Ni, and also SUS, limiting the use of cost-effective materials for current collectors and other battery components.250,587,588 While Ti, which has high resistance to chloride solutions,589 can be used as an alternative, its high cost and low flexibility make it less desirable for battery manufacturing, as demonstrated in Section 4.4. Additionally, the high acidity of ZnCl2 electrolytes poses further challenges. For example, a highly concentrated ZnCl2 aqueous electrolyte maintains a pH below 1, facilitating transition metal dissolution from the cathode and electrolyte reduction on the Zn anode surface with a substantially increased thermodynamic HER potential.
In 2021, Feng et al. developed an electrolyte incorporating a zinc fluoride (ZnF2) additive.590 They showed that the addition of ZnF2 could control the growth orientation of Zn crystals (details in Section 7.7) and help in forming a F-rich protective surface layer (details in Section 7.4), both of which mitigated byproduct formation and electrolyte reduction. As a result, high average Coulombic efficiencies of Zn plating and stripping in SUS|Zn cells (96.56% after 3000 cycles at 0.6 mA h cm−2 and 1 mA cm−2; 99.58%, 99.53%, 99.87%, and 99.68% after 1000 cycles at 0.6 mA h cm−2; higher current densities of 10, 20, 30, and 40 mA cm−2, respectively) were achieved in the 2.0 M ZnSO4 + 0.08 M ZnF2/H2O electrolyte. However, the extremely low solubility of ZnF2 restricts its use as the main salt in aqueous systems.
Zinc acetate (Zn(OAc)2) is valued for its affordability, environmental friendliness, and its ability to act as a buffer, thereby stabilizing the pH levels of electrolytes. In 2023, Lu and co-workers utilized hydrotropic solubilization, a technique commonly used in the pharmaceutical industry, to increase the solubility of water-insoluble drugs by enabling the formation of soluble complexes or associations with hydrotropic agents, to address the low-solubility issue of the Zn(OAc)2 salt (≤1.6 m).558 By adding KOAc as a hydrotropic agent, they prepared various aqueous Zn electrolytes with total anion concentrations of ∼35 m. In the tests conducted on Cu|Zn cells using a 25 m solution composed of 10 m Zn(OAc)2 and 15 m KOAc, the cells achieved a Coulombic efficiency of 99.4% for the first 100 cycles, which improved to 99.6% after 150 cycles. This performance significantly surpassed that of the 1.6 m Zn(OAc)2/H2O electrolyte, which maintained a Coulombic efficiency of approximately 98.3% for approximately 50 cycles before experiencing a sudden failure due to a short circuit. However, the poor oxidation stability of the OAc− anion restricts the use of Zn(OAc)2 as a salt in developing high-voltage aqueous Zn-metal batteries.
Zinc perchlorate (Zn(ClO4)2) offers high ionic conductivity and reduction stability. Sun et al. reported that the average Coulombic efficiency of Zn plating and stripping in Cu|Zn cells using 1 m Zn(ClO4)2/H2O reached 99.0% at 2 mA cm−2 and 2 mA h cm−2, which is higher than the Coulombic efficiencies of 98.0% and 98.2% achieved with 1 m ZnSO4/H2O and 1 m Zn(OAc)2/H2O, respectively.591 However, although Zn(ClO4)2 salt contributes to highly reversible Zn utilization, its potentially explosive nature when concentrated or in contact with reactive metals or organic solvents necessitates cautious handling, rendering it less suitable for battery applications.
Kasiri et al. compared the stability of copper hexacyanoferrate cathodes in a zinc nitrate (Zn(NO3)2)-based electrolyte with those in other Zn salts (ZnSO4, ZnF2, and Zn(ClO4)2), with salt concentrations ranging from 20 to 100 mM (Fig. 51).592 The charge and discharge curves in the electrolyte with NO3− anions displayed notable differences, which were attributed to their strong oxidizing properties. Rapid degradation of the battery performance, along with Zn metal oxidation and a local increase in the electrolyte pH, were observed using the Zn(NO3)2-based electrolyte, suggesting that Zn(NO3)2 might not be an ideal salt for aqueous Zn-metal batteries.
 | ||
| Fig. 51 Potential profiles of the copper hexacyanoferrate cathode (solid line) and Zn-metal anode (dashed line) in (a) 20 mM ZnSO4, (b) 20 mM ZnF2, (c) 20 mM Zn(ClO4)2, and (d) 20 mM Zn(NO3)2 solutions.592 Reprinted with permission from Electrochimica Acta. | ||
Zinc hexafluorophosphate (Zn(PF6)2) and zinc tetrafluoroborate (Zn(BF4)2) enhance the oxidation stability of electrolytes. In 2016, a team led by Schubert fabricated an aqueous Zn-metal battery using redox-active polymer cathodes based on 9,10-di(1,3-dithiol-2-ylidene)-9,10-dihydroanthracene and a 1 M Zn(BF4)2·nH2O electrolyte.549 The battery, tested between 0.6 and 1.7 V at a constant current of 10C, maintained 86% of its initial capacity after 9400 cycles. The research team suggested that the slightly acidic pH of the electrolyte (∼pH 6) helped prevent the oxidation of the Zn-metal anode and the formation of dendrites. However, the introduction of Zn(PF6)2 and Zn(BF4)2 salts into aqueous solutions poses challenges owing to the strong propensity of the PF6− and BF4− anions to hydrolyze, which lowers the electrolyte pH and leads to drastic capacity decay with severe corrosion of the battery electrodes and components. This issue becomes more pronounced under practical battery operating conditions, such as elevated temperatures.
Zinc triflate (Zn(OTf)2) and zinc bis(trifluoromethanesulfonyl)imide (Zn(TFSI)2) provide mildly acidic conditions (pH 3–5),593,594 a high oxidation stability, and a high Coulombic efficiency in Zn plating and stripping reactions. Chen et al. compared ZnSO4 and Zn(OTf)2 solutions at various concentrations (Fig. 52),595 demonstrating that Zn(OTf)2/H2O offered improved reversibility and reduced overpotentials for Zn plating and stripping compared to ZnSO4/H2O. This was attributed to the bulky OTf− anions, which reduced the coordination number of water molecules around Zn2+ cations, thereby diminishing the solvation effect and facilitating Zn2+ transportation.595,596 Notably, the mildly salt-concentrated 3.0 M Zn(OTf)2/H2O solution (pH 3.6) provided a high electrochemical stability with reduced water-induced side reactions as well as high ionic conductivity, enabling the long-term cycling of an aqueous cation-defective ZnMn2O4|Zn full cell over 500 cycles at 500 mA cm−2.
 | ||
| Fig. 52 Cyclic voltammograms of the Zn plating/stripping in (a) 1 M Zn(OTf)2 and (b) 1 M ZnSO4 solutions. (c) Galvanostatic charge and discharge curves at 50 mA g−1 and (d) long-term cycling performance of carbon-coated cation-defective ZnMn2O4|Zn full cells in 3 M Zn(OTf)2/H2O at 500 mA g−1.595 Reprinted with permission from Journal of the American Chemical Society. | ||
Zn(OTf)2 and Zn(TFSI)2 are considerably more expensive than common inorganic Zn salts, such as Zn(OAc)2 (Fig. 53).597,598 Additionally, the purity of commercially available Zn(OTf)2 ranges from 98 to 99%, which falls short of the battery-grade requirement of over 99.9%. Table 13 illustrates the stability of Zn plating and stripping in Zn(OTf)2-based aqueous electrolytes.
 | ||
| Fig. 53 Cost comparison of various Zn salts.597,598 Zn(Ac)2 and Zn(OAc)2 refer to the same chemical compound, Zn(CH3COO)2. Reprinted with permission from Nature Sustainability. | ||
| Electrolytes | Cell configuration | Cycle conditions | Cycle life or average Coulombic efficiency (%) |
|---|---|---|---|
| 1 m Zn(OTf)2/H2O599 | Zn|Zn | 0.5 mA cm−2, 0.5 mA h cm−2 | 1226 h |
| Cu|Zn | 0.5 mA cm−2, 0.5 mA h cm−2 | ∼90% over 500 cycles | |
| 1.0 mA cm−2, 1.0 mA h cm−2 | ∼90% over 400 cycles | ||
| 1 m Zn(OTf)2/H2O600 | Cu|Zn | 0.5 mA cm−2, 0.5 mA h cm−2 | ∼91% over 500 cycles |
| 1 M Zn(OTf)2/H2O601 | Zn|Zn | 0.5 mA cm−2, 0.5 mA h cm−2 | 105 h |
| 1 M Zn(OTf)2/H2O602 | Zn|Zn | 1.0 mA cm−2, 1.0 mA h cm−2 | 100 h |
| 1 M Zn(OTf)2/H2O583 | Zn|Zn | 2.0 mA cm−2, 2.0 mA h cm−2 | 134 h |
| 5.0 mA cm−2, 5.0 mA h cm−2 | 160 h | ||
| 20 mA cm−2, 1.0 mA h cm−2 | 137 h | ||
| 1 M Zn(OTf)2/H2O603 | Zn|Zn | 1.0 mA cm−2, 1.0 mA h cm−2 | 650 h |
| 2 m Zn(OTf)2/H2O604 | Zn|Zn | 1.0 mA cm−2, 0.5 mA h cm−2 | 300 h |
| Ti|Zn | 1.0 mA cm−2, 1.0 mA h cm−2 | ∼75%, short circuit after 100 cycles | |
| 2 M Zn(OTf)2/H2O605 | Zn|Zn | 0.5 mA cm−2, 0.5 mA h cm−2 | 180 h |
| Ti|Zn | 0.5 mA cm−2, 0.5 mA h cm−2 | ∼60%, short circuit after 10 cycles | |
| 2 M Zn(OTf)2/H2O395 | Zn|Zn | 2.0 mA cm−2, 1.0 mA h cm−2 | 175 h |
| Cu|Zn | 1.0 mA cm−2, 1.0 mA h cm−2 | ∼80%, short circuit after 50 cycles | |
| 2 M Zn(OTf)2/H2O408 | Zn|Zn | 5.0 mA cm−2, 1.5 mA h cm−2 | 20 h |
| 2 M Zn(OTf)2/H2O606 | Ti|Zn | 1.0 mA cm−2, 1.0 mA h cm−2 | Short circuit after 20 cycles |
| Zn|Zn | 1.0 mA cm−2, 1.0 mA h cm−2 | ∼200 h | |
| 5.0 mA cm−2, 5.0 mA h cm−2 | 54 h | ||
| 10 mA cm−2, 10 mA h cm−2 | ∼50 h | ||
| 2 M Zn(OTf)2/H2O607 | Zn|Zn | 0.25 mA cm−2, 0.25 mA h cm−2 | 136 h |
| 1.0 mA cm−2, 1.0 mA h cm−2 | 97 h | ||
| 5.0 mA cm−2, 5.0 mA h cm−2 | 60 h | ||
| Cu|Zn | 5.0 mA cm−2, 1.0 mA h cm−2 | Short circuit after 310 cycles | |
| 2 M Zn(OTf)2/H2O608 | Zn|Zn | 0.25 mA cm−2, 1.0 mA h cm−2 | 600–800 h |
| 1.0 mA cm−2, 1.0 mA h cm−2 | 400–900 h | ||
| 5.0 mA cm−2, 1.0 mA h cm−2 | 120–600 h | ||
| Cu|Zn | 1.0 mA cm−2, 0.5 mA h cm−2 | Short circuit after 300 cycles | |
| 3 m Zn(OTf)2/H2O609 | Cu|Zn | 1.0 mA cm−2, 0.5 mA h cm−2 | ∼70%, short circuit after 40 cycles |
| 3 M Zn(OTf)2/H2O610 | Zn|Zn | 0.5 mA cm−2, 0.5 mA h cm−2 | 490 h |
| Ti|Zn | 1.0 mA cm−2, 0.5 mA h cm−2 | ∼85%, short circuit after 25 cycles | |
| 3 M Zn(OTf)2/H2O611 | Zn|Zn | 1.0 mA cm−2, 1.0 mA h cm−2 | 150 h |
| 3 M Zn(OTf)2/H2O612 | Zn|Zn | 0.5 mA cm−2, 2.5 mA h cm−2 | 20 h |
| 4 m Zn(OTf)2/H2O535 | Ti|Zn | 1.0 mA cm−2, 1.0 mA h cm−2 | Short circuit after 3 cycles |
| 4 m Zn(OTf)2/H2O613 | Zn|Zn | 0.2 mA cm−2, 1.0 mA h cm−2 | 1500 h |
| 1.0 mA cm−2, 1.0 mA h cm−2 | 500 h | ||
| Ti|Zn | 1.0 mA cm−2, 0.5 mA h cm−2 | ∼85%, short circuit after 200 cycles |
For instance, data from previous reports show that the cycle life of Zn|Zn symmetric cells varies from 100 to 1226 h in 1 M Zn(OTf)2/H2O and from 97 to 900 h in 2 M Zn(OTf)2/H2O under conditions of 0.5 mA cm−2 to 1.0 mA cm−2 and 0.5 mA h cm−2 to 1.0 mA h cm−2. This considerable variation can be attributed to differences in the measurement protocols and issues with the purity of the Zn(OTf)2 salt.
The exploration of innovative salt systems has extended beyond traditional options. In 2013, Zhang et al. introduced zinc phenolsulfonate (Zn(PS)2, Zn(C6H4OHSO3)2), a compound typically used in cosmetics, as an electrolyte salt.614 This unique choice improved the Coulombic efficiency of Zn plating and stripping processes. A 1.0 M Zn(PS)2/H2O electrolyte exhibited a cycle life of 202 h in a Zn|Zn cell under test conditions of 1 mA cm−2 and 1 mA h cm−1, which surpassed the performance of a 1.0 M ZnSO4/H2O solution that lasted 190 h. Similar to imide TFSI−, the bulky PS− anion, which is approximately two and a half times larger than the SO42− anion, effectively reduces the coordination number of water molecules around Zn2+, thus diminishing hydrogen evolution during Zn plating. Additionally, the inclusion of 0.2 mg mL−1 of tetrabutylammonium 4-toluenesulfonate, acting as a brightener (a leveling agent; details in Section 7.7), to 1.0 M Zn(PS)2/H2O, significantly extended the cell cycle life to over 2000 h and helped prevent Zn dendrite formation.
In the same year, Li et al. developed a multifunctional fluorine-free Zn salt, zinc bis(benzenesulfonyl)benzenesulfonamide (Zn(BBI)2, Zn[(C6H5)2N(SO2)2]2) (Fig. 54).598 The hydrophilic sulfonamide group R-SO2-N-SO2-R′ of the BBI− anion enhances salt solubility and strengthens H2O–anion interactions, while the hydrophobic and spacious phenyl group –C6H5 disrupts the long-range hydrogen bond network between water molecules, effectively reducing the water activity. Raman spectroscopy analyses confirmed these effects, showing lower peak intensities at 3000–3800 cm−1, which is indicative of a weakened hydrogen bonding network, in 1.0 M Zn(BBI)2/H2O compared to solutions based on Zn(TFSI)2, Zn(OTf)2, and ZnSO4 salts. Moreover, the water vapor pressure in Zn(BBI)2 solutions, an indicator of the water activity, was lower than in other compared electrolytes. As a result, the cycle life of Zn|Zn cells tested at 2 mA cm−2 and 2 mA h cm−2 in 1.0 M Zn(BBI)2/H2O exceeded 2800 h, significantly outperforming those in 1.0 M Zn(TFSI)2/H2O (415 h), 1.0 M Zn(OTf)2/H2O (134 h), and 1.0 M ZnSO4/H2O electrolytes (346 h).
 | ||
| Fig. 54 (a) Atomic structure of the BBI− anion, with C, H, O, N, and S atoms denoted in black, light-gray, red, blue, and yellow, respectively. (b) Raman spectra and (c) water activities of various Zn solutions. (d) Cycling performance of symmetric Zn|Zn cells in 1 M Zn(BBI)2 and 1 M ZnSO4 electrolytes under the given conditions.598 Reprinted with permission from Advanced Materials. | ||
Overall, a multidisciplinary approach that integrates materials science, organic/inorganic chemistry, and electrochemical engineering is essential to meet the increasingly demanding requirements of energy storage technologies. The development of new Zn salts and electrolyte systems is critical to effectively unlock the full potential of aqueous Zn-metal batteries. Continuous studies are needed to meet rigorous practical requirements, including a high Coulombic efficiency for Zn plating and stripping under various operating conditions, high oxidation stability, affordability, environmental sustainability, safety, low corrosivity, and high purity.
7.4. Uncertainty in SEI formation
Zn2+ tend to deposit in a manner that minimizes the surface energy, which complicates the prevention of dendrite formation during plating. Further, the uneven electron distribution during stripping can lead to the formation of “dead” Zn. Both factors contribute to short circuits and significant capacity fading in batteries. Equally important is the control of non-faradaic (chemical) side reactions involving anions and water molecules, as well as faradaic (electrochemical) side reactions that continuously deplete Zn2+ resources and the electrolyte, accompanied by the generation of hydrogen gas. To address these issues, the concept of an SEI in nonaqueous Li-ion/Li-metal batteries has been applied to aqueous Zn-metal batteries. However, its applicability remains highly debatable.It is essential to comprehensively understand the formation, maintenance, and functionalities of an SEI. In aqueous electrolytes, SEI formation largely relies on anion reduction. However, the reduction potentials of free TFSI− and OTF− anions, which are commonly used in aqueous Zn electrolytes, are significantly lower than the redox potential of Zn/Zn2+, rendering the formation of the anion-derived SEI before Zn deposition challenging.615,616 As previously demonstrated in Section 4.1, intense interactions between strong Lewis acidic Zn2+ and anions can promote anion reduction at higher potentials. Computational calculations estimated the reduction potential of Zn2+(TFSI−)1 and Zn2+(TFSI−)2 ion pairs to be 0.2–0.4 V and 0.9 V vs. Zn/Zn2+, respectively.616 However, the solubility of Zn(TFSI)2 and Zn(OTf)2 was limited to less than 4 m, providing a negligible amount of Zn(anion)n ion pairs.617 Furthermore, considering the overpotential of the anion reduction reaction on Zn metal, the complete formation of the anion-derived SEI should occur at lower potentials than the calculated values. For example, in case of Li systems, the calculated reduction potential of the Li+(TFSI−)n ion pair was ∼2.9 V vs. Li/Li+.18 However, even with multiple favorable conditions for the formation of an anion-derived SEI—such as using an Al electrode with a high HER overpotential and a highly salt-concentrated Li(PTFSI)0.6(TFSI)0.4·1H2O hydrate melt, which involves large amounts of ion-pair aggregations and significantly reduced water activity owing to the breakage of hydrogen bonds between water molecules—the actual potential at which the SEI was completely formed was ∼2.2 V vs. Li/Li+, much lower than the theoretically predicted reduction potential.85 All these observations suggest that the formation of an SEI on Zn metal through the electrochemical reduction of anions is challenging. This is also supported by transmission electron microscopy (TEM) images that confirm the absence of an SEI on Zn metal after the plating and stripping reactions in nearly saturated 4 m Zn(OTf)2/H2O and 4 m Zn(TFSI)2/H2O electrolytes (Fig. 55).618,619
 | ||
| Fig. 55 TEM images of the cycled Zn metal in various electrolytes. No SEI was observed on the Zn-metal surface in aqueous (a) 4 m Zn(OTf)2/H2O618 and (b) 4 m Zn(TFSI)2/H2O.619 The presence of the SEI was confirmed only in the hybrid aqueous/nonaqueous Zn electrolytes, such as (c) 4 m Zn(TFSI)2 + 4 m tributyl (2-methoxyethyl)·TFSI/H2O,619 (d) 4 m Zn(OTF)2 + 0.5 m trimethylethylammonium·OTf/H2O,618 (e) 30 m ZnCl2 + 5 m LiCl + 10 m trimethylammonium·Cl/dimethyl carbonate:H2O (1:5, n:n),537 (f) 30 m ZnCl2 + 5 m LiCl + 10 m trimethylammonium·Cl/diethyl carbonate:H2O (1:5, n:n),537 and (g) 1 M Zn(OTf)2/tetrahydrofuran:H2O (1:3, v:v).620 However, the observed SEI, with a thickness ranging from tens to thousands of nanometers, questions whether sufficient Zn2+ transport into the SEI is possible. Reprinted with permission from Nature Nanotechnology (a) and (c), Angewandte Chemie International Edition (b) and (d), Nature Sustainability (e) and (f), and Advanced Materials (g). | ||
Maintaining the SEI might be more challenging than its formation. The SEI does not exist statically on the electrode surface, but undergoes dynamic changes involving deformation and regeneration. Components of the SEI diffuse into the bulk electrolyte, and the insertion of electrolyte solvents into the SEI causes it to swell. This dynamic change of the SEI hampers the complete blocking of electrolyte contact with the electrode surface, particularly in the case of metal electrodes, which undergo significant volume changes.
Cui et al. revealed that nonaqueous electrolytes, which ensure high Coulombic efficiency in Li plating and stripping (e.g., highly salt-concentrated electrolytes, locally salt-concentrated electrolytes, and weakly solvating electrolytes with ion pair-predominant solution structures), can suppress the swelling of the SEI and the diffusion of SEI components into the bulk electrolyte (Fig. 56).621,622 In these electrolytes, the ligand of Li+ is replaced by multiple anions rather than solvents, resulting in a high concentration of anions on the anode surface, which cannot dissolve or cause swelling of the SEI. Additionally, the use of bulky, nonpolar, or low-dielectric-constant solvents that have low solubility for SEI components and are difficult to diffuse into the SEI might be another reason for the suppressed changes in the SEI.
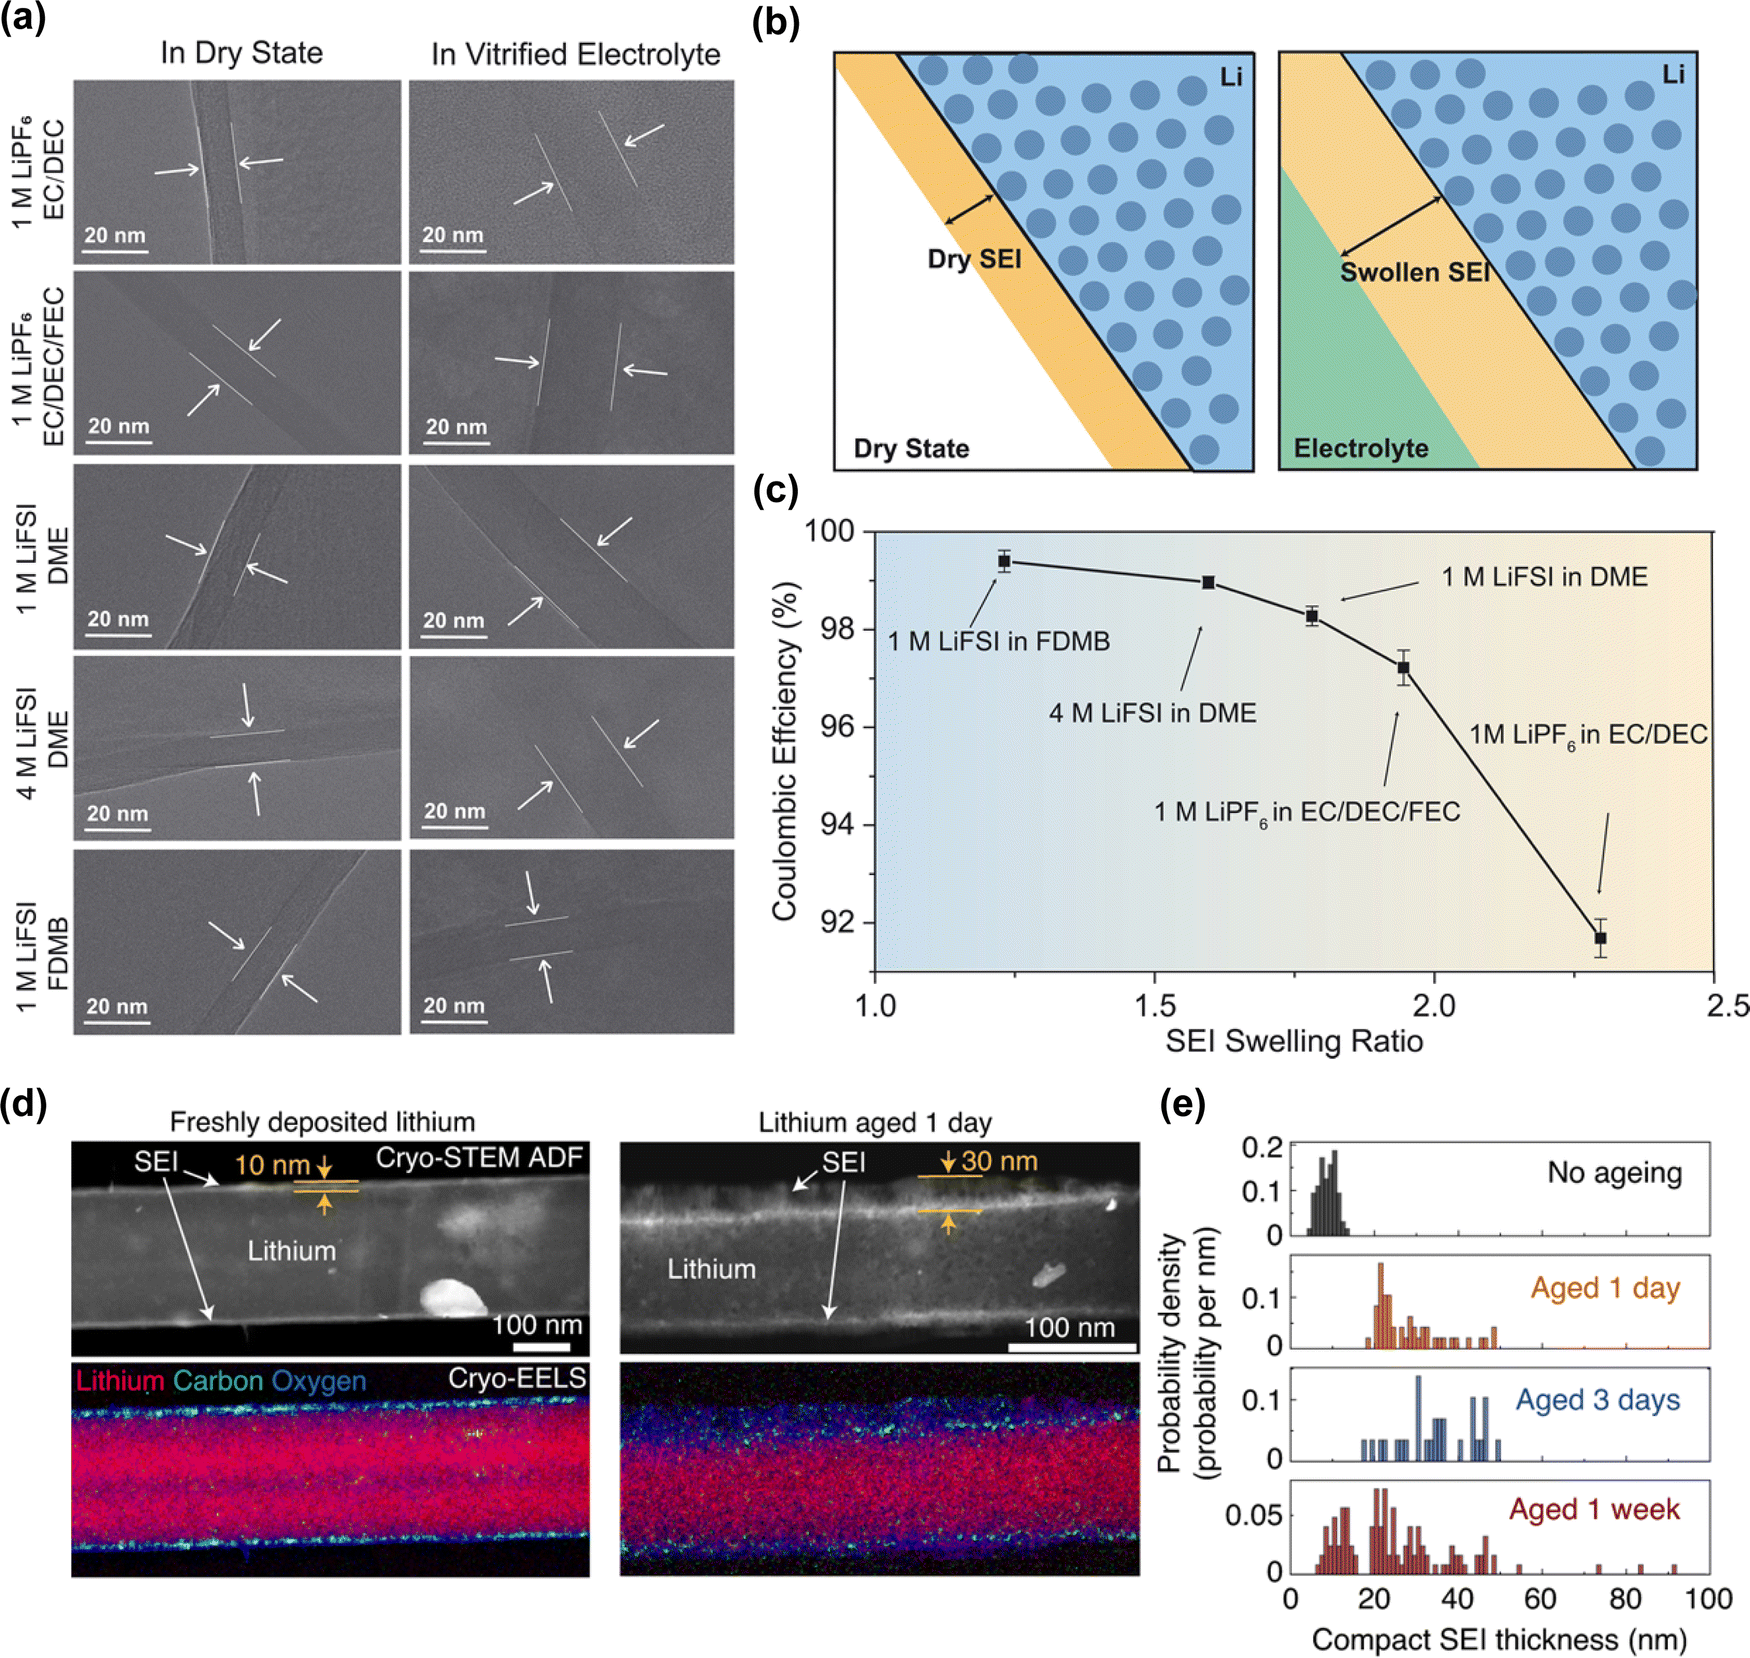 | ||
| Fig. 56 (a) and (b) Comparison of the SEI thickness in the dry state and in a vitrified electrolyte.621 (c) Correlation between the Coulombic efficiency of Li plating/stripping and the SEI swelling ratio in various electrolytes. Electrolytes providing high Coulombic efficiency in Li plating and stripping have a low SEI swelling ratio (SEI thickness in the dried state compared to that in the vitrified state in the electrolyte).621 (d) SEI growth on Li metal before and after calendar aging in LiPF6/ethylene carbonate:diethyl carbonate.622 (e) Histogram of the time-dependent change in the SEI thickness.622 An electrolyte design that suppresses changes in the SEI, such as swelling and dissolving, will ensure high Coulombic efficiency in batteries. Reprinted with permission from Science (a)–(c) and Nature Energy (d) and (e). | ||
As mentioned before, maintaining the SEI in aqueous electrolytes is even more challenging than forming an SEI (Fig. 57). Most SEI components easily dissolve in or are highly reactive in water. The high dielectric constant of water facilitates the rapid diffusion of SEI components into the bulk electrolyte. Moreover, the diameter of water molecules is 2.75 Å, almost similar to the diameter of hydrated alkali ions (Stokes radius in Table 2), indicating that water molecules can be easily inserted into the SEI. The thickness of the SEI formed in aqueous electrolytes is generally several ten to hundred times higher than that formed in nonaqueous electrolytes.20 The generation of hydrogen gas due to the reduction of water molecules causes exfoliation of the SEI from the electrode surface. The difficulty in SEI formation and the maintenance of the SEI in aqueous systems can also be inferred from the poor initial Coulombic efficiency (70–80%) related to SEI formation in aqueous alkali-ion (Li+, Na+, and K+) batteries.
 | ||
| Fig. 57 Various SEI degradation modes in aqueous electrolytes. | ||
The formation and maintenance of the SEI might be relatively easier in hybrid aqueous/nonaqueous electrolytes. However, introducing co-solvents with higher reduction potentials than water to force the formation of solvent-derived SEIs has rarely been attempted. In most cases, the addition of co-solvents aimed to reduce the water activity by decreasing the amount of water in the system and through the realization of various hydrogen bond-related effects, as described in Section 6.3. This suggests that the higher HER overpotential on Zn metal might be a predominant cause for the improved Coulombic efficiency in hybrid aqueous/nonaqueous electrolytes rather than SEI formation.
Additionally, hybrid Zn electrolytes typically demonstrate high initial efficiencies of over 90%. This is similar to the initial Coulombic efficiency obtained in nonaqueous Li electrolytes with a graphite anode, which has a small surface area and undergoes a slight (10%) volume change during charging and discharging, thus forming a few-nanometer-thick SEI. However, TEM observations showed thick layers, with thicknesses ranging from tens to thousands of nanometers, on cycled Zn metal in hybrid aqueous/nonaqueous Zn electrolytes (Fig. 55). This indicates that the observed thick layers might not be part of the SEI but have originated as a result of irreversible chemical side reactions.
Moreover, as described in Section 7.1, the conductivity of divalent ions within solids is significantly lower than that of monovalent (alkali) ions because the higher charge density of the former results in stronger Coulombic interactions with the surrounding ligands, hindering their movement.623–626 However, most studies have illustrated smooth Zn plating and stripping despite the presence of thick layers on Zn metal, which requires substantially high carrier ion conductivity. This directly or indirectly suggests that the electrolyte can still approach the electrode surface easily and that the formation a genuine SEI—an interphase that blocks electrolyte contact while allowing ion transport—on Zn metal is not yet certain.
The formation and functionalities of ZnF2-rich SEIs are also debatable. In many cases, X-ray photoelectron spectroscopy (XPS) has been used to confirm the presence of ZnF2 within the SEI. However, the decomposition of residual salts and solvents and their reduced fragments on the electrode sample during XPS measurements can produce a strong Zn–F signal, especially under Ar+ sputtering conditions.19,627,628 The concept of a F-rich SEI, an extension of ideas proposed for nonaqueous Li-ion/Li-metal batteries, might not simply apply to aqueous Zn-metal batteries. For example, both experimental and theoretical analyses have highlighted the effect of LiF in compacting the SEI by trapping other SEI components owing to the high electronegativity of fluorine.629,630 LiF has low solubility in organic solvents, allowing it to stably exist on the electrode surface and serve as an anchor, connecting the anode and SEI.631,632 In the LiF-rich SEI, Li+ are expected to conduct not through LiF itself but rather through other SEI components or at the grain boundary between LiF and other SEI components because of the significantly high migration barrier for Li+ within the LiF crystals.358,359,633–637 Importantly, various SEI components, which ensure a high Li+ conductivity, are present within the LiF-rich SEI, and the synergistic effect of these components with LiF contributes to the maintenance of the SEI and the improvement of the SEI functionalities.358,359,633–637
The migration of Zn2+ within ZnF2 encounters more resistance than the migration of Li+ within LiF, as multivalent ions typically exhibit higher migration resistance than alkali ions. Computational calculations of Zn2+ conduction on/within ZnF2-rich layers have often assumed direct contact between ZnF2 and Zn metal (details in Section 7.5).638–640 However, the layers formed on Zn metal are tens to thousands of nanometers thick, and most of the ZnF2 exists within the layer without direct contact with the Zn metal. Additionally, studies in other multivalent-ion systems (such as Ca2+ and Mg2+) have demonstrated that the use of imide salt-based electrolytes, which form F-rich SEIs, results in a high migration resistance of the carrier ions, leading to inferior Coulombic efficiency in plating and stripping.641–643 There is no evidence that Zn2+ can migrate rapidly within F-rich layers, unlike other multivalent ions (Ca2+ and Mg2+). Moreover, as discussed in Section 6, fluorinated compounds cannot stably exist on metal surfaces even in highly salt-concentrated aqueous electrolytes (Fig. 32). Furthermore, a synergistic effect with ZnF2 and other rapid Zn2+-conducting SEI components is hardly expected, as there have been limited reports of fast multivalent ion-conducting materials.623,625,644 Introducing borate salts into nonaqueous electrolytes provides high Coulombic efficiency in Ca and Mg plating/stripping reactions, forming the SEI with sufficient Ca2+ and Mg2+ transport.575,642–646 However, borate salts are prone to hydrolysis, rendering their use in aqueous systems challenging.
In summary, the presence and function of the SEI in aqueous Zn-metal batteries lack substantial supporting evidence. To summarize the rationale for this statement:
(1) The high redox potential of Zn metal provides insufficient thermodynamic driving force for anion-derived SEI formation.
(2) The high dielectric constant and small molecular size of water, along with hydrogen-gas generation from water reduction, critically hinder the maintenance of the SEI.
(3) ZnF2 has a high Zn2+ migration resistance and seldom interacts directly with the metal surface in thick SEI layers.
(4) It is unclear whether specific compounds that provide sufficient Zn2+ conductivity are abundantly present within the SEI.
The increased HER overpotential on Zn metal, induced by a high salt concentration; the deposits of electrolyte reduction products; and interactions among water, anions, co-solvents, and their reduction species on Zn metal and in the electrolyte might contribute more to suppressing the side reactions than the SEI. Further research on the formation, maintenance, and functionalities of the SEI in aqueous Zn-metal batteries, with a comprehensive understanding and careful investigation is needed.
7.5. Limited evidence on the effects of ex situ artificial SEIs and scaffolds
The challenges associated with forming an in situ SEI through electrolyte modification have driven the development of ex situ artificial SEIs and scaffolds designed to facilitate smooth Zn plating and stripping while preventing various side reactions.647–650Table 14 lists the types of ex situ artificial SEIs and scaffolds that have been introduced, along with their contributions to the Zn-metal stability. Although a considerable number of papers have been published on ex situ artificial SEIs and scaffolds, numerous questions about these technologies persist, some of which are listed below:| Year | Materials | Electrolytes | Cycle conditions | Cycle life (h) |
|---|---|---|---|---|
| 2018 | Active carbon651 | 0.4 M Zn(OTf)2 + 8 M NaClO4/H2O | 1.0 mA cm−2, 1.0 mA h cm−2 | 200 |
| 2.5 mA cm−2, 1.0 mA h cm−2 | 300 | |||
| 2018 | Reduced graphene oxide652 | 1 M ZnSO4/H2O | 1.0 mA cm−2, 2.0 mA h cm−2 | 200 |
| 2.0 mA cm−2, 2.0 mA h cm−2 | 200 | |||
| 5.0 mA cm−2, 2.0 mA h cm−2 | 200 | |||
| 10 mA cm−2, 2.0 mA h cm−2 | 200 | |||
| 2019 | Carbon nanotube653 | 2 M ZnSO4/H2O | 2.0 mA cm−2, 2.0 mA h cm−2 | 200 |
| 5.0 mA cm−2, 2.5 mA h cm−2 | 150 | |||
| 2019 | Reduced graphene oxide654 | 0.5 M ZnSO4/H2O | 0.2 mA cm−2, 0.2 mA h cm−2 | 2000 |
| 0.4 mA cm−2, 0.4 mA h cm−2 | 2000 | |||
| 1.0 mA cm−2, 1.0 mA h cm−2 | 1200 | |||
| 2020 | ZIF-8 metal organic framework-derived carbon655 | 1 M ZnSO4/H2O | 1.0 mA cm−2, 1.0 mA h cm−2 | 400 |
| 2.0 mA cm−2, 2.0 mA h cm−2 | 400 | |||
| 5.0 mA cm−2, 5.0 mA h cm−2 | 400 | |||
| 10 mA cm−2, 10 mA h cm−2 | 400 | |||
| 2020 | Carbon nanotube656 | 2 M Zn(OTf)2/H2O | 0.1 mA cm−2, 0.5 mA h cm−2 | 1800 |
| 2020 | Graphite657 | 2 M ZnSO4/H2O | 0.1 mA cm−2, 0.1 mA h cm−2 | 200 |
| 2021 | Carbon fiber/carbon658 | 3 M Zn(OTf)2/H2O | 0.25 mA cm−2, 0.125 mA h cm−2 | 200 |
| 2021 | N-Doped graphene oxide659 | 2 M ZnSO4/H2O | 1.0 mA cm−2, 1.0 mA h cm−2 | 1200 |
| 5.0 mA cm−2, 5.0 mA h cm−2 | 300 | |||
| 2023 | Fullerene C60660 | 2 M ZnSO4/H2O | 0.25 mA cm−2, 0.25 mA h cm−2 | 3800 |
| 2.0 mA cm−2, 1.0 mA h cm−2 | 2000 | |||
| 2023 | 20 nm carbon661 | 2 M ZnSO4/H2O | 0.5 mA cm−2, 0.5 mA h cm−2 | 3500 |
| 1.0 mA cm−2, 1.0 mA h cm−2 | 3500 | |||
| 2.0 mA cm−2, 2.0 mA h cm−2 | 3500 | |||
| 2023 | Hollow porous carbon nanospheres662 | 2 M ZnSO4/H2O | 1.0 mA cm−2, 1.0 mA h cm−2 | 2700 |
| 5.0 mA cm−2, 1.0 mA h cm−2 | 1515 | |||
| 10 mA cm−2, 10 mA h cm−2 | 280 | |||
| 2023 | β-Cyclodextrin-carbon nanotube663 | 1 M ZnSO4/H2O | 5.0 mA cm−2, 1.0 mA h cm−2 | 1000 |
| 10 mA cm−2, 2.0 mA h cm−2 | 350 | |||
| 2018 | TiO2611 | 3 M Zn(OTf)2/H2O | 1.0 mA cm−2, 1.0 mA h cm−2 | 150 |
| 2018 | CaCO3664 | 3 M ZnSO4 + 0.1 M MnSO4/H2O | 0.25 mA cm−2, 0.05 mA h cm−2 | 836 |
| SiO2664 | 0.25 mA cm−2, 0.05 mA h cm−2 | 200–250 | ||
| Acetylene black664 | 0.25 mA cm−2, 0.05 mA h cm−2 | 400 | ||
| 2019 | Au665 | 3 M ZnSO4/H2O | 0.25 mA cm−2, 0.05 mA h cm−2 | 2000 |
| 2019 | ZnO666 | 2 M ZnSO4 + 0.1 M MnSO4/H2O | 5.0 mA cm−2, 1.25 mA h cm−2 | 500 |
| 2020 | In667 | 2 M ZnSO4/H2O | 0.2 mA cm−2, 0.2 mA h cm−2 | 1500 |
| 1.0 mA cm−2, 1.0 mA h cm−2 | 500 | |||
| 2020 | In668 | 2 M ZnSO4/H2O | 0.25 mA cm−2, 0.05 mA h cm−2 | 1400 |
| 1.0 mA cm−2, 1.0 mA h cm−2 | 300 | |||
| 4.0 mA cm−2, 1.0 mA h cm−2 | 400 | |||
| 2020 | Cu669 | 3 M ZnSO4/H2O | 1.0 mA cm−2, 0.5 mA h cm−2 | 1500 |
| 2020 | ZnS670 | 1 M ZnSO4/H2O | 2.0 mA cm−2, 2.0 mA h cm−2 | 1100 |
| 2020 | TiO2671 | 1 M ZnSO4/H2O | 1.0 mA cm−2, 1.0 mA h cm−2 | 460 |
| 2.0 mA cm−2, 2.0 mA h cm−2 | 280 | |||
| 2020 | Zn88Al12672 | O2 free – 2 M ZnSO4/H2O | 0.5 mA cm−2, 0.5 mA h cm−2 | 2000 |
| 2020 | ZnO2673 | 1 M Zn(OTf)2/H2O | 0.2 mA cm−2, 0.2 mA h cm−2 | 1000 |
| 1.0 mA cm−2, 1.0 mA h cm−2 | 400 | |||
| 5.0 mA cm−2, 2.5 mA h cm−2 | 100 | |||
| 2020 | Al2O3674 | 3 M Zn(OTf)2/H2O | 1.0 mA cm−2, 1.0 mA h cm−2 | 500 |
| 2020 | Kaolin (Al2Si2O5(OH)4)675 | 2 M ZnSO4/H2O | 4.4 mA cm−2, 1.1 mA h cm−2 | 800 |
| 2020 | ZrO2676 | 2 M ZnSO4/H2O | 0.25 mA cm−2, 0.125 mA h cm−2 | 3800 |
| 5.0 mA cm−2, 1.0 mA h cm−2 | 2100 | |||
| 2020 | NaTi2(PO4)3677 | 2 M ZnSO4/H2O | 1.0 mA cm−2, 1.0 mA h cm−2 | 250 |
| 2021 | Cu678 | 3 M ZnSO4 + 0.1 M MnSO4/H2O | 1.0 mA cm−2, 1.0 mA h cm−2 | 5000 |
| 5.0 mA cm−2, 2.0 mA h cm−2 | 1500 | |||
| 2021 | In679 | 3 M ZnSO4/H2O | 1.0 mA cm−2, 0.5 mA h cm−2 | 700 |
| 20 mA cm−2, 20 mA h cm−2 | 80 | |||
| 2021 | Ag680 | 3 M Zn(OTf)2/H2O | 0.2 mA cm−2, 0.2 mA h cm−2 | 1450 |
| 1.0 mA cm−2, 1.0 mA h cm−2 | 350 | |||
| 2.0 mA cm−2, 2.0 mA h cm−2 | 150 | |||
| 2021 | Sn681 | 1 M ZnSO4/H2O | 0.5 mA cm−2, 1.0 mA h cm−2 | 500 |
| 2021 | Sn682 | 2 M ZnSO4/H2O | 1.0 mA cm−2, 0.5 mA h cm−2 | 500 |
| 2021 | Sn683 | 1 M ZnSO4/H2O | 1.0 mA cm−2, 1.0 mA h cm−2 | 800 |
| 2021 | Zn3Mn684 | 2 M ZnSO4/H2O | 80 mA cm−2, 16 mA h cm−2 | 750 |
| 2021 | Ga–In685 | 3 M ZnSO4/H2O | 0.25 mA cm−2, 0.05 mA h cm−2 | 2100 |
| 1.0 mA cm−2, 0.1 mA h cm−2 | 1250 | |||
| 5.0 mA cm−2, 0.1 mA h cm−2 | 370 | |||
| 2021 | Ga–In–Zn686 | 2 M ZnSO4/H2O | 1.0 mA cm−2, 0.5 mA h cm−2 | 500 |
| 2.5 mA cm−2, 2.5 mA h cm−2 | 200 | |||
| 2021 | ZnSe687 | 2 M ZnSO4/H2O | 0.5 mA cm−2, 1.0 mA h cm−2 | 450 |
| 1.0 mA cm−2, 1.0 mA h cm−2 | 1500 | |||
| 10 mA cm−2, 1.0 mA h cm−2 | 1500 | |||
| 10 mA cm−2, 5.0 mA h cm−2 | 160 | |||
| 2021 | ZnSe688 | 2 M ZnSO4/H2O | 1.0 mA cm−2, 1.0 mA h cm−2 | 1530 |
| 30 mA cm−2, 10 mA h cm−2 | 170 | |||
| 2021 | ZnSe689 | 2 M ZnSO4/H2O | 1.0 mA cm−2, 0.5 mA h cm−2 | 1700 |
| 2021 | Cu3N690 | 2 M ZnSO4/H2O | 0.5 mA cm−2, 0.5 mA h cm−2 | 800 |
| 2021 | TiN691 | 2 M ZnSO4/H2O | 1.0 mA cm−2, 1.0 mA h cm−2 | 2800 |
| 2.0 mA cm−2, 2.0 mA h cm−2 | 1000 | |||
| 5.0 mA cm−2, 0.5 mA h cm−2 | 500 | |||
| 2021 | Si3N/polyacrylonitrile692 | 2 M ZnSO4/H2O | 0.25 mA cm−2, 0.25 mA h cm−2 | 800 |
| 1.0 mA cm−2, 1.0 mA h cm−2 | 800 | |||
| 5.0 mA cm−2, 5.0 mA h cm−2 | 400 | |||
| 10 mA cm−2, 10 mA h cm−2 | 250 | |||
| 2021 | ZnP693 | 2 M ZnSO4/H2O | 2.0 mA cm−2, 0.5 mA h cm−2 | 3300 |
| 5.0 mA cm−2, 1.25 mA h cm−2 | 3200 | |||
| 10 mA cm−2, 2.5 mA h cm−2 | 1900 | |||
| 2021 | γ-Al2O3694 | 2 M ZnSO4/H2O | 1.0 mA cm−2, 0.5 mA h cm−2 | 300 |
| 2021 | BaTiO3695 | 2 M ZnSO4/H2O | 1.0 mA cm−2, 1.0 mA h cm−2 | 2000 |
| 5.0 mA cm−2, 2.5 mA h cm−2 | 1500 | |||
| 2021 | BaTiO3/polyvinylidene difluoride696 | 1 M ZnSO4 + 0.1 M MnSO4/H2O | 1.0 mA cm−2, 1.0 mA h cm−2 | 4100 |
| 10 mA cm−2, 2.0 mA h cm−2 | 1300 | |||
| 20 mA cm−2, 2.0 mA h cm−2 | 600 | |||
| 40 mA cm−2, 2.0 mA h cm−2 | 225 | |||
| 2021 | Sc2O3697 | 2 M ZnSO4 + 0.1 M MnSO4/H2O | 0.5 mA cm−2, 0.5 mA h cm−2 | 275 |
| 1.0 mA cm−2, 1.0 mA h cm−2 | 200 | |||
| 2.0 mA cm−2, 2.0 mA h cm−2 | 250 | |||
| 2021 | CeO2698 | 2 M ZnSO4 + 0.1 M MnSO4/H2O | 1.8 mA cm−2, 0.45 mA h cm−2 | 100 |
| 4.4 mA cm−2, 1.1 mA h cm−2 | 1200 | |||
| 2021 | CeO2699 | 2 M ZnSO4/H2O | 0.5 mA cm−2, 0.25 mA h cm−2 | 1300 |
| 5.0 mA cm−2, 2.5 mA h cm−2 | 1300 | |||
| 2021 | HfO2700 | 2 M ZnSO4/H2O | 0.4 mA cm−2, 0.1 mA h cm−2 | 250 |
| 2021 | ZnxV2O5·nH2O701 | 2 M ZnSO4/H2O | 0.25 mA cm−2, 0.05 mA h cm−2 | 570 |
| 2021 | Mg0.667Al0.333(OH)2(CO3)0.167(H2O)0.5702 | 2 M ZnSO4/H2O | 0.5 mA cm−2, 0.5 mA h cm−2 | 1450 |
| 1.0 mA cm−2, 1.0 mA h cm−2 | 400 | |||
| 2.0 mA cm−2, 1.0 mA h cm−2 | 400 | |||
| 5.0 mA cm−2, 1.0 mA h cm−2 | 400 | |||
| 2021 | ZnF2640 | 2 M ZnSO4/H2O | 0.5 mA cm−2, 1.0 mA h cm−2 | 500 |
| 1.0 mA cm−2, 1.0 mA h cm−2 | 800 | |||
| 10 mA cm−2, 1.0 mA h cm−2 | 500 | |||
| 2021 | ZnF2639 | 2 M ZnSO4/H2O | 1.0 mA cm−2, 1.0 mA h cm−2 | 2500 |
| 2.0 mA cm−2, 1.0 mA h cm−2 | 2500 | |||
| 5.0 mA cm−2, 1.0 mA h cm−2 | 2500 | |||
| 2021 | ZnF2638 | 2 M ZnSO4/H2O | 0.5 mA cm−2, 0.5 mA h cm−2 | 700 |
| 2021 | ZnF2/Zn3(PO4)2/CFx703 | 2 M ZnSO4/H2O | 1.0 mA cm−2, 2.0 mA h cm−2 | 500 |
| 14.2 mA cm−2, 7.1 mA h cm−2 | 187 | |||
| 2021 | Zn–Sb3P2O14704 | 3 M ZnSO4 + 0.1 M MnSO4/H2O | 1.0 mA cm−2, 1.0 mA h cm−2 | 1300 |
| 10 mA cm−2, 10 mA h cm−2 | 450 | |||
| 2022 | ZnF2/Ag705 | 2 M ZnSO4/H2O | 2.0 mA cm−2, 2.0 mA h cm−2 | 2200 |
| 5.0 mA cm−2, 10 mA h cm−2 | 140 | |||
| 0.25 mA cm−2, 0.25 mA h cm−2 (−40 °C) | 1600 | |||
| 2022 | ZnF2/Cu706 | 1 M ZnSO4/H2O | 1.0 mA cm−2, 1.0 mA h cm−2 | 2000 |
| 3.0 mA cm−2, 3.0 mA h cm−2 | 700 | |||
| 2022 | MgF2707 | 1 M Zn(OTf)2/H2O | 1.0 mA cm−2, 1.0 mA h cm−2 | 500 |
| 10 mA cm−2, 1.0 mA h cm−2 | 1600 | |||
| 2022 | In708 | 2 M ZnSO4/H2O | 1.0 mA cm−2, 0.5 mA h cm−2 | 9400 |
| 5.0 mA cm−2, 0.5 mA h cm−2 | 8000 | |||
| 2022 | Sn709 | 2 M ZnSO4/H2O | 0.5 mA cm−2, 0.5 mA h cm−2 | 1200 |
| 2022 | Sb710 | 2 M ZnSO4/H2O | 1.0 mA cm−2, 1.0 mA h cm−2 | 800 |
| 3.0 mA cm−2, 1.0 mA h cm−2 | 1000 | |||
| 2022 | Zn73Al27711 | 2 M ZnSO4/H2O | 1.0 mA cm−2, 1.0 mA h cm−2 | 3000 |
| 5.0 mA cm−2, 1.0 mA h cm−2 | 480 | |||
| 2.0 mA cm−2, 0.5 mA h cm−2 | 400 | |||
| 2.0 mA cm−2, 2.0 mA h cm−2 | 500 | |||
| 2022 | ZnMoO4712 | 3 M ZnSO4/H2O | 0.25 mA cm−2, 0.125 mA h cm−2 | 1000 |
| 1.0 mA cm−2, 1.0 mA h cm−2 | 2000 | |||
| 10 mA cm−2, 1.0 mA h cm−2 | 10000 |
|||
| 2022 | Zn3(OH)2V2O7·2H2O713 | 2 M ZnSO4/H2O | 1.0 mA cm−2, 0.5 mA h cm−2 | 2000 |
| 2.0 mA cm−2, 1.0 mA h cm−2 | 1100 | |||
| 10 mA cm−2, 1.0 mA h cm−2 | 1000 | |||
| 2022 | Zn3(PO4)2/Nafion714 | 1 M ZnSO4/H2O | 0.5 mA cm−2, 0.25 mA h cm−2 | 2800 |
| 2.0 mA cm−2, 1.0 mA h cm−2 | 900 | |||
| 2022 | KTa0.54Nb0.46O3715 | 1 M ZnSO4/H2O | 1.0 mA cm−2, 1.0 mA h cm−2 | 1200 |
| 2.0 mA cm−2, 1.0 mA h cm−2 | 800 | |||
| 2022 | ZrP716 | 2 M ZnSO4/H2O | 0.5 mA cm−2, 1.0 mA h cm−2 | 780 |
| 5.0 mA cm−2, 1.0 mA h cm−2 | 780 | |||
| 10 mA cm−2, 1.0 mA h cm−2 | 350 | |||
| 2022 | n-Butylamine intercalated α-ZrP717 | 2 M ZnSO4/H2O | 6.0 mA cm−2, 1.0 mA h cm−2 | 3000 |
| 6.0 mA cm−2, 3.0 mA h cm−2 | 450 | |||
| 10 mA cm−2, 10 mA h cm−2 | 80 | |||
| 2022 | MoS2718 | 1 M ZnSO4 + 1 M MnSO4/H2O | 2.5 mA cm−2, 0.416 mA h cm−2 | 170 |
| 2023 | Fe64Ni36719 | 3 M ZnSO4/H2O | 0.5 mA cm−2, 0.5 mA h cm−2 | 700 |
| 2023 | Cu720 | 2 M ZnSO4/H2O | 0.2 mA cm−2, 0.2 mA h cm−2 | 1200 |
| 1.0 mA cm−2, 0.2 mA h cm−2 | 400 | |||
| 2023 | Au721 | 1 M ZnSO4/H2O | 5.0 mA cm−2, 1.0 mA h cm−2 | 1200 |
| 10 mA cm−2, 1.0 mA h cm−2 | 1200 | |||
| 20 mA cm−2, 1.0 mA h cm−2 | 1200 | |||
| 50 mA cm−2, 1.0 mA h cm−2 | 200 | |||
| 5.0 mA cm−2, 10 mA h cm−2 | 500 | |||
| 20 mA cm−2, 10 mA h cm−2 | 500 | |||
| 2023 | Sn/Cu/reduced graphene oxide722 | 2 M ZnSO4/H2O | 0.5 mA cm−2, 1.0 mA h cm−2 | 3000 |
| 2.0 mA cm−2, 1.0 mA h cm−2 | 3500 | |||
| 10 mA cm−2, 1.0 mA h cm−2 | 1600 | |||
| 10 mA cm−2, 10 mA h cm−2 | 250 | |||
| 2023 | Si/polyvinylidene fluoride723 | 3 M ZnSO4/H2O | 0.25 mA cm−2, 0.05 mA h cm−2 | 3800 |
| 2023 | Cu–Zn/polyvinyl butyral724 | 2 M ZnSO4/H2O | 0.5 mA cm−2, 0.5 mA h cm−2 | 2750 |
| 2023 | SnSb/Nafion725 | 3 M ZnSO4/H2O | 1.0 mA cm−2, 1.0 mA h cm−2 | 1500 |
| 6.0 mA cm−2, 1.0 mA h cm−2 | 650 | |||
| 5.0 mA cm−2, 5.0 mA h cm−2 | 350 | |||
| 10 mA cm−2, 10 mA h cm−2 | 180 | |||
| 2023 | SiO2–OH726 | 2 M ZnSO4/H2O | 1.0 mA cm−2, 1.0 mA h cm−2 | 3400 |
| 10 mA cm−2, 1.0 mA h cm−2 | 2500 | |||
| 2023 | β″-Al2O3727 | 2 M ZnSO4/H2O | 1.0 mA cm−2, 1.0 mA h cm−2 | 1600 |
| 2.0 mA cm−2, 1.0 mA h cm−2 | 1125 | |||
| 4.0 mA cm−2, 1.0 mA h cm−2 | 1200 | |||
| 10 mA cm−2, 1.0 mA h cm−2 | 750 | |||
| 2023 | HfO2−x728 | 2 M ZnSO4/H2O | 1.0 mA cm−2, 1.0 mA h cm−2 | 5000 |
| 5.0 mA cm−2, 1.0 mA h cm−2 | 2100 | |||
| 2023 | SrTiO3729 | 2 M ZnSO4/H2O | 0.5 mA cm−2, 0.5 mA h cm−2 | 4000 |
| 1.0 mA cm−2, 1.0 mA h cm−2 | 3000 | |||
| 2.0 mA cm−2, 2.0 mA h cm−2 | 700 | |||
| 5.0 mA cm−2, 5.0 mA h cm−2 | 400 | |||
| 2023 | ZnO730 | 2 M ZnSO4/H2O | 1.0 mA cm−2, 1.0 mA h cm−2 | 1500 |
| 20 mA cm−2, 10 mA h cm−2 | 600 | |||
| 2023 | ZnP731 | 2 M ZnSO4/H2O | 1.0 mA cm−2, 1.0 mA h cm−2 | 2000 |
| 10 mA cm−2, 5.0 mA h cm−2 | 1260 | |||
| 20 mA cm−2, 10 mA h cm−2 | 100 | |||
| 2024 | ZnO/carbon fiber732 | 2 M ZnSO4/H2O | 0.2 mA cm−2, 0.2 mA h cm−2 | 4000 |
| 1.0 mA cm−2, 1.0 mA h cm−2 | 1000 | |||
| 5.0 mA cm−2, 2.5 mA h cm−2 | 950 | |||
| 20 mA cm−2, 10 mA h cm−2 | 1750 | |||
| 30 mA cm−2, 15 mA h cm−2 | 1800 | |||
| 2024 | Fe–N-porous carbon733 | 2 M ZnSO4/H2O | 10 mA cm−2, 1.0 mA h cm−2 | 430 |
| 2019 | UiO-66734 | 3 M ZnSO4 + 0.1 M MnSO4/H2O | 1.0 mA cm−2, 0.5 mA h cm−2 | 500 |
| 3.0 mA cm−2, 0.5 mA h cm−2 | 500 | |||
| 2020 | ZIF-7735 | 2 M ZnSO4/H2O | 0.5 mA cm−2, 0.5 mA h cm−2 | 3000 |
| 2020 | Zeolite/Nafion736 | 2 M ZnSO4/H2O | 1.0 mA cm−2, 0.5 mA h cm−2 | 1000 |
| 2.0 mA cm−2, 0.5 mA h cm−2 | 1000 | |||
| 5.0 mA cm−2, 0.5 mA h cm−2 | 10000 |
|||
| 1.0 mA cm−2, 10 mA h cm−2 | 1000 | |||
| 2020 | ZIF-8737 | 2 M ZnSO4/H2O | 2.0 mA cm−2, 1.0 mA h cm−2 | 1300 |
| 2.0 mA cm−2, 2.0 mA h cm−2 | 700 | |||
| 2021 | ZIF-8738 | 2 M ZnSO4/H2O | 0.5 mA cm−2, 0.5 mA h cm−2 | 2000 |
| 2.0 mA cm−2, 1.0 mA h cm−2 | 320 | |||
| 10 mA cm−2, 1.0 mA h cm−2 | 5000 | |||
| 2021 | Zn(benzene tricarboxylate)3739 | 2 M ZnSO4/H2O | 1.0 mA cm−2, 1.0 mA h cm−2 | 800 |
| 3.0 mA cm−2, 0.5 mA h cm−2 | 400 | |||
| 4.0 mA cm−2, 1.0 mA h cm−2 | 400 | |||
| 2021 | Covalent organic framework740 | 2 M ZnSO4/H2O | 1.0 mA cm−2, 1.0 mA h cm−2 | 420 |
| 2.0 mA cm−2, 1.0 mA h cm−2 | 260 | |||
| 2021 | Fluorinated covalent organic framework741 | 2 M ZnSO4/H2O | 5.0 mA cm−2, 1.0 mA h cm−2 | 1700 |
| 40 mA cm−2, 1.0 mA h cm−2 | 750 | |||
| 2021 | Montmorillonite742 | 2 M ZnSO4/H2O | 1.0 mA cm−2, 0.25 mA h cm−2 | 1000 |
| 10 mA cm−2, 45 mA h cm−2 | 1000 | |||
| 2021 | Zn–montmorillonite743 | 2 M ZnSO4/H2O | 1.0 mA cm−2, 0.5 mA h cm−2 | 900 |
| 2.0 mA cm−2, 0.5 mA h cm−2 | 700 | |||
| 2.0 mA cm−2, 1.0 mA h cm−2 | 700 | |||
| 2022 | ZIF-8744 | 2 M ZnSO4/H2O | 0.5 mA cm−2, 0.2 mA h cm−2 | 680 |
| 2022 | ZIF-8/graphene oxide745 | 2 M ZnSO4/H2O | 0.5 mA cm−2, 0.5 mA h cm−2 | 2200 |
| 10 mA cm−2, 0.5 mA h cm−2 | 2400 | |||
| 2022 | MCM-41 mesoporous molecular sieves746 | 3 M ZnSO4/H2O | 1.0 mA cm−2, 1.0 mA h cm−2 | 1800 |
| 2.0 mA cm−2, 2.0 mA h cm−2 | 1500 | |||
| 5.0 mA cm−2, 1.0 mA h cm−2 | 2200 | |||
| 2022 | Covalent organic framework (TpPa-SO3H)747 | 1 M ZnSO4/H2O | 1.0 mA cm−2, 5.0 mA h cm−2 | 1000 |
| 5.0 mA cm−2, 5.0 mA h cm−2 | 1000 | |||
| 2023 | Sn-MCM-41/polyvinylidene fluoride748 | 2 M ZnSO4/H2O | 0.4 mA cm−2, 0.2 mA h cm−2 | 1400 |
| 2023 | UiO-66-(COOH)2749 | 2 M ZnSO4/H2O | 2.0 mA cm−2, 2.0 mA h cm−2 | 2800 |
| 5.0 mA cm−2, 5.0 mA h cm−2 | 800 | |||
| 10 mA cm−2, 10 mA h cm−2 | 400 | |||
| 2023 | ZIF-8750 | 2 M ZnSO4/H2O | 1.0 mA cm−2, 1.0 mA h cm−2 | 1100 |
| 5.0 mA cm−2, 5.0 mA h cm−2 | 600 | |||
| 2023 | UiO-66-(COOH)2751 | 2 M ZnSO4/H2O | 1.0 mA cm−2, 1.0 mA h cm−2 | 2700 |
| 5.0 mA cm−2, 5.0 mA h cm−2 | 1600 | |||
| 2019 | Polyamide752 | 2 M ZnSO4/H2O | 0.5 mA cm−2, 0.25 mA h cm−2 | 8000 |
| 2020 | Polypyrrole753 | 2 M ZnSO4/H2O | 2.0 mA cm−2, 1.0 mA h cm−2 | 540 |
| 2020 | Polyvinyl butyral444 | 1 M ZnSO4/H2O | 0.5 mA cm−2, 0.5 mA h cm−2 | 2200 |
| 2020 | Polyacrylamide/polyvinylpyrrolidone754 | 3 M Zn(OTf)2/H2O | 0.2 mA cm−2, 0.1 mA h cm−2 | 2200 |
| 2021 | (3-Aminopropyl)triethoxysilane755 | 2 M ZnSO4/H2O | 2.0 mA cm−2, 0.5 mA h cm−2 | 3500 |
| 20 mA cm−2, 5.0 mA h cm−2 | 600 | |||
| 2021 | Lignin756 | 2 M ZnSO4/H2O | 2.0 mA cm−2, 2.0 mA h cm−2 | 650 |
| 5.0 mA cm−2, 2.0 mA h cm−2 | 400 | |||
| 2021 | β-Polyvinylidene difluoride757 | 2 M ZnSO4/H2O | 0.25 mA cm−2, 0.05 mA h cm−2 | 2000 |
| 1.5 mA cm−2, 0.3 mA h cm−2 | 100 | |||
| 0.25 mA cm−2, 0.5 mA h cm−2 | 100 | |||
| 2021 | Poly(vinylidene fluoride-trifluoroethylene)758 | 2 M ZnSO4/H2O | 0.2 mA cm−2, 0.2 mA h cm−2 | 2000 |
| 2021 | Polyacrylonitrile759 | 2 m Zn(OTf)2/H2O | 1.0 mA cm−2, 1.0 mA h cm−2 | 1100 |
| 2021 | Poly(2,5-dihydroxy-1,4-benzoquinonyl sulfide)760 | 2 M ZnSO4/H2O | 1.0 mA cm−2, 1.0 mA h cm−2 | 100 |
| 2021 | Cross-linked polymer (self-healable ion regulator)761 | 2 M ZnSO4/H2O | 2.0 mA cm−2, 2.0 mA h cm−2 | 3500 |
| 5.0 mA cm−2, 20 mA h cm−2 | 950 | |||
| 10 mA cm−2, 10 mA h cm−2 | 2000 | |||
| 2021 | Cross-linked gelatin603 | 1 M Zn(OTf)2/H2O | 1.0 mA cm−2, 1.0 mA h cm−2 | 4000 |
| 2021 | Bacterial cellulose762 | 2 M ZnSO4/H2O | 0.5 mA cm−2, 0.25 mA h cm−2 | 3000 |
| 5.0 mA cm−2, 2.5 mA h cm−2 | 570 | |||
| 5.0 mA cm−2, 5.0 mA h cm−2 | 300 | |||
| 2022 | Alginate – thermoplastic polyurethane763 | 2 M ZnSO4/H2O | 5.0 mA cm−2, 5.0 mA h cm−2 | 1200 |
| 10 mA cm−2, 10 mA h cm−2 | 500 | |||
| 2022 | Zinc alginate gel764 | 2 M ZnSO4/H2O | 1.0 mA cm−2, 1.0 mA h cm−2 | 500 |
| 2022 | Polyvinyl alcohol607 | 2 M Zn(OTf)2/H2O | 0.25 mA cm−2, 0.25 mA h cm−2 | 5000 |
| 1.0 mA cm−2, 1.0 mA h cm−2 | 2200 | |||
| 2023 | Polyvinylidene difluoride765 | 3 M ZnSO4/H2O | 1.0 mA cm−2, 1.0 mA h cm−2 | 5000 |
| 5.0 mA cm−2, 5.0 mA h cm−2 | 970 | |||
| 10 mA cm−2, 10 mA h cm−2 | 350 | |||
| 2023 | Chitosan/sodium alginate766 | 2 M ZnSO4/H2O | 1.0 mA cm−2, 1.0 mA h cm−2 | 6700 |
| 5.0 mA cm−2, 2.5 mA h cm−2 | 1750 | |||
| 10 mA cm−2, 10 mA h cm−2 | 250 | |||
| 2023 | Proteins (silk fibroin/lysozyme)767 | 2 M ZnSO4/H2O | 1.0 mA cm−2, 1.0 mA h cm−2 | 7000 |
| 5.0 mA cm−2, 5.0 mA h cm−2 | 2000 | |||
| 10 mA cm−2, 10 mA h cm−2 | 1100 | |||
| 2023 | Carboxymethyl cellulose768 | 1.5 M ZnSO4/H2O | 1.0 mA cm−2, 0.1 mA h cm−2 | 200 |
| 2023 | Poly(vinylidene fluoride-hexafluoro propylene) codoped with poly(ethylene oxide)/Zn–montmorillonite608 | 2 M Zn(OTf)2/H2O | 0.25 mA cm−2, 0.25 mA h cm−2 | 6000 |
| 1.0 mA cm−2, 1.0 mA h cm−2 | 3250 | |||
| 5.0 mA cm−2, 1.0 mA h cm−2 | 2000 | |||
| 2023 | Polyglycidyl methacrylate/polyethylene glycol diamine/polyvinylidene fluoride769 | 2 M ZnSO4 + 0.1 M MnSO4/H2O | 0.5 mA cm−2, 0.5 mA h cm−2 | 2370 |
| 1.0 mA cm−2, 1.0 mA h cm−2 | 1280 | |||
| 5.0 mA cm−2, 2.5 mA h cm−2 | 160 | |||
| 2023 | Polyvinyl-phosphonic acrylamide/Zn770 | 2 M ZnSO4/H2O | 0.5 mA cm−2, 0.25 mA h cm−2 | 6000 |
| 5.0 mA cm−2, 2.5 mA h cm−2 | 1092 | |||
| 2023 | Cellulose/Al(OH)3/polytetrafluoroethylene612 | 3 M Zn(OTf)2/H2O | 1.0 mA cm−2, 0.16 mA h cm−2 | 1000 |
| 2.5 mA cm−2, 0.5 mA h cm−2 | 260 | |||
| 2023 | Polymerized 2-methacryloyloxyethyl phosphorylcholine/carboxymethyl chitosan771 | 2 M ZnSO4/H2O | 40 mA cm−2, 1.0 mA h cm−2 | 1000 |
| 40 mA cm−2, 10 mA h cm−2 | 325 | |||
| 2023 | 1,3,5,9-Tetrathiophenylpyrene772 | 2 M ZnSO4/H2O | 0.885 mA cm−2, 0.885 mA h cm−2 | 1000 |
| 2019 | Ti3C2Tx773 | 2 M ZnSO4/H2O | 1.0 mA cm−2, 1.0 mA h cm−2 | 300 |
| 2.0 mA cm−2, 4.0 mA h cm−2 | 180 | |||
| 2020 | Hydrogen-substituted graphdiyne774 | 2 M ZnSO4/H2O | 0.5 mA cm−2, 0.1 mA h cm−2 | 2400 |
| 1.0 mA cm−2, 0.1 mA h cm−2 | 2400 | |||
| 2.0 mA cm−2, 0.1 mA h cm−2 | 2400 | |||
| 2021 | Ti3C2Tx/Sb775 | 2 M ZnSO4/H2O | 0.5 mA cm−2, 0.5 mA h cm−2 | 1000 |
| 2.0 mA cm−2, 2.0 mA h cm−2 | 550 | |||
| 5.0 mA cm−2, 5.0 mA h cm−2 | 550 | |||
| 2021 | Ti3C2Tx/ZnS776 | 2 M ZnSO4/H2O | 0.5 mA cm−2, 0.5 mA h cm−2 | 4600 |
| 1.0 mA cm−2, 0.5 mA h cm−2 | 1100 | |||
| 1.0 mA cm−2, 1.0 mA h cm−2 | 1100 | |||
| 5.0 mA cm−2, 5.0 mA h cm−2 | 400 | |||
| 10 mA cm−2, 1.0 mA h cm−2 | 180 | |||
| 2021 | Graphitic carbon nitride (g-C3N4)777 | 2 M ZnSO4/H2O | 2.0 mA cm−2, 2.0 mA h cm−2 | 500 |
| 10 mA cm−2, 5.0 mA h cm−2 | 120 | |||
| 2021 | Sulfonate group-modified boron nitride778 | 2 M ZnSO4/H2O | 2.0 mA cm−2, 2.0 mA h cm−2 | 2500 |
| 5.0 mA cm−2, 2.5 mA h cm−2 | 1000 | |||
| 10 mA cm−2, 10 mA h cm−2 | 350 | |||
| 2022 | N/Se–Ti3C2Tx/ZnSe779 | 2 M ZnSO4/H2O | 1.0 mA cm−2, 1.0 mA h cm−2 | 2500 |
| 2.0 mA cm−2, 1.0 mA h cm−2 | 1500 | |||
| 5.0 mA cm−2, 5.0 mA h cm−2 | 700 | |||
| 10 mA cm−2, 10 mA h cm−2 | 800 | |||
| 2022 | Ti3C2Tx/chitosan780 | 2 M ZnSO4/H2O | 0.5 mA cm−2, 0.5 mA h cm−2 | 1350 |
| 1.0 mA cm−2, 1.0 mA h cm−2 | 2100 | |||
| 5.0 mA cm−2, 1.0 mA h cm−2 | 270 | |||
| 2022 | Ti3C2Tx/polypyrrole781 | 2 M ZnSO4/H2O | 0.2 mA cm−2, 0.2 mA h cm−2 | 2500 |
| 2022 | Ti3C2Tx/reduced graphene oxide782 | 2 M ZnSO4/H2O | 10 mA cm−2, 1.0 mA h cm−2 | 1050 |
| 2022 | Boron nitride783 | 2 M ZnSO4/H2O | 1.0 mA cm−2, 1.0 mA h cm−2 | 3000 |
| 5.0 mA cm−2, 2.5 mA h cm−2 | 1600 | |||
| 1.0 mA cm−2, 1.0 mA h cm−2 (−10 °C) | 300 | |||
| 2022 | Boron nitride784 | 2 M ZnSO4/H2O | 1.0 mA cm−2, 0.5 mA h cm−2 | 1600 |
| 2.0 mA cm−2, 2.0 mA h cm−2 | 500 | |||
| 5.0 mA cm−2, 2.0 mA h cm−2 | 600 | |||
| 10 mA cm−2, 2.0 mA h cm−2 | 600 | |||
| 2023 | Graphdiyne785 | 2 M ZnSO4/H2O | 0.1 mA cm−2, 1.0 mA h cm−2 | 600 |
| 2022 | Phytic acid786 | 2 M ZnSO4/H2O | 2.0 mA cm−2, 1.0 mA h cm−2 | 1400 |
| 5.0 mA cm−2, 2.5 mA h cm−2 | 850 | |||
| 8.0 mA cm−2, 4.0 mA h cm−2 | 450 | |||
| 2022 | Phytic acid787 | 2 M ZnSO4/H2O | 0.5 mA cm−2, 0.25 mA h cm−2 | 2000 |
| 5.0 mA cm−2, 2.5 mA h cm−2 | 1800 | |||
| 2022 | Phosphoric acid788 | 1 M ZnSO4/H2O | 5.0 mA cm−2, 1.0 mA h cm−2 | 2400 |
| 10 mA cm−2, 1.0 mA h cm−2 | 1100 | |||
| 20 mA cm−2, 1.0 mA h cm−2 | 780 | |||
| 2023 | Polyphosphoric acid789 | 2 M ZnSO4/H2O | 2.0 mA cm−2, 1.0 mA h cm−2 | 6500 |
| 10 mA cm−2, 1.0 mA h cm−2 | 800 | |||
| 10 mA cm−2, 5.0 mA h cm−2 | 300 |
(1) Among the commonly discussed mechanisms, which factor (e.g., hydrophobic binder, electrolyte wettability, nucleation overpotential, and distribution of Zn2+ and electrons) is the most crucial for stable Zn plating and stripping?
(2) Why are there only a handful of studies conducted under practical conditions, where a substantial amount of Zn2+ is involved in plating and stripping with a high state of charge and depth of discharge?
(3) Can ex situ artificial SEIs ensure sufficient Zn2+ conductivity?
(4) Is delaying a short circuit of the battery using three-dimensional scaffolds more important than their potential for accelerating electrolyte reduction due to the increased surface area of plated Zn?
All these questions highlight the persistent need for extensive research from both scientific and practical perspectives. Before delving into detailed discussions, an overview of the research conducted on ex situ artificial SEIs and scaffolds will be presented.
In 2018, Wang and Jiang's group were successful in enhancing the Zn-metal stability by coating it with a 90 µm-thick porous carbon film, which endowed high electrical conductivity and chemical stability (Fig. 58).651 This treatment facilitated homogeneous current distribution, enabling uniform Zn deposition without dendrite formation. In symmetric cell tests using a 0.4 M Zn(OTf)2 + 8 M NaClO4/H2O electrolyte at 2.5 mA cm−2 and 1.0 mA h cm−2, the carbon-coated Zn metal demonstrated stable cycling over 300 h, in contrast to bare Zn, which short-circuited after just 20 h.
 | ||
| Fig. 58 Prevention of Zn dendrite formation by carbon coating.651 Reprinted with permission from ACS Applied Materials & Interfaces. | ||
In 2019, Lu and co-workers adopted a three-dimensional carbon nanotube framework with a high surface area and electrical conductivity as a scaffold for Zn plating and stripping.653 This setup reduced the overpotential for Zn plating and minimized the tip effect by homogeneously distributing the electric field. Consequently, the symmetric cell in 2 M ZnSO4/H2O, operating at 2.0 mA cm−2 and 2.0 mA h cm−2, demonstrated stable performance over 200 h with suppressed side reactions and Zn dendrite growth.
In 2023, Zhang et al. fabricated 20 nm-thick carbon-coated Zn metal through magnetron sputtering.661 The enhanced wettability of the electrolyte, evidenced by a decrease in the contact angle from 99° to 47°, promoted more uniform charge distribution on the Zn metal. The plated Zn on the carbon-coated surface was flatter, more compact, and uniform compared to the loosely and unevenly distributed nanosheet-like features on bare Zn, thus reducing electrolyte decomposition with a smaller reaction area. Remarkably, the cycling stability of symmetric cells in 2 M ZnSO4/H2O exceeded 3500 h under various conditions (0.5 mA cm−2/0.5 mA h cm−2, 1.0 mA cm−2/1.0 mA h cm−2, and 2.0 mA cm−2/2.0 mA h cm−2), with a notable suppression of byproduct formation.
The introduction of inorganic materials as artificial SEIs has been explored for its potential benefits. In 2018, Mai et al. applied a chemically and electrochemically stable amorphous TiO2 layer to Zn metal via atomic layer deposition, resulting in an 8 nm-thick barrier that reduced the formation of less-conductive byproducts like Zn(OH)2 and minimized electrolyte decomposition, as shown in Fig. 59.611 In symmetric cell tests with 3 M Zn(OTf)2/H2O at 1.0 mA cm−2 and 1.0 mA h cm−2, the TiO2-coated Zn exhibited enhanced stability, lasting over 150 h. This was in contrast to the behavior of bare Zn, which failed just after 30 h.
 | ||
| Fig. 59 (a) Performance of Zn|Zn symmetric cells with and without an 8 nm-thick TiO2 coating on Zn metal.611 (b) Schematic of Zn plating and Zn|Zn symmetric cell results under different coating conditions. ZF, C-TiO2, and F-TiO2 correspond to Zn foil, commercial TiO2, and highly (001) facet-exposed TiO2, respectively.671 Reprinted with permission from Advanced Materials Interfaces (a) and Nature Communications (b). | ||
Around the same time, Kang and co-workers engineered a porous, ex situ artificial SEI composed of nano CaCO3 and polyvinylidene difluoride. The SEI was designed to mitigate dendrite growth and suppress electrolyte reduction by guiding the Zn plating and stripping processes beneath the artificial SEI.664 This modification enabled sustained Zn plating and stripping for over 840 h in a symmetric cell containing a 3 M ZnSO4 + 0.1 M MnSO4/H2O electrolyte at 0.25 mA cm−2 and 0.05 mA h cm−2. To further emphasize the role of metal affinity in the SEI performance, Wang et al. demonstrated that TiO2 with a low metal affinity offered enhanced protective effects, inducing Zn plating and stripping beneath the layer, as depicted in Fig. 59.671 Density functional theory calculations showed that the TiO2 (001) facet exhibited lower Zn affinity than the TiO2 (100) facet. TiO2-coated Zn metal, which was strategically prepared to expose primarily the TiO2 (001) facet, offered reduced dendrite growth and byproduct formation, thereby extending the cycle life of Zn plating and stripping in a symmetric cell using 1 M ZnSO4/H2O to over 460 h at 1.0 mA cm−2 and 1.0 mA h cm−2.
In 2021, Li et al. reported computational studies on the enhanced cycling performance with ZnF2-coated Zn metal. Their analyses revealed that the ZnF2 matrix on the Zn surface aided Zn2+ desolvation from the electrolyte and ensured a more uniform distribution, thus suppressing dendrite growth.640 Concurrently, using the climbing image nudged elastic band method, Ma et al. found that the diffusion energy barrier for a single Zn2+ ion was significantly lower on the ZnF2 (002) facet (0.27 eV) compared to that on the bulk ZnF2 surface (0.67 eV).639 This suggested that Zn2+ exhibited higher conductivity on the exposed ZnF2 (002)/Zn metal surface, thereby kinetically facilitating their insertion into the ZnF2-coated Zn metal with a reduced energy barrier (0.52 eV), compared to those on bulk ZnF2 (4.08 eV) and bulk Zn (0.67 eV). Supporting this, Han and co-workers presented corroborative results, which showed that based on the defect formation energy calculations for ZnF2, the formation of Zn2+ interstitials made them the most energetically favorable defect.638 This allowed interstitial Zn2+ to stably remain within the ZnF2 matrix. Furthermore, the ZnF2 structure contained channels along the c-axis, which spanned the entire structure, providing diffusion barriers of 0.25 eV for Zn2+ and 0.15 eV for Zn0, thereby facilitating the transport of Zn2+ to/from the Zn anode. However, note that the electrochemical properties of ZnF2 are still under debate, as discussed in Section 7.4.
The cycling stability of aqueous Zn-metal batteries is significantly affected by uncontrollable morphological changes and the formation of numerous cracks and defects during the Zn plating and stripping processes. Thermodynamically, the formation of nuclei at dislocated sites is favored, leading to the creation of numerous protuberances that eventually grow into Zn dendrites, thereby shortening the lifespan of batteries. To address these challenges, Lang et al. introduced lamella-nanostructured eutectic zinc–aluminum (Zn88Al12) alloys (Fig. 60).672 Zn and Al lamellas serve dual roles—they provide charge carriers for Zn2+ and offer a favorable skeleton for Zn plating. The formation of an Al2O3 layer on Al lamellas protects against the dissolution of Al, driven by the low thermodynamic potential of Al (Al/Al3+: −1.66 V vs. SHE) relative to that of Zn (Zn/Zn2+: −0.76 V vs. SHE), inhibits electron transfer from Al to Zn2+, and forms a positive electrostatic shield around the Al/Al2O3 lamellas. This shield prevents the direct reduction of Zn2+ on the Al lamellas and ensures uniform Zn deposition within their interlayer spacing at Zn precursor sites. A symmetric cell test performed in an O2-free 2 M ZnSO4/H2O electrolyte at 0.5 mA cm−2 and 0.5 mA h cm−2 exhibited almost negligible voltage hysteresis over 2000 h, which is a marked improvement over the significant voltage hysteresis observed in a bare Zn-based cell after only 26 h.
 | ||
| Fig. 60 (a) Schematic of suppressed Zn dendrite growth on lamella-nanostructured eutectic Zn88Al12 alloys. (b) Long-term cycling of symmetric batteries in an O2-free aqueous ZnSO4 solution.672 Reprinted with permission from Nature Communications. | ||
Metal–organic frameworks (MOFs) offer a higher specific surface area than activated carbons or zeolites and feature a porous coordination network structure created through interactions between metal ions or cluster nodes and organic ligands. In 2019, Pan et al. demonstrated that UiO-66, a type of metal–organic framework, enhances electrolyte wetting capabilities owing to its high surface area. This characteristic contributes to stable and uniform Zn plating and stripping.734 This enabled stable Zn plating and stripping for over 500 h in a symmetric cell test using a 3 M ZnSO4 + 0.1 M MnSO4/H2O electrolyte at a constant current of 1.0 mA cm−2 or 3.0 mA cm−2 and an areal capacity of 0.5 mA h cm−2. The following year, Zhou's group employed Raman spectroscopy to demonstrate that electrolytes became highly concentrated within the channels of MOFs.735 The small pores and channels in these frameworks posed challenges for inserting large solvated-ion complexes, leading to a solution structure dominated by ion pairs and reducing the presence of free water molecules. This distinct environment enabled smooth Zn plating and stripping while minimizing side reactions (Fig. 61).
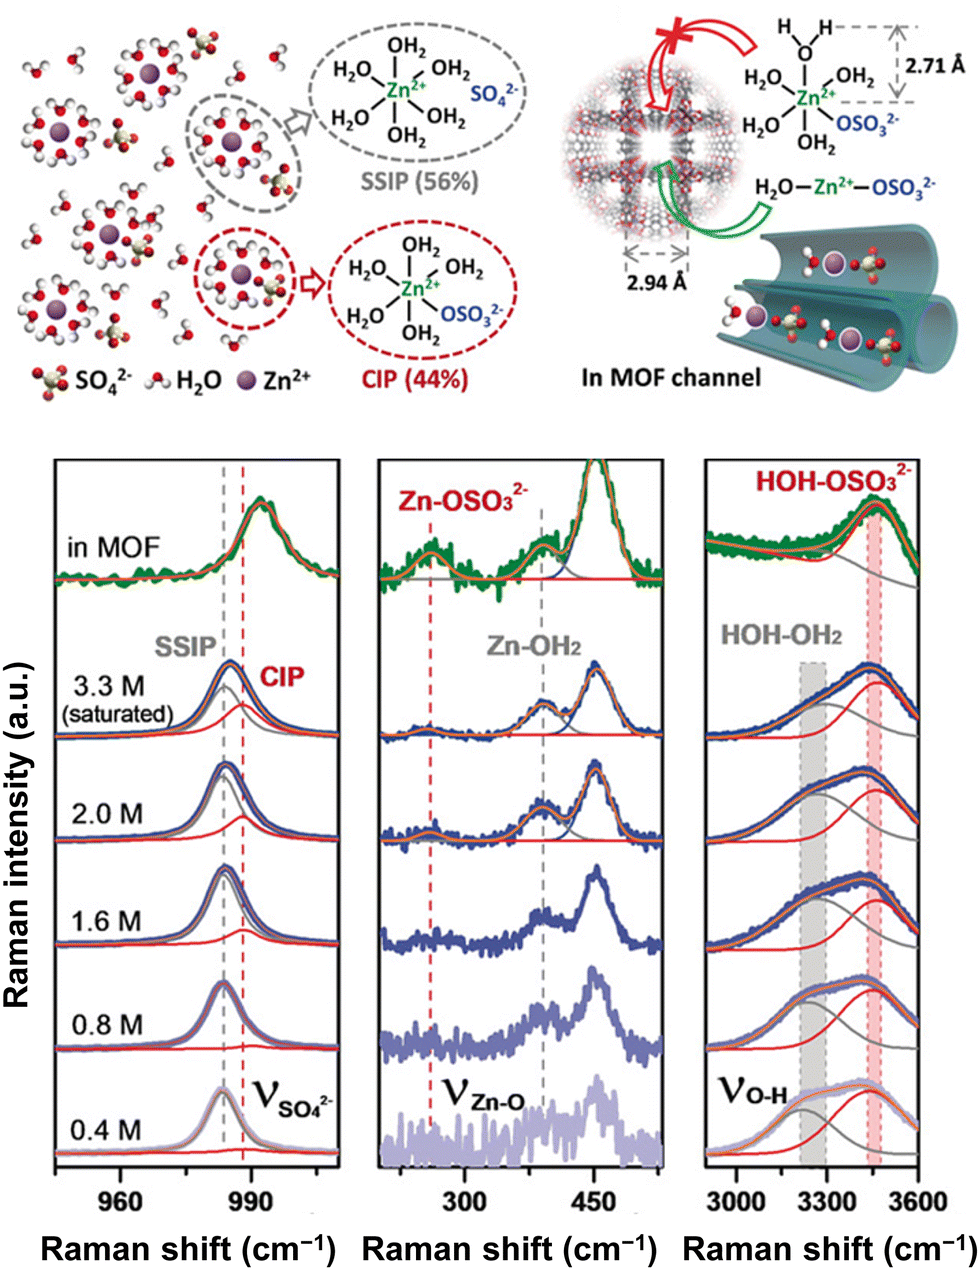 | ||
| Fig. 61 Construction of a super-saturated ZnSO4 electrolyte in metal–organic-framework channels, demonstrated by Raman spectroscopy.735 Reprinted with permission from Angewandte Chemie International Edition. | ||
In 2021, Park et al. developed covalent organic frameworks (COFs)-coated Zn-metal anodes, enabling stable Zn plating and stripping over 400 h with suppressed side reactions (Fig. 62).740 Later that year, Zhao et al. demonstrated that introducing fluorinated COFs significantly enhanced the stability of Zn metal and the electrolyte.741 The strong interactions between electronegative fluorine atoms in these frameworks and zinc atoms in the Zn-metal anode directed the plating orientation to produce a densely packed Zn deposit, which helped suppress dendrite growth. As a result, they achieved stable cycling performance over 1700 h at 5.0 mA cm−2 and 1.0 mA h cm−2 in a 2 M ZnSO4/H2O electrolyte (Fig. 62).
 | ||
| Fig. 62 (a) Structures of diverse covalent organic frameworks (COFs), formed from the 1,3,5-triformylphloroglucinol precursor and various aromatic amine linkers.740 (b) Suppression of Zn dendrite formation by a fluorinated COFs film.741 Reprinted with permission from Advanced Materials (a) and Nature Communications (b). | ||
In the field of Zn electroplating, brighteners, also known as levelers, are commonly used to enhance the surface gloss by increasing the Zn nucleation overpotential through strong coordination with Zn2+ in the electrolyte, thereby promoting the growth of finer Zn nuclei. In 2019, Zhao and co-workers applied this principle to prevent dendrite formation in aqueous Zn-metal batteries (Fig. 63).752 They engineered a polymeric interphase composed of polyamide and Zn(OTf)2, which increased the nucleation overpotential during Zn plating. This polyamide-coated Zn metal contributed to long-term cycling stability, enduring over 8000 h in a symmetric cell test conducted in a 2 M ZnSO4/H2O electrolyte at 0.5 mA cm−2 and 0.25 mA h cm−2. In 2020, Hao et al. developed a thin polyvinyl butyral coating on Zn metal using spin-coating techniques.444 The polyvinyl butyral served as an effective ex situ artificial SEI with distinct properties; it functioned as an electronic insulator with an electrical resistivity of 2.4 × 10⁵ Ω cm. Its abundant oxygen functional groups ensured strong adhesion to the Zn metal and facilitated Zn2+ transport, while its high hydrophilicity improved the electrolyte wettability. As a result, the polyvinyl butyral-coated Zn metal displayed stable performance for over 2200 h in a symmetric cell that was tested at 0.5 mA cm−2 and 0.5 mA h cm−2 in a 1 M ZnSO4/H2O electrolyte.
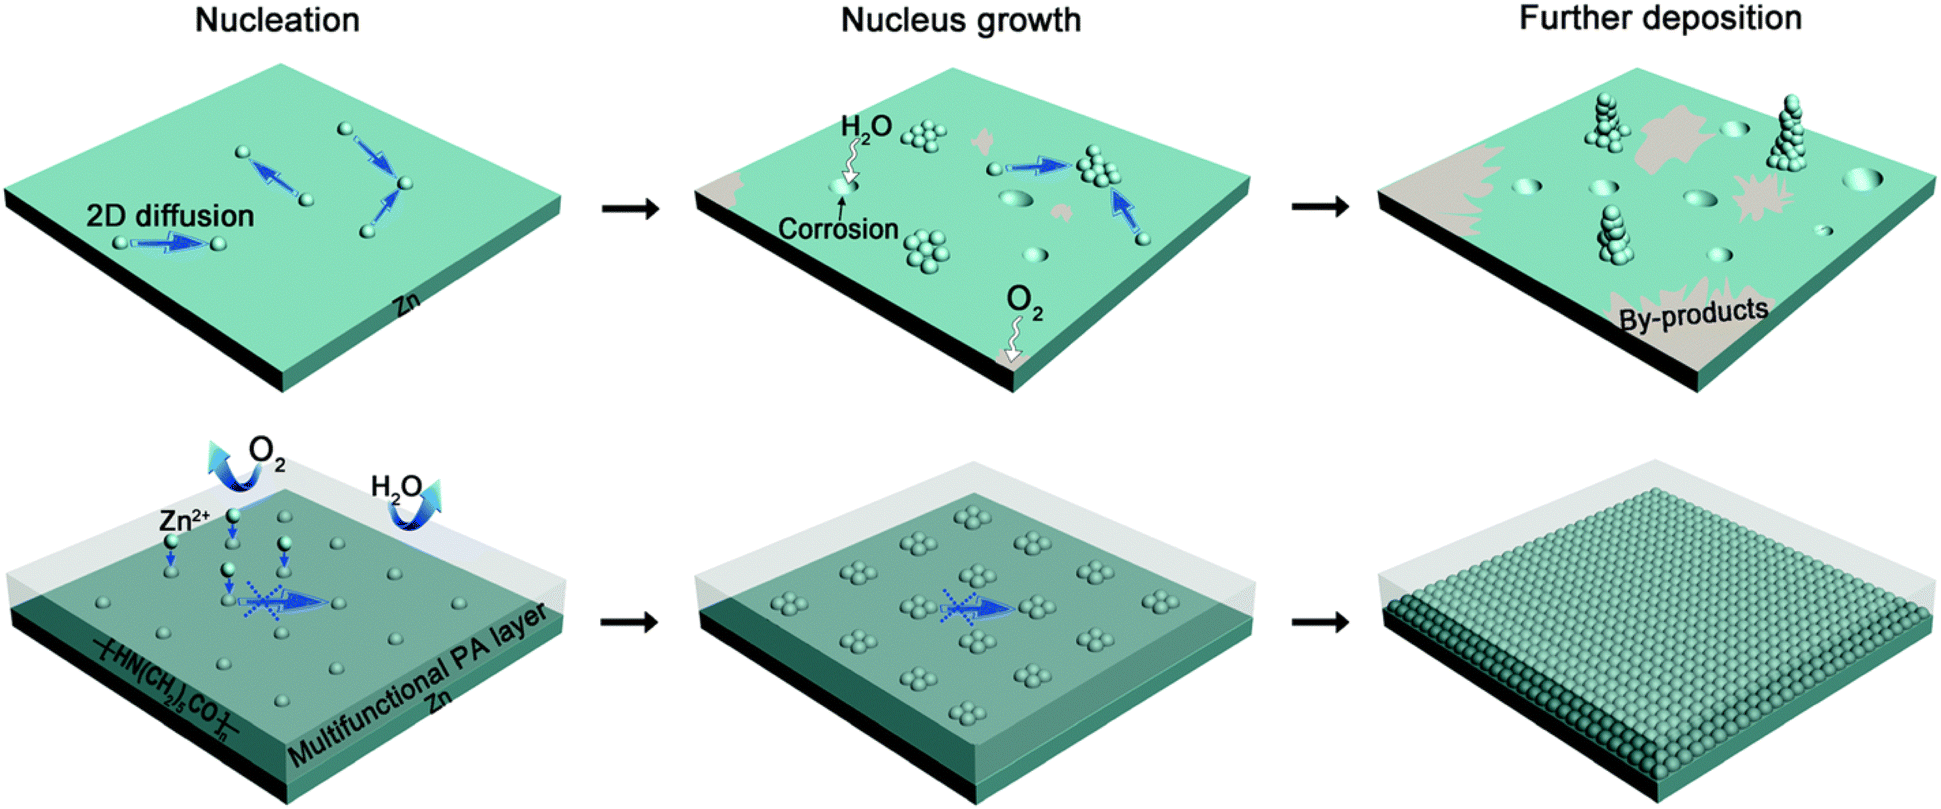 | ||
| Fig. 63 Mechanism of suppressed Zn dendrite growth with a multifunctional polymeric interphase composed of polyamide and Zn(OTf)2. Initial Zn nucleation was delocalized by the introduced polymeric interphase.752 Reprinted with permission from Energy & Environmental Science. | ||
Research on two-dimensional materials, mainly focusing on Ti3C2Tx MXene, graphdiyne, graphitic carbon nitride (g-C3N4), and boron nitride, has been conducted because of their remarkable flexibility, mechanical strength, chemical stability, and electrolyte wettability. For instance, in 2022, Qiu et al. applied sulfonate group-modified boron nitride nanosheets to Zn metal, achieving a substantial reduction in the Zn nucleation overpotential (26 mV at a current density of 1 mA cm−2) and solvation/desolvation activation energy (57.2 kJ mol−1), compared to those on bare Zn, for which the corresponding values were 112 mV and 76.9 kJ mol−1, respectively (Fig. 64).778 The symmetrical cell utilizing this sulfonate group-modified boron nitride-coated Zn metal exhibited a prolonged cycling life, enduring up to 2500 h at 2.0 mA cm−2 and 2.0 mA h cm−2, 1000 h at 5.0 mA cm−2 and 2.5 mA h cm−2, and 350 h at 10 mA cm−2 and 10 mA h cm−2.
 | ||
| Fig. 64 (a)–(c) Photographs and three-dimensional distribution images of bare Zn and sulfonate group-modified boron nitride-coated Zn(S-BN@Zn) before and after 50 cycles in symmetric cells. (d) Decreased initial Zn nucleation overpotential on S-BN@Zn.778 Reprinted with permission from Energy Storage Materials. | ||
Recent studies have focused on simplifying the formation process of artificial SEIs by immersing Zn metal in acidic solutions like phytic acid and phosphoric acid. For example, Zn metal dipped in a 2 mM phytic acid solution for 1 min under ambient conditions forms a phytic acid–Zn complex layer with a lamellar structure due to the strong chelating action of the rich phosphate/carboxyl groups in phytic acid (Fig. 65).786 The anti-corrosion effectiveness of this layer was evident, as demonstrated by its substantially lower charge-transfer resistance compared to that of the untreated bulk Zn metal after resting for two days in a 2 M ZnSO4/H2O electrolyte. In symmetric cell tests, the phytic acid-treated Zn metal exhibited high cycling stability, lasting for 1400, 850, and 450 h at 2.0 mA cm2/1.0 mA h cm−2, 5.0 mA cm−2/2.5 mA h cm−2, and 8.0 mA cm−2/4.0 mA h cm−2, respectively.
 | ||
| Fig. 65 (a) Preparation of phytic acid-treated Zn metal (PA–Zn). (b) Tafel curves showing increased corrosion potential in PA–Zn. (c) Nyquist plots demonstrating a significant difference in the surface charge-transfer resistance between bare Zn and PA–Zn before and after immersion in the 2 M ZnSO4 solution for two days.786 Reprinted with permission from ACS Applied Materials & Interfaces. | ||
However, there is insufficient evidence to confirm that the materials commonly used in artificial SEIs and scaffolds provide adequate Zn2+ conductivity. Additionally, the electrolyte/electrode conditions that promote the growth of finer Zn nuclei with high Zn nucleation overpotentials may also increase the Zn growth overpotentials, thereby accelerating electrolyte reduction, generating hydrogen gas bubbles, and ultimately hindering uniform Zn plating. Therefore, performance enhancement by modifying the nucleation overpotentials might only be effective under specific conditions where the operating potential window of the electrolyte and the battery operating parameters, such as the current density and temperature, are optimally aligned. Ideally, a protective film on Zn metal should simultaneously maintain substantially high HER overpotentials and low Zn plating/stripping overpotentials. However, the rapid ion conductivity of protons over Zn2+, especially in acidic solutions, coupled with the facilitated Volmer step of the HER due to the strong Lewis acidity of Zn2+, make the implementation of this strategy challenging.
Most importantly, the performance of aqueous Zn-metal batteries has rarely been evaluated practically. To increase the battery energy density, limiting the amounts of Zn metal and electrolyte is essential. Under these conditions, long-term cycling performance with sufficiently high Coulombic efficiency should be guaranteed. However, most studies on aqueous Zn-metal batteries, including those utilizing electrolyte modification and artificial SEIs/scaffolds, have overlooked this aspect.
The required metal thickness (TM, in µm) to obtain a capacity of 1 mA cm−2 can be estimated using the following equation:
 | (20) |
485 C mol−1) which can be converted to 26801 mA h mol−1, and the density of the metal (g cm−3). Based on eqn (20), the thickness required to achieve 1 mA h cm−2 for Zn metal is calculated to be 1.71 µm, with MW = 65.38 g mol−1, n = 2, and ρ = 7.14 g cm−3. This thickness is lesser than that required for Li metal, which is 4.85–6.8 µm (with MW = 6.94 g mol−1, n = 1, and ρ = 0.53 g cm−3).
To increase the energy density, batteries must be assembled with thin metal anodes; however, this configuration can limit the supply of carrier ion resources and potentially degrade the long-term cycling performance. This underscores the need to maintain a proper balance among metal thickness, battery energy density, and overall battery performance. For nonaqueous Li-metal batteries, extensive research is underway to apply limited amounts of Li metal. This involves using Li+ resources, ranging from none (×0 excess; anode-free setup) to an amount equal to that provided by the cathode active materials (×1 excess). For instance, with a layered oxide LiNi0.8Mn0.1Co0.1O2 cathode active material having a specific capacity of 200 mA h g−1 and a cathode loading of 20 mg cm−2, thereby yielding a capacity of 4 mA h cm−2, the Li metal should be 19.4 µm thick (a capacity of 4 mA h cm−2 from Li metal) to be able to supply the same amount (×1 excess) of Li+ resources provided from the cathode (Fig. 66).
 | ||
| Fig. 66 Practical configuration of (a) anode-free, (b) and (c) metal-based batteries. | ||
The same standards can also be used for aqueous Zn-metal batteries, although most cathode active materials for aqueous Zn-metal batteries do not include Zn2+ carrier ion resources, unlike those for nonaqueous Li-metal batteries. Furthermore, as discussed in Section 7.1, the capacity of cathode active materials for aqueous Zn-metal batteries is primarily derived from the co-intercalation of proton and/or water, not pure (desolvated) Zn2+ intercalation. If the electrode comprises 20 mg cm−2 of a cathode active material that does not offer Zn2+ carrier ion resources initially and provides a capacity of 2 mA h cm−2 with pure (desolvated) Zn2+ intercalation, a 6.84 µm-thick Zn metal (a capacity of 4 mA h cm−2 from Zn metal) would be required to fabricate ×1 excess Zn-metal batteries (Fig. 66).
Additionally, assuming the use of a 12 mm-diameter electrode (1.13 cm2) in coin-cell fabrication for symmetric or asymmetric Zn-metal stability tests and considering an aqueous Zn electrolyte density of 1 mg mL−1, the amount of electrolyte required under commercial standards (2–3 mg mA h−1 in Li-ion and Li-metal batteries) with 2 mA h cm−2 cathodes would be approximately 4.5 µL.
However, many studies used substantially thicker Zn metal and larger amounts of electrolyte. For instance, data from approximately 90 papers referenced in Table 14 (excluding those where values are not mentioned) show an average Zn metal thickness of 120 µm, with minimum and maximum values of 10 and 1000 µm, respectively. The exact amount of electrolyte used is often unspecified; however, most aqueous batteries employed thick glass fiber separators that require at least 30–100 µL of the electrolyte to ensure complete saturation. These findings reveal that the Zn metal thickness and electrolyte volume used in an academic scenario significantly deviate from those used in commercial standards.
Additionally, side reactions between the electrolyte and Zn metal involve the formation of complexes such as Znx(OH)y(anion)z·nH2O and the evolution of hydrogen gas (HER), which are highly dependent on the Arrhenius equation (eqn (16)). The overpotentials for HER are typically higher than those for Zn plating on the Zn-metal surface (details in Section 7.7). The high dielectric constant of water in aqueous Zn electrolytes ensures rapid ion conductivity even at low temperatures—a stark contrast to nonaqueous electrolytes used in conventional Li-ion batteries, which face conductivity issues at low temperatures (details in Section 7.7). These distinct properties, which help stabilize Zn metal and the electrolyte, thereby improving Coulombic efficiency with suppressed side reactions at low temperatures, can be disrupted by ex situ coating.790 On the other hand, at higher temperatures, Zn metal and electrolyte consumption increase due to accelerated side reactions, which can compromise the performance and lifespan of the battery. However, most studies on ex situ artificial SEIs and scaffolds have been conducted at room temperature.
Importantly, under the required strict conditions, small and medium-scale devices like mobile phones and electric vehicles must ensure a minimum of 1000 cycles, while large-scale devices, including energy storage systems, are expected to last for at least 100000 cycles under a relatively low current of ≤0.1 C. These discrepancies highlight the substantial challenges faced by aqueous Zn-metal batteries in meeting practical standards.
7.6. Non-standardized methods for estimating Coulombic efficiency
In all strategies, accurate measurement of the Coulombic efficiency is the first step for enhancing battery stability. In 2020, the research team at the US Army Research Laboratory underscored that studies on rechargeable Zn-metal batteries have employed different testing methods and conditions, rendering direct comparisons of their performance a complex process.791,792 Two electrochemical techniques are commonly used to measure the Coulombic efficiency of Zn plating and stripping reactions: the potentiostatic method (using cyclic voltammetry, which sweeps the potential at a constant rate) and galvanostatic cycling (which involves applying a constant current until specific cut-off conditions, such as voltage, capacity, or time, are achieved). Fig. 67 illustrates the normalized cyclic voltammetry curves from previous papers, revealing unrealistic potential ranges for Zn plating and stripping.792 These include an extremely low plating potential beyond −0.5 V vs. Zn/Zn2+ and a high cut-off stripping potential beyond the operating potentials of common Zn cathodes. The Zn-metal anode is maintained near the Zn/Zn2+ potential in real battery applications, and the Zn stripping potential is constrained by the full-cell discharge cut-off voltage, typically ≤1.5 V. Furthermore, cyclic voltammetry does not control important battery operation parameters such as the current density and areal capacity.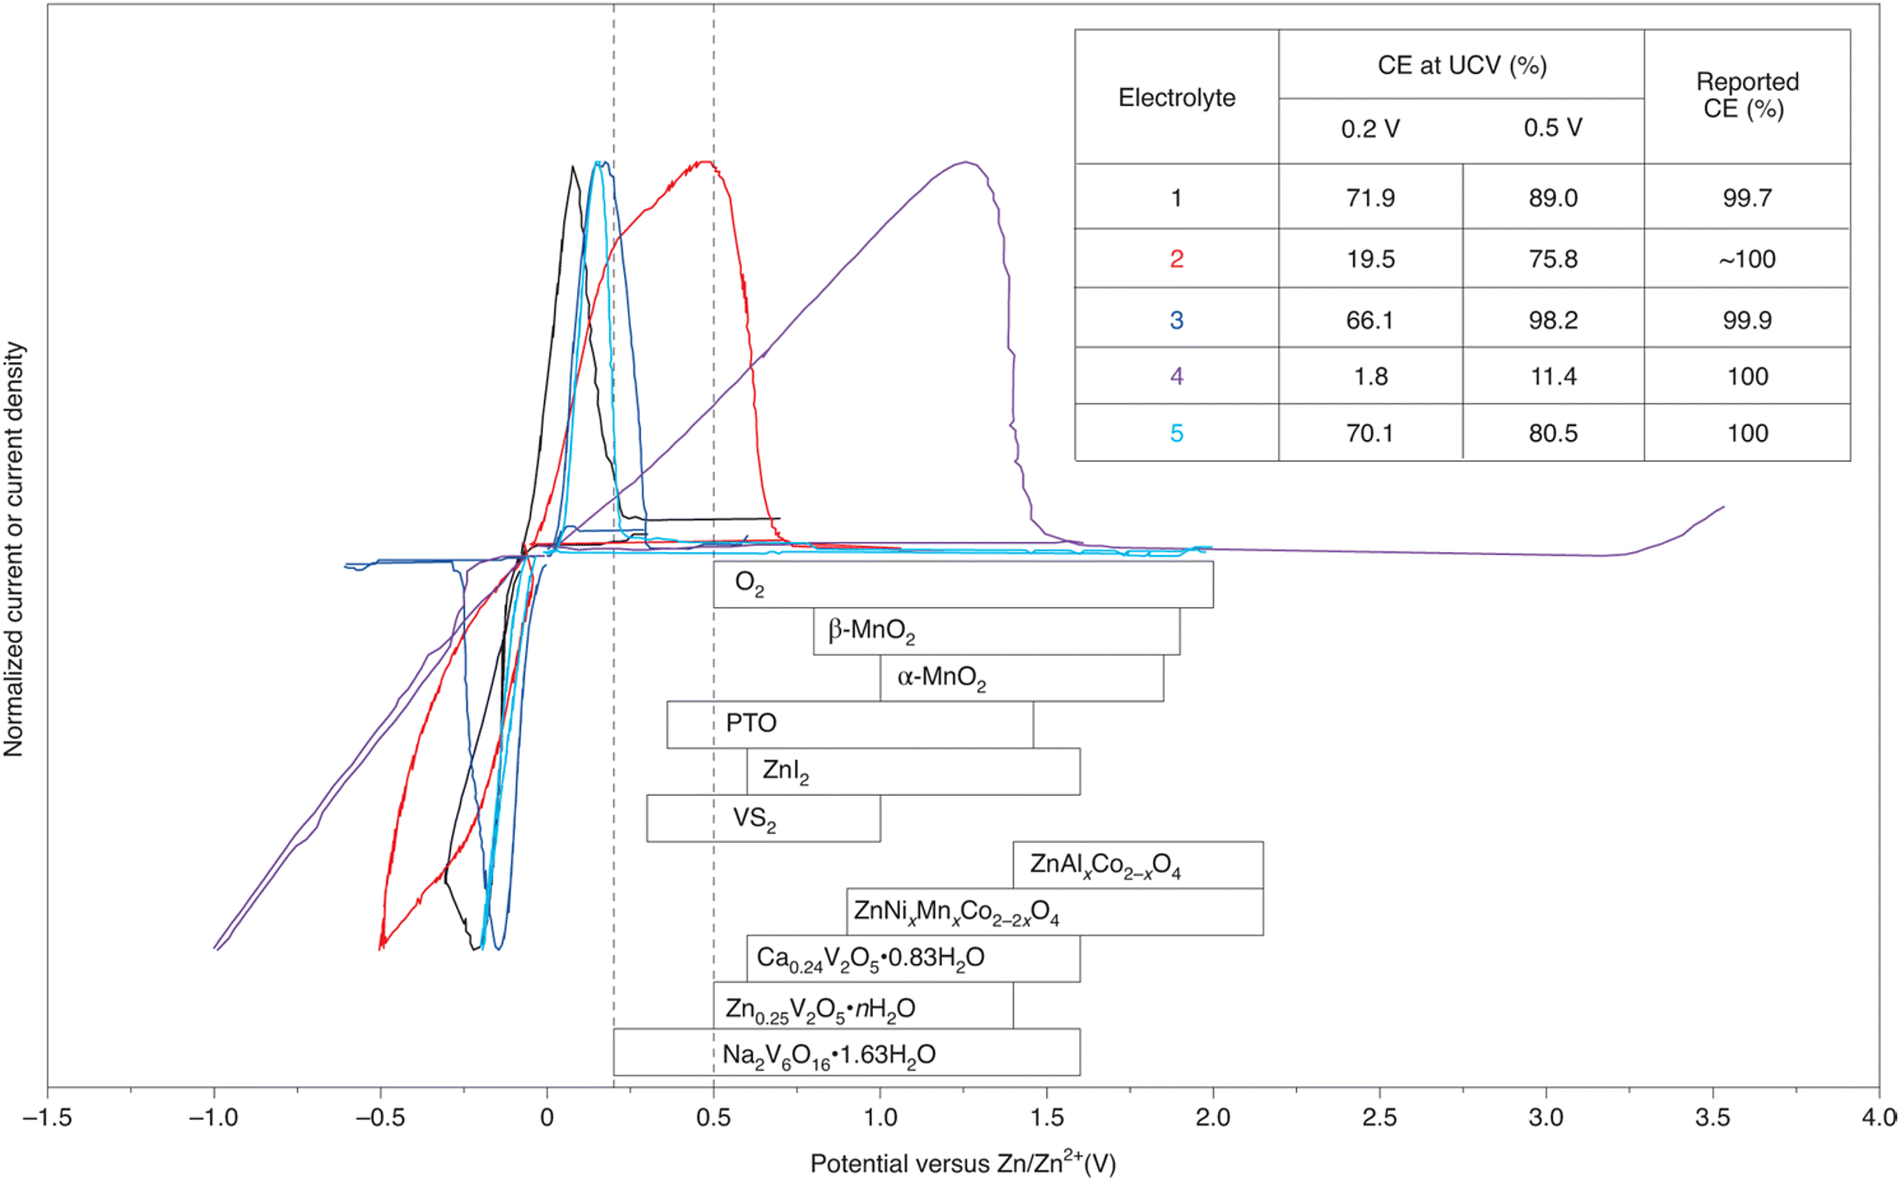 | ||
| Fig. 67 Summary of cyclic voltammetry curves reported for determining the Coulombic efficiency in various Zn electrolytes: (1) Zn(OTf)2/LiTFSI/acetamide (1/2/7, n/n/n), (2) Zn(TFSI)2/acetamide (1/7, n/n), (3) 1 m Zn(TFSI)2 + 20 m LiTFSI/H2O, (4) 0.5 M Zn(TFSI)2/propylene carbonate, and (5) 1 M Zn(OTf)2/H2O. The inset floating bars represent the operating potential ranges of various Zn cathodes. The current or current density is normalized to compare scan windows. The table in the top right displays the reported Coulombic efficiency values alongside those calculated via integration with more realistic upper cut-off voltages (UCVs; cut-off stripping potential in the manuscript) of 0.2 and 0.5 V.792 Reprinted with permission from Nature Energy. | ||
Compared to cyclic voltammetry, galvanostatic cycling, which closely replicates real battery operation, is more suitable for accurately measuring the Coulombic efficiency during Zn plating and stripping. However, considerable variability still exists in the galvanostatic test parameters and setups reported in the literature, and this has already been highlighted in previous papers on Li-metal batteries. In 2017, Adams et al. introduced an overview of the galvanostatic cycling conditions and illustrated how variations in these methods could lead to differences in the experimental results.793 The representative methods are described below.
 | (21) |
 | ||
| Fig. 68 (a)–(c) Protocols to estimate the Coulombic efficiency of metal plating and stripping.793 Reprinted with permission from Advanced Energy Materials. | ||
 | (22) |
stripping represent the amount of charge used to cycling processes, the charge used for the initial pre-plating of metal onto the inert substrate to establish a metal reservoir, and the charge passed during the concluding stripping process, respectively. In the practical operation of rechargeable metal batteries, the metal is not entirely stripped from the substrate. Instead, metal plating and stripping occur on a metal surface rather than on an inert substrate, suggesting that this method provides critical perspectives for developing advanced rechargeable metal batteries.
Under the assumption that the redox potential of the cathodes is located within the operating potential window of the electrolyte, thereby minimizing electrolyte oxidation on the cathode surface, the Coulombic efficiency of aqueous Zn-metal batteries is expected to primarily originate from electrolyte reduction on the Zn-metal surface. In this case, Method 3 would be most suitable for comparing the electrolyte stability on the Zn-metal surface. The Coulombic efficiency also largely depends on the current density, areal capacity, and cut-off voltage.792,796 The US Army Research Laboratory team recommended the following protocols: a current density of 0.5 mA cm−2, areal capacity of 1 mA h cm−2, an upper cut-off voltage of 0.5 V with a modest cycling number (e.g., ten cycles to avoid interference from dendrite formation or excessive impedance growth), and a Qstripping/re-plating/Qpre-plating ratio of 1/5 using a 100 µm-thick Zn foil counter electrode.792
Note that Method 1, which utilizes protocols similar to those of Method 3, proves advantageous for monitoring electrolyte stability and consumption over prolonged battery cycling. Moreover, it would benefit the future development of anode-free batteries, contingent upon a rise in Zn-metal prices. Given the dual functionality of Zn metal as both a carrier ion provider and a current collector, selecting a substrate for Method 1 is debatable. Considering the drawbacks of alternative substrates, such as accelerated electrolyte reduction with a low HER overpotential on SUS,797 prohibitive costs and limited adaptability of Ti across various battery configurations, and low adhesion of Zn deposits due to the fast formation of an Al2O3 film on Al in aqueous solutions,798 Cu foil stands out as an ideal substrate choice in Method 1 owing to its affordability, flexibility, and adequate HER overpotential.
afterresting) and initially plated Zn (mplating) quantifies the stability of the electrolyte and Zn metal at specific temperatures based on Faraday's law, whereby the change in the mass of Zn is proportional to the change in charge. | (23) |
 | ||
| Fig. 69 Schematic of Method 5. | ||
A more ideal approach is to evaluate the cycling performance and Coulombic efficiency within a full-cell configuration, which includes host cathodes capable of carrier ion intercalation and deintercalation, along with Zn-metal anodes, resembling the setup of Li-metal batteries. In this regard, aqueous Zn-metal batteries fabricated with Chevrel phase-Mo6S8 cathodes and Zn-metal anodes represent a standard system for evaluating the stability of the electrolyte and Zn metal (Fig. 70). Mo6S8, known for its ease of synthesis, high stability in the electrolyte, and moderate capacity (∼100 mA h g−1), along with its high density and electrical and ionic conductivities, allows for the preparation of high-loading-level cathodes exceeding 20 mg cm−2. This setup is beneficial for the extensive testing of Zn plating and stripping processes, typically involving more than 2 mA h cm−2,545,801 offering a robust platform for assessing the battery stability.
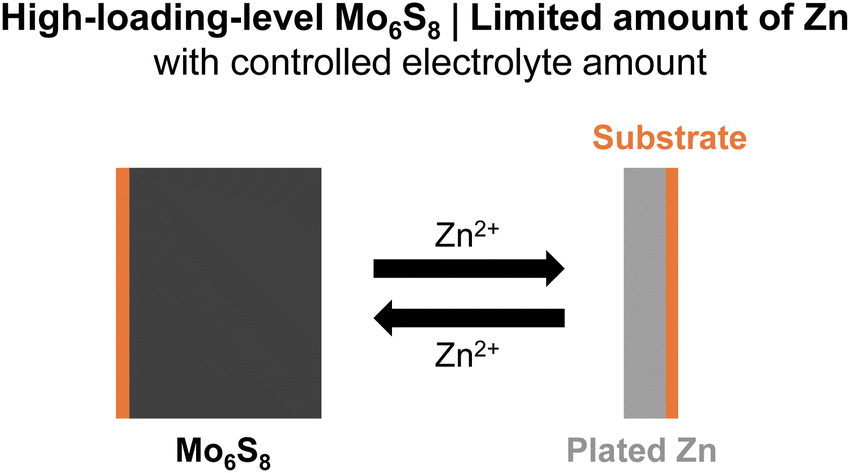 | ||
| Fig. 70 Schematic of Method 6. Utilization of a Mo6S8|Zn full cell is one of the ideal methods to determine the Coulombic efficiency of Zn plating and stripping reactions. | ||
Moreover, unlike many cathode materials for aqueous Zn-metal batteries that exhibit different charge and discharge curves in aqueous and nonaqueous electrolytes owing to complex co-intercalation reactions, Mo6S8 exhibits identical curves in both types of electrolytes, with negligible co-intercalation of protons and/or water, thus simplifying the evaluation of Zn2+ carrier ion consumption. Furthermore, the intercalation and deintercalation of Zn2+ into Mo6S8 occur within a potential range of 0.2–1.0 V vs. Zn/Zn2+, where neither the HER nor OER occurs on the electrode surfaces, respectively, in most aqueous electrolytes. These advantageous conditions indicate that the stability of the electrolyte and Zn metal can both be effectively quantified by analyzing the cycling performance and Coulombic efficiency of a Mo6S8|Zn full cell, constructed with limited amounts of Zn and the electrolyte.
7.7. Challenges with controlling the morphology and orientation of Zn plating
One straightforward method to prevent Zn dendrite formation is by controlling the morphology of Zn plating by using an increased operating current density. This technique has been proposed since the early twentieth century.802,803 Kundu et al. reported significant improvements in the cycle life of Ti|Zn cells in a 3 M ZnSO4/H2O electrolyte when the current density was increased from a low value of 1 mA cm−2 to a high value of 20 mA cm−2. The cycle life extended from 244 h to over 8000 h, affording uniform and dense plated Zn (Fig. 71).804 Further supporting this approach, Liu et al. studied the Zn plating morphology under various current densities and areal capacities in SUS|Zn cells, depicted in Fig. 72.805 Their findings indicated that Zn dendrite formation was effectively suppressed at high current densities such as 20 mA cm−2. Similarly, Yang and Zhou et al. observed a densely packed morphology of Zn plated on Cu foil at a high current density (30 mA cm−2) without the flake-like shapes prevalent at lower current densities (0.3 mA cm−2).806 Additionally, the amount of hydrogen evolved during Zn plating decreased drastically from 60.04% to 2.11% when the current density was increased from 0.05 to 10 mA cm−2.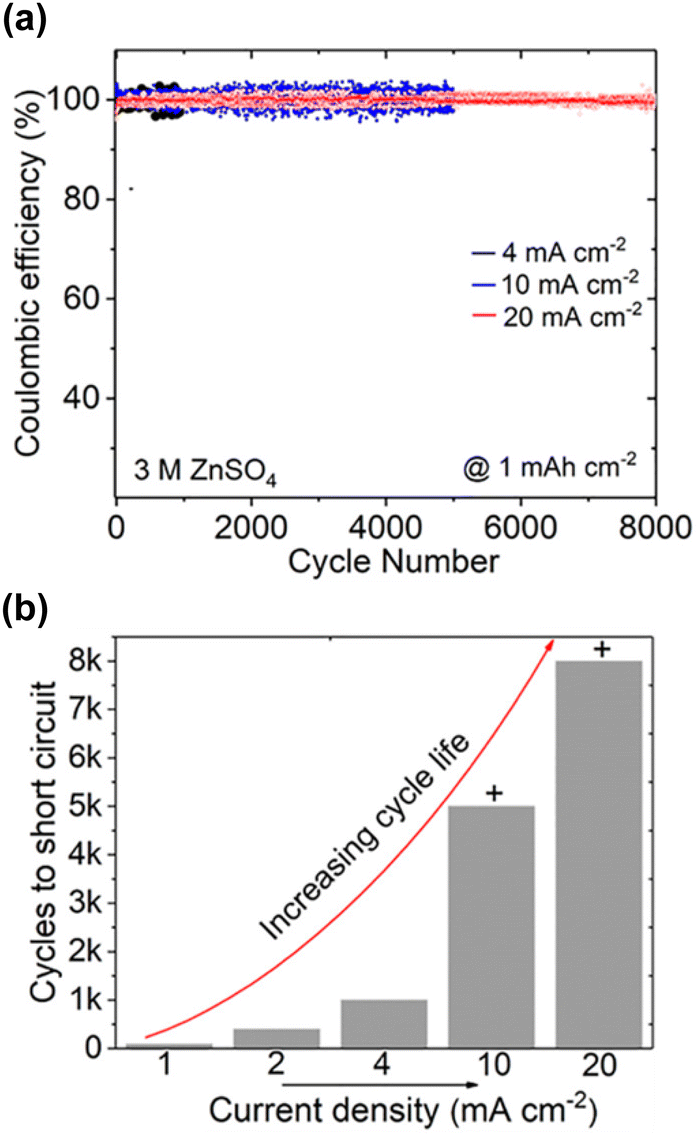 | ||
| Fig. 71 (a) Coulombic efficiencies of Zn plating and stripping in Ti|3 M ZnSO4/H2O|Zn cells at various current densities. (b) Chart representation showing a drastic increase in the Coulombic efficiency with increasing current density.804 Reprinted with permission from ACS Applied Materials & Interfaces. | ||
 | ||
| Fig. 72 (a) Voltage profiles of galvanostatic Zn plating on SUS. (b) Variation in nucleation and growth overpotentials with respect to the current density. (c) Histograms of Zn particle sizes after plating with a capacity of 0.1 mA h cm−2. (d) Schematic of Zn growth at different overpotentials.805 Reprinted with permission from ACS Applied Materials & Interfaces. | ||
Recent studies have questioned and sought to explain deviations from the traditional theory, which posits that non-uniform and dendritic metal deposition occurs at a high current density owing to a rapid decrease in the ion concentration at the electrode–electrolyte interface.807
Indeed, the concept of “high current density” and its effects vary significantly across different battery systems, particularly due to differences in the physicochemical properties and behavior of the electrolytes and metals used. The issues associated with high current densities often involve imbalanced plating caused by mass transport limitations. The crucial factor here is not the current density but the mass transport limitations resulting from reduced carrier ion concentration at the electrode–electrolyte interface. Understanding the distinction between “interface” and “interphase” is also essential.808
Nonaqueous Li electrolytes for Li-metal batteries typically exhibit ionic conductivities below 10 mS cm−1. With its low redox potential of −3.0 V vs. SHE, Li metal promptly reduces these electrolytes. This reduction leads to the formation of an interphase (SEI)—a complex mixture of organic and inorganic species that can lower Li+ transport compared to that in bulk electrolytes.
Conversely, aqueous Zn electrolytes, such as 1 M and 2 M ZnSO4/H2O, show higher ionic conductivities (47 mS cm−1 and 56 mS cm−1, respectively) than typical nonaqueous solutions due to the small molecule size and high dielectric constant of water.809 Furthermore, as discussed in Section 7.4, the relatively high redox potential of Zn metal (−0.76 V vs. SHE) makes it less likely to be fully covered by an SEI, allowing the Zn-metal surface to function more as an interface—where the electrolyte directly contacts the electrode surface—rather than as an interphase.
Consequently, Zn plating in aqueous Zn electrolytes is likely to proceed with fast carrier ion transport, compared to Li plating in nonaqueous Li electrolytes, indicating that the threshold for the “high current density,” which triggers dendrite growth owing to mass transport limitations, is significantly higher in aqueous Zn than in nonaqueous Li systems. Sun et al. demonstrated that in 1–3 M ZnSO4/H2O, Sand's time (Sand's limiting current density; the current density at which the carrier ion concentration at the electrode surface decreases to zero, leading to unstable metal plating)810 was estimated to be from 20 to 60 mA cm−2 based on areal capacities of 2.0 to 8.3 mA h cm−2 (Fig. 73),811 which was considerably higher compared to that for Li plating in nonaqueous Li electrolytes (≤2 mA cm−2) (Fig. 73).812 Additionally, Zn metal has a higher HER overpotential than other metals (Fig. 74).813 As the current density increases, the HER overpotential also increases rapidly, helping to suppress the formation of hydrogen gas bubbles and the generation of OH−. Moreover, computational calculations by Liu, Zhu, Huang, et al. illustrated that with an increase in the current density:814 (i) the concentration of Zn2+ increased while that of anions decreased to compensate for the negative charge on the electrode surface, and (ii) the reaction kinetics for Zn plating were enhanced owing to the decreased thickness of the electrical double layer, as described by the Gouy–Chapman–Stern model,815 thereby facilitating Zn2+ transport with a shortened diffusion distance.814
 | ||
| Fig. 73 (a) and (b) Sand's limiting current densities for Zn plating in aqueous ZnSO4 electrolytes with different concentrations. The inset, model III, represents Zn dendrite growth.811 (c) and (d) Sand's time and capacity for Li plating in nonaqueous Li electrolytes at various current densities.812 Reprinted with permission from Angewandte Chemie International Edition (a) and (b) and Energy & Environmental Science (c) and (d). | ||
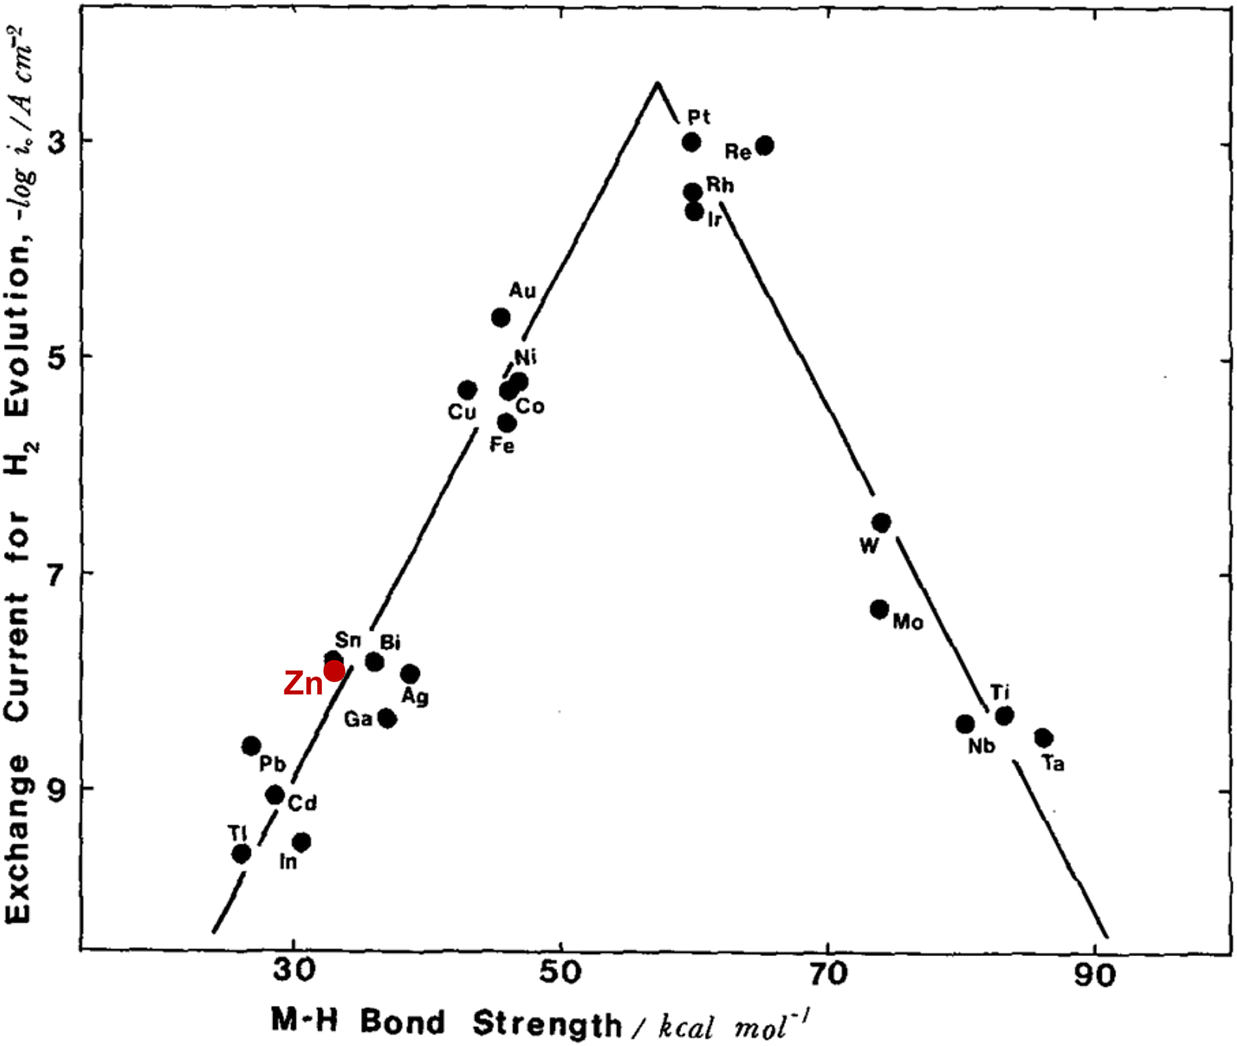 | ||
| Fig. 74 Volcano plot for the HER. The intermediate Zn metal–hydrogen bond formed during the electrochemical reaction is weak, resulting in a high overpotential (low exchange current) for the HER.813 Reprinted with permission from Journal of Electroanalytical Chemistry and Interfacial Electrochemistry. | ||
Overall, the definition of “high current density,” which promotes dendrite growth through mass transport limitations, significantly varies between nonaqueous Li and aqueous Zn systems. In Li plating, a current density of 20 to 30 mA cm−2 is considered “high” and is likely to induce dendrite growth due to the low ionic conductivity of nonaqueous Li electrolytes and the presence of an “interphase” on the Li-metal surface. However, under the same conditions, Zn plating may not be subject to diffusion-controlled limitations, and both the HER and the accompanying generation of hydrogen gas bubbles and OH− ions are suppressed. Simultaneously, the Zn2+ concentration increases while the anion concentration decreases at the electrode–electrolyte “interface,” collectively reducing side reactions, including byproduct formation. These points are further evidenced by the current density of conventional Zn electrowinning, which has been optimized since the early twentieth century and is generally controlled at 40 to 50 mA cm−2.803
However, the “high current density” strategy poses practical limitations, especially in large-scale energy storage systems. Increasing the current density necessitates heavier wiring and chargers and leads to substantial heat generation, which can trigger severe side reactions, degrade the battery performance, and in some cases, even cause fire accidents. This is particularly concerning in closed battery systems where the generated hydrogen gas cannot be immediately ventilated, unlike in conventional Zn electrowinning, which uses an open system. Therefore, developing aqueous Zn-metal batteries that guarantee stable Zn plating and stripping at sufficiently low current conditions (such as ≤0.1C) is crucial for their practical utilization and for ensuring high safety.
On the other hand, numerous studies have been conducted on controlling the morphology of plated Zn through electrolyte modification. According to some studies by Haataja et al.,816,817 dendrite growth is largely inhibited by the adsorption and accumulation of electrolyte additives on the surface of the protrusions formed during metal plating. This mechanism involves the use of brighteners (levelers) in the electroplating field, which increase the nucleation overpotential during metal plating to form smaller and denser nuclei, a concept that has been well-documented for decades.818
Further historical examples include the work of Sato in 1959, who reported significant changes in the morphology and orientation of Zn deposits upon adding small amounts of natural polymers like glue, gelatin, albumin, or carbohydrates such as gum arabic, dextrin, starch, and saponin to acidic ZnSO4 solutions.819 In later studies, Robinson et al. demonstrated the effective inhibition of dendrites by incorporating small amounts of antimony and animal glue.820 Additionally, the use of quaternary ammonium salts with varying alkyl groups to suppress Zn dendrite formation was explored by Diggle and Damjanovic in 1972821 and further by Mackinnon et al. in 1979.822 Other substances, such as polyethylene glycol,823 perfluorocarboxylic acids,824 nonyl-phenyl-oxyethylene surfactant,825 lignin sulfonate,826 and ionic liquids827–829 have also proven effective in controlling the Zn morphology.
Guiding the orientation of metal plating to achieve densely packed layers with reduced interelectrode space is a key strategy for preventing Zn dendrite formation and “dead” Zn, which can compromise the battery stability and safety by increasing the risk of short circuits. The structure of the Zn plating, typically occurring in platelet shapes, is influenced by the thermodynamically low surface energy of the (001)Zn crystal plane in hexagonal close-packed Zn metal. Therefore, promoting the [001]Zn orientation during plating is expected to enhance the Coulombic efficiency and promote stable cycling.
In 2019, a team led by Archer explored this approach by leveraging substrates with crystallographic facets with a low lattice mismatch to the plated Zn, enabling epitaxial Zn plating with densely packed structures (Fig. 75).830 They prepared a graphene coated SUS substrate, which shares a similar atomic arrangement with the (001)Zn plane. This arrangement exhibits a lattice misfit of only 7%, significantly below the 25% threshold typically considered necessary for coherent or semicoherent interfaces. Such a low misfit facilitates successful epitaxial Zn plating. In graphene-coated SUS|Zn coin cells using a 2 M ZnSO4 solution, the Coulombic efficiency exceeded 99% during 1000 cycles at 4.0 mA cm−2 and 0.8 mA h cm−2. When tested under higher current densities of 16 and 40 mA cm−2, the cells maintained nearly 99.9% of the Coulombic efficiency over 10000 cycles. This was in sharp contrast to the performance of a bare SUS|Zn cell at 40 mA cm−2 and 0.8 mA h cm−2, which was characterized by a poor Coulombic efficiency below 90% and short-circuit of the cell within just 10 cycles.
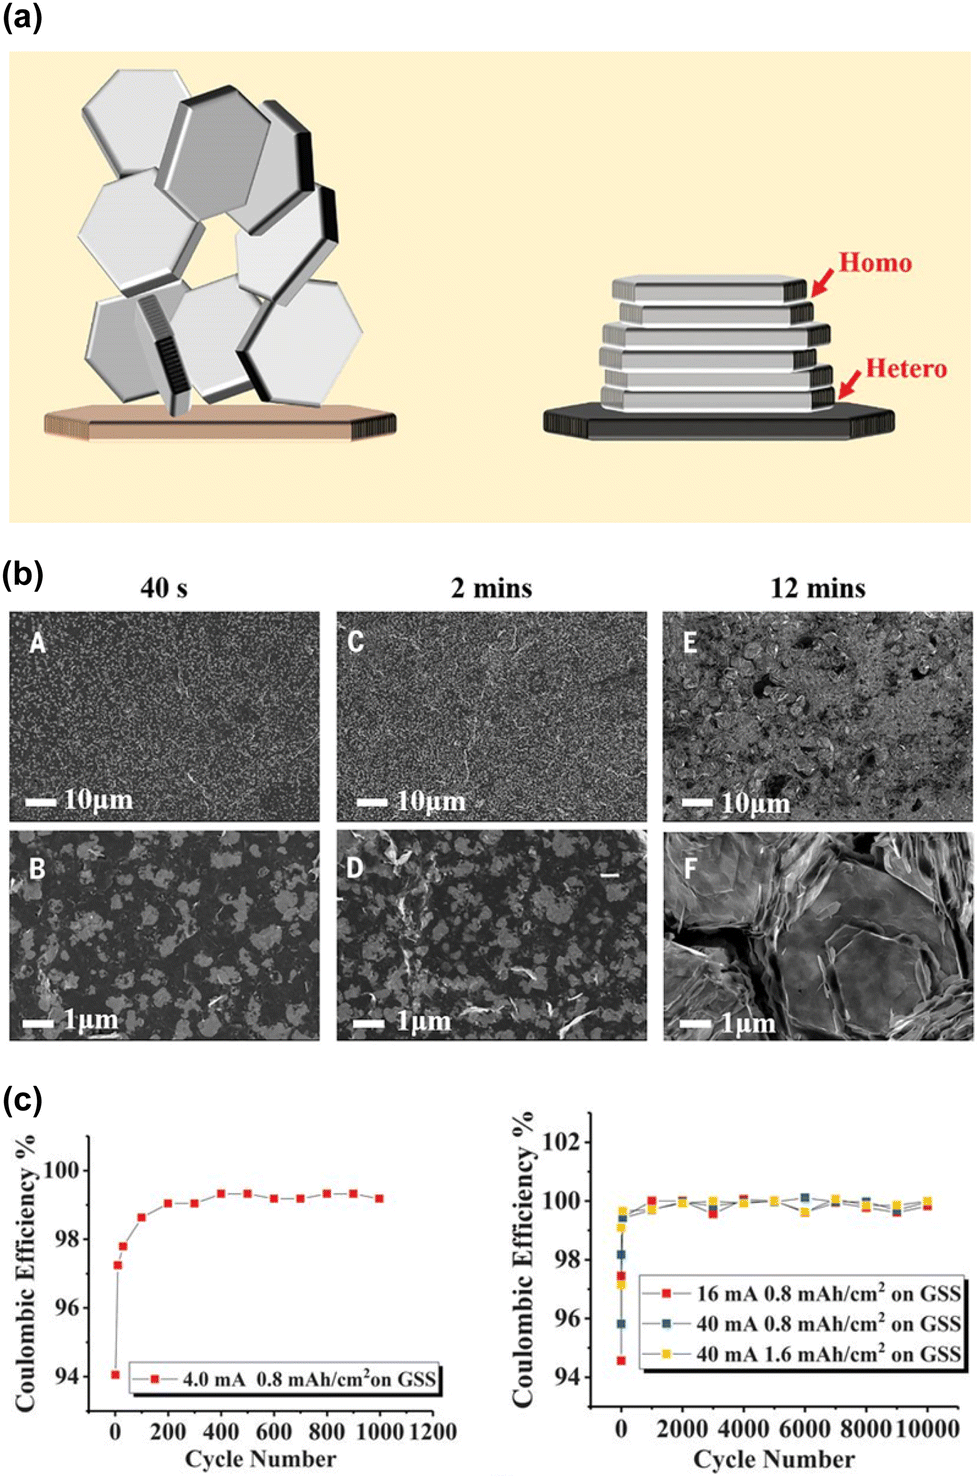 | ||
| Fig. 75 (a) Design principle of epitaxial metal electrodeposition. (b) SEM images of Zn deposits on graphene-coated stainless steel (GSS). The epitaxial electrodeposition process is divided into two stages: stage I involves heteroepitaxy between Zn and graphene (A)–(D), and stage II involves the homoepitaxy of Zn after the graphene surface is fully covered (E) and (F). (c) Coulombic efficiency at different current densities on GSS.830 Reprinted with permission from Science. | ||
Achieving densely packed Zn plating is difficult when commercially available Zn plates, characterized by random orientations, are used as substrates. In 2021, Zhou et al. produced Zn plates that enabled Zn growth in a direction perpendicular to the Zn plane.697 In a symmetric cell setup with 2 M ZnSO4 + 0.1 M MnSO4/H2O at 1 mA cm−2 and 1 mA h cm−2, the developed Zn plates maintained stable cycling for over 500 h, unlike commercial Zn plates, which often short-circuited before reaching 50 cycles.
It is essential to clarify the distinction between “plane” and “orientation” in crystallography, as these terms have often been used interchangeably but inaccurately in the literature on aqueous Zn-metal batteries. For example, (001)Zn denotes a crystal “plane” as defined by the Miller indices, while [001] represents the direction perpendicular to this plane. Often, there is confusion where (002)Zn is referenced, but the actual exposed “plane” during the plating process is typically (001)Zn. This discrepancy arises from the misapplication of the “systematic extinction rule” related to structure factor calculations. Even though certain crystal symmetries may result in specific structure factors being exactly zero, this does not negate the existence of the crystal “plane” or “orientation.” Furthermore, identifying these planes and orientations typically requires more than standard XRD techniques; a combination of SEM and electron backscatter diffraction is necessary for precise determination.
In most aqueous Zn electrolytes, Zn is plated in hexagonal platelet shapes, with the (001)Zn plane exposed to minimize the thermodynamic surface energy. Fortunately, the (001)Zn plane offers a high HER overpotential, providing high reversibility for Zn plating and stripping despite the thermodynamic potential of Zn/Zn2+ being lower than that of the HER in the electrolytes. Therefore, controlling the “plane” is typically not the primary focus in aqueous Zn-metal battery development.
However, when it is expressed that Zn grows in the direction perpendicular to the (001)Zn plane, this implies that the plated Zn is oriented in the [001] direction (where [001] refers to the directional vector). Confirming the “orientation” of plated Zn requires detailed XRD analysis and comprehensive scanning of the reciprocal space, such as through pole-figure measurements, to analyze the crystal orientation distribution. The crystal growth “orientation” largely depends on the type of substrate, and also on factors such as the type of electrolyte and plating/stripping conditions (e.g., current density, temperature, and areal capacity). Interactions among the electrolyte, electrolyte reduction species, and the plated Zn can modify the growth “orientation” in various ways, even on substrates suitable for epitaxial growth. Thus, achieving densely packed Zn with a reduced interelectrode space—thereby enhancing the cycling stability of aqueous Zn-metal batteries and preventing the formation of Zn dendrites and “dead” Zn—requires the careful development of substrates and electrolytes, along with optimized plating and stripping conditions.
7.8. Electrolyte-decoupled batteries with conversion reaction-based cathodes
The electrolyte-decoupling concept has typically been utilized in redox flow batteries. Recent advancements in ion-exchange membranes, designed to prevent chemical crossover between the anolyte and catholyte while facilitating charge carrier-ion transport, have opened opportunities to apply this concept in conventional non-flow aqueous batteries.831Attention has also shifted toward cathode materials that align well with electrolyte-decoupling systems. A notable example is halogen|Zn batteries, proposed over 150 years ago, which utilize reversible conversion reactions between X− and X2/X3− (X = Cl, Br, and I). It is worth noting that F−/F2 is excluded from this review due to its extreme corrosiveness and toxicity, making battery fabrication highly challenging.
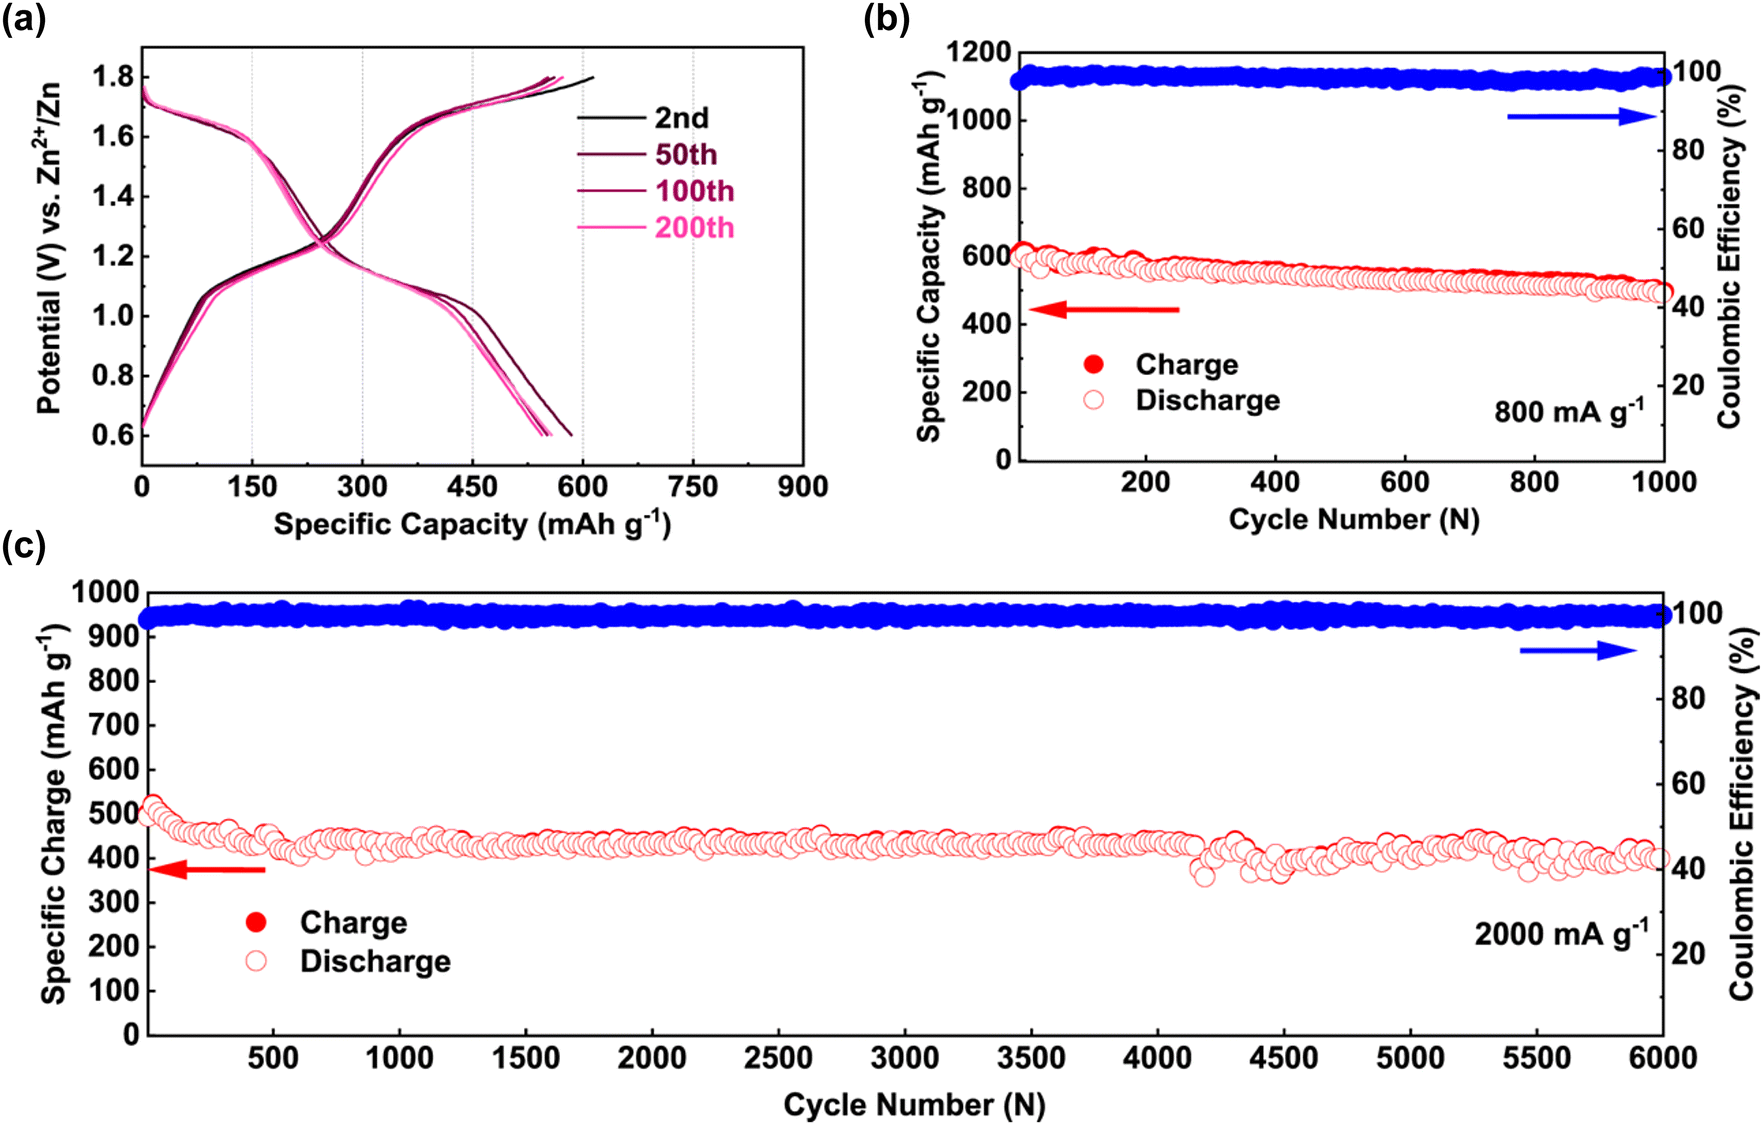 | ||
| Fig. 76 High-voltage aqueous Zn-metal batteries based on I−/I2/I+ conversion reactions in a highly salt-concentrated hybrid aqueous/nonaqueous (ZnCl2 + LiCl + acetonitrile/H2O) electrolyte. (a) Voltage profiles at 400 mA g−1, demonstrating an increased upper cut-off voltage from 1.3 V (I−/I2) to 1.8 V (I−/I2/I+). Note that while the theoretical capacity of the I−/I2/I+ conversion reaction is 422 mA h g−1, a use of a carbon cathode host provides additional capacitance, increasing the total capacity to 594 mA h g−1. (b) and (c) Long-term cycling performance of the battery at 800 mA g−1 and 2000 mA g−1, respectively.847 Reprinted with permission from Nature Communications. | ||
However, inhalation of highly volatile Br2 vapors can severely damage the lungs and stomach. Moreover, oxidized halogen ions form polyhalides, which maintain equilibrium with dissociated X2n−1− and X2 (X = Br or I) in solution.848,849 The small molecular size and hydrophobic nature of halogen molecules (e.g. Br2, I2), combined with the limited solubility of polyhalides in aqueous electrolytes, drive phase separation and crossover to the anode, substantially diminishing the battery's efficiency and stability. To address these issues, battery charging is often limited to two-thirds of the state of charge. Functional electrolyte additives such as quaternary ammonium, imidazolium, nitriles, pyridinium, and soft cation/hard anion-based zwitterionic trappers have also been studied to enhance the solubility of polyhalides and enable high states of charge via various stabilizing mechanisms, including electrostatic, dipole–dipole, and hydrogen-bonding interactions (Fig. 77).850–858
 | ||
| Fig. 77 (a) Design principle and (b) proposed reaction mechanism of soft-hard zwitterionic trappers (SH-ZITs) with polyhalides, leading to the formation of soluble phases and reduced permeability. (c) Electrochemical performance of 2 M KBr catholyte charged to 80–90% state of charge without/with 2 M SH-ZIT. Excess 1,1′-bis[3-sulfonatopropyl]-4,4′-bipyridinium and 2 M KBr anolyte were utilized with cation-exchange membranes.858 Reprinted with permission from Nature. | ||
While these advances show potential for improved Coulombic efficiency and charge/discharge depth, considerable obstacles persist. The addition of large amounts of electrolyte additives reduces energy efficiency with increased cell resistance. Furthermore, ensuring long-term safety and reliability in large-scale batteries over multi-year operations under practical conditions, including a wide temperature range, varying cycling rates, and alternating depths of charge and discharge remains a critical, unresolved challenge.
 | ||
| Fig. 78 (a) The working mechanism of an electrolyte-decoupled MnO2|Zn battery. (b) and (c) Discharge voltage profiles and long-term cycling stability of the cell.862 Reprinted with permission from Nature Energy. | ||
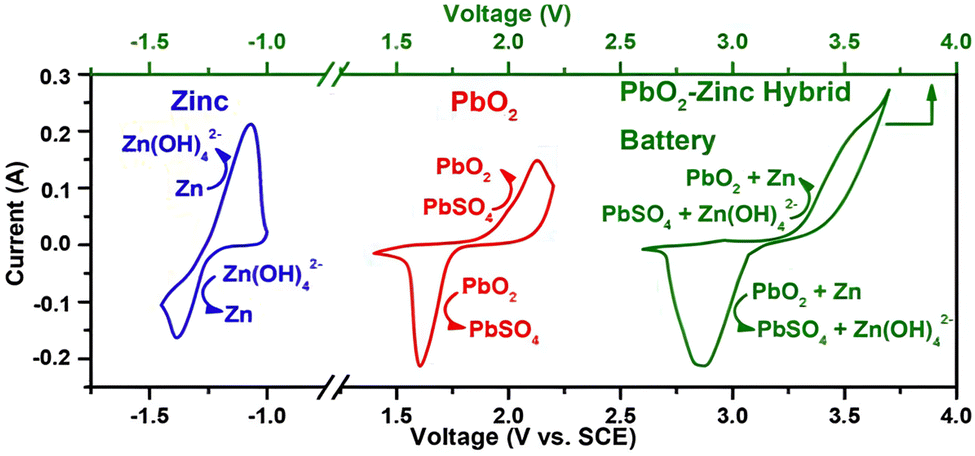 | ||
| Fig. 79 Cyclic voltammetry curves of Zn in an alkaline electrolyte (blue), PbO2 in an acidic electrolyte (red), and a PbO2|Zn battery with an electrolyte decoupling system (alkaline anolyte and acidic catholyte) (green) under a scan rate of 10 mV s−1.867 Reprinted with permission from Angewandte Chemie International Edition. | ||
However, electrolyte-decoupling systems face a fundamental limitation in their energy storage and release mechanisms, which are heavily dependent on electrolyte volume. Additionally, achieving reversible conversion reactions in transition metal oxides involves nano-engineering, inherently lowering Coulombic efficiency with accelerated electrolyte oxidation due to the increased surface area. This, in turn, necessitates a large amount of electrolyte to sustain long-term cycling, significantly diminishing energy density. The differing Coulombic efficiencies of anode and cathode redox reactions require varying electrolyte volumes within the system, adding complexity and further reducing practicality. This stands in stark contrast to intercalation/deintercalation-based batteries—a success story recognized by the Nobel Prize—that largely enhance energy density by drastically reducing electrolyte volume with a high Coulombic efficiency exceeding 99.95% in a single electrolyte system. Also, batteries containing Pb pose significant environmental risks, and Zn plating/stripping reactions in alkaline environments often suffer from insufficient reversibility, as demonstrated in Section 7.2.
Another challenge lies in ion-exchange membranes, which are typically composed of a hydrophobic polymer matrix, fixed ionic functional groups, and mobile counter-ions, with their ability to select/transport ions governed by Donnan equilibrium.831 The small size and high mobility of protons (H+) and hydroxide ions (OH−) make it particularly difficult to prevent their crossover during long-term battery operation. Once H+ and OH− cross the membrane, they undergo a neutralization reaction (H2O formation), disrupting the local ionic balance and equilibrium. Although advanced configurations, such as dual-membranes (cation-exchange membrane|buffer electrolyte|anion-exchange membrane) or bipolar membranes (cation-exchange membrane|intermediate catalyst layer|anion-exchange membrane), have been explored to address these issues, increasing the number of membranes raises diffusion resistance, overpotential, and system complexity, ultimately reducing the battery operation efficiency. Furthermore, separating the anolyte and catholyte in traditional electrode designs (e.g. jelly roll) and manufacturing processes is infeasible without specialized methods such as semi-solid electrode techniques, which are still in developmental stages (Fig. 80).
 | ||
| Fig. 80 Schematic representation of ion transport mechanisms in (a) anion- and (b) cation-exchange membranes.831 Reprinted with permission from Nature Review Chemistry. | ||
8. Conclusions and perspectives
The advancements and challenges associated with rechargeable aqueous Li-, Na-, K-, and Zn-ion batteries have been thoroughly discussed in this review. These batteries are promising because of their low production costs, high safety, and environmental benefits, rendering them ideal for various energy storage applications, particularly in large-scale systems. However, realizing their full potential, i.e., offering high energy and power densities while maintaining long-term cycling stability under practical operating conditions, requires addressing several complex challenges related to (1) the narrow operating potential windows of aqueous electrolytes, (2) unstable SEI, (3) insufficient exploration and optimization of active materials, and (4) electrode/cell designs to mitigate side reactions, lower manufacturing costs, and ensure ease of production. These points are summarized below:(1) The thermodynamically narrow potential window of water (1.23 V) limits the output voltage of aqueous batteries. Although highly salt-concentrated aqueous electrolytes, which provide substantially reduced water activity, help to widen the electrolyte potential window both thermodynamically and kinetically, they introduce additional issues such as increased viscosity, decreased ionic conductivity, high costs, and poor wide-temperature-range functionalities, all of which impact the battery performance and manufacturability.
(2) Forming and maintaining an SEI in aqueous environments are more challenging than in nonaqueous systems. The HER consumes the electrons needed for SEI formation, leading to SEI exfoliation by the generation of hydrogen gas bubbles. Additionally, the small molecular size and high dielectric constant of water destabilize the SEI by expanding it and accelerating the diffusion of SEI components into the bulk electrolyte. These issues are more pronounced in Na, K, and Zn systems than in aqueous Li electrolytes owing to the weak Lewis acidity of Na+ and K+ and the high redox potential of Zn/Zn2+, which do not provide sufficient driving force to lower the water activity and facilitate anion reduction, respectively. Although ex situ SEI formation has been explored as a solution, its effectiveness remains under debate because of its low ionic conductivity, poor stability, and limited functionality under practical operating conditions.
(3) The active materials introduced in aqueous systems are often merely an extension of those developed for nonaqueous batteries. There has been insufficient consideration of the unique requirements of aqueous environments, such as high chemical stability, minimal proton and/or water co-intercalation, low catalytic effect on water electrolysis, and high resistance to dissolution in water. Furthermore, the limited exploration of suitable active materials for K+ and Zn2+ presents challenges akin to those encountered in nonaqueous systems. In some instances, research and development efforts have been misguided owing to misunderstood intercalation chemistry.
(4) The compatibility of various battery components, such as separators and current collectors with aqueous electrolytes, presents significant challenges. Traditional separators designed for nonaqueous batteries exhibit poor wettability in aqueous electrolytes. Consequently, most studies on rechargeable aqueous batteries have relied heavily on thick glass fiber-based separators that necessitate the use of a large volume of electrolyte, thus reducing the energy density of the battery. Moreover, using Ti, which offers high deformation resistance and limited ductility, as the exclusive current collector in aqueous systems, further complicates manufacturing and escalates production costs. Research on binders and carbon additives suitable for aqueous batteries is scant, as are studies on the optimization of electrode compositions incorporating these materials.
Addressing the aforementioned challenges requires prioritizing a profound and clear understanding of practical issues, the mechanisms behind proposed solutions, and the validity of evaluation and analysis methods. Multidisciplinary approaches that integrate materials science, organic/inorganic chemistry, and electrochemical engineering are essential for material development. Innovative electrolyte formulations based on novel salts, co-solvents, additives, and advanced SEI formation protocols or mechanisms, such as pulse charging/discharging, need exploration.
Optimizing the potential diagram of full cells (potential-shift strategy) can be one of the promising directions. Particularly crucial is addressing the significant issue of electrolyte reduction at the anode through a collective understanding of how the electrostatic potential (liquid Madelung potential) of carrier ions in the electrolyte is destabilized. Factors influencing the electrode potential, such as the dielectric properties and entropy of the electrolyte, should also be studied quantitatively and systematically. Research dedicated to tailoring active materials for aqueous electrolytes, coupled with an intensive exploration of structures that facilitate smooth intercalation and deintercalation of large and/or divalent ions, as well as doping/coating of active materials and the use of electrode additives, will enhance the battery energy density and long-term cycling stability. Furthermore, the development of new separators and current collectors that are thin, flexible, strong, and highly compatible with aqueous electrolytes will enhance battery safety. The use of electrolyte additives that allow for the employment of Al and Cu current collectors and the optimization of overall electrode and battery designs, including binders, carbon additives, and other components, is advantageous in this research direction.
Overcoming these barriers through strategic and innovative methods will pave the way for the future expansion of high-energy-density rechargeable aqueous batteries. Such advancements will play a pivotal role in promoting a green power network and realizing an energy-efficient and sustainable society.
Author contributions
A. Y. conceived and guided the manuscript direction and thoroughly reviewed the manuscript. S. K. wrote the first draft. S. N., N. T., A. K. contributed to editing Sections 5 and 7.7, 6.1 and 7.4, 1 and 4.3, respectively.Data availability
This review article does not contain any primary data. All data discussed in this manuscript are available within the cited literature and publicly accessible sources.Conflicts of interest
There are no conflicts to declare.Acknowledgements
This study was supported by the Japan Science and Technology Agency (JST) CREST Program (grant no. JP 21467943), a JST Program on Open Innovation Platform for Industry-Academia Co-Creation (grant no. JPMJPF2016), a Japan Society for the Promotion of Science (JSPS) Grant-in Aid for Scientific Research (S) (grant no. 20H05673), a JSPS Grant-in-Aid for Specially Promoted Research (no. 15H05701), a JST FOREST Program (grant no. JPMJFR223L), and JSPS KAKENHI (grant no. 21K20480, 22K05284, 23K04906, 23K13817).References
- The Nobel Prize in Chemistry 2019, https://www.nobelprize.org/prizes/chemistry/2019/popular-information, 2024.12.29.
- P. V. Kamat, ACS Energy Lett., 2019, 4, 2757–2759 CrossRef.
- A. K. Stephan, Joule, 2019, 3, 2583–2584 CrossRef.
- J. Xie and Y.-C. Lu, Nat. Commun., 2020, 11, 2499 CrossRef CAS PubMed.
- A. Yoshino, Angew. Chem., Int. Ed., 2012, 51, 5798–5800 CrossRef CAS PubMed.
- P. F. Mottelay, Bibliographical History of Electricity and Magnetism, chronologically arranged, Charles Griffin and Company Limited, London, 2008, p. 247 Search PubMed.
- A. Kozawa, Primary Batteries—Leclanché Systems, Comprehensive Treatise of Electrochemistry, Springer US, Boston, 1981, pp. 207–218 Search PubMed.
- K. Kordesch, Primary Batteries—Alkaline Manganese Dioxide-Zinc Batteries, Comprehensive Treatise of Electrochemistry, Springer US, Boston, 1981, pp. 219–232 Search PubMed.
- S. Ruben, Primary Batteries—Sealed Mercurial Cathode Dry Cells, Comprehensive Treatise of Electrochemistry, Springer US, Boston, 1981, pp. 233–245 Search PubMed.
- G. G. Yadav, X. Wei and M. Meeus, Primary zinc-air batteries, Electrochemical Power Sources: Fundamentals Systems and Applications, Elsevier, 2021, pp. 23–45 Search PubMed.
- D. Berndt, Secondary Batteries—Lead-Acid Batteries, Comprehensive Treatise of Electrochemistry, Springer US, Boston, 1981, pp. 371–384 Search PubMed.
- F. von Sturm, Secondary Batteries—Nickel-Cadmium Battery, Comprehensive Treatise of Electrochemistry, Springer US, Boston, 1981, pp. 385–405 Search PubMed.
- P. Ruetschi, F. Meli and J. Desilvestro, J. Power Sources, 1995, 57, 85–91 CrossRef CAS.
- F. von Sturm, Secondary Batteries—Silver-Zinc Battery, Comprehensive Treatise of Electrochemistry, Springer US, Boston, 1981, pp. 407–419 Search PubMed.
- M. L. Kronenberg and G. E. Blomgren, Primary Batteries—Lithium Batteries, Comprehensive Treatise of Electrochemistry, Springer US, Boston, 1981, pp. 247–278 Search PubMed.
- G. V. Zhuang, K. Xu, H. Yang, T. R. Jow and P. N. Ross, J. Phys. Chem. B, 2005, 109, 17567–17573 CrossRef CAS PubMed.
- W. Li, J. R. Dahn and D. S. Wainwright, Science, 1994, 264, 1115–1118 CrossRef CAS PubMed.
- L. Suo, O. Borodin, T. Gao, M. Olguin, J. Ho, X. Fan, C. Luo, C. Wang and K. Xu, Science, 2015, 350, 938–943 CrossRef CAS PubMed.
- Y. Yamada, K. Usui, K. Sodeyama, S. Ko, Y. Tateyama and A. Yamada, Nat. Energy, 2016, 1, 16129 CrossRef CAS.
- L. Suo, D. Oh, Y. Lin, Z. Zhuo, O. Borodin, T. Gao, F. Wang, A. Kushima, Z. Wang, H.-C. Kim, Y. Qi, W. Yang, F. Pan, J. Li, K. Xu and C. Wang, J. Am. Chem. Soc., 2017, 139, 18670–18680 CrossRef CAS PubMed.
- S. Ko, Y. Yamada and A. Yamada, ACS Appl. Mater. Interfaces, 2019, 11, 45554–45560 CrossRef CAS PubMed.
- H. Kim, J. Hong, K.-Y. Park, H. Kim, S.-W. Kim and K. Kang, Chem. Rev., 2014, 114, 11788–11827 CrossRef CAS PubMed.
- D. Bin, F. Wang, A. G. Tamirat, L. Suo, Y. Wang, C. Wang and Y. Xia, Adv. Energy Mater., 2018, 8(17), 1703008 CrossRef.
- D. Pahari and S. Puravankara, ACS Sustainable Chem. Eng., 2020, 8(29), 10613–10625 CAS.
- X. Zhang, T. Xiong, B. He, S. Feng, X. Wang, L. Wei and L. Mai, Energy Environ. Sci., 2022, 15, 3750–3774 RSC.
- B. Tang, L. Shan, S. Liang and J. Zhou, Energy Environ. Sci., 2019, 12, 3288–3304 RSC.
- X. Li, L. Wang, Y. Fu, H. Dang, D. Wang and F. Ran, Nano Energy, 2023, 116, 108858 CrossRef CAS.
- K. Adachi, A. Kitada, K. Fukami and K. Murase, Electrochim. Acta, 2020, 338, 135873 CrossRef CAS.
- J. Liu, J. Hu, Q. Deng, J. Mo, H. Xie, Z. Liu, Y. Xiong, X. Wu and Y. Wu, Isr. J. Chem., 2015, 55, 521–536 CrossRef CAS.
- D. Chao, W. Zhou, F. Xie, C. Ye, H. Li, M. Jaroniec and S.-Z. Qiao, Sci. Adv., 2020, 6, eaba4098 CrossRef CAS PubMed.
- Y. Liu, X. Lu, F. Lai, T. Liu, P. R. Shearing, I. P. Parkin, G. He and D. J. L. Brett, Joule, 2021, 5, 2845–2903 CrossRef CAS.
- H. Ahn, D. Kim, M. Lee and K. W. Nam, Commun. Mater., 2023, 4, 37 CrossRef.
- W. Li and J. R. Dahn, J. Electrochem. Soc., 1995, 142, 1742–1746 CrossRef CAS.
- G. N. Lewis and F. G. Keyes, J. Am. Chem. Soc., 1913, 35, 340–344 CrossRef CAS.
- R. G. Selim, K. R. Hill and M. L. B. Rao, National Aeronautics and Space Administration, Fourth Quarterly Report - Research and Development of a High Capacity Nonaqueous Secondary Battery, NAS CR-54874, 1965.
- M. S. Whittingham, Science, 1976, 192, 1126–1127 CrossRef CAS PubMed.
- S. Megahed and B. Scrosati, J. Power Sources, 1994, 51, 79–104 CrossRef CAS.
- J. B. Goodenough, Acc. Chem. Res., 2013, 46, 1053–1061 CrossRef CAS PubMed.
- M. Li, J. Lu, Z. Chen and K. Amine, Adv. Mater., 2018, 30(13), 1800561 CrossRef PubMed.
- Y. Nishi, J. Power Sources, 2001, 100, 101–106 CrossRef CAS.
- M. M. Thackeray, C. Wolverton and E. D. Isaacs, Energy Environ. Sci., 2012, 5, 7854 RSC.
- J. W. Choi and D. Aurbach, Nat. Rev. Mater., 2016, 1, 16013 CrossRef CAS.
- T. Placke, R. Kloepsch, S. Dühnen and M. Winter, J. Solid State Electrochem., 2017, 21, 1939–1964 CrossRef CAS.
- M. Winter, B. Barnett and K. Xu, Chem. Rev., 2018, 118, 11433–11456 CrossRef CAS PubMed.
- P. Albertus, S. Babinec, S. Litzelman and A. Newman, Nat. Energy, 2017, 3, 16–21 CrossRef.
- S. Ko, Y. Yamada and A. Yamada, Joule, 2021, 5, 998–1009 CrossRef CAS.
- S. Ko, Y. Yamada and A. Yamada, Batteries Supercaps, 2020, 1–8 Search PubMed.
- S. Ko, X. Han, T. Shimada, N. Takenaka, Y. Yamada and A. Yamada, Nat. Sustainability, 2023, 6, 1705–1714 CrossRef.
- C.-Y. Wang, G. Zhang, S. Ge, T. Xu, Y. Ji, X.-G. Yang and Y. Leng, Nature, 2016, 529, 515–518 CrossRef CAS PubMed.
- M.-T. F. Rodrigues, G. Babu, H. Gullapalli, K. Kalaga, F. N. Sayed, K. Kato, J. Joyner and P. M. Ajayan, Nat. Energy, 2017, 2, 17108 CrossRef CAS.
- J. Hou, M. Yang, D. Wang and J. Zhang, Adv. Energy Mater., 2020, 10(18), 1904152 CrossRef CAS.
- J. Holoubek, H. Liu, Z. Wu, Y. Yin, X. Xing, G. Cai, S. Yu, H. Zhou, T. A. Pascal, Z. Chen and P. Liu, Nat. Energy, 2021, 6, 303–313 CrossRef CAS PubMed.
- G. X. Wang, S. Zhong, D. H. Bradhurst, S. X. Dou and H. K. Liu, J. Power Sources, 1998, 74, 198–201 CrossRef CAS.
- J. Köhler, H. Makihara, H. Uegaito, H. Inoue and M. Toki, Electrochim. Acta, 2000, 46, 59–65 CrossRef.
- H. Wang, K. Huang, Y. Zeng, S. Yang and L. Chen, Electrochim. Acta, 2007, 52, 3280–3285 CrossRef CAS.
- H. Wang, K. Huang, Y. Zeng, F. Zhao and L. Chen, Electrochem. Solid-State Lett., 2007, 10, A199 CrossRef CAS.
- G. J. Wang, H. P. Zhang, L. J. Fu, B. Wang and Y. P. Wu, Electrochem. Commun., 2007, 9, 1873–1876 CrossRef CAS.
- G. J. Wang, N. H. Zhao, L. C. Yang, Y. P. Wu, H. Q. Wu and R. Holze, Electrochim. Acta, 2007, 52, 4911–4915 CrossRef CAS.
- G. Wang, L. Fu, N. Zhao, L. Yang, Y. Wu and H. Wu, Angew. Chem., Int. Ed., 2007, 46, 295–297 CrossRef CAS PubMed.
- J.-Y. Luo and Y.-Y. Xia, Adv. Funct. Mater., 2007, 17, 3877–3884 CrossRef CAS.
- H. Wang, Y. Zeng, K. Huang, S. Liu and L. Chen, Electrochim. Acta, 2007, 52, 5102–5107 CrossRef CAS.
- G. Wang, Q. Qu, B. Wang, Y. Shi, S. Tian and Y. Wu, ChemPhysChem, 2008, 9, 2299–2301 CrossRef CAS PubMed.
- G. J. Wang, L. J. Fu, B. Wang, N. H. Zhao, Y. P. Wu and R. Holze, J. Appl. Electrochem., 2008, 38, 579–581 CrossRef CAS.
- X.-H. Liu, T. Saito, T. Doi, S. Okada and J. Yamaki, J. Power Sources, 2009, 189, 706–710 CrossRef CAS.
- J.-Y. Luo, W.-J. Cui, P. He and Y.-Y. Xia, Nat. Chem., 2010, 2, 760–765 CrossRef CAS PubMed.
- G. J. Wang, L. C. Yang, Q. T. Qu, B. Wang, Y. P. Wu and R. Holze, J. Solid State Electrochem., 2010, 14, 865–869 CrossRef CAS.
- M. Zhao, Q. Zheng, F. Wang, W. Dai and X. Song, Electrochim. Acta, 2011, 56, 3781–3784 CrossRef CAS.
- W. Tang, L. Liu, Y. Zhu, H. Sun, Y. Wu and K. Zhu, Energy Environ. Sci., 2012, 5, 6909 RSC.
- R. B. Shivashankaraiah, H. Manjunatha, K. C. Mahesh, G. S. Suresh and T. V. Venkatesha, J. Solid State Electrochem., 2012, 16, 1279–1290 CrossRef CAS.
- L. Liu, F. Tian, M. Zhou, H. Guo and X. Wang, Electrochim. Acta, 2012, 70, 360–364 CrossRef CAS.
- C. Li, X. Sun, Q. Du and H. Zhang, Solid State Ionics, 2013, 249–250, 72–77 CrossRef CAS.
- M. Zhao, B. Zhang, G. Huang, H. Zhang and X. Song, J. Power Sources, 2013, 232, 181–186 CrossRef CAS.
- M. Vujković, I. Stojković, N. Cvjetićanin and S. Mentus, Electrochim. Acta, 2013, 92, 248–256 CrossRef.
- H. Qin, Z. P. Song, H. Zhan and Y. H. Zhou, J. Power Sources, 2014, 249, 367–372 CrossRef CAS.
- Y. Wang, X. Cui, Y. Zhang, L. Zhang, X. Gong and G. Zheng, Adv. Mater., 2016, 28, 7626–7632 CrossRef CAS PubMed.
- L. Suo, O. Borodin, W. Sun, X. Fan, C. Yang, F. Wang, T. Gao, Z. Ma, M. Schroeder, A. von Cresce, S. M. Russell, M. Armand, A. Angell, K. Xu and C. Wang, Angew. Chem., Int. Ed., 2016, 55, 7136–7141 CrossRef CAS PubMed.
- Z. Zhou, W. Luo, H. Huang, S. Huang, Y. Xia, N. Zhou and Z. He, Ceram. Int., 2017, 43, 99–105 CrossRef CAS.
- H. Wang, H. Zhang, Y. Cheng, K. Feng, X. Li and H. Zhang, J. Mater. Chem. A, 2017, 5, 593–599 RSC.
- L. Chen, W. Li, Z. Guo, Y. Wang, C. Wang, Y. Che and Y. Xia, J. Electrochem. Soc., 2015, 162, A1972–A1977 CrossRef CAS.
- X. Dong, H. Yu, Y. Ma, J. L. Bao, D. G. Truhlar, Y. Wang and Y. Xia, Chem. – Eur. J., 2017, 23, 2560–2565 CrossRef CAS PubMed.
- W. Sun, L. Suo, F. Wang, N. Eidson, C. Yang, F. Han, Z. Ma, T. Gao, M. Zhu and C. Wang, Electrochem. Commun., 2017, 82, 71–74 CrossRef CAS.
- Y. Liang, Y. Jing, S. Gheytani, K.-Y. Lee, P. Liu, A. Facchetti and Y. Yao, Nat. Mater., 2017, 16, 841–848 CrossRef CAS PubMed.
- F. Wang, L. Suo, Y. Liang, C. Yang, F. Han, T. Gao, W. Sun and C. Wang, Adv. Energy Mater., 2017, 7(8), 1600922 CrossRef.
- H. Wang, H. Zhang, Y. Cheng, K. Feng, X. Li and H. Zhang, Electrochim. Acta, 2018, 278, 279–289 CrossRef CAS.
- S. Ko, Y. Yamada, K. Miyazaki, T. Shimada, E. Watanabe, Y. Tateyama, T. Kamiya, T. Honda, J. Akikusa and A. Yamada, Electrochem. Commun., 2019, 104, 106488 CrossRef CAS.
- A. S. Lakhnot, T. Gupta, Y. Singh, P. Hundekar, R. Jain, F. Han and N. Koratkar, Energy Storage Mater., 2020, 27, 506–513 CrossRef.
- H. Umeno, K. Kawai, D. Asakura, M. Okubo and A. Yamada, Adv. Sci., 2022, 9(12), 2104907 CrossRef CAS PubMed.
- K. Xu and C. Wang, Nat. Energy, 2016, 1, 16161 CrossRef CAS.
- D. Reber, R.-S. Kühnel and C. Battaglia, ACS Mater. Lett., 2019, 1, 44–51 CrossRef CAS.
- Q. Zheng, S. Miura, K. Miyazaki, S. Ko, E. Watanabe, M. Okoshi, C. Chou, Y. Nishimura, H. Nakai, T. Kamiya, T. Honda, J. Akikusa, Y. Yamada and A. Yamada, Angew. Chem., Int. Ed., 2019, 58, 14202–14207 CrossRef CAS PubMed.
- D. Reber, N. Takenaka, R.-S. Kühnel, A. Yamada and C. Battaglia, J. Phys. Chem. Lett., 2020, 11, 4720–4725 CrossRef CAS PubMed.
- R. S. Carmichael, Mineral Composition of Rocks, Practical Handbook of Physical Properties of Rocks and Minerals, CRC Press, Boca Raton, 2017, p. 3 Search PubMed.
- J.-M. Tarascon, Nat. Chem., 2010, 2, 510 CrossRef CAS PubMed.
- E. A. Olivetti, G. Ceder, G. G. Gaustad and X. Fu, Joule, 2017, 1, 229–243 CrossRef.
- T. C. Wanger, Conserv. Lett., 2011, 4, 202–206 CrossRef.
- Y. Li, Y. Lu, C. Zhao, Y.-S. Hu, M.-M. Titirici, H. Li, X. Huang and L. Chen, Energy Storage Mater., 2017, 7, 130–151 CrossRef.
- Tradingeconomics, https://tradingeconomics.com, 2024.12.29.
- K. Knehr, J. Kubal and S. Ahmed, Argonne National Laboratory, Report – Estimated cost of EV batteries 2019–2024, 2024.
- D. Wu, X. Li, X. Liu, J. Yi, P. Acevedo-Peña, E. Reguera, K. Zhu, D. Bin, N. Melzack, R. G. A. Wills, J. Huang, X. Wang, X. Lin, D. Yu and J. Ma, J. Phys.: Energy, 2022, 4, 041501 CAS.
- E. R. Nightingale, J. Phys. Chem., 1959, 63, 1381–1387 CrossRef CAS.
- J. Mähler and I. Persson, Inorg. Chem., 2012, 51, 425–438 CrossRef PubMed.
- R. D. Shannon, Acta Crystallogr., Sect. A, 1976, 32, 751–767 CrossRef.
- N. Yabuuchi, K. Kubota, M. Dahbi and S. Komaba, Chem. Rev., 2014, 114, 11636–11682 CrossRef CAS PubMed.
- T. Hosaka, K. Kubota, A. S. Hameed and S. Komaba, Chem. Rev., 2020, 120, 6358–6466 CrossRef CAS PubMed.
- N. Ohtomo and K. Arakawa, Bull. Chem. Soc. Jpn., 1979, 52, 2755–2759 CrossRef CAS.
- G. Pálinkás, T. Radnai and F. Hajdu, Z. Naturforsch., 1980, 35, 107–114 CrossRef.
- S. Bouazizi and S. Nasr, J. Mol. Struct., 2007, 837, 206–213 CrossRef CAS.
- M. Maeda and H. Ohtaki, Bull. Chem. Soc. Jpn., 1975, 48, 3755–3756 CrossRef CAS.
- N. Ohtomo and K. Arakawa, Bull. Chem. Soc. Jpn., 1980, 53, 1789–1794 CrossRef CAS.
- H. Ohtaki and N. Fukushima, J. Solution Chem., 1992, 21, 23–38 CrossRef CAS.
- R. Mancinelli, A. Botti, F. Bruni, M. A. Ricci and A. K. Soper, J. Phys. Chem. B, 2007, 111, 13570–13577 CrossRef CAS PubMed.
- A. K. Soper and K. Weckström, Biophys. Chem., 2006, 124, 180–191 CrossRef CAS PubMed.
- H. H. Loeffler and B. M. Rode, J. Chem. Phys., 2002, 117, 110–117 CrossRef CAS.
- W. Rudolph, M. H. Brooker and C. C. Pye, J. Phys. Chem., 1995, 99, 3793–3797 CrossRef CAS.
- H. Du, J. C. Rasaiah and J. D. Miller, J. Phys. Chem. B, 2007, 111, 209–217 CrossRef CAS PubMed.
- S. S. Azam, T. S. Hofer, B. R. Randolf and B. M. Rode, J. Phys. Chem. A, 2009, 113, 1827–1834 CrossRef CAS PubMed.
- S. Liu, R. Zhang, J. Mao, J. Yuwono, C. Wang, K. Davey and Z. Guo, Appl. Phys. Rev., 2023, 10, 021304 CAS.
- T. Hosaka, A. Noda, K. Kubota, K. Chiguchi, Y. Matsuda, K. Ida, S. Yasuno and S. Komaba, ACS Appl. Mater. Interfaces, 2022, 14, 23507–23517 CrossRef CAS PubMed.
- X. Wu, Y. Cao, X. Ai, J. Qian and H. Yang, Electrochem. Commun., 2013, 31, 145–148 CrossRef CAS.
- K. Nakamoto, R. Sakamoto, Y. Sawada, M. Ito and S. Okada, Small Methods, 2019, 3, 1800220 CrossRef CAS.
- L. Jiang, L. Liu, J. Yue, Q. Zhang, A. Zhou, O. Borodin, L. Suo, H. Li, L. Chen, K. Xu and Y. Hu, Adv. Mater., 2020, 32(2), 1904427 CrossRef CAS PubMed.
- L. Jiang, Y. Lu, C. Zhao, L. Liu, J. Zhang, Q. Zhang, X. Shen, J. Zhao, X. Yu, H. Li, X. Huang, L. Chen and Y.-S. Hu, Nat. Energy, 2019, 4, 495–503 CrossRef CAS.
- X. Wu, Y. Cao, X. Ai, J. Qian and H. Yang, Electrochem. Commun., 2013, 31, 145–148 CrossRef CAS.
- C. Deng, S. Zhang, Z. Dong and Y. Shang, Nano Energy, 2014, 4, 49–55 CrossRef CAS.
- Y. Liu, B. H. Zhang, S. Y. Xiao, L. L. Liu, Z. B. Wen and Y. P. Wu, Electrochim. Acta, 2014, 116, 512–517 CrossRef CAS.
- Y. Liu, Y. Qiao, W. Zhang, H. Xu, Z. Li, Y. Shen, L. Yuan, X. Hu, X. Dai and Y. Huang, Nano Energy, 2014, 5, 97–104 CrossRef CAS.
- M. Pasta, C. D. Wessells, N. Liu, J. Nelson, M. T. McDowell, R. A. Huggins, M. F. Toney and Y. Cui, Nat. Commun., 2014, 5, 3007 CrossRef PubMed.
- D. J. Kim, Y. H. Jung, K. K. Bharathi, S. H. Je, D. K. Kim, A. Coskun and J. W. Choi, Adv. Energy Mater., 2014, 4(12), 1400133 CrossRef.
- Y. Liu, Y. Qiao, W. Zhang, H. Wang, K. Chen, H. Zhu, Z. Li and Y. Huang, J. Mater. Chem. A, 2015, 3, 7780–7785 RSC.
- Y. Wang, L. Mu, J. Liu, Z. Yang, X. Yu, L. Gu, Y. Hu, H. Li, X. Yang, L. Chen and X. Huang, Adv. Energy Mater., 2015, 5(22), 1501005 CrossRef.
- A. J. Fernández-Ropero, D. Saurel, B. Acebedo, T. Rojo and M. Casas-Cabanas, J. Power Sources, 2015, 291, 40–45 CrossRef.
- X. Wu, M. Sun, S. Guo, J. Qian, Y. Liu, Y. Cao, X. Ai and H. Yang, ChemNanoMat, 2015, 1, 188–193 CrossRef CAS.
- Y. Liu, Y. Qiao, X. Lou, X. Zhang, W. Zhang and Y. Huang, ACS Appl. Mater. Interfaces, 2016, 8, 14564–14571 CrossRef CAS PubMed.
- Q. Zhang, C. Liao, T. Zhai and H. Li, Electrochim. Acta, 2016, 196, 470–478 CrossRef CAS.
- H. Gao and J. B. Goodenough, Angew. Chem., Int. Ed., 2016, 55, 12768–12772 CrossRef CAS PubMed.
- L. Suo, O. Borodin, Y. Wang, X. Rong, W. Sun, X. Fan, S. Xu, M. A. Schroeder, A. V. Cresce, F. Wang, C. Yang, Y. Hu, K. Xu and C. Wang, Adv. Energy Mater., 2017, 7(21), 1701189 CrossRef.
- K. Nakamoto, R. Sakamoto, M. Ito, A. Kitajou and S. Okada, Electrochemistry, 2017, 85, 179–185 CrossRef CAS.
- J. Zhang, D. Zhang, F. Niu, X. Li, C. Wang and J. Yang, ChemPlusChem, 2017, 82, 1170–1173 CrossRef CAS PubMed.
- Y. Wang, Z. Feng, D. Laul, W. Zhu, M. Provencher, M. L. Trudeau, A. Guerfi and K. Zaghib, J. Power Sources, 2018, 374, 211–216 CrossRef CAS.
- H. Wang, T. Zhang, C. Chen, M. Ling, Z. Lin, S. Zhang, F. Pan and C. Liang, Nano Res., 2018, 11, 490–498 CrossRef CAS.
- X. Cao, L. Wang, J. Chen and J. Zheng, J. Mater. Chem. A, 2018, 6, 15762–15770 RSC.
- J. Han, H. Zhang, A. Varzi and S. Passerini, ChemSusChem, 2018, 11, 3704–3707 CrossRef CAS PubMed.
- H. Zhang, S. Jeong, B. Qin, D. Vieira Carvalho, D. Buchholz and S. Passerini, ChemSusChem, 2018, 11, 1382–1389 CrossRef CAS PubMed.
- L. Fu, X. Xue, Y. Tang, D. Sun, H. Xie and H. Wang, Electrochim. Acta, 2018, 289, 21–28 CrossRef CAS.
- K. Nakamoto, R. Sakamoto, Y. Sawada, M. Ito and S. Okada, Small Methods, 2019, 3(4), 1800220 CrossRef CAS.
- X. Shan, F. Guo, D. S. Charles, Z. Lebens-Higgins, S. Abdel Razek, J. Wu, W. Xu, W. Yang, K. L. Page, J. C. Neuefeind, M. Feygenson, L. F. J. Piper and X. Teng, Nat. Commun., 2019, 10, 4975 CrossRef PubMed.
- Z. Liu, G. Pang, S. Dong, Y. Zhang, C. Mi and X. Zhang, Electrochim. Acta, 2019, 311, 1–7 CrossRef CAS.
- Y. Qiu, Y. Yu, J. Xu, Y. Liu, M. Ou, S. Sun, P. Wei, Z. Deng, Y. Xu, C. Fang, Q. Li, J. Han and Y. Huang, J. Mater. Chem. A, 2019, 7, 24953–24963 RSC.
- S. Liu, L. Wang, J. Liu, M. Zhou, Q. Nian, Y. Feng, Z. Tao and L. Shao, J. Mater. Chem. A, 2019, 7, 248–256 RSC.
- S. Sevinc, B. Tekin, A. Ata, M. Morcrette, H. Perrot, O. Sel and R. Demir-Cakan, J. Power Sources, 2019, 412, 55–62 CrossRef CAS.
- L. Sharma, K. Nakamoto, R. Sakamoto, S. Okada and P. Barpanda, ChemElectroChem, 2019, 6, 444–449 CrossRef CAS.
- Q. Nian, S. Liu, J. Liu, Q. Zhang, J. Shi, C. Liu, R. Wang, Z. Tao and J. Chen, ACS Appl. Energy Mater., 2019, 2, 4370–4378 CrossRef CAS.
- S. Qiu, X. Wu, M. Wang, M. Lucero, Y. Wang, J. Wang, Z. Yang, W. Xu, Q. Wang, M. Gu, J. Wen, Y. Huang, Z. J. Xu and Z. Feng, Nano Energy, 2019, 64, 103941 CrossRef CAS.
- B. Wang, X. Wang, C. Liang, M. Yan and Y. Jiang, ChemElectroChem, 2019, 6, 4848–4853 CrossRef CAS.
- Z. Hou, X. Zhang, H. Ao, M. Liu, Y. Zhu and Y. Qian, Mater. Today Energy, 2019, 14, 100337 CrossRef.
- T. Jin, X. Ji, P. Wang, K. Zhu, J. Zhang, L. Cao, L. Chen, C. Cui, T. Deng, S. Liu, N. Piao, Y. Liu, C. Shen, K. Xie, L. Jiao and C. Wang, Angew. Chem., Int. Ed., 2021, 60, 11943–11948 CrossRef CAS PubMed.
- K. Nakamoto, R. Sakamoto, Y. Nishimura, J. Xia, M. Ito and S. Okada, Electrochemistry, 2021, 89, 21–00056 CrossRef.
- D. Reber, R. Grissa, M. Becker, R. Kühnel and C. Battaglia, Adv. Energy Mater., 2021, 11(5), 2002913 CrossRef CAS.
- W. Yang, X. Wang, S. Lu, Y. Gao, T. Gao, T. Guo, Q. Xie and Y. Ruan, ChemSusChem, 2023, 16(8), e202202257 CrossRef CAS PubMed.
- D. S. Charles, M. Feygenson, K. Page, J. Neuefeind, W. Xu and X. Teng, Nat. Commun., 2017, 8, 15520 CrossRef CAS PubMed.
- M. Xia, X. Zhang, T. Liu, H. Yu, S. Chen, N. Peng, R. Zheng, J. Zhang and J. Shu, Chem. Eng. J., 2020, 394, 124923 CrossRef CAS.
- M. Wang, H. Wang, H. Zhang and X. Li, J. Energy Chem., 2020, 48, 14–20 CrossRef.
- Y. Li, W. Deng, Z. Zhou, C. Li, M. Zhang, X. Yuan, J. Hu, H. Chen and R. Li, J. Mater. Chem. A, 2021, 9, 2822–2829 RSC.
- J. Ge, X. Yi, L. Fan and B. Lu, J. Energy Chem., 2021, 57, 28–33 CrossRef CAS.
- H. Chen, Z. Zhang, Z. Wei, G. Chen, X. Yang, C. Wang and F. Du, Sustainable Energy Fuels, 2020, 4, 128–131 RSC.
- G. Liang, Z. Gan, X. Wang, X. Jin, B. Xiong, X. Zhang, S. Chen, Y. Wang, H. He and C. Zhi, ACS Nano, 2021, 15, 17717–17728 CrossRef CAS PubMed.
- T. Hosaka, R. Takahashi, K. Kubota, R. Tatara, Y. Matsuda, K. Ida, K. Kuba and S. Komaba, J. Power Sources, 2022, 548, 232096 CrossRef CAS.
- J. Ge, L. Fan, A. M. Rao, J. Zhou and B. Lu, Nat. Sustainability, 2021, 5, 225–234 CrossRef.
- D. Reber, R. Figi, R.-S. Kühnel and C. Battaglia, Electrochim. Acta, 2019, 321, 134644 CrossRef CAS.
- S. Ko, Y. Yamada and A. Yamada, Electrochem. Commun., 2020, 116, 106764 CrossRef CAS.
- R.-S. Kühnel, D. Reber and C. Battaglia, J. Electrochem. Soc., 2020, 167, 070544 CrossRef.
- S. Kondou, E. Nozaki, S. Terada, M. L. Thomas, K. Ueno, Y. Umebayashi, K. Dokko and M. Watanabe, J. Phys. Chem. C, 2018, 122, 20167–20175 CrossRef CAS PubMed.
- R.-S. Kühnel, D. Reber, A. Remhof, R. Figi, D. Bleiner and C. Battaglia, Chem. Commun., 2016, 52, 10435–10438 RSC.
- Y. Yokoyama, T. Fukutsuka, K. Miyazaki and T. Abe, J. Electrochem. Soc., 2018, 165, A3299–A3303 CrossRef CAS.
- M. Becker, D. Rentsch, D. Reber, A. Aribia, C. Battaglia and R. Kühnel, Angew. Chem., Int. Ed., 2021, 60, 14100–14108 CrossRef CAS PubMed.
- P. Jaumaux, X. Yang, B. Zhang, J. Safaei, X. Tang, D. Zhou, C. Wang and G. Wang, Angew. Chem., Int. Ed., 2021, 60, 19965–19973 CrossRef CAS PubMed.
- J. Zheng, G. Tan, P. Shan, T. Liu, J. Hu, Y. Feng, L. Yang, M. Zhang, Z. Chen, Y. Lin, J. Lu, J. C. Neuefeind, Y. Ren, K. Amine, L.-W. Wang, K. Xu and F. Pan, Chem, 2018, 4, 2872–2882 CAS.
- S. Kondou, E. Nozaki, S. Terada, M. L. Thomas, K. Ueno, Y. Umebayashi, K. Dokko and M. Watanabe, J. Phys. Chem. C, 2018, 122, 20167–20175 CrossRef CAS PubMed.
- M. R. Lukatskaya, J. I. Feldblyum, D. G. Mackanic, F. Lissel, D. L. Michels, Y. Cui and Z. Bao, Energy Environ. Sci., 2018, 11, 2876–2883 RSC.
- D. Reber, R.-S. Kühnel and C. Battaglia, Sustainable Energy Fuels, 2017, 1, 2155–2161 RSC.
- M. H. Lee, S. J. Kim, D. Chang, J. Kim, S. Moon, K. Oh, K.-Y. Park, W. M. Seong, H. Park, G. Kwon, B. Lee and K. Kang, Mater. Today, 2019, 29, 26–36 CrossRef CAS.
- X. Bu, L. Su, Q. Dou, S. Lei and X. Yan, J. Mater. Chem. A, 2019, 7, 7541–7547 RSC.
- R. Sakamoto, M. Yamashita, K. Nakamoto, Y. Zhou, N. Yoshimoto, K. Fujii, T. Yamaguchi, A. Kitajou and S. Okada, Phys. Chem. Chem. Phys., 2020, 22, 26452–26458 RSC.
- R.-S. Kühnel, D. Reber and C. Battaglia, ACS Energy Lett., 2017, 2, 2005–2006 CrossRef.
- A. Kitada, S. Ko, R. Ikeya, Y. Yamada and A. Yamada, J. Phys. Chem. C, 2023, 127, 3432–3436 CrossRef CAS.
- P. L. Stigliano, N. Pianta, S. Bonizzoni, M. Mauri, R. Simonutti, R. Lorenzi, B. Vigani, V. Berbenni, S. Rossi, P. Mustarelli and R. Ruffo, Phys. Chem. Chem. Phys., 2021, 23, 1139–1145 RSC.
- J. Han, A. Mariani, H. Zhang, M. Zarrabeitia, X. Gao, D. V. Carvalho, A. Varzi and S. Passerini, Energy Storage Mater., 2020, 30, 196–205 CrossRef.
- D. P. Leonard, Z. Wei, G. Chen, F. Du and X. Ji, ACS Energy Lett., 2018, 3, 373–374 CrossRef CAS.
- T. Liu, L. Tang, H. Luo, S. Cheng and M. Liu, Chem. Commun., 2019, 55, 12817–12820 RSC.
- W. Deng, X. Wang, C. Liu, C. Li, J. Chen, N. Zhu, R. Li and M. Xue, Energy Storage Mater., 2019, 20, 373–379 CrossRef.
- L. Coustan, G. Shul and D. Bélanger, Electrochem. Commun., 2017, 77, 89–92 CrossRef CAS.
- D. Degoulange, N. Dubouis and A. Grimaud, J. Chem. Phys., 2021, 155, 064701 CrossRef CAS PubMed.
- N. Dubouis, A. Serva, R. Berthin, G. Jeanmairet, B. Porcheron, E. Salager, M. Salanne and A. Grimaud, Nat. Catal., 2020, 3, 656–663 CrossRef CAS.
- A. von Wald Cresce and K. Xu, Carbon Energy, 2021, 3, 721–751 CrossRef CAS.
- D. Çirmi, R. Aydın and F. Köleli, J. Electroanal. Chem., 2015, 736, 101–106 CrossRef.
- F. Habashi, S. A. Mikhail and K. V. Van, Can. J. Chem., 1976, 54, 3646–3650 CrossRef CAS.
- L. Suo, D. Oh, Y. Lin, Z. Zhuo, O. Borodin, T. Gao, F. Wang, A. Kushima, Z. Wang, H. C. Kim, Y. Qi, W. Yang, F. Pan, J. Li, K. Xu and C. Wang, J. Am. Chem. Soc., 2017, 139, 18670–18680 CrossRef CAS PubMed.
- K. Miyazaki, N. Takenaka, E. Watanabe, Y. Yamada, Y. Tateyama and A. Yamada, ACS Appl. Mater. Interfaces, 2020, 12, 42734–42738 CrossRef CAS PubMed.
- K. Miyazaki, N. Takenaka, E. Watanabe, S. Iizuka, Y. Yamada, Y. Tateyama and A. Yamada, J. Phys. Chem. Lett., 2019, 10, 6301–6305 CrossRef CAS PubMed.
- Y. Yamada, J. Wang, S. Ko, E. Watanabe and A. Yamada, Nat. Energy, 2019, 4, 269–280 CrossRef CAS.
- K. Sodeyama, Y. Yamada, K. Aikawa, A. Yamada and Y. Tateyama, J. Phys. Chem. C, 2014, 118, 14091–14097 CrossRef CAS.
- Y. Yamada, K. Furukawa, K. Sodeyama, K. Kikuchi, M. Yaegashi, Y. Tateyama and A. Yamada, J. Am. Chem. Soc., 2014, 136, 5039–5046 CrossRef CAS PubMed.
- C. Xu, B. Sun, T. Gustafsson, K. Edström, D. Brandell and M. Hahlin, J. Mater. Chem. A, 2014, 2, 7256–7264 RSC.
- D. Aurbach, I. Weissman, A. Schechter and H. Cohen, Langmuir, 1996, 12, 3991–4007 CrossRef CAS.
- B. S. Parimalam and B. L. Lucht, J. Electrochem. Soc., 2018, 165, A251–A255 CrossRef CAS.
- D. L. Wood, J. Li and C. Daniel, J. Power Sources, 2015, 275, 234–242 CrossRef CAS.
- D. H. Jeon, Energy Storage Mater., 2019, 18, 139–147 CrossRef.
- L. Zhao, Y. Li, M. Yu, Y. Peng and F. Ran, Adv. Sci., 2023, 10(17), 2300283 CrossRef CAS PubMed.
- Z. Li, R. Bouchal, T. Mendez-Morales, A.-L. Rollet, C. Rizzi, S. Le Vot, F. Favier, B. Rotenberg, O. Borodin, O. Fontaine and M. Salanne, J. Phys. Chem. B, 2019, 123, 10514–10521 CrossRef CAS PubMed.
- Z. Yu, L. A. Curtiss, R. E. Winans, Y. Zhang, T. Li and L. Cheng, J. Phys. Chem. Lett., 2020, 11, 1276–1281 CrossRef CAS PubMed.
- J. Kim, B. Koo, J. Lim, J. Jeon, C. Lim, H. Lee, K. Kwak and M. Cho, ACS Energy Lett., 2022, 7, 189–196 CrossRef CAS.
- J. Lim, K. Park, H. Lee, J. Kim, K. Kwak and M. Cho, J. Am. Chem. Soc., 2018, 140, 15661–15667 CrossRef CAS PubMed.
- O. Borodin, L. Suo, M. Gobet, X. Ren, F. Wang, A. Faraone, J. Peng, M. Olguin, M. Schroeder, M. S. Ding, E. Gobrogge, A. von Wald Cresce, S. Munoz, J. A. Dura, S. Greenbaum, C. Wang and K. Xu, ACS Nano, 2017, 11, 10462–10471 CrossRef CAS PubMed.
- K. Goloviznina, A. Serva and M. Salanne, J. Am. Chem. Soc., 2024, 146, 8142–8148 CrossRef CAS PubMed.
- M. McEldrew, Z. A. H. Goodwin, S. Bi, A. A. Kornyshev and M. Z. Bazant, J. Electrochem. Soc., 2021, 168, 050514 CrossRef CAS.
- T. R. Kartha, D. N. Reddy and B. S. Mallik, Mater. Adv., 2021, 2, 7691–7700 RSC.
- M. A. González, H. Akiba, O. Borodin, G. J. Cuello, L. Hennet, S. Kohara, E. J. Maginn, L. Mangin-Thro, O. Yamamuro, Y. Zhang, D. L. Price and M.-L. Saboungi, Phys. Chem. Chem. Phys., 2022, 24, 10727–10736 RSC.
- T. Shimada, N. Takenaka, E. Watanabe, Y. Yamada, Y.-T. Cui, Y. Harada, M. Okubo and A. Yamada, J. Phys. Chem. B, 2021, 125, 11534–11539 CrossRef CAS PubMed.
- X. Liu, S.-C. Lee, S. Seifert, L. He, C. Do, R. E. Winans, G. Kwon and T. Li, Chem. Mater., 2023, 35, 2088–2094 CrossRef CAS.
- Y. Zhang and E. J. Maginn, J. Phys. Chem. B, 2021, 125, 13246–13254 CrossRef CAS PubMed.
- L. Ma and J. Jiang, J. Phys. Chem. Lett., 2024, 15, 4531–4537 CrossRef CAS PubMed.
- N. H. C. Lewis, B. Dereka, Y. Zhang, E. J. Maginn and A. Tokmakoff, J. Phys. Chem. B, 2022, 126, 5305–5319 CrossRef CAS PubMed.
- A. Einstein, Ann. Phys., 1905, 322, 549–560 CrossRef.
- W. Sutherland, London, Edinburgh Dublin Philos. Mag. J. Sci., 1905, 9, 781–785 CrossRef CAS.
- G. G. Stokes, On the Effect of the Internal Friction of Fluids on the Motion of Pendulums, Mathematical and Physical Papers, Cambridge University Press, England Cambridge, 2009, pp. 1–10 Search PubMed.
- J. Han, A. Mariani, S. Passerini and A. Varzi, Energy Environ. Sci., 2023, 16, 1480–1501 RSC.
- L. Jiang, D. Dong and Y.-C. Lu, Nano Res. Energy, 2022, 1, e9120003 CrossRef.
- D. Turnbull and J. C. Fisher, J. Chem. Phys., 1949, 17, 71–73 CrossRef CAS.
- W. H. Wang, C. Dong and C. H. Shek, Mater. Sci. Eng., R, 2004, 44, 45–89 CrossRef.
- O. Schumacher, C. J. Marvel, M. N. Kelly, P. R. Cantwell, R. P. Vinci, J. M. Rickman, G. S. Rohrer and M. P. Harmer, Curr. Opin. Solid State Mater. Sci., 2016, 20, 316–323 CrossRef CAS.
- D. Li, D. Zeng, X. Yin, H. Han, L. Guo and Y. Yao, Calphad, 2016, 53, 78–89 CrossRef CAS.
- S. Arrhenius, Z. Phys. Chem., 1889, 4, 96–116 CrossRef.
- S. Arrhenius, Z. Phys. Chem., 1889, 4, 226–248 CrossRef.
- K. Tasaki, K. Kanda, S. Nakamura and M. Ue, J. Electrochem. Soc., 2003, 150, A1628 CrossRef CAS.
- M. E. Jacox, K. K. Irikura and W. E. Thompson, J. Chem. Phys., 2000, 113, 5705–5715 CrossRef CAS.
- S. Di Muzio, O. Palumbo, S. Brutti and A. Paolone, J. Electrochem. Soc., 2022, 169, 070523 CrossRef.
- C. G. Barlowz, Electrochem. Solid-State Lett., 1999, 2, 362 CrossRef.
- K. Xu, Chem. Rev., 2004, 104, 4303–4418 CrossRef CAS PubMed.
- L. Terborg, S. Nowak, S. Passerini, M. Winter, U. Karst, P. R. Haddad and P. N. Nesterenko, Anal. Chim. Acta, 2012, 714, 121–126 CrossRef CAS PubMed.
- L. J. Krause, W. Lamanna, J. Summerfield, M. Engle, G. Korba, R. Loch and R. Atanasoski, J. Power Sources, 1997, 68, 320–325 CrossRef CAS.
- X. Wang, E. Yasukawa and S. Mori, J. Electrochem. Soc., 1999, 146, 3992–3998 CrossRef CAS.
- B. Liu, T. Lv, A. Zhou, X. Zhu, Z. Lin, T. Lin and L. Suo, Nat. Commun., 2024, 15, 2922 CrossRef CAS PubMed.
- C. Behling, J. Lüchtefeld, S. J. Wachs, K. J. J. Mayrhofer and B. B. Berkes, Electrochim. Acta, 2024, 473, 143480 CrossRef CAS.
- M. Aziz-Kerrzo, K. G. Conroy, A. M. Fenelon, S. T. Farrell and C. B. Breslin, Biomaterials, 2001, 22, 1531–1539 CrossRef CAS PubMed.
- Y. Ohko, S. Saitoh, T. Tatsuma and A. Fujishima, J. Electrochem. Soc., 2001, 148, B24 CrossRef CAS.
- A. S. Malik and L. A. Fredin, J. Phys. Chem. C, 2023, 127, 3444–3451 CrossRef CAS.
- J. Li, J. Fleetwood, W. B. Hawley and W. Kays, Chem. Rev., 2022, 122, 903–956 CrossRef CAS PubMed.
- R. Choudhury, J. Wild and Y. Yang, Joule, 2021, 5, 1301–1305 CrossRef.
- H. Jeong, J. Jang and C. Jo, Chem. Eng. J., 2022, 446, 136860 CrossRef CAS.
- X. Ji, eScience, 2021, 1, 99–107 CrossRef.
- J. Warner, Handbook of Lithium-Ion Battery Pack Design: Chemistry, Components, Types and Terminology, Elsevier, 2015 Search PubMed.
- L. H. Saw, Y. Ye and A. A. O. Tay, J. Clean Prod., 2016, 113, 1032–1045 CrossRef CAS.
- K. Wang, L. Wang, K. Zheng, Z. He, D. J. Politis, G. Liu and S. Yuan, Int. J. Extreme Manuf., 2020, 2, 032001 CrossRef CAS.
- MSE supplies, https://www.msesupplies.com, 2024.12.29.
- MTI corporation, https://www.mtixtl.com, 2024.12.29.
- Sigma-Aldrich, https://www.sigmaaldrich.com, 2024.12.29.
- F. C. Walsh, Trans. IMF, 1991, 69, 107–110 CrossRef CAS.
- E. Lizundia, C. M. Costa, R. Alves and S. Lanceros-Méndez, Carbohydr. Polym. Technol. Appl., 2020, 1, 100001 Search PubMed.
- S. Li, W. Zhu, Q. Tang, Z. Huang, P. Yu, X. Gui, S. Lin, J. Hu and Y. Tu, Energy Fuels, 2021, 35, 12938–12947 CrossRef CAS.
- H. Kim, J. Hong, K.-Y. Park, H. Kim, S.-W. Kim and K. Kang, Chem. Rev., 2014, 114, 11788–11827 CrossRef CAS PubMed.
- X. Zhang, T. Xiong, B. He, S. Feng, X. Wang, L. Wei and L. Mai, Energy Environ. Sci., 2022, 15, 3750–3774 RSC.
- R. Benedek, M. M. Thackeray and A. van de Walle, Chem. Mater., 2008, 20, 5485–5490 CrossRef CAS.
- N. Makivić, J.-Y. Cho, K. D. Harris, J.-M. Tarascon, B. Limoges and V. Balland, Chem. Mater., 2021, 33, 3436–3448 CrossRef.
- T. Ohzuku, M. Kitagawa and T. Hirai, J. Electrochem. Soc., 1990, 137, 769–775 CrossRef CAS.
- M. M. Thackeray, P. J. Johnson, L. A. de Picciotto, P. G. Bruce and J. B. Goodenough, Mater. Res. Bull., 1984, 19, 179–187 CrossRef CAS.
- N. Nakayama, T. Nozawa, Y. Iriyama, T. Abe, Z. Ogumi and K. Kikuchi, J. Power Sources, 2007, 174, 695–700 CrossRef CAS.
- L. Tian and A. Yuan, J. Power Sources, 2009, 192, 693–697 CrossRef CAS.
- T. Zhang, D. Li, Z. Tao and J. Chen, Prog. Nat. Sci., 2013, 23, 256–272 CrossRef.
- K. Amine, H. Tukamoto, H. Yasuda and Y. Fujita, J. Power Sources, 1997, 68, 604–608 CrossRef CAS.
- R. Ruffo, C. Wessells, R. A. Huggins and Y. Cui, Electrochem. Commun., 2009, 11, 247–249 CrossRef CAS.
- K. Mizushima, P. C. Jones, P. J. Wiseman and J. B. Goodenough, Mater. Res. Bull., 1980, 15, 783–789 CrossRef CAS.
- C. Delmas, C. Fouassier and P. Hagenmuller, Eur. Phys. J. B, 1980, 99, 81–85 CAS.
- A. Ramanujapuram, D. Gordon, A. Magasinski, B. Ward, N. Nitta, C. Huang and G. Yushin, Energy Environ. Sci., 2016, 9, 1841–1848 RSC.
- C. Lee, Y. Yokoyama, Y. Kondo, Y. Miyahara, T. Abe and K. Miyazaki, ACS Appl. Mater. Interfaces, 2020, 12, 56076–56085 CrossRef CAS PubMed.
- H. Umeno, K. Kawai, D. Asakura, M. Okubo and A. Yamada, Adv. Sci., 2022, 9(12), 2104907 CrossRef CAS PubMed.
- C. Lee, Y. Yokoyama, Y. Kondo, Y. Miyahara, K. Miyazaki and T. Abe, Chem. Lett., 2021, 50, 1071–1074 CrossRef CAS.
- C. Lee, Y. Yokoyama, Y. Kondo, Y. Miyahara, K. Miyazaki and T. Abe, J. Power Sources, 2020, 477, 229036 CrossRef CAS.
- C. Lee, Y. Yokoyama, Y. Kondo, Y. Miyahara, T. Abe and K. Miyazaki, Adv. Energy Mater., 2021, 11(25), 2100756 CrossRef CAS.
- C. Lee, Y. Yokoyama, Y. Kondo, Y. Miyahara, T. Abe and K. Miyazaki, ACS Appl. Mater. Interfaces, 2021, 13, 44284–44293 CrossRef CAS PubMed.
- C. Lee, J.-M. Choi, Y. Miyahara, I. Jeon, K. Miyazaki and T. Abe, Chem. Mater., 2024, 36, 860–869 CrossRef CAS.
- A. K. Padhi, K. S. Nanjundaswamy and J. B. Goodenough, J. Electrochem. Soc., 1997, 144, 1188–1194 CrossRef CAS.
- A. K. Padhi, K. S. Nanjundaswamy, C. Masquelier, S. Okada and J. B. Goodenough, J. Electrochem. Soc., 1997, 144, 1609–1613 CrossRef CAS.
- A. Yamada, S. C. Chung and K. Hinokuma, J. Electrochem. Soc., 2001, 148, A224 CrossRef CAS.
- A. Yamada, H. Koizumi, N. Sonoyama and R. Kanno, Electrochem. Solid-State Lett., 2005, 8, A409 CrossRef CAS.
- P. He, X. Zhang, Y.-G. Wang, L. Cheng and Y.-Y. Xia, J. Electrochem. Soc., 2008, 155, A144 CrossRef CAS.
- P. He, J.-L. Liu, W.-J. Cui, J.-Y. Luo and Y.-Y. Xia, Electrochim. Acta, 2011, 56, 2351–2357 CrossRef CAS.
- R. Malik, D. Burch, M. Bazant and G. Ceder, Nano Lett., 2010, 10, 4123–4127 CrossRef CAS PubMed.
- M. Minakshi, P. Singh, S. Thurgate and K. Prince, Electrochem. Solid-State Lett., 2006, 9, A471 CrossRef CAS.
- M. D. Johannes, K. Hoang, J. L. Allen and K. Gaskell, Phys. Rev. B: Condens. Matter Mater. Phys., 2012, 85, 115106 CrossRef.
- J. R. Dahn, T. V. Buuren and U. Vonsacken, US Pat., 4965150, 1990 Search PubMed.
- A. Kannan, Solid State Ionics, 2003, 159, 265–271 CrossRef CAS.
- H. Li, P. He, Y. Wang, E. Hosono and H. Zhou, J. Mater. Chem., 2011, 21, 10999 RSC.
- M. Zhang and J. R. Dahn, J. Electrochem. Soc., 1996, 143, 2730–2735 CrossRef CAS.
- S. Lee, I. N. Ivanov, J. K. Keum and H. N. Lee, Sci. Rep., 2016, 6, 19621 CrossRef CAS PubMed.
- T. Partheeban and M. Sasidharan, J. Mater. Sci., 2020, 55, 2155–2165 CrossRef CAS.
- M. Zhao, B. Zhang, G. Huang, H. Zhang and X. Song, J. Power Sources, 2013, 232, 181–186 CrossRef CAS.
- J. M. Tarascon, F. J. Disalvo, D. W. Murphy, G. W. Hull, E. A. Rietman and J. V. Waszczak, J. Solid State Chem., 1984, 54, 204–212 CrossRef CAS.
- P. J. Mulhern and R. R. Haering, Can. J. Phys., 1984, 62, 527–531 CrossRef CAS.
- E. Levi, G. Gershinsky, D. Aurbach and O. Isnard, Inorg. Chem., 2009, 48, 8751–8758 CrossRef CAS PubMed.
- G. X. Wang, D. H. Bradhurst, S. X. Dou and H. K. Liu, J. Power Sources, 2003, 124, 231–236 CrossRef CAS.
- B. Zhang, R. Tan, L. Yang, J. Zheng, K. Zhang, S. Mo, Z. Lin and F. Pan, Energy Storage Mater., 2018, 10, 139–159 CrossRef.
- R. Li, C. Lin, N. Wang, L. Luo, Y. Chen, J. Li and Z. Guo, Adv. Compos. Hybrid Mater., 2018, 1, 440–459 CrossRef CAS.
- T. Ohzuku, A. Ueda and N. Yamamoto, J. Electrochem. Soc., 1995, 142, 1431–1435 CrossRef CAS.
- T. Ohzuku and T. Ohzuku, 7th International Meeting on Lithium Batteries, Boston, 1994 Search PubMed.
- E. Ferg, R. J. Gummow, A. de Kock and M. M. Thackeray, J. Electrochem. Soc., 1994, 141, L147–L150 CrossRef CAS.
- A. Deschanvres, B. Raveau and Z. Sekkal, Mater. Res. Bull., 1971, 6, 699–704 CrossRef CAS.
- K. M. Colbow, J. R. Dahn and R. R. Haering, J. Power Sources, 1989, 26, 397–402 CrossRef CAS.
- H. Yan, D. Zhang Qilu, X. Duo and X. Sheng, Ceram. Int., 2021, 47, 5870–5895 CrossRef CAS.
- J. Gao, B. Gong, Q. Zhang, G. Wang, Y. Dai and W. Fan, Ionics, 2015, 21, 2409–2416 CrossRef CAS.
- H. Liu, Z. Zhu, J. Huang, X. He, Y. Chen, R. Zhang, R. Lin, Y. Li, S. Yu, X. Xing, Q. Yan, X. Li, M. J. Frost, K. An, J. Feng, R. Kostecki, H. Xin, S. P. Ong and P. Liu, ACS Mater. Lett., 2019, 1, 96–102 CrossRef CAS.
- F. Sauvage, E. Baudrin and J.-M. Tarascon, Sens. Actuators, B, 2007, 120, 638–644 CrossRef CAS.
- J. F. Whitacre, T. Wiley, S. Shanbhag, Y. Wenzhuo, A. Mohamed, S. E. Chun, E. Weber, D. Blackwood, E. Lynch-Bell, J. Gulakowski, C. Smith and D. Humphreys, J. Power Sources, 2012, 213, 255–264 CrossRef CAS.
- W. Song, X. Ji, Y. Zhu, H. Zhu, F. Li, J. Chen, F. Lu, Y. Yao and C. E. Banks, ChemElectroChem, 2014, 1, 871–876 CrossRef CAS.
- L. H. B. Nguyen, T. Broux, P. S. Camacho, D. Denux, L. Bourgeois, S. Belin, A. Iadecola, F. Fauth, D. Carlier, J. Olchowka, C. Masquelier and L. Croguennec, Energy Storage Mater., 2019, 20, 324–334 CrossRef.
- W. Ji, H. Huang, X. Zhang, D. Zheng, T. Ding, T. H. Lambert and D. Qu, Nano Energy, 2020, 72, 104705 CrossRef CAS PubMed.
- Y. Ishado, A. Inoishi and S. Okada, Electrochemistry, 2020, 88, 457–462 CrossRef CAS.
- Y. Qi, Z. Tong, J. Zhao, L. Ma, T. Wu, H. Liu, C. Yang, J. Lu and Y.-S. Hu, Joule, 2018, 2, 2348–2363 CrossRef CAS.
- S. I. Park, I. Gocheva, S. Okada and J. Yamaki, J. Electrochem. Soc., 2011, 158, A1067 CrossRef CAS.
- M. Wu, W. Ni, J. Hu and J. Ma, Nano-Micro Lett., 2019, 11, 44 CrossRef CAS PubMed.
- Q. T. Qu, L. L. Liu, Y. P. Wu and R. Holze, Electrochim. Acta, 2013, 96, 8–12 CrossRef CAS.
- A. A. Karyakin, Electroanalysis, 2001, 13, 813–819 CrossRef CAS.
- P. Poizot, J. Gaubicher, S. Renault, L. Dubois, Y. Liang and Y. Yao, Chem. Rev., 2020, 120, 6490–6557 CrossRef CAS PubMed.
- S. Xu, Y. Chen and C. Wang, J. Mater. Chem. A, 2020, 8, 15547–15574 RSC.
- K. Hurlbutt, S. Wheeler, I. Capone and M. Pasta, Joule, 2018, 2, 1950–1960 CrossRef CAS.
- V. D. Neff, J. Electrochem. Soc., 1978, 125, 886–887 CrossRef CAS.
- C. Ma, C. Lin, N. Li, Y. Chen, Y. Yang, L. Tan, Z. Wang, Q. Zhang and Y. Zhu, Small, 2024, 20(23), 2310184 CrossRef CAS PubMed.
- M. A. Lumley, D.-H. Nam and K.-S. Choi, ACS Appl. Mater. Interfaces, 2020, 12, 36014–36025 CrossRef CAS PubMed.
- W. Deng, Y. Shen, J. Qian, Y. Cao and H. Yang, ACS Appl. Mater. Interfaces, 2015, 7, 21095–21099 CrossRef CAS PubMed.
- X. Wu, Y. Qi, J. J. Hong, Z. Li, A. S. Hernandez and X. Ji, Angew. Chem., Int. Ed., 2017, 56, 13026–13030 CrossRef CAS PubMed.
- J. Han, Y. Niu, S. Bao, Y.-N. Yu, S.-Y. Lu and M. Xu, PhysChemComm, 2016, 52, 11661–11664 CAS.
- N. Voronina, J. H. Jo, A. Konarov, J. Kim and S. Myung, Small, 2020, 16(20), 2001090 CrossRef CAS PubMed.
- S. Komaba, T. Hasegawa, M. Dahbi and K. Kubota, Electrochem. Commun., 2015, 60, 172–175 CrossRef CAS.
- L. Droguet, G. M. Hobold, M. F. Lagadec, R. Guo, C. Lethien, M. Hallot, O. Fontaine, J.-M. Tarascon, B. M. Gallant and A. Grimaud, ACS Energy Lett., 2021, 6, 2575–2583 CrossRef CAS.
- S. J. Visco, V. Nimon, A. Petrov, K. Pridatko, N. Goncharenko, E. Nimon, L. De Jonghe, M. Hendrickson and E. Plichta, Lithium Air Batteries Based on Protected Lithium Electrodes, Springer New York, New York, 2014, pp. 179–200 Search PubMed.
- S. Visco, U.S. DOE Advanced Manufacturing Office Peer Review Meeting, Manufacturing of Protected Lithium Electrodes for Advanced Lithium-Air, Lithium-Water & Lithium-Sulfur Batteries, May, 2015.
- X. Wang, Y. Hou, Y. Zhu, Y. Wu and R. Holze, Sci. Rep., 2013, 3, 1401 CrossRef PubMed.
- C. Yang, J. Chen, T. Qing, X. Fan, W. Sun, A. von Cresce, M. S. Ding, O. Borodin, J. Vatamanu, M. A. Schroeder, N. Eidson, C. Wang and K. Xu, Joule, 2017, 1, 122–132 CrossRef CAS.
- H. Moon, R. Tatara, T. Mandai, K. Ueno, K. Yoshida, N. Tachikawa, T. Yasuda, K. Dokko and M. Watanabe, J. Phys. Chem. C, 2014, 118, 20246–20256 CrossRef CAS.
- P. K. R. Kottam, D. Kalkan, M. Wohlfahrt-Mehrens and M. Marinaro, J. Electrochem. Soc., 2019, 166, A1574–A1579 CrossRef CAS.
- S. Ko, T. Obukata, T. Shimada, N. Takenaka, M. Nakayama, A. Yamada and Y. Yamada, Nat. Energy, 2022, 7, 1217–1224 CrossRef CAS.
- E. Hückel, Ergebnisse der Exakten Naturwissenschaften, Springer Berlin Heidelberg, Berlin, Heidelberg, 1924, pp. 199–276 Search PubMed.
- S. Ko, N. Takenaka, A. Kitada and A. Yamada, Next Energy, 2023, 1, 100014 CrossRef.
- N. Takenaka, S. Ko, A. Kitada and A. Yamada, Nat. Commun., 2024, 15, 1319 CrossRef CAS PubMed.
- E. A. Guggenheim and J. C. Turgeon, Trans. Faraday Soc., 1955, 51, 747 RSC.
- K. S. Pitzer, J. Phys. Chem., 1973, 77, 268–277 CrossRef CAS.
- D. Reber, R. Grissa, M. Becker, R. Kühnel and C. Battaglia, Adv. Energy Mater., 2021, 11(5), 2002913 CrossRef CAS.
- W. A. Henderson, F. McKenna, M. A. Khan, N. R. Brooks, V. G. Young and R. Frech, Chem. Mater., 2005, 17, 2284–2289 CrossRef CAS.
- M. McEldrew, Z. A. H. Goodwin, A. A. Kornyshev and M. Z. Bazant, J. Phys. Chem. Lett., 2018, 9, 5840–5846 CrossRef CAS PubMed.
- J. Vatamanu and O. Borodin, J. Phys. Chem. Lett., 2017, 8, 4362–4367 CrossRef CAS PubMed.
- M. Amereller, M. Multerer, C. Schreiner, J. Lodermeyer, A. Schmid, J. Barthel and H. J. Gores, J. Chem. Eng. Data, 2009, 54, 468–471 CrossRef CAS.
- R. Von Burg, J. Appl. Toxicol., 1995, 15, 237–241 CrossRef CAS PubMed.
- D. G. Churchill, J. Chem. Educ., 2006, 83, 1798 CrossRef CAS.
- M. R. Lukatskaya, J. I. Feldblyum, D. G. Mackanic, F. Lissel, D. L. Michels, Y. Cui and Z. Bao, Energy Environ. Sci., 2018, 11, 2876–2883 RSC.
- T. Fujie, N. Takenaka and M. Nagaoka, J. Comput. Chem., 2019, 18, 29–37 CrossRef CAS.
- D. Aurbach, A. Zaban, A. Schechter, Y. Ein-Eli, E. Zinigrad and B. Markovsky, J. Electrochem. Soc., 1995, 142, 2873–2882 CrossRef CAS.
- I. A. Shkrob, Y. Zhu, T. W. Marin and D. Abraham, J. Phys. Chem. C, 2013, 117, 19270–19279 CrossRef CAS.
- Y. Yamada and A. Yamada, J. Electrochem. Soc., 2015, 162, A2406–A2423 CrossRef CAS.
- D. Aurbach, J. Electrochem. Soc., 1995, 142, 2873–2882 CrossRef CAS.
- D. Aurbach, Y. Ein-Ely and A. Zaban, J. Electrochem. Soc., 1994, 141, L1–L3 CrossRef CAS.
- E. Markevich, G. Salitra and D. Aurbach, ACS Energy Lett., 2017, 2, 1337–1345 CrossRef CAS.
- E. Peled and S. Menkin, J. Electrochem. Soc., 2017, 164, A1703–A1719 CrossRef CAS.
- C. Zhang, Z. Cai, R. Huang and H. Pan, Batteries Supercaps, 2023, 6(6), e202300053 CrossRef CAS.
- I. Stojković, N. Cvjetićanin, I. Pašti, M. Mitrić and S. Mentus, Electrochem. Commun., 2009, 11, 1512–1514 CrossRef.
- F. Wang, O. Borodin, M. S. Ding, M. Gobet, J. Vatamanu, X. Fan, T. Gao, N. Eidson, Y. Liang, W. Sun, S. Greenbaum, K. Xu and C. Wang, Joule, 2018, 2, 927–937 CrossRef CAS.
- F. Wang, Y. Lin, L. Suo, X. Fan, T. Gao, C. Yang, F. Han, Y. Qi, K. Xu and C. Wang, Energy Environ. Sci., 2016, 9, 3666–3673 RSC.
- C. Yang, L. Suo, O. Borodin, F. Wang, W. Sun, T. Gao, X. Fan, S. Hou, Z. Ma, K. Amine, K. Xu and C. Wang, Proc. Natl. Acad. Sci. U. S. A., 2017, 114, 6197–6202 CrossRef CAS PubMed.
- P. Jiang, L. Chen, H. Shao, S. Huang, Q. Wang, Y. Su, X. Yan, X. Liang, J. Zhang, J. Feng and Z. Liu, ACS Energy Lett., 2019, 4, 1419–1426 CrossRef CAS.
- J. Xie, Z. Liang and Y.-C. Lu, Nat. Mater., 2020, 19, 1006–1011 CrossRef CAS PubMed.
- L. Chen, J. Zhang, Q. Li, J. Vatamanu, X. Ji, T. P. Pollard, C. Cui, S. Hou, J. Chen, C. Yang, L. Ma, M. S. Ding, M. Garaga, S. Greenbaum, H.-S. Lee, O. Borodin, K. Xu and C. Wang, ACS Energy Lett., 2020, 5, 968–974 CrossRef CAS.
- Y. Shang, N. Chen, Y. Li, S. Chen, J. Lai, Y. Huang, W. Qu, F. Wu and R. Chen, Adv. Mater., 2020, 32(40), 2004017 CrossRef CAS PubMed.
- J. M. Wrogemann, S. Künne, A. Heckmann, I. A. Rodríguez-Pérez, V. Siozios, B. Yan, J. Li, M. Winter, K. Beltrop and T. Placke, Adv. Energy Mater., 2020, 10(8), 1902709 CrossRef CAS.
- J. Chen, J. Vatamanu, L. Xing, O. Borodin, H. Chen, X. Guan, X. Liu, K. Xu and W. Li, Adv. Energy Mater., 2020, 10(3), 1902654 CrossRef CAS.
- Z. Hou, M. Dong, Y. Xiong, X. Zhang, Y. Zhu and Y. Qian, Adv. Energy Mater., 2020, 10(15), 1903665 CrossRef CAS.
- Y. Wang, T. Wang, D. Dong, J. Xie, Y. Guan, Y. Huang, J. Fan and Y.-C. Lu, Matter, 2022, 5, 162–179 CrossRef CAS.
- S. Chen, P. Sun, B. Sun, J. Humphreys, P. Zou, K. Xie and S. Tao, Energy Storage Mater., 2021, 37, 598–608 CrossRef.
- Q. Nian, W. Zhu, S. Zheng, S. Chen, B.-Q. Xiong, Z. Wang, X. Wu, Z. Tao and X. Ren, ACS Appl. Mater. Interfaces, 2021, 13, 51048–51056 CrossRef CAS PubMed.
- D. Dong, J. Xie, Z. Liang and Y.-C. Lu, ACS Energy Lett., 2022, 7, 123–130 CrossRef CAS.
- X. Hou, T. P. Pollard, W. Zhao, X. He, X. Ju, J. Wang, L. Du, E. Paillard, H. Lin, K. Xu, O. Borodin, M. Winter and J. Li, Small, 2022, 18(5), 2104986 CrossRef CAS PubMed.
- Z. Ma, J. Chen, J. Vatamanu, O. Borodin, D. Bedrov, X. Zhou, W. Zhang, W. Li, K. Xu and L. Xing, Energy Storage Mater., 2022, 45, 903–910 CrossRef.
- X. Zhang, J. Chen, Z. Xu, Q. Dong, H. Ao, Z. Hou and Y. Qian, Energy Storage Mater., 2022, 46, 147–154 CrossRef.
- J. Xu, X. Ji, J. Zhang, C. Yang, P. Wang, S. Liu, K. Ludwig, F. Chen, P. Kofinas and C. Wang, Nat. Energy, 2022, 7, 186–193 CrossRef CAS.
- R. Lin, C. Ke, J. Chen, S. Liu and J. Wang, Joule, 2022, 6, 399–417 CrossRef CAS.
- C. Zhang, B. Chen, Z. Cai, F. Zhang, R. Huang, M. Yan, Y. Liu and H. Pan, J. Mater. Chem. A, 2022, 10, 20545–20551 RSC.
- P. R. Kumar, Y. H. Jung, J. E. Wang and D. K. Kim, J. Power Sources, 2016, 324, 421–427 CrossRef CAS.
- P. Ramesh Kumar, A. Kheireddine, U. Nisar, R. A. Shakoor, R. Essehli, R. Amin and I. Belharouak, J. Power Sources, 2019, 429, 149–155 CrossRef CAS.
- H. Ao, C. Chen, Z. Hou, W. Cai, M. Liu, Y. Jin, X. Zhang, Y. Zhu and Y. Qian, J. Mater. Chem. A, 2020, 8, 14190–14197 RSC.
- Q. Nian, X. Zhang, Y. Feng, S. Liu, T. Sun, S. Zheng, X. Ren, Z. Tao, D. Zhang and J. Chen, ACS Energy Lett., 2021, 6, 2174–2180 CrossRef CAS.
- Z. Liang, F. Tian, G. Yang and C. Wang, Nat. Commun., 2023, 14, 3591 CrossRef CAS PubMed.
- Y. Li, Z. Zhou, W. Deng, C. Li, X. Yuan, J. Hu, M. Zhang, H. Chen and R. Li, ChemElectroChem, 2021, 8, 1451–1454 CrossRef CAS.
- X. Yuan, Y. Li, Y. Zhu, W. Deng, C. Li, Z. Zhou, J. Hu, M. Zhang, H. Chen and R. Li, ACS Appl. Mater. Interfaces, 2021, 13, 38248–38255 CrossRef CAS PubMed.
- J. Chen, S. Lei, S. Zhang, C. Zhu, Q. Liu, C. Wang, Z. Zhang, S. Wang, Y. Shi, L. Yin and R. Wang, Adv. Funct. Mater., 2023, 33(19), 2215027 CrossRef CAS.
- M. Xia, H. Fu, K. Lin, A. M. Rao, L. Cha, H. Liu, J. Zhou, C. Wang and B. Lu, Energy Environ. Sci., 2024, 17, 1255–1265 RSC.
- L. Miao, R. Wang, W. Xin, L. Zhang, Y. Geng, H. Peng, Z. Yan, D. Jiang, Z. Qian and Z. Zhu, Energy Storage Mater., 2022, 49, 445–453 CrossRef.
- D. Yang, M. Watanabe and T. Ishihara, Small Methods, 2023, 7(9), 2300249 CrossRef CAS PubMed.
- G. Ma, L. Miao, Y. Dong, W. Yuan, X. Nie, S. Di, Y. Wang, L. Wang and N. Zhang, Energy Storage Mater., 2022, 47, 203–210 CrossRef.
- S. Hosseini, A. Abbasi, L.-O. Uginet, N. Haustraete, S. Praserthdam, T. Yonezawa and S. Kheawhom, Sci. Rep., 2019, 9, 14958 CrossRef PubMed.
- L. Cao, D. Li, E. Hu, J. Xu, T. Deng, L. Ma, Y. Wang, X.-Q. Yang and C. Wang, J. Am. Chem. Soc., 2020, 142, 21404–21409 CrossRef CAS PubMed.
- Y. Zhang, H. Huang, X. Ning, C. Li, Z. Fan and L. Pan, Energy Storage Mater., 2023, 56, 542–550 CrossRef.
- Y. Liu, C. Yu, X. Song, S. Hou, S. Lan, J. Yu, Y. Xie and J. Qiu, J. Energy Chem., 2024, 93, 361–367 CrossRef CAS.
- R. Feng, X. Chi, Q. Qiu, J. Wu, J. Huang, J. Liu and Y. Liu, ACS Appl. Mater. Interfaces, 2021, 13, 40638–40647 CrossRef CAS PubMed.
- F. Ming, Y. Zhu, G. Huang, A.-H. Emwas, H. Liang, Y. Cui and H. N. Alshareef, J. Am. Chem. Soc., 2022, 144, 7160–7170 CrossRef CAS PubMed.
- J. Liu, C. Yang, X. Chi, B. Wen, W. Wang and Y. Liu, Adv. Funct. Mater., 2022, 32(1), 2106811 CrossRef CAS.
- A. Naveed, H. Yang, J. Yang, Y. Nuli and J. Wang, Angew. Chem., Int. Ed., 2019, 58, 2760–2764 CrossRef CAS PubMed.
- S. Wu, B. Su, M. Sun, S. Gu, Z. Lu, K. Zhang, D. Y. W. Yu, B. Huang, P. Wang, C. Lee and W. Zhang, Adv. Mater., 2021, 33(41), 2102390 CrossRef CAS PubMed.
- B. Qiu, L. Xie, G. Zhang, K. Cheng, Z. Lin, W. Liu, C. He, P. Zhang and H. Mi, Chem. Eng. J., 2022, 449, 137843 CrossRef CAS.
- Y. Wang, Z. Wang, W. K. Pang, W. Lie, J. A. Yuwono, G. Liang, S. Liu, A. M. D. Angelo, J. Deng, Y. Fan, K. Davey, B. Li and Z. Guo, Nat. Commun., 2023, 14, 2720 CrossRef CAS PubMed.
- G. Ni, M. Sun, Z. Hao, G. Zou, F. Cao, L. Qin, W. Chen and C. Zhou, Mater Today Energy, 2023, 31, 101204 CrossRef CAS.
- W. Wang, S. Chen, X. Liao, R. Huang, F. Wang, J. Chen, Y. Wang, F. Wang and H. Wang, Nat. Commun., 2023, 14, 5443 CrossRef CAS PubMed.
- S. Chen, P. Sun, J. Humphreys, P. Zou, M. Zhang, G. Jeerh, B. Sun and S. Tao, ACS Appl. Mater. Interfaces, 2021, 13, 46634–46643 CrossRef CAS PubMed.
- W. Deng, Z. Xu and X. Wang, Energy Storage Mater., 2022, 52, 52–60 CrossRef.
- F. Wu, Y. Chen, Y. Chen, R. Yin, Y. Feng, D. Zheng, X. Xu, W. Shi, W. Liu and X. Cao, Small, 2022, 18(27), 2202363 CrossRef CAS PubMed.
- Q. Jian, T. Wang, J. Sun, B. Liu and T. Zhao, Chem. Eng. J., 2023, 466, 143189 CrossRef CAS.
- M.-K. Huang, K. S. Anuratha, Y. Xiao, Y.-P. Chen and J.-Y. Lin, Electrochim. Acta, 2022, 424, 140612 CrossRef CAS.
- X. Feng, P. Li, J. Yin, Z. Gan, Y. Gao, M. Li, Y. Cheng, X. Xu, Y. Su and S. Ding, ACS Energy Lett., 2023, 8, 1192–1200 CrossRef CAS.
- Y. Deng, Y. Wu, K. Zhang, M. Fan, L. Wang, Y. He and L. Yan, J. Mater. Chem. A, 2023, 11, 8368–8379 RSC.
- C. Lu, Z. Wang, Y. Zhang, G. Tang, Y. Wang, X. Guo, J. Li and L. Wei, Nano Energy, 2024, 120, 109158 CrossRef CAS.
- W. Xiong, T. K. A. Hoang, D. Yang, Y. Liu, M. Ahmed, J. Xu, X. Qiu and P. Chen, J. Energy Storage, 2019, 26, 100920 CrossRef.
- J. Kong, H. Guo, Y. Li, M. Gong, X. Lin, L. Zhang and D. Wang, Sustainable Energy Fuels, 2024, 8, 826–836 RSC.
- H. Yan, X. Zhang, Z. Yang, M. Xia, C. Xu, Y. Liu, H. Yu, L. Zhang and J. Shu, Coord. Chem. Rev., 2022, 452, 214297 CrossRef CAS.
- J. Yue, J. Zhang, Y. Tong, M. Chen, L. Liu, L. Jiang, T. Lv, Y. Hu, H. Li, X. Huang, L. Gu, G. Feng, K. Xu, L. Suo and L. Chen, Nat. Chem., 2021, 13, 1061–1069 CrossRef CAS PubMed.
- S.-D. Han, O. Borodin, D. M. Seo, Z.-B. Zhou and W. A. Henderson, J. Electrochem. Soc., 2014, 161, A2042–A2053 CrossRef CAS.
- S.-D. Han, R. D. Sommer, P. D. Boyle, Z.-B. Zhou, V. G. Young, O. Borodin and W. A. Henderson, J. Electrochem. Soc., 2022, 169, 110544 CrossRef CAS.
- D. M. Seo, O. Borodin, S.-D. Han, P. D. Boyle and W. A. Henderson, J. Electrochem. Soc., 2012, 159, A1489–A1500 CrossRef CAS.
- G. R. Pastel, Y. Chen, T. P. Pollard, M. A. Schroeder, M. E. Bowden, A. Zheng, N. T. Hahn, L. Ma, V. Murugesan, J. Ho, M. Garaga, O. Borodin, K. Mueller, S. Greenbaum and K. Xu, Energy Environ. Sci., 2022, 15, 2460–2469 RSC.
- W. A. Henderson, M. L. Helm, D. M. Seo, P. C. Trulove, H. C. De Long and O. Borodin, J. Electrochem. Soc., 2022, 169, 060515 CrossRef CAS.
- G. A. Vidulich and R. L. Kay, J. Phys. Chem., 1962, 66, 383 CrossRef CAS.
- V. Staemmler, Angew. Chem., Int. Ed. Engl., 1979, 91, 595 CrossRef.
- M. Rabinovitz, Solute-Solute and Solute-Solvent Interactions: NMR Studies, Jerusalem Symposia on Quantum Chemistry and Biochemistry, Springer, Dordrecht, 1976, pp. 229–238 Search PubMed.
- W. Liu, L. Dong, B. Jiang, Y. Huang, X. Wang, C. Xu, Z. Kang, J. Mou and F. Kang, Electrochim. Acta, 2019, 320, 134565 CrossRef CAS.
- X. Ji and L. F. Nazar, Nat. Sustainability, 2024, 7, 98–99 CrossRef.
- M. J. Park, H. Yaghoobnejad Asl and A. Manthiram, ACS Energy Lett., 2020, 5, 2367–2375 CrossRef CAS.
- J. Yang, R. Zhao, Y. Wang, Z. Hu, Y. Wang, A. Zhang, C. Wu and Y. Bai, Adv. Funct. Mater., 2023, 33(14), 2213510 CrossRef CAS.
- R. D. Shannon, Acta Crystallogr., Sect. A, 1976, 32, 751–767 CrossRef.
- J. Muldoon, C. B. Bucur and T. Gregory, Chem. Rev., 2014, 114, 11683–11720 CrossRef CAS PubMed.
- Z. Rong, R. Malik, P. Canepa, G. Sai Gautam, M. Liu, A. Jain, K. Persson and G. Ceder, Chem. Mater., 2015, 27, 6016–6021 CrossRef CAS.
- P. Canepa, G. Sai Gautam, D. C. Hannah, R. Malik, M. Liu, K. G. Gallagher, K. A. Persson and G. Ceder, Chem. Rev., 2017, 117, 4287–4341 CrossRef CAS PubMed.
- M. Liu, Z. Rong, R. Malik, P. Canepa, A. Jain, G. Ceder and K. A. Persson, Energy Environ. Sci., 2015, 8, 964–974 RSC.
- D. Kundu, B. D. Adams, V. Duffort, S. H. Vajargah and L. F. Nazar, Nat. Energy, 2016, 1, 16119 CrossRef CAS.
- W. Sun, F. Wang, S. Hou, C. Yang, X. Fan, Z. Ma, T. Gao, F. Han, R. Hu, M. Zhu and C. Wang, J. Am. Chem. Soc., 2017, 139, 9775–9778 CrossRef CAS PubMed.
- D. Kundu, S. Hosseini Vajargah, L. Wan, B. Adams, D. Prendergast and L. F. Nazar, Energy Environ. Sci., 2018, 11, 881–892 RSC.
- L. E. Blanc, D. Kundu and L. F. Nazar, Joule, 2020, 4, 771–799 CrossRef CAS.
- H. Yaghoobnejad Asl, S. Sharma and A. Manthiram, J. Mater. Chem. A, 2020, 8, 8262–8267 RSC.
- M. Yan, P. He, Y. Chen, S. Wang, Q. Wei, K. Zhao, X. Xu, Q. An, Y. Shuang, Y. Shao, K. T. Mueller, L. Mai, J. Liu and J. Yang, Adv. Mater., 2018, 30(1), 1703725 CrossRef PubMed.
- J. Hao, X. Li, S. Zhang, F. Yang, X. Zeng, S. Zhang, G. Bo, C. Wang and Z. Guo, Adv. Funct. Mater., 2020, 30(30), 2001263 CrossRef CAS.
- C. Xu, B. Li, H. Du and F. Kang, Angew. Chem., Int. Ed., 2012, 51, 933–935 CrossRef CAS PubMed.
- J. Lee, J. B. Ju, W. Il Cho, B. W. Cho and S. H. Oh, Electrochim. Acta, 2013, 112, 138–143 CrossRef CAS.
- B. Lee, C. S. Yoon, H. R. Lee, K. Y. Chung, B. W. Cho and S. H. Oh, Sci. Rep., 2014, 4, 6066 CrossRef CAS PubMed.
- B. Zhang, Y. Liu, X. Wu, Y. Yang, Z. Chang, Z. Wen and Y. Wu, Chem. Commun., 2014, 50, 1209–1211 RSC.
- J. Hao, J. Mou, J. Zhang, L. Dong, W. Liu, C. Xu and F. Kang, Electrochim. Acta, 2018, 259, 170–178 CrossRef CAS.
- M. H. Alfaruqi, V. Mathew, J. Gim, S. Kim, J. Song, J. P. Baboo, S. H. Choi and J. Kim, Chem. Mater., 2015, 27, 3609–3620 CrossRef CAS.
- H. Pan, Y. Shao, P. Yan, Y. Cheng, K. S. Han, Z. Nie, C. Wang, J. Yang, X. Li, P. Bhattacharya, K. T. Mueller and J. Liu, Nat. Energy, 2016, 1, 16039 CrossRef CAS.
- N. Zhang, F. Cheng, Y. Liu, Q. Zhao, K. Lei, C. Chen, X. Liu and J. Chen, J. Am. Chem. Soc., 2016, 138, 12894–12901 CrossRef CAS PubMed.
- B. Jiang, C. Xu, C. Wu, L. Dong, J. Li and F. Kang, Electrochim. Acta, 2017, 229, 422–428 CrossRef CAS.
- Y. Zeng, X. Zhang, Y. Meng, M. Yu, J. Yi, Y. Wu, X. Lu and Y. Tong, Adv. Mater., 2017, 29(26), 1700274 CrossRef PubMed.
- W. Sun, F. Wang, S. Hou, C. Yang, X. Fan, Z. Ma, T. Gao, F. Han, R. Hu, M. Zhu and C. Wang, J. Am. Chem. Soc., 2017, 139, 9775–9778 CrossRef CAS PubMed.
- N. Zhang, F. Cheng, J. Liu, L. Wang, X. Long, X. Liu, F. Li and J. Chen, Nat. Commun., 2017, 8, 405 CrossRef PubMed.
- H. Li, Z. Liu, G. Liang, Y. Huang, Y. Huang, M. Zhu, Z. Pei, Q. Xue, Z. Tang, Y. Wang, B. Li and C. Zhi, ACS Nano, 2018, 12, 3140–3148 CrossRef CAS PubMed.
- B. Wu, G. Zhang, M. Yan, T. Xiong, P. He, L. He, X. Xu and L. Mai, Small, 2018, 14(13), 1703850 CrossRef PubMed.
- V. Soundharrajan, B. Sambandam, S. Kim, V. Mathew, J. Jo, S. Kim, J. Lee, S. Islam, K. Kim, Y.-K. Sun and J. Kim, ACS Energy Lett., 2018, 3, 1998–2004 CrossRef CAS.
- C. Zhu, G. Fang, J. Zhou, J. Guo, Z. Wang, C. Wang, J. Li, Y. Tang and S. Liang, J. Mater. Chem. A, 2018, 6, 9677–9683 RSC.
- M. H. Alfaruqi, V. Mathew, J. Song, S. Kim, S. Islam, D. T. Pham, J. Jo, S. Kim, J. P. Baboo, Z. Xiu, K.-S. Lee, Y.-K. Sun and J. Kim, Chem. Mater., 2017, 29, 1684–1694 CrossRef CAS.
- P. Hu, M. Yan, T. Zhu, X. Wang, X. Wei, J. Li, L. Zhou, Z. Li, L. Chen and L. Mai, ACS Appl. Mater. Interfaces, 2017, 9, 42717–42722 CrossRef CAS PubMed.
- N. Zhang, Y. Dong, M. Jia, X. Bian, Y. Wang, M. Qiu, J. Xu, Y. Liu, L. Jiao and F. Cheng, ACS Energy Lett., 2018, 3, 1366–1372 CrossRef CAS.
- J. Zhou, L. Shan, Z. Wu, X. Guo, G. Fang and S. Liang, Chem. Commun., 2018, 54, 4457–4460 RSC.
- T. Wei, Q. Li, G. Yang and C. Wang, Electrochim. Acta, 2018, 287, 60–67 CrossRef CAS.
- Y. Yang, Y. Tang, G. Fang, L. Shan, J. Guo, W. Zhang, C. Wang, L. Wang, J. Zhou and S. Liang, Energy Environ. Sci., 2018, 11, 3157–3162 RSC.
- P. He, G. Zhang, X. Liao, M. Yan, X. Xu, Q. An, J. Liu and L. Mai, Adv. Energy Mater., 2018, 8(10), 1702463 CrossRef.
- V. Soundharrajan, B. Sambandam, S. Kim, M. H. Alfaruqi, D. Y. Putro, J. Jo, S. Kim, V. Mathew, Y.-K. Sun and J. Kim, Nano Lett., 2018, 18, 2402–2410 CrossRef CAS PubMed.
- F. Ming, H. Liang, Y. Lei, S. Kandambeth, M. Eddaoudi and H. N. Alshareef, ACS Energy Lett., 2018, 3, 2602–2609 CrossRef CAS.
- G. Yang, T. Wei and C. Wang, ACS Appl. Mater. Interfaces, 2018, 10, 35079–35089 CrossRef CAS PubMed.
- T. Wei, Q. Li, G. Yang and C. Wang, J. Mater. Chem. A, 2018, 6, 20402–20410 RSC.
- L. Chen, Y. Ruan, G. Zhang, Q. Wei, Y. Jiang, T. Xiong, P. He, W. Yang, M. Yan, Q. An and L. Mai, Chem. Mater., 2019, 31, 699–706 CrossRef CAS.
- Z. Li, S. Ganapathy, Y. Xu, Z. Zhou, M. Sarilar and M. Wagemaker, Adv. Energy Mater., 2019, 9(22), 1900237 CrossRef.
- L. Chen, Z. Yang and Y. Huang, Nanoscale, 2019, 11, 13032–13039 RSC.
- Y. Ding, Y. Peng, S. Chen, X. Zhang, Z. Li, L. Zhu, L.-E. Mo and L. Hu, ACS Appl. Mater. Interfaces, 2019, 11, 44109–44117 CrossRef CAS PubMed.
- Y. Li, Z. Huang, P. K. Kalambate, Y. Zhong, Z. Huang, M. Xie, Y. Shen and Y. Huang, Nano Energy, 2019, 60, 752–759 CrossRef CAS.
- X. Chen, L. Wang, H. Li, F. Cheng and J. Chen, J. Energy Chem., 2019, 38, 20–25 CrossRef.
- J. Lai, H. Zhu, X. Zhu, H. Koritala and Y. Wang, ACS Appl. Energy Mater., 2019, 2, 1988–1996 CrossRef CAS.
- Q. Li, T. Wei, K. Ma, G. Yang and C. Wang, ACS Appl. Mater. Interfaces, 2019, 11, 20888–20894 CrossRef PubMed.
- Z. Cao, H. Chu, H. Zhang, Y. Ge, R. Clemente, P. Dong, L. Wang, J. Shen, M. Ye and P. M. Ajayan, J. Mater. Chem. A, 2019, 7, 25262–25267 RSC.
- X. Li, L. Ma, Y. Zhao, Q. Yang, D. Wang, Z. Huang, G. Liang, F. Mo, Z. Liu and C. Zhi, Mater Today Energy, 2019, 14, 100361 CrossRef.
- N. Zhang, M. Jia, Y. Dong, Y. Wang, J. Xu, Y. Liu, L. Jiao and F. Cheng, Adv. Funct. Mater., 2019, 29(10), 1807331 CrossRef.
- T. Wei, Q. Li, G. Yang and C. Wang, Adv. Energy Mater., 2019, 9(34), 1901480 CrossRef.
- J. Shin, D. S. Choi, H. J. Lee, Y. Jung and J. W. Choi, Adv. Energy Mater., 2019, 9(14), 1900083 CrossRef.
- L. Shan, J. Zhou, W. Zhang, C. Xia, S. Guo, X. Ma, G. Fang, X. Wu and S. Liang, Energy Technol., 2019, 7(6), 1900022 CrossRef.
- F. Hu, D. Xie, D. Zhao, G. Song and K. Zhu, J. Energy Chem., 2019, 38, 185–191 CrossRef.
- K. Zhu, T. Wu and K. Huang, ACS Nano, 2019, 13, 14447–14458 CrossRef CAS PubMed.
- L. Shan, Y. Yang, W. Zhang, H. Chen, G. Fang, J. Zhou and S. Liang, Energy Storage Mater., 2019, 18, 10–14 CrossRef.
- L. Ma, N. Li, C. Long, B. Dong, D. Fang, Z. Liu, Y. Zhao, X. Li, J. Fan, S. Chen, S. Zhang and C. Zhi, Adv. Funct. Mater., 2019, 29(46), 1906142 CrossRef CAS.
- S. Islam, M. H. Alfaruqi, D. Y. Putro, V. Soundharrajan, B. Sambandam, J. Jo, S. Park, S. Lee, V. Mathew and J. Kim, J. Mater. Chem. A, 2019, 7, 20335–20347 RSC.
- Y. Liu, Q. Li, K. Ma, G. Yang and C. Wang, ACS Nano, 2019, 13, 12081–12089 CrossRef CAS PubMed.
- X. Wang, B. Xi, Z. Feng, W. Chen, H. Li, Y. Jia, J. Feng, Y. Qian and S. Xiong, J. Mater. Chem. A, 2019, 7, 19130–19139 RSC.
- S. Chen, Y. Zhang, H. Geng, Y. Yang, X. Rui and C. C. Li, J. Power Sources, 2019, 441, 227192 CrossRef CAS.
- K. Zhu, T. Wu and K. Huang, Adv. Energy Mater., 2019, 9(38), 1901968 CrossRef CAS.
- Y. Liu, P. Hu, H. Liu, X. Wu and C. Zhi, Mater Today Energy, 2020, 17, 100431 CrossRef.
- F. Cui, J. Zhao, D. Zhang, Y. Fang, F. Hu and K. Zhu, Chem. Eng. J., 2020, 390, 124118 CrossRef CAS.
- H. Luo, B. Wang, F. Wang, J. Yang, F. Wu, Y. Ning, Y. Zhou, D. Wang, H. Liu and S. Dou, ACS Nano, 2020, 14, 7328–7337 CrossRef CAS PubMed.
- P. He, J. Liu, X. Zhao, Z. Ding, P. Gao and L.-Z. Fan, J. Mater. Chem. A, 2020, 8, 10370–10376 RSC.
- M. Liao, J. Wang, L. Ye, H. Sun, Y. Wen, C. Wang, X. Sun, B. Wang and H. Peng, Angew. Chem., Int. Ed., 2020, 59, 2273–2278 CrossRef CAS PubMed.
- W. Zhang, C. Tang, B. Lan, L. Chen, W. Tang, C. Zuo, S. Dong, Q. An and P. Luo, J. Alloys Compd., 2020, 819, 152971 CrossRef CAS.
- W. Tang, B. Lan, C. Tang, Q. An, L. Chen, W. Zhang, C. Zuo, S. Dong and P. Luo, ACS Sustainable Chem. Eng., 2020, 8, 3681–3688 CrossRef CAS.
- D. Bin, W. Huo, Y. Yuan, J. Huang, Y. Liu, Y. Zhang, F. Dong, Y. Wang and Y. Xia, Chem, 2020, 6, 968–984 CAS.
- H. Jiang, Y. Zhang, L. Xu, Z. Gao, J. Zheng, Q. Wang, C. Meng and J. Wang, Chem. Eng. J., 2020, 382, 122844 CrossRef CAS.
- J. Li, K. McColl, X. Lu, S. Sathasivam, H. Dong, L. Kang, Z. Li, S. Zhao, A. G. Kafizas, R. Wang, D. J. L. Brett, P. R. Shearing, F. Corà, G. He, C. J. Carmalt and I. P. Parkin, Adv. Energy Mater., 2020, 10(15), 2000058 CrossRef CAS.
- Y.-Y. Liu, T.-T. Lv, H. Wang, X.-T. Guo, C.-S. Liu and H. Pang, Chem. Eng. J., 2021, 417, 128408 CrossRef CAS.
- Z. Zhang, B. Xi, X. Wang, X. Ma, W. Chen, J. Feng and S. Xiong, Adv. Funct. Mater., 2021, 31(34), 2103070 CrossRef CAS.
- H. Zhang, Z. Yao, D. Lan, Y. Liu, L. Ma and J. Cui, J. Alloys Compd., 2021, 861, 158560 CrossRef CAS.
- Z. Qi, T. Xiong, T. Chen, W. Shi, M. Zhang, Z. W. J. Ang, H. Fan, H. Xiao, W. S. V. Lee and J. Xue, J. Alloys Compd., 2021, 870, 159403 CrossRef CAS.
- J. Cao, D. Zhang, Y. Yue, T. Pakornchote, T. Bovornratanaraks, M. Sawangphruk, X. Zhang and J. Qin, Mater. Today Energy, 2021, 21, 100824 CrossRef CAS.
- C. Liu, R. Li, W. Liu, G. Shen and D. Chen, ACS Appl. Mater. Interfaces, 2021, 13, 37194–37200 CrossRef CAS PubMed.
- S. Wu, S. Liu, L. Hu and S. Chen, J. Alloys Compd., 2021, 878, 160324 CrossRef CAS.
- Y. Shao, J. Zeng, J. Li, H. Ren, Z. Zhang, J. Liu, C. Mao, X. Guo and G. Li, ChemElectroChem, 2021, 8, 1784–1791 CrossRef CAS.
- D. Chen, M. Lu, B. Wang, H. Cheng, H. Yang, D. Cai, W. Han and H. J. Fan, Nano Energy, 2021, 83, 105835 CrossRef CAS.
- M. Liao, J. Wang, L. Ye, H. Sun, P. Li, C. Wang, C. Tang, X. Cheng, B. Wang and H. Peng, J. Mater. Chem. A, 2021, 9, 6811–6818 RSC.
- W. Shi, B. Yin, Y. Yang, M. B. Sullivan, J. Wang, Y.-W. Zhang, Z. G. Yu, W. S. V. Lee and J. Xue, ACS Nano, 2021, 15, 1273–1281 CrossRef CAS PubMed.
- L. Shan, Y. Wang, S. Liang, B. Tang, Y. Yang, Z. Wang, B. Lu and J. Zhou, InfoMat, 2021, 3, 1028–1036 CrossRef CAS.
- L. Yu, J. Huang, S. Wang, L. Qi, S. Wang and C. Chen, Adv. Mater., 2023, 35(21), 2210789 CrossRef CAS PubMed.
- Y. Wang, B. Liang, J. Zhu, G. Li, Q. Li, R. Ye, J. Fan and C. Zhi, Angew. Chem., Int. Ed., 2023, 62(23), e202302583 CrossRef CAS PubMed.
- G. Li, Z. Yang, Y. Jiang, C. Jin, W. Huang, X. Ding and Y. Huang, Nano Energy, 2016, 25, 211–217 CrossRef CAS.
- G. Li, Z. Yang, Y. Jiang, W. Zhang and Y. Huang, J. Power Sources, 2016, 308, 52–57 CrossRef CAS.
- H. B. Zhao, C. J. Hu, H. W. Cheng, J. H. Fang, Y. P. Xie, W. Y. Fang, T. N. L. Doan, T. K. A. Hoang, J. Q. Xu and P. Chen, Sci. Rep., 2016, 6, 25809 CrossRef CAS PubMed.
- J. Zhao, Y. Li, X. Peng, S. Dong, J. Ma, G. Cui and L. Chen, Electrochem. Commun., 2016, 69, 6–10 CrossRef CAS.
- W. Li, K. Wang, S. Cheng and K. Jiang, Energy Storage Mater., 2018, 15, 14–21 CrossRef.
- F. Wan, Y. Zhang, L. Zhang, D. Liu, C. Wang, L. Song, Z. Niu and J. Chen, Angew. Chem., Int. Ed., 2019, 58, 7062–7067 CrossRef CAS PubMed.
- H. Shi, Y. Song, Z. Qin, C. Li, D. Guo, X. Liu and X. Sun, Angew. Chem., Int. Ed., 2019, 58, 16057–16061 CrossRef CAS PubMed.
- V. Verma, S. Kumar, W. Manalastas, J. Zhao, R. Chua, S. Meng, P. Kidkhunthod and M. Srinivasan, ACS Appl. Energy Mater., 2019, 2, 8667–8674 CrossRef CAS.
- P. Hu, T. Zhu, X. Wang, X. Zhou, X. Wei, X. Yao, W. Luo, C. Shi, K. A. Owusu, L. Zhou and L. Mai, Nano Energy, 2019, 58, 492–498 CrossRef CAS.
- Z. Wu, Y. Wang, L. Zhang, L. Jiang, W. Tian, C. Cai, J. Price, Q. Gu and L. Hu, ACS Appl. Energy Mater., 2020, 3, 3919–3927 CrossRef CAS.
- J. S. Ko, P. P. Paul, G. Wan, N. Seitzman, R. H. DeBlock, B. S. Dunn, M. F. Toney and J. Nelson Weker, Chem. Mater., 2020, 32, 3028–3035 CrossRef CAS.
- Q. Ni, H. Jiang, S. Sandstrom, Y. Bai, H. Ren, X. Wu, Q. Guo, D. Yu, C. Wu and X. Ji, Adv. Funct. Mater., 2020, 30(36), 2003511 CrossRef CAS.
- Z. Wu, C. Lu, F. Ye, L. Zhang, L. Jiang, Q. Liu, H. Dong, Z. Sun and L. Hu, Adv. Funct. Mater., 2021, 31(45), 2106816 CrossRef.
- L. Hu, Z. Wu, C. Lu, F. Ye, Q. Liu and Z. Sun, Energy Environ. Sci., 2021, 14, 4095–4106 RSC.
- C. Li, W. Wu, H.-Y. Shi, Z. Qin, D. Yang, X. Yang, Y. Song, D. Guo, X.-X. Liu and X. Sun, Chem. Commun., 2021, 57, 6253–6256 RSC.
- C. Li, W. Yuan, C. Li, H. Wang, L. Wang, Y. Liu and N. Zhang, Chem. Commun., 2021, 57, 4319–4322 RSC.
- C. Li, R. Kingsbury, L. Zhou, A. Shyamsunder, K. A. Persson and L. F. Nazar, ACS Energy Lett., 2022, 7, 533–540 CrossRef CAS.
- G. Guo, X. Tan, K. Wang and H. Zhang, ChemSusChem, 2022, 15(11), e202200313 CrossRef CAS PubMed.
- H. Jiang, L. Tang, Y. Fu, S. Wang, S. K. Sandstrom, A. M. Scida, G. Li, D. Hoang, J. J. Hong, N.-C. Chiu, K. C. Stylianou, W. F. Stickle, D. Wang, J. Li, P. A. Greaney, C. Fang and X. Ji, Nat. Sustainability, 2023, 6, 806–815 CrossRef.
- D. Hoang, Y. Li, M. S. Jung, S. K. Sandstrom, A. M. Scida, H. Jiang, T. C. Gallagher, B. A. Pollard, R. Jensen, N. Chiu, K. Stylianou, W. F. Stickle, P. A. Greaney and X. Ji, Adv. Energy Mater., 2023, 13(42), 2301712 CrossRef CAS.
- R. Trócoli and F. La Mantia, ChemSusChem, 2015, 8, 481–485 CrossRef PubMed.
- L. Zhang, L. Chen, X. Zhou and Z. Liu, Adv. Energy Mater., 2015, 5(2), 1400930 CrossRef.
- Z. Liu, G. Pulletikurthi and F. Endres, ACS Appl. Mater. Interfaces, 2016, 8, 12158–12164 CrossRef CAS PubMed.
- T. Gupta, A. Kim, S. Phadke, S. Biswas, T. Luong, B. J. Hertzberg, M. Chamoun, K. Evans-Lutterodt and D. A. Steingart, J. Power Sources, 2016, 305, 22–29 CrossRef CAS.
- Z. Hou, X. Zhang, X. Li, Y. Zhu, J. Liang and Y. Qian, J. Mater. Chem. A, 2017, 5, 730–738 RSC.
- L. Qian, H. Zhu, T. Qin, R. Yao, J. Zhao, F. Kang and C. Yang, Adv. Funct. Mater., 2023, 33(23), 2301118 CrossRef CAS.
- Y. Cheng, L. Luo, L. Zhong, J. Chen, B. Li, W. Wang, S. X. Mao, C. Wang, V. L. Sprenkle, G. Li and J. Liu, ACS Appl. Mater. Interfaces, 2016, 8, 13673–13677 CrossRef CAS PubMed.
- K. Koshika, N. Sano, K. Oyaizu and H. Nishide, Macromol. Chem. Phys., 2009, 210, 1989–1995 CrossRef CAS.
- C. Zhijiang and H. Chengwei, J. Power Sources, 2011, 196, 10731–10736 CrossRef.
- Z. Cai, J. Guo, H. Yang and Y. Xu, J. Power Sources, 2015, 279, 114–122 CrossRef CAS.
- B. Häupler, C. Rössel, A. M. Schwenke, J. Winsberg, D. Schmidt, A. Wild and U. S. Schubert, NPG Asia Mater., 2016, 8, e283–e283 CrossRef.
- F. Wan, L. Zhang, X. Wang, S. Bi, Z. Niu and J. Chen, Adv. Funct. Mater., 2018, 28(45), 1804975 CrossRef.
- C. Kim, B. Y. Ahn, T.-S. Wei, Y. Jo, S. Jeong, Y. Choi, I.-D. Kim and J. A. Lewis, ACS Nano, 2018, 12, 11838–11846 CrossRef CAS PubMed.
- H. Shi, Y. Ye, K. Liu, Y. Song and X. Sun, Angew. Chem., Int. Ed., 2018, 57, 16359–16363 CrossRef CAS PubMed.
- Q. Zhao, W. Huang, Z. Luo, L. Liu, Y. Lu, Y. Li, L. Li, J. Hu, H. Ma and J. Chen, Sci. Adv., 2018, 4, eaao1761 CrossRef PubMed.
- G. Dawut, Y. Lu, L. Miao and J. Chen, Inorg. Chem. Front., 2018, 5, 1391–1396 RSC.
- Z. Guo, Y. Ma, X. Dong, J. Huang, Y. Wang and Y. Xia, Angew. Chem., Int. Ed., 2018, 57, 11737–11741 CrossRef CAS PubMed.
- D. Kundu, P. Oberholzer, C. Glaros, A. Bouzid, E. Tervoort, A. Pasquarello and M. Niederberger, Chem. Mater., 2018, 30, 3874–3881 CrossRef CAS.
- Y. Wang, C. Wang, Z. Ni, Y. Gu, B. Wang, Z. Guo, Z. Wang, D. Bin, J. Ma and Y. Wang, Adv. Mater., 2020, 32(16), 2000338 CrossRef CAS PubMed.
- D. Dong, T. Wang, Y. Sun, J. Fan and Y.-C. Lu, Nat. Sustainability, 2023, 6, 1474–1484 CrossRef.
- F. Cheng, J. Zhao, W. Song, C. Li, H. Ma, J. Chen and P. Shen, Inorg. Chem., 2006, 45, 2038–2044 CrossRef CAS PubMed.
- C. Xu, S. W. Chiang, J. Ma and F. Kang, J. Electrochem. Soc., 2013, 160, A93–A97 CrossRef CAS.
- D. Wang, L. Wang, G. Liang, H. Li, Z. Liu, Z. Tang, J. Liang and C. Zhi, ACS Nano, 2019, 13, 10643–10652 CrossRef CAS PubMed.
- A. Kozawa, T. Kalnoki-Kis and J. F. Yeager, J. Electrochem. Soc., 1966, 113, 405 CrossRef CAS.
- A. Singh, C. Laberty-Robert, V. Balland and B. Limoges, Adv. Energy Mater., 2023, 13(46), 2301745 CrossRef CAS.
- M. Mateos, N. Makivic, Y. Kim, B. Limoges and V. Balland, Adv. Energy Mater., 2020, 10(23), 2000332 CrossRef CAS.
- J. Ding, Z. Du, L. Gu, B. Li, L. Wang, S. Wang, Y. Gong and S. Yang, Adv. Mater., 2018, 30(26), 1800762 CrossRef PubMed.
- P. Hu, P. Hu, T. D. Vu, M. Li, S. Wang, Y. Ke, X. Zeng, L. Mai and Y. Long, Chem. Rev., 2023, 123, 4353–4415 CrossRef CAS PubMed.
- S. Park, S. Nishimura, A. Kitada and A. Yamada, ACS Appl. Energy Mater., 2024, 7, 4347–4352 CrossRef CAS.
- R. Schöllhorn, M. Kümpers and J. O. Besenhard, Mater. Res. Bull., 1977, 12, 781–788 CrossRef.
- E. Gocke, W. Schramm, P. Dolscheid and R. Schöllhorn, J. Solid State Chem., 1987, 70, 71–81 CrossRef CAS.
- M. S. Chae, J. W. Heo, S.-C. Lim and S.-T. Hong, Inorg. Chem., 2016, 55, 3294–3301 CrossRef CAS PubMed.
- L. Wang, M. Jiang, F. Liu, Q. Huang, L. Liu, L. Fu and Y. Wu, Energy Fuels, 2020, 34, 11590–11596 CrossRef CAS.
- P. He, M. Yan, G. Zhang, R. Sun, L. Chen, Q. An and L. Mai, Adv. Energy Mater., 2017, 7(11), 1601920 CrossRef.
- H. Liang, Z. Cao, F. Ming, W. Zhang, D. H. Anjum, Y. Cui, L. Cavallo and H. N. Alshareef, Nano Lett., 2019, 19, 3199–3206 CrossRef CAS PubMed.
- L. Geng, G. Lv, X. Xing and J. Guo, Chem. Mater., 2015, 27, 4926–4929 CrossRef CAS.
- D. Aurbach, Z. Lu, A. Schechter, Y. Gofer, H. Gizbar, R. Turgeman, Y. Cohen, M. Moshkovich and E. Levi, Nature, 2000, 407, 724–727 CrossRef CAS PubMed.
- A. Paolella, C. Faure, V. Timoshevskii, S. Marras, G. Bertoni, A. Guerfi, A. Vijh, M. Armand and K. Zaghib, J. Mater. Chem. A, 2017, 5, 18919–18932 RSC.
- B. Beverskog and I. Puigdomenech, Corros. Sci., 1997, 39, 107–114 CrossRef CAS.
- B. Lee, H. R. Seo, H. R. Lee, C. S. Yoon, J. H. Kim, K. Y. Chung, B. W. Cho and S. H. Oh, ChemSusChem, 2016, 9, 2948–2956 CrossRef CAS PubMed.
- L. Zhang, I. A. Rodríguez-Pérez, H. Jiang, C. Zhang, D. P. Leonard, Q. Guo, W. Wang, S. Han, L. Wang and X. Ji, Adv. Funct. Mater., 2019, 29(30), 1902653 CrossRef.
- X. Guo and G. He, J. Mater. Chem. A, 2023, 11, 11987–12001 RSC.
- Y.-S. Kim, K. D. Harris, B. Limoges and V. Balland, Chem. Sci., 2019, 10, 8752–8763 RSC.
- C. F. Bischoff, O. S. Fitz, J. Burns, M. Bauer, H. Gentischer, K. P. Birke, H.-M. Henning and D. Biro, J. Electrochem. Soc., 2020, 167, 020545 CrossRef CAS.
- H. Du, Y. Dong, Q. Li, R. Zhao, X. Qi, W. Kan, L. Suo, L. Qie, J. Li and Y. Huang, Adv. Mater., 2023, 35(25), 2210055 CrossRef CAS PubMed.
- G. Liang, B. Liang, A. Chen, J. Zhu, Q. Li, Z. Huang, X. Li, Y. Wang, X. Wang, B. Xiong, X. Jin, S. Bai, J. Fan and C. Zhi, Nat. Commun., 2023, 14, 1856 CrossRef CAS PubMed.
- Q. Zhang, Y. Ma, Y. Lu, L. Li, F. Wan, K. Zhang and J. Chen, Nat. Commun., 2020, 11, 4463 CrossRef CAS PubMed.
- C. Yang, J. Xia, C. Cui, T. P. Pollard, J. Vatamanu, A. Faraone, J. A. Dura, M. Tyagi, A. Kattan, E. Thimsen, J. Xu, W. Song, E. Hu, X. Ji, S. Hou, X. Zhang, M. S. Ding, S. Hwang, D. Su, Y. Ren, X.-Q. Yang, H. Wang, O. Borodin and C. Wang, Nat. Sustainability, 2023, 6, 325–335 CrossRef.
- G. Kear, B. D. Barker and F. C. Walsh, Corros. Sci., 2004, 46, 109–135 CrossRef CAS.
- R. T. Foley, Corrosion, 1970, 26, 58–70 CrossRef CAS.
- D. Prando, A. Brenna, M. V. Diamanti, S. Beretta, F. Bolzoni, M. Ormellese and M. Pedeferri, J. Appl. Biomater. Funct. Mater., 2017, 15, e291–e302 CAS.
- Y. An, Y. Tian, K. Zhang, Y. Liu, C. Liu, S. Xiong, J. Feng and Y. Qian, Adv. Funct. Mater., 2021, 31(26), 2101886 CrossRef CAS.
- L. Wang, Y. Zhang, H. Hu, H.-Y. Shi, Y. Song, D. Guo, X.-X. Liu and X. Sun, ACS Appl. Mater. Interfaces, 2019, 11, 42000–42005 CrossRef CAS PubMed.
- G. Kasiri, R. Trócoli, A. Bani Hashemi and F. La Mantia, Electrochim. Acta, 2016, 222, 74–83 CrossRef CAS.
- X. Liu, H. Euchner, M. Zarrabeitia, X. Gao, G. A. Elia, A. Groß and S. Passerini, ACS Energy Lett., 2020, 5, 2979–2986 CrossRef CAS PubMed.
- L. Ma, T. P. Pollard, Y. Zhang, M. A. Schroeder, X. Ren, K. S. Han, M. S. Ding, A. V. Cresce, T. B. Atwater, J. Mars, L. Cao, H.-G. Steinrück, K. T. Mueller, M. F. Toney, M. Hourwitz, J. T. Fourkas, E. J. Maginn, C. Wang, O. Borodin and K. Xu, One Earth, 2022, 5, 413–421 CrossRef.
- N. Zhang, F. Cheng, Y. Liu, Q. Zhao, K. Lei, C. Chen, X. Liu and J. Chen, J. Am. Chem. Soc., 2016, 138, 12894–12901 CrossRef CAS PubMed.
- Z. Xu, Y. Zhang, W. Gou, M. Liu, Y. Sun, X. Han, W. Sun and C. Li, Chem. Commun., 2022, 58, 8145–8148 RSC.
- D. Han, C. Cui, K. Zhang, Z. Wang, J. Gao, Y. Guo, Z. Zhang, S. Wu, L. Yin, Z. Weng, F. Kang and Q.-H. Yang, Nat. Sustainability, 2021, 5, 205–213 CrossRef.
- H. Du, Y. Dong, Q. Li, R. Zhao, X. Qi, W. Kan, L. Suo, L. Qie, J. Li and Y. Huang, Adv. Mater., 2023, 35(25), 2210055 CrossRef CAS PubMed.
- M. Peng, L. Li, L. Wang, X. Tang, K. Xiao, X. J. Gao, T. Hu, K. Yuan and Y. Chen, Fundam. Res., 2024, 4(6), 1488–1497 CrossRef CAS PubMed.
- X. Zeng, J. Mao, J. Hao, J. Liu, S. Liu, Z. Wang, Y. Wang, S. Zhang, T. Zheng, J. Liu, P. Rao and Z. Guo, Adv. Mater., 2021, 33(11), 2007416 CrossRef CAS PubMed.
- H. Meng, Q. Ran, T.-Y. Dai, H. Shi, S.-P. Zeng, Y.-F. Zhu, Z. Wen, W. Zhang, X.-Y. Lang, W.-T. Zheng and Q. Jiang, Nano-Micro Lett., 2022, 14, 128 CrossRef CAS PubMed.
- J. Shi, K. Xia, L. Liu, C. Liu, Q. Zhang, L. Li, X. Zhou, J. Liang and Z. Tao, Electrochim. Acta, 2020, 358, 136937 CrossRef CAS.
- J. Shin, J. Lee, Y. Kim, Y. Park, M. Kim and J. W. Choi, Adv. Energy Mater., 2021, 11(39), 2100676 CrossRef CAS.
- Y. Dong, L. Miao, G. Ma, S. Di, Y. Wang, L. Wang, J. Xu and N. Zhang, Chem. Sci., 2021, 12, 5843–5852 RSC.
- L. Zhang, G. Wang, J. Feng, Q. Ma, Z. Liu and X. Yan, ChemElectroChem, 2021, 8, 1289–1297 CrossRef CAS.
- X. Chen, P. Gao, W. Li, N. A. Thieu, Z. M. Grady, N. G. Akhmedov, K. A. Sierros, M. Velayutham, V. V. Khramtsov, D. M. Reed, X. Li and X. Liu, ACS Energy Lett., 2024, 9, 1654–1665 CrossRef CAS.
- X. Chen, W. Li, S. Hu, N. G. Akhmedov, D. Reed, X. Li and X. Liu, Nano Energy, 2022, 98, 107269 CrossRef CAS.
- X. Liu, Q. Ma, M. Shi, Q. Han and C. Liu, Chem. Eng. J., 2023, 456, 141016 CrossRef CAS.
- X. Zhao, X. Zhang, N. Dong, M. Yan, F. Zhang, K. Mochizuki and H. Pan, Small, 2022, 18(21), 2200742 CrossRef CAS PubMed.
- D. Li, L. Cao, T. Deng, S. Liu and C. Wang, Angew. Chem., Int. Ed., 2021, 60, 13035–13041 CrossRef CAS PubMed.
- K. Zhao, C. Wang, Y. Yu, M. Yan, Q. Wei, P. He, Y. Dong, Z. Zhang, X. Wang and L. Mai, Adv. Mater. Interfaces, 2018, 5(16), 1800848 CrossRef.
- M. Shayan, R. Abouzeid, W. Xu, T. Wu and Q. Wu, J. Mater. Chem. A, 2024, 12, 2820–2829 RSC.
- J. Zhu, M. Yang, Y. Hu, M. Yao, J. Chen and Z. Niu, Adv. Mater., 2024, 36(3), 2304426 CrossRef CAS PubMed.
- S. Chen, D. Ji, Q. Chen, J. Ma, S. Hou and J. Zhang, Nat. Commun., 2023, 14, 3526 CrossRef CAS PubMed.
- N. R. Pitawela and S. K. Shaw, ACS Meas. Sci. Au, 2021, 1, 117–130 CrossRef CAS PubMed.
- H. Qiu, X. Du, J. Zhao, Y. Wang, J. Ju, Z. Chen, Z. Hu, D. Yan, X. Zhou and G. Cui, Nat. Commun., 2019, 10, 5374 CrossRef PubMed.
- F. Wang, O. Borodin, T. Gao, X. Fan, W. Sun, F. Han, A. Faraone, J. A. Dura, K. Xu and C. Wang, Nat. Mater., 2018, 17, 543–549 CrossRef CAS PubMed.
- L. Cao, D. Li, T. Pollard, T. Deng, B. Zhang, C. Yang, L. Chen, J. Vatamanu, E. Hu, M. J. Hourwitz, L. Ma, M. Ding, Q. Li, S. Hou, K. Gaskell, J. T. Fourkas, X.-Q. Yang, K. Xu, O. Borodin and C. Wang, Nat. Nanotechnol., 2021, 16, 902–910 CrossRef CAS PubMed.
- L. Ma, T. P. Pollard, Y. Zhang, M. A. Schroeder, M. S. Ding, A. V. Cresce, R. Sun, D. R. Baker, B. A. Helms, E. J. Maginn, C. Wang, O. Borodin and K. Xu, Angew. Chem., Int. Ed., 2021, 60, 12438–12445 CrossRef CAS PubMed.
- G. Liang, Z. Tang, B. Han, J. Zhu, A. Chen, Q. Li, Z. Chen, Z. Huang, X. Li, Q. Yang and C. Zhi, Adv. Mater., 2023, 35(20), 2210051 CrossRef CAS PubMed.
- Z. Zhang, Y. Li, R. Xu, W. Zhou, Y. Li, S. T. Oyakhire, Y. Wu, J. Xu, H. Wang, Z. Yu, D. T. Boyle, W. Huang, Y. Ye, H. Chen, J. Wan, Z. Bao, W. Chiu and Y. Cui, Science, 2022, 375, 66–70 CrossRef CAS PubMed.
- D. T. Boyle, W. Huang, H. Wang, Y. Li, H. Chen, Z. Yu, W. Zhang, Z. Bao and Y. Cui, Nat. Energy, 2021, 6, 487–494 CrossRef CAS.
- J. Zhi, S. Zhao, M. Zhou, R. Wang and F. Huang, Sci. Adv., 2023, 9, eade2217 CrossRef CAS PubMed.
- Z. Xue, D. He and X. Xie, J. Mater. Chem. A, 2015, 3, 19218–19253 RSC.
- N. S. Schauser, R. Seshadri and R. A. Segalman, Mol. Syst. Des. Eng., 2019, 4, 263–279 RSC.
- Z. W. B. Iton and K. A. See, Chem. Mater., 2022, 34, 881–898 CrossRef CAS.
- H. Steinrück, C. Cao, M. R. Lukatskaya, C. J. Takacs, G. Wan, D. G. Mackanic, Y. Tsao, J. Zhao, B. A. Helms, K. Xu, O. Borodin, J. F. Wishart and M. F. Toney, Angew. Chem., Int. Ed., 2020, 59, 23180–23187 CrossRef PubMed.
- W. Yu, Z. Yu, Y. Cui and Z. Bao, ACS Energy Lett., 2022, 7, 3270–3275 CrossRef CAS.
- J. Tan, J. Matz, P. Dong, J. Shen and M. Ye, Adv. Energy Mater., 2021, 11(16), 2100046 CrossRef CAS.
- M. He, R. Guo, G. M. Hobold, H. Gao and B. M. Gallant, Proc. Natl. Acad. Sci. U. S. A., 2020, 117, 73–79 CrossRef CAS PubMed.
- J. Jones, M. Anouti, M. Caillon-Caravanier, P. Willmann and D. Lemordant, Fluid Phase Equilib., 2009, 285, 62–68 CrossRef CAS.
- D. Wynn, Talanta, 1984, 31, 1036–1040 CrossRef CAS PubMed.
- H. Adenusi, G. A. Chass, S. Passerini, K. V. Tian and G. Chen, Adv. Energy Mater., 2023, 13(10), 2203307 CrossRef CAS.
- R. A. Vilá, D. T. Boyle, A. Dai, W. Zhang, P. Sayavong, Y. Ye, Y. Yang, J. A. Dionne and Y. Cui, Sci. Adv., 2023, 9, eadf3609 CrossRef PubMed.
- Z. Shadike, H. Lee, O. Borodin, X. Cao, X. Fan, X. Wang, R. Lin, S.-M. Bak, S. Ghose, K. Xu, C. Wang, J. Liu, J. Xiao, X.-Q. Yang and E. Hu, Nat. Nanotechnol., 2021, 16, 549–554 CrossRef CAS PubMed.
- S. Zhang, R. Li, N. Hu, T. Deng, S. Weng, Z. Wu, D. Lu, H. Zhang, J. Zhang, X. Wang, L. Chen, L. Fan and X. Fan, Nat. Commun., 2022, 13, 5431 CrossRef CAS PubMed.
- D. Aurbach and I. Weissman, Electrochem. Commun., 1999, 1, 324–331 CrossRef CAS.
- J. Han, H. Euchner, M. Kuenzel, S. M. Hosseini, A. Groß, A. Varzi and S. Passerini, ACS Energy Lett., 2021, 6, 3063–3071 CrossRef CAS.
- L. Ma, Q. Li, Y. Ying, F. Ma, S. Chen, Y. Li, H. Huang and C. Zhi, Adv. Mater., 2021, 33(12), 2007406 CrossRef CAS PubMed.
- Y. Yang, C. Liu, Z. Lv, H. Yang, Y. Zhang, M. Ye, L. Chen, J. Zhao and C. C. Li, Adv. Mater., 2021, 33(11), 2007388 CrossRef CAS PubMed.
- R. Jay, A. W. Tomich, J. Zhang, Y. Zhao, A. De Gorostiza, V. Lavallo and J. Guo, ACS Appl. Mater. Interfaces, 2019, 11, 11414–11420 CrossRef CAS PubMed.
- J. Forero-Saboya, C. Bodin and A. Ponrouch, Electrochem. Commun., 2021, 124, 106936 CrossRef CAS.
- A. Ponrouch, C. Frontera, F. Bardé and M. R. Palacín, Nat. Mater., 2016, 15, 169–172 CrossRef CAS PubMed.
- A. Shyamsunder, L. E. Blanc, A. Assoud and L. F. Nazar, ACS Energy Lett., 2019, 4, 2271–2276 CrossRef CAS.
- J. Forero-Saboya, C. Davoisne, R. Dedryvère, I. Yousef, P. Canepa and A. Ponrouch, Energy Environ. Sci., 2020, 13, 3423–3431 RSC.
- D. Wang, X. Gao, Y. Chen, L. Jin, C. Kuss and P. G. Bruce, Nat. Mater., 2018, 17, 16–20 CrossRef CAS PubMed.
- P. Xiong, Y. Zhang, J. Zhang, S. H. Baek, L. Zeng, Y. Yao and H. S. Park, EnergyChem, 2022, 4, 100076 CrossRef CAS.
- R. Qin, Y. Wang, L. Yao, L. Yang, Q. Zhao, S. Ding, L. Liu and F. Pan, Nano Energy, 2022, 98, 107333 CrossRef CAS.
- J. Zheng, Z. Huang, F. Ming, Y. Zeng, B. Wei, Q. Jiang, Z. Qi, Z. Wang and H. Liang, Small, 2022, 18(21), 2200006 CrossRef CAS PubMed.
- F. Wan, X. Zhou, Y. Lu, Z. Niu and J. Chen, ACS Energy Lett., 2020, 5, 3569–3590 CrossRef CAS.
- W. Li, K. Wang, M. Zhou, H. Zhan, S. Cheng and K. Jiang, ACS Appl. Mater. Interfaces, 2018, 10, 22059–22066 CrossRef CAS PubMed.
- C. Shen, X. Li, N. Li, K. Xie, J. Wang, X. Liu and B. Wei, ACS Appl. Mater. Interfaces, 2018, 10, 25446–25453 CrossRef CAS PubMed.
- Y. Zeng, X. Zhang, R. Qin, X. Liu, P. Fang, D. Zheng, Y. Tong and X. Lu, Adv. Mater., 2019, 31(36), 1903675 CrossRef PubMed.
- A. Xia, X. Pu, Y. Tao, H. Liu and Y. Wang, Appl. Surf. Sci., 2019, 481, 852–859 CrossRef CAS.
- R. Yuksel, O. Buyukcakir, W. K. Seong and R. S. Ruoff, Adv. Energy Mater., 2020, 10(16), 1904215 CrossRef CAS.
- L. Dong, W. Yang, W. Yang, H. Tian, Y. Huang, X. Wang, C. Xu, C. Wang, F. Kang and G. Wang, Chem. Eng. J., 2020, 384, 123355 CrossRef CAS.
- Z. Li, L. Wu, S. Dong, T. Xu, S. Li, Y. An, J. Jiang and X. Zhang, Adv. Funct. Mater., 2021, 31(4), 2006495 CrossRef CAS.
- S. Zhai, N. Wang, X. Tan, K. Jiang, Z. Quan, Y. Li and Z. Li, Adv. Funct. Mater., 2021, 31(13), 2008894 CrossRef CAS.
- J. Zhou, M. Xie, F. Wu, Y. Mei, Y. Hao, R. Huang, G. Wei, A. Liu, L. Li and R. Chen, Adv. Mater., 2021, 33(33), 2101649 CrossRef CAS PubMed.
- Z. Ge, H. Zhang, J. Tian, J. Wu, Y. Xu, W. Deng, G. Zou, D. He, H. Hou, C. Wang and X. Ji, Chem. Eng. J., 2023, 466, 143054 CrossRef CAS.
- X. Zhang, Q. Ruan, L. Liu, D. Li, Y. Xu, Y. Wang, J. Liu, C. Huang, F. Xiong, B. Wang and P. K. Chu, J. Electroanal. Chem., 2023, 936, 117357 CrossRef CAS.
- Z. H. Xie, Y. F. Yuan, Z. J. Yao, M. Zhu, S. Y. Guo and P. F. Du, Chem. Eng. J., 2024, 484, 149601 CrossRef CAS.
- L. Kang, K. Yue, C. Ma, H. Yuan, J. Luo, Y. Wang, Y. Liu, J. Nai and X. Tao, Nano Lett., 2024, 24, 4150–4157 CrossRef CAS PubMed.
- L. Kang, M. Cui, F. Jiang, Y. Gao, H. Luo, J. Liu, W. Liang and C. Zhi, Adv. Energy Mater., 2018, 8(25), 1801090 CrossRef.
- M. Cui, Y. Xiao, L. Kang, W. Du, Y. Gao, X. Sun, Y. Zhou, X. Li, H. Li, F. Jiang and C. Zhi, ACS Appl. Energy Mater., 2019, 2, 6490–6496 CrossRef CAS.
- X. Xie, S. Liang, J. Gao, S. Guo, J. Guo, C. Wang, G. Xu, X. Wu, G. Chen and J. Zhou, Energy Environ. Sci., 2020, 13, 503–510 RSC.
- D. Han, S. Wu, S. Zhang, Y. Deng, C. Cui, L. Zhang, Y. Long, H. Li, Y. Tao, Z. Weng, Q. Yang and F. Kang, Small, 2020, 16(29), 2001736 CrossRef CAS PubMed.
- K. Hu, X. Guan, R. Lv, G. Li, Z. Hu, L. Ren, A. Wang, X. Liu and J. Luo, Chem. Eng. J., 2020, 396, 125363 CrossRef CAS.
- Z. Cai, Y. Ou, J. Wang, R. Xiao, L. Fu, Z. Yuan, R. Zhan and Y. Sun, Energy Storage Mater., 2020, 27, 205–211 CrossRef.
- J. Hao, B. Li, X. Li, X. Zeng, S. Zhang, F. Yang, S. Liu, D. Li, C. Wu and Z. Guo, Adv. Mater., 2020, 32(34), 2003021 CrossRef CAS PubMed.
- Q. Zhang, J. Luan, X. Huang, Q. Wang, D. Sun, Y. Tang, X. Ji and H. Wang, Nat. Commun., 2020, 11, 3961 CrossRef CAS PubMed.
- S.-B. Wang, Q. Ran, R.-Q. Yao, H. Shi, Z. Wen, M. Zhao, X.-Y. Lang and Q. Jiang, Nat. Commun., 2020, 11, 1634 CrossRef CAS PubMed.
- J. Y. Kim, G. Liu, G. Y. Shim, H. Kim and J. K. Lee, Adv. Funct. Mater., 2020, 30(36), 2004210 CrossRef CAS.
- H. He, H. Tong, X. Song, X. Song and J. Liu, J. Mater. Chem. A, 2020, 8, 7836–7846 RSC.
- C. Deng, X. Xie, J. Han, Y. Tang, J. Gao, C. Liu, X. Shi, J. Zhou and S. Liang, Adv. Funct. Mater., 2020, 30(21), 2000599 CrossRef CAS.
- P. Liang, J. Yi, X. Liu, K. Wu, Z. Wang, J. Cui, Y. Liu, Y. Wang, Y. Xia and J. Zhang, Adv. Funct. Mater., 2020, 30(13), 1908528 CrossRef CAS.
- M. Liu, J. Cai, H. Ao, Z. Hou, Y. Zhu and Y. Qian, Adv. Funct. Mater., 2020, 30(50), 2004885 CrossRef CAS.
- Y. Zhang, G. Wang, F. Yu, G. Xu, Z. Li, M. Zhu, Z. Yue, M. Wu, H.-K. Liu, S.-X. Dou and C. Wu, Chem. Eng. J., 2021, 416, 128062 CrossRef CAS.
- Z. Cai, Y. Ou, B. Zhang, J. Wang, L. Fu, M. Wan, G. Li, W. Wang, L. Wang, J. Jiang, Z. W. Seh, E. Hu, X.-Q. Yang, Y. Cui and Y. Sun, J. Am. Chem. Soc., 2021, 143, 3143–3152 CrossRef CAS PubMed.
- Q. Lu, C. Liu, Y. Du, X. Wang, L. Ding, A. Omar and D. Mikhailova, ACS Appl. Mater. Interfaces, 2021, 13, 16869–16875 CrossRef CAS PubMed.
- S. Li, J. Fu, G. Miao, S. Wang, W. Zhao, Z. Wu, Y. Zhang and X. Yang, Adv. Mater., 2021, 33(21), 2008424 CrossRef CAS PubMed.
- W. Guo, Y. Zhang, X. Tong, X. Wang, L. Zhang, X. Xia and J. Tu, Mater Today Energy, 2021, 20, 100675 CrossRef CAS.
- Z. Miao, M. Du, H. Li, F. Zhang, H. Jiang, Y. Sang, Q. Li, H. Liu and S. Wang, EcoMat, 2021, 3(4), e12125 CrossRef CAS.
- H. Tian, Z. Li, G. Feng, Z. Yang, D. Fox, M. Wang, H. Zhou, L. Zhai, A. Kushima, Y. Du, Z. Feng, X. Shan and Y. Yang, Nat. Commun., 2021, 12, 237 CrossRef CAS PubMed.
- C. Liu, Z. Luo, W. Deng, W. Wei, L. Chen, A. Pan, J. Ma, C. Wang, L. Zhu, L. Xie, X.-Y. Cao, J. Hu, G. Zou, H. Hou and X. Ji, ACS Energy Lett., 2021, 6, 675–683 CrossRef CAS.
- H. Jia, Z. Wang, M. Dirican, S. Qiu, C. Y. Chan, S. Fu, B. Fei and X. Zhang, J. Mater. Chem. A, 2021, 9, 5597–5605 RSC.
- L. Zhang, B. Zhang, T. Zhang, T. Li, T. Shi, W. Li, T. Shen, X. Huang, J. Xu, X. Zhang, Z. Wang and Y. Hou, Adv. Funct. Mater., 2021, 31(26), 2100186 CrossRef CAS.
- X. Yang, C. Li, Z. Sun, S. Yang, Z. Shi, R. Huang, B. Liu, S. Li, Y. Wu, M. Wang, Y. Su, S. Dou and J. Sun, Adv. Mater., 2021, 33(52), 2105951 CrossRef CAS PubMed.
- T. C. Li, Y. Von Lim, X. Xie, X. L. Li, G. Li, D. Fang, Y. Li, Y. S. Ang, L. K. Ang and H. Y. Yang, Small, 2021, 17(35), 2101728 CrossRef CAS PubMed.
- Z. Yang, C. Lv, W. Li, T. Wu, Q. Zhang, Y. Tang, M. Shao and H. Wang, Small, 2022, 18(43), 2104148 CrossRef CAS PubMed.
- J. Zheng, Z. Cao, F. Ming, H. Liang, Z. Qi, W. Liu, C. Xia, C. Chen, L. Cavallo, Z. Wang and H. N. Alshareef, ACS Energy Lett., 2022, 7, 197–203 CrossRef CAS.
- S. Zhou, Y. Wang, H. Lu, Y. Zhang, C. Fu, I. Usman, Z. Liu, M. Feng, G. Fang, X. Cao, S. Liang and A. Pan, Adv. Funct. Mater., 2021, 31(46), 2104361 CrossRef CAS.
- P. Cao, X. Zhou, A. Wei, Q. Meng, H. Ye, W. Liu, J. Tang and J. Yang, Adv. Funct. Mater., 2021, 31(20), 2100398 CrossRef CAS.
- L. Dai, T. Wang, B. Jin, N. Liu, Y. Niu, W. Meng, Z. Gao, X. Wu, L. Wang and Z. He, Surf. Coat. Technol., 2021, 427, 127813 CrossRef CAS.
- K. Wu, J. Yi, X. Liu, Y. Sun, J. Cui, Y. Xie, Y. Liu, Y. Xia and J. Zhang, Nano-Micro Lett., 2021, 13, 79 CrossRef PubMed.
- P. Zou, R. Zhang, L. Yao, J. Qin, K. Kisslinger, H. Zhuang and H. L. Xin, Adv. Energy Mater., 2021, 11(31), 2100982 CrossRef CAS.
- M. Zhou, S. Guo, G. Fang, H. Sun, X. Cao, J. Zhou, A. Pan and S. Liang, J. Energy Chem., 2021, 55, 549–556 CrossRef CAS.
- C. Deng, X. Xie, J. Han, B. Lu, S. Liang and J. Zhou, Adv. Funct. Mater., 2021, 31(51), 2103227 CrossRef CAS.
- H. Liu, J. Wang, W. Hua, H. Sun, Y. Huyan, S. Tian, Z. Hou, J. Yang, C. Wei and F. Kang, Adv. Sci., 2021, 8(23), 2102612 CrossRef CAS PubMed.
- B. Li, J. Xue, C. Han, N. Liu, K. Ma, R. Zhang, X. Wu, L. Dai, L. Wang and Z. He, J. Colloid Interface Sci., 2021, 599, 467–475 CrossRef CAS PubMed.
- P. Xiao, L. Xue, Y. Guo, L. Hu, C. Cui, H. Li and T. Zhai, Sci. Bull., 2021, 66, 545–552 CrossRef CAS PubMed.
- Y. Yang, C. Liu, Z. Lv, H. Yang, X. Cheng, S. Zhang, M. Ye, Y. Zhang, L. Chen, J. Zhao and C. C. Li, Energy Storage Mater., 2021, 41, 230–239 CrossRef.
- S. Wu, S. Zhang, Y. Chu, Z. Hu and J. Luo, Adv. Funct. Mater., 2021, 31(49), 2107397 CrossRef CAS.
- Y. Zhang, M. Zhu, G. Wang, F. Du, F. Yu, K. Wu, M. Wu, S. Dou, H. Liu and C. Wu, Small Methods, 2021, 5(10), 2100650 CrossRef CAS PubMed.
- D. Wang, D. Lv, H. Peng, N. Wang, H. Liu, J. Yang and Y. Qian, Nano Lett., 2022, 22, 1750–1758 CrossRef CAS PubMed.
- G. Liang, J. Zhu, B. Yan, Q. Li, A. Chen, Z. Chen, X. Wang, B. Xiong, J. Fan, J. Xu and C. Zhi, Energy Environ. Sci., 2022, 15, 1086–1096 RSC.
- J. Y. Kim, G. Liu, R. E. A. Ardhi, J. Park, H. Kim and J. K. Lee, Nano-Micro Lett., 2022, 14, 46 CrossRef CAS PubMed.
- P. Xiao, H. Li, J. Fu, C. Zeng, Y. Zhao, T. Zhai and H. Li, Energy Environ. Sci., 2022, 15, 1638–1646 RSC.
- S. Zhai, X. Shi, K. Jiang, X. Tan, W. Zhang, J. Zhang, H. Zhang and Z. Li, Chem. Eng. J., 2022, 437, 135246 CrossRef CAS.
- L. Hong, L. Wang, Y. Wang, X. Wu, W. Huang, Y. Zhou, K. Wang and J. Chen, Adv. Sci., 2022, 9(6), 2104866 CrossRef CAS PubMed.
- J. Zheng, Z. Huang, Y. Zeng, W. Liu, B. Wei, Z. Qi, Z. Wang, C. Xia and H. Liang, Nano Lett., 2022, 22, 1017–1023 CrossRef CAS PubMed.
- A. Chen, C. Zhao, Z. Guo, X. Lu, N. Liu, Y. Zhang, L. Fan and N. Zhang, Energy Storage Mater., 2022, 44, 353–359 CrossRef.
- Y. Zhou, G. Li, S. Feng, H. Qin, Q. Wang, F. Shen, P. Liu, Y. Huang and H. He, Adv. Sci., 2023, 10(6), 2205874 CrossRef CAS PubMed.
- S. Wang, Z. Yang, B. Chen, H. Zhou, S. Wan, L. Hu, M. Qiu, L. Qie and Y. Yu, Energy Storage Mater., 2022, 47, 491–499 CrossRef.
- T. Chen, F. Huang, Y. Wang, Y. Yang, H. Tian and J. M. Xue, Adv. Sci., 2022, 9(14), 2105980 CrossRef CAS PubMed.
- J. Yan, M. Ye, Y. Zhang, Y. Tang and C. Chao Li, Chem. Eng. J., 2022, 432, 134227 CrossRef CAS.
- H. Peng, C. Liu, N. Wang, C. Wang, D. Wang, Y. Li, B. Chen, J. Yang and Y. Qian, Energy Environ. Sci., 2022, 15, 1682–1693 RSC.
- S. Bhoyate, S. Mhin, J. Jeon, K. Park, J. Kim and W. Choi, ACS Appl. Mater. Interfaces, 2020, 12, 27249–27257 CrossRef CAS PubMed.
- Y. Xiong, F. Zhou, D. Zhu, X. Jing, H. Shi, W. Li and D. Wang, J. Electrochem. Soc., 2023, 170, 010516 CrossRef CAS.
- Z. Gong, Z. Li, P. Wang, K. Jiang, Z. Bai, K. Zhu, J. Yan, K. Ye, G. Wang, D. Cao and G. Chen, Energy Mater. Adv., 2023, 4, 0035 CrossRef CAS.
- H. J. Kim, S. Kim, S. Kim, S. Kim, K. Heo, J. Lim, H. Yashiro, H. Shin, H. Jung, Y. M. Lee and S. Myung, Adv. Mater., 2024, 36(1), 2308592 CrossRef CAS PubMed.
- H. Zhao, Z. Chi, Q. Zhang, D. Kong, L. Li, Z. Guo and L. Wang, Appl. Surf. Sci., 2023, 613, 156129 CrossRef CAS.
- C.-Y. Tian, W.-W. Li, X.-W. Liu, D.-T. Zhang, Y.-Y. Wang, C.-Y. Li, Y.-Q. Wang, B. Zhao, M.-F. Wang, M.-P. Li, H. Chen and M.-C. Liu, ACS Sustainable Chem. Eng., 2023, 11, 3576–3584 CrossRef CAS.
- Q. Zhang, J. Liang, M. Li, J. Qin, Y. Zhao, L. Ren, W. Liu, C. Yang and X. Sun, Chem. Eng. J., 2023, 474, 145981 CrossRef CAS.
- J. Duan, J. Dong, R. Cao, H. Yang, K. Fang, Y. Liu, Z. Shen, F. Li, R. Liu, H. Li and C. Chen, Adv. Sci., 2023, 10(29), 2303343 CrossRef CAS PubMed.
- H. Gan, J. Wu, F. Zhang, R. Li and H. Liu, Energy Storage Mater., 2023, 55, 264–271 CrossRef.
- F. Zhang, H. Tao, Y. Li and X. Yang, Mater. Today Commun., 2024, 39, 108606 CrossRef CAS.
- K. Zhang, C. Li, J. Liu, S. Zhang, M. Wang and L. Wang, Small, 2024, 20(14), 2306406 CrossRef CAS PubMed.
- J. Ko, S. So, M. Kim, I. Tae Kim, Y. Nam Ahn and J. Hur, Chem. Eng. J., 2023, 462, 142308 CrossRef CAS.
- C. Choi, J. B. Park, J. H. Park, S. Yu and D.-W. Kim, Chem. Eng. J., 2023, 456, 141015 CrossRef CAS.
- X. Lei, Z. Ma, L. Bai, L. Wang, Y. Ding, S. Song, A. Song, H. Dong, H. Tian, H. Tian, X. Meng, H. Liu, B. Sun, G. Shao and G. Wang, Battery Energy, 2023, 2(6), 20230024 CrossRef CAS.
- H. Lu, W. Hua, Z. Zhang, X. An, J. Feng, B. Xi and S. Xiong, Small, 2024, 20(30), 2312187 CrossRef CAS PubMed.
- P. Jiang, Y. Wang, Y. Li, L. Dai, N. Xu, J. Qiao and D. Ruan, Sep. Purif. Technol., 2024, 341, 126813 CrossRef CAS.
- M. Liu, L. Yang, H. Liu, A. Amine, Q. Zhao, Y. Song, J. Yang, K. Wang and F. Pan, ACS Appl. Mater. Interfaces, 2019, 11, 32046–32051 CrossRef CAS PubMed.
- H. Yang, Z. Chang, Y. Qiao, H. Deng, X. Mu, P. He and H. Zhou, Angew. Chem., Int. Ed., 2020, 59, 9377–9381 CrossRef CAS PubMed.
- Y. Cui, Q. Zhao, X. Wu, X. Chen, J. Yang, Y. Wang, R. Qin, S. Ding, Y. Song, J. Wu, K. Yang, Z. Wang, Z. Mei, Z. Song, H. Wu, Z. Jiang, G. Qian, L. Yang and F. Pan, Angew. Chem., Int. Ed., 2020, 59, 16594–16601 CrossRef CAS PubMed.
- X. Liu, F. Yang, W. Xu, Y. Zeng, J. He and X. Lu, Adv. Sci., 2020, 7(21), 2002173 CrossRef CAS PubMed.
- X. Zeng, J. Zhao, Z. Wan, W. Jiang, M. Ling, L. Yan and C. Liang, J. Phys. Chem. Lett., 2021, 12, 9055–9059 CrossRef CAS PubMed.
- Y. Wang, Y. Liu, H. Wang, S. Dou, W. Gan, L. Ci, Y. Huang and Q. Yuan, J. Mater. Chem. A, 2022, 10, 4366–4375 RSC.
- J. H. Park, M. Kwak, C. Hwang, K. Kang, N. Liu, J. Jang and B. A. Grzybowski, Adv. Mater., 2021, 33(34), 2101726 CrossRef CAS PubMed.
- Z. Zhao, R. Wang, C. Peng, W. Chen, T. Wu, B. Hu, W. Weng, Y. Yao, J. Zeng, Z. Chen, P. Liu, Y. Liu, G. Li, J. Guo, H. Lu and Z. Guo, Nat. Commun., 2021, 12, 6606 CrossRef CAS PubMed.
- H. Yan, S. Li, Y. Nan, S. Yang and B. Li, Adv. Energy Mater., 2021, 11(18), 2100186 CrossRef CAS.
- L. Hong, X. Wu, C. Ma, W. Huang, Y. Zhou, K.-X. Wang and J.-S. Chen, J. Mater. Chem. A, 2021, 9, 16814–16823 RSC.
- M. Cui, B. Yan, F. Mo, X. Wang, Y. Huang, J. Fan, C. Zhi and H. Li, Chem. Eng. J., 2022, 434, 134688 CrossRef CAS.
- H. Gan, J. Wu, R. Li, B. Huang and H. Liu, Energy Storage Mater., 2022, 47, 602–610 CrossRef.
- Z. Miao, F. Zhang, H. Zhao, M. Du, H. Li, H. Jiang, W. Li, Y. Sang, H. Liu and S. Wang, Adv. Funct. Mater., 2022, 32(20), 2111635 CrossRef CAS.
- J. Zhao, Y. Ying, G. Wang, K. Hu, Y. Di Yuan, H. Ye, Z. Liu, J. Y. Lee and D. Zhao, Energy Storage Mater., 2022, 48, 82–89 CrossRef.
- L. Yuan, Y. Song, Y. Wan, J. Zhang and X. Liu, Appl. Surf. Sci., 2023, 637, 157936 CrossRef CAS.
- W. Xin, J. Xiao, J. Li, L. Zhang, H. Peng, Z. Yan and Z. Zhu, Energy Storage Mater., 2023, 56, 76–86 CrossRef.
- Y. Xiang, Y. Zhong, P. Tan, L. Zhou, G. Yin, H. Pan, X. Li, Y. Jiang, M. Xu and X. Zhang, Small, 2023, 19(43), 2302161 CrossRef CAS PubMed.
- D. Li, Y. Ouyang, H. Lu, Y. Xie, S. Guo, Q. Zeng, Y. Xiao, Q. Zhang and S. Huang, Mater. Today Chem., 2023, 32, 101629 CrossRef CAS.
- Z. Zhao, J. Zhao, Z. Hu, J. Li, J. Li, Y. Zhang, C. Wang and G. Cui, Energy Environ. Sci., 2019, 12, 1938–1949 RSC.
- F. Zhang, C. Wang, J. Pan, F. Tian, S. Zeng, J. Yang and Y. Qian, Mater Today Energy, 2020, 17, 100443 CrossRef.
- Z. Li, W. Deng, C. Li, W. Wang, Z. Zhou, Y. Li, X. Yuan, J. Hu, M. Zhang, J. Zhu, W. Tang, X. Wang and R. Li, J. Mater. Chem. A, 2020, 8, 17725–17731 RSC.
- S. H. Park, S. Y. Byeon, J.-H. Park and C. Kim, ACS Energy Lett., 2021, 6, 3078–3085 CrossRef CAS.
- K. Wang, J.-B. Le, S.-J. Zhang, W.-F. Ren, J.-M. Yuan, T.-T. Su, B.-Y. Chi, C.-Y. Shao and R.-C. Sun, J. Mater. Chem. A, 2022, 10, 4845–4857 RSC.
- L. T. Hieu, S. So, I. T. Kim and J. Hur, Chem. Eng. J., 2021, 411, 128584 CrossRef CAS.
- Y. Wang, T. Guo, J. Yin, Z. Tian, Y. Ma, Z. Liu, Y. Zhu and H. N. Alshareef, Adv. Mater., 2022, 34(4), 2106937 CrossRef CAS PubMed.
- P. Chen, X. Yuan, Y. Xia, Y. Zhang, L. Fu, L. Liu, N. Yu, Q. Huang, B. Wang, X. Hu, Y. Wu and T. van Ree, Adv. Sci., 2021, 8(11), 2100309 CrossRef CAS PubMed.
- T. Sun, Z. Li, Y. Zhi, Y. Huang, H. J. Fan and Q. Zhang, Adv. Funct. Mater., 2021, 31(16), 2010049 CrossRef CAS.
- H. Du, R. Zhao, Y. Yang, Z. Liu, L. Qie and Y. Huang, Angew. Chem., Int. Ed., 2022, 61(10), e202114789 CrossRef CAS PubMed.
- S. Jiao, J. Fu, M. Wu, T. Hua and H. Hu, ACS Nano, 2022, 16, 1013–1024 CrossRef CAS PubMed.
- Q. Liu, Y. Wang, X. Hong, R. Zhou, Z. Hou and B. Zhang, Adv. Energy Mater., 2022, 12(20), 2200318 CrossRef CAS.
- W. Fan, Z. Sun, Y. Yuan, X. Yuan, C. You, Q. Huang, J. Ye, L. Fu, V. Kondratiev and Y. Wu, J. Mater. Chem. A, 2022, 10, 7645–7652 RSC.
- G. Li, X. Wang, S. Lv, J. Wang, W. Yu, X. Dong and D. Liu, Adv. Funct. Mater., 2023, 33(4), 2208288 CrossRef CAS.
- X. Cai, X. Wang, Z. Bie, Z. Jiao, Y. Li, W. Yan, H. J. Fan and W. Song, Adv. Mater., 2024, 36(3), 2306734 CrossRef CAS PubMed.
- B. Zhou, B. Miao, Y. Gao, A. Yu and Z. Shao, Small, 2023, 19(35), 2300895 CrossRef CAS PubMed.
- P. Tangthuam, W. Kao-ian, J. Sangsawang, C. Rojviriya, P. Chirawatkul, J. Kasemchainan, F. Mahlendorf, M. T. Nguyen, T. Yonezawa and S. Kheawhom, Mater. Sci. Energy Technol., 2023, 6, 417–428 CAS.
- P. Ye, X. Li, K. He, A. Dou, X. Wang, A. Naveed, Y. Zhou, M. Su, P. Zhang and Y. Liu, J. Power Sources, 2023, 558, 232622 CrossRef CAS.
- L. Xiong, H. Fu, K. Yang, J. Y. Kim, R. Ren, J. K. Lee, W. Yang and G. Liu, Carbon Energy, 2023, 5(6), e370 CrossRef CAS.
- Z. Meng, Y. Jiao and P. Wu, Angew. Chem., Int. Ed., 2023, 62(31), e202307271 CrossRef PubMed.
- X. Qi, F. Xie, Y.-T. Xu, H. Xu, C.-L. Sun, S.-H. Wang, J.-Y. Hu and X.-F. Wang, Chem. Eng. J., 2023, 453, 139963 CrossRef CAS.
- Y. Tian, Y. An, C. Wei, B. Xi, S. Xiong, J. Feng and Y. Qian, ACS Nano, 2019, 13, 11676–11685 CrossRef CAS PubMed.
- Q. Yang, Y. Guo, B. Yan, C. Wang, Z. Liu, Z. Huang, Y. Wang, Y. Li, H. Li, L. Song, J. Fan and C. Zhi, Adv. Mater., 2020, 32(25), 2001755 CrossRef CAS PubMed.
- Y. Tian, Y. An, C. Liu, S. Xiong, J. Feng and Y. Qian, Energy Storage Mater., 2021, 41, 343–353 CrossRef.
- Y. An, Y. Tian, C. Liu, S. Xiong, J. Feng and Y. Qian, ACS Nano, 2021, 15, 15259–15273 CrossRef CAS PubMed.
- P. Liu, Z. Zhang, R. Hao, Y. Huang, W. Liu, Y. Tan, P. Li, J. Yan and K. Liu, Chem. Eng. J., 2021, 403, 126425 CrossRef CAS.
- M. Qiu, H. Jia, C. Lan, H. Liu and S. Fu, Energy Storage Mater., 2022, 45, 1175–1182 CrossRef.
- Y. Tian, Y. An, Y. Yang and B. Xu, Energy Storage Mater., 2022, 49, 122–134 CrossRef.
- L. Tan, C. Wei, Y. Zhang, Y. An, S. Xiong and J. Feng, Chem. Eng. J., 2022, 431, 134277 CrossRef CAS.
- Y. Zhang, Z. Cao, S. Liu, Z. Du, Y. Cui, J. Gu, Y. Shi, B. Li and S. Yang, Adv. Energy Mater., 2022, 12(13), 2103979 CrossRef CAS.
- J. Zhou, M. Xie, F. Wu, Y. Mei, Y. Hao, L. Li and R. Chen, Adv. Mater., 2022, 34(1), 2106897 CrossRef CAS PubMed.
- H. Jia, M. Qiu, C. Tang, H. Liu, S. Fu and X. Zhang, EcoMat, 2022, 4(3), e12190 CrossRef CAS.
- Q. Song, J. Liang, S. Liu, Y. Zhang, J. Zhu and C. Zhu, Nano Res., 2023, 16, 403–410 CrossRef CAS.
- X. Liu, K. Wang, Y. Liu, F. Zhao, J. He, H. Wu, J. Wu, H. Liang and C. Huang, Carbon Energy, 2023, 5(11), e343 CrossRef CAS.
- Y. Zhang, C. Peng, Z. Zeng, X. Zhang, L. Zhang, Y. Ma and Z. Wang, ACS Appl. Mater. Interfaces, 2022, 14, 10419–10427 CrossRef CAS PubMed.
- H. Liu, J.-G. Wang, W. Hua, L. Ren, H. Sun, Z. Hou, Y. Huyan, Y. Cao, C. Wei and F. Kang, Energy Environ. Sci., 2022, 15, 1872–1881 RSC.
- H. J. Kim, S. Kim, K. Heo, J. Lim, H. Yashiro and S. Myung, Adv. Energy Mater., 2023, 13(2), 2203189 CrossRef CAS.
- J. Li, Z. Zheng, Z. Yu, F. She, L. Lai, J. Prabowo, W. Lv, L. Wei and Y. Chen, J. Mater. Chem. A, 2023, 11, 3051–3059 RSC.
- H. He, H. Qin, F. Shen, N. Hu and J. Liu, Chem. Commun., 2021, 57, 11477–11480 RSC.
- L. Ma, M. A. Schroeder, T. P. Pollard, O. Borodin, M. S. Ding, R. Sun, L. Cao, J. Ho, D. R. Baker, C. Wang and K. Xu, Energy Environ. Mater., 2020, 3, 516–521 CrossRef CAS.
- L. Ma, M. A. Schroeder, O. Borodin, T. P. Pollard, M. S. Ding, C. Wang and K. Xu, Nat. Energy, 2020, 5, 743–749 CrossRef CAS.
- B. D. Adams, J. Zheng, X. Ren, W. Xu and J. Zhang, Adv. Energy Mater., 2018, 8(7), 1702097 CrossRef.
- R. D. Rauh and S. B. Brummer, Electrochim. Acta, 1977, 22, 75–83 CrossRef CAS.
- D. Aurbach, O. Youngman, Y. Gofer and A. Meitav, Electrochim. Acta, 1990, 35, 625–638 CrossRef CAS.
- Z. Wu, Y. Li and J. Liu, Small Methods, 2024, 8(1), 2300660 CrossRef CAS PubMed.
- G. Wu, Y. Yang, R. Zhu, W. Yang, H. Yang and H. Zhou, Energy Environ. Sci., 2023, 16, 4320–4325 RSC.
- T. Xue, W. C. Cooper, R. Pascual and S. Saimoto, J. Appl. Electrochem., 1991, 21, 231–237 CrossRef CAS.
- K. Y. Kwon, T. H. Jo, J. S. Kim, F. Hasan and H. D. Yoo, ACS Appl. Mater. Interfaces, 2020, 12, 42612–42621 CrossRef CAS PubMed.
- H. Lee, S. Chen, X. Ren, A. Martinez, V. Shutthanandan, M. Vijayakumar, K. S. Han, Q. Li, J. Liu, W. Xu and J. Zhang, ChemSusChem, 2018, 11, 3821–3828 CrossRef CAS PubMed.
- M. S. Chae, J. W. Heo, S. C. Lim and S. T. Hong, Inorg. Chem., 2016, 55, 3294–3301 CrossRef CAS PubMed.
- B. K. Thomas and D. J. Fray, J. Appl. Electrochem., 1981, 11, 677–683 CrossRef CAS.
- C. Jiang, H. Huang, Q. Ji, J. Li, B. Chen, Y. He and Z. Guo, J. Solid State Electrochem., 2022, 26, 1455–1467 CrossRef CAS.
- H. Glatz, E. Tervoort and D. Kundu, ACS Appl. Mater. Interfaces, 2020, 12, 3522–3530 CrossRef CAS PubMed.
- H. Liu, Y. Zhang, C. Wang, J. N. Glazer, Z. Shan and N. Liu, ACS Appl. Mater. Interfaces, 2021, 13, 32930–32936 CrossRef CAS PubMed.
- H. Yang, Y. Yang, W. Yang, G. Wu and R. Zhu, Energy Environ. Sci., 2024, 17, 1975–1983 RSC.
- Y. Yang, H. Yang, R. Zhu and H. Zhou, Energy Environ. Sci., 2023, 16, 2723–2731 RSC.
- K. Xu, J. Power Sources, 2023, 559, 232652 CrossRef CAS.
- J. T. Hinatsu, V. D. Tran and F. R. Foulkes, J. Appl. Electrochem., 1992, 22, 215–223 CrossRef CAS.
- H. J. S. Sand, London, Edinburgh Dublin Philos. Mag. J. Sci., 1901, 1, 45–79 CrossRef CAS.
- Z. Cai, J. Wang, Z. Lu, R. Zhan, Y. Ou, L. Wang, M. Dahbi, J. Alami, J. Lu, K. Amine and Y. Sun, Angew. Chem., Int. Ed., 2022, 61(14), e202116560 CrossRef CAS PubMed.
- P. Bai, J. Li, F. R. Brushett and M. Z. Bazant, Energy Environ. Sci., 2016, 9, 3221–3229 RSC.
- S. Trasatti, J. Electroanal. Chem. Interfacial Electrochem., 1972, 39, 163–184 CrossRef CAS.
- Y. Cui, R. Cao, J. Du, Z. Zhuang, Z. Xie, Q. Wang, D. Bao, W. Liu, Y. Zhu and G. Huang, Chem. Commun., 2023, 59, 2437–2440 RSC.
- H. Saboorian-Jooybari and Z. Chen, Results Phys., 2019, 15, 102501 CrossRef.
- M. Haataja, D. J. Srolovitz and A. B. Bocarsly, J. Electrochem. Soc., 2003, 150, C708 CrossRef CAS.
- M. Haataja and D. J. Srolovitz, Phys. Rev. Lett., 2002, 89, 215509 CrossRef PubMed.
- N. Sorour, W. Zhang, E. Ghali and G. Houlachi, Hydrometallurgy, 2017, 171, 320–332 CrossRef CAS.
- R. Sato, J. Electrochem. Soc., 1959, 106, 206 CrossRef CAS.
- D. J. Robinson and T. J. O’keefe, J. Appl. Electrochem., 1976, 6, 1–7 CrossRef CAS.
- J. W. Diggle and A. Damjanovic, J. Electrochem. Soc., 1972, 119, 1649 CrossRef CAS.
- D. J. Mackinnon, J. M. Brannen and R. C. Kerby, J. Appl. Electrochem., 1979, 9, 55–70 CrossRef CAS.
- M. Karavasteva, Hydrometallurgy, 1994, 35, 391–396 CrossRef CAS.
- B. C. Tripathy, S. C. Das, P. Singh, G. T. Hefter and V. N. Misra, J. Electroanal. Chem., 2004, 565, 49–56 CrossRef CAS.
- A. Y. Hosny, Hydrometallurgy, 1993, 32, 261–269 CrossRef CAS.
- L. Oniciu and L. Mureşan, J. Appl. Electrochem., 1991, 21, 565–574 CrossRef CAS.
- Q. B. Zhang, Y. X. Hua, T. G. Dong and D. G. Zhou, J. Appl. Electrochem., 2009, 39, 1207–1216 CrossRef CAS.
- Q. Zhang and Y. Hua, J. Appl. Electrochem., 2009, 39, 1185–1192 CrossRef CAS.
- N. Sorour, W. Zhang, G. Gabra, E. Ghali and G. Houlachi, Hydrometallurgy, 2015, 157, 261–269 CrossRef CAS.
- J. Zheng, Q. Zhao, T. Tang, J. Yin, C. D. Quilty, G. D. Renderos, X. Liu, Y. Deng, L. Wang, D. C. Bock, C. Jaye, D. Zhang, E. S. Takeuchi, K. J. Takeuchi, A. C. Marschilok and L. A. Archer, Science, 2019, 366, 645–648 CrossRef CAS PubMed.
- Y. Zhu, Y. Cui, Z. Xie, Z. Zhuang, G. Huang and X. Zhang, Nat. Rev. Chem., 2022, 6, 505–517 CrossRef CAS PubMed.
- C. M. Blevins, J. Power Sources, 1981, 7, 121–132 CrossRef.
- G. L. Holleck, J. Electrochem. Soc., 1972, 119, 1158 CrossRef CAS.
- J. T. Kim and J. Jorné, J. Electrochem. Soc., 1977, 124, 1473–1477 CrossRef CAS.
- J. G. Hooley, Carbon, 1970, 8, 333–339 CrossRef CAS.
- H. Selig and L. B. Ebert, Adv. Inorg. Chem. Radiochem., 1980, 23, 281–327 CrossRef CAS.
- M. Armand and P. Touzain, Mater. Sci. Eng., 1977, 31, 319–329 CrossRef CAS.
- I. Harris, Nature, 1943, 151, 309 CrossRef CAS.
- L. Pauling and R. E. Marsh, Proc. Natl. Acad. Sci. U. S. A., 1952, 38, 112–118 CrossRef CAS PubMed.
- A. T. Bozzo, C. Hsiao-Sheng, J. R. Kass and A. J. Barduhn, Desalination, 1975, 16, 303–320 CrossRef CAS.
- Y. V. Tolmachev, J. Electrochem. Soc., 2023, 170, 030505 CrossRef CAS.
- A. Khor, P. Leung, M. R. Mohamed, C. Flox, Q. Xu, L. An, R. G. A. Wills, J. R. Morante and A. A. Shah, Mater. Today Energy, 2018, 8, 80–108 CrossRef.
- A. Mahmood, Z. Zheng and Y. Chen, Adv. Sci., 2024, 11(3), 2305561 CrossRef CAS PubMed.
- H. Chen, T. N. Cong, W. Yang, C. Tan, Y. Li and Y. Ding, Prog. Nat. Sci., 2009, 19, 291–312 CrossRef CAS.
- H. S. Lim, A. M. Lackner and R. C. Knechtli, J. Electrochem. Soc., 1977, 124, 1154–1157 CrossRef CAS.
- D. R. Martin, J. Chem. Educ., 1948, 25, 495 CrossRef CAS.
- Y. Zou, T. Liu, Q. Du, Y. Li, H. Yi, X. Zhou, Z. Li, L. Gao, L. Zhang and X. Liang, Nat. Commun., 2021, 12, 170 CrossRef CAS PubMed.
- P. H. Svensson and L. Kloo, Chem. Rev., 2003, 103, 1649–1684 CrossRef CAS PubMed.
- H. A. Liebhafsky, J. Am. Chem. Soc., 1934, 56, 1500–1505 CrossRef CAS.
- J. Noack, N. Roznyatovskaya, T. Herr and P. Fischer, Angew. Chem., Int. Ed., 2015, 54, 9776–9809 CrossRef CAS PubMed.
- K. J. Cathro, K. Cedzynska, D. C. Constable and P. M. Hoobin, J. Power Sources, 1986, 18, 349–370 CrossRef CAS.
- P. Singh, K. White and A. J. Parker, J. Power Sources, 1983, 10, 309–318 CrossRef CAS.
- K. J. Cathro, J. Power Sources, 1988, 23, 365–383 CrossRef CAS.
- M. Mastragostino and S. Valcher, Electrochim. Acta, 1983, 28, 501–505 CrossRef CAS.
- P. M. Hoobin, K. J. Cathro and J. O. Niere, J. Appl. Electrochem., 1989, 19, 943–945 CrossRef CAS.
- D. Zhang, Q. Liu, X. Shi and Y. Li, J. Power Sources, 2012, 203, 201–205 CrossRef CAS.
- D. Bryans, B. G. McMillan, M. Spicer, A. Wark and L. Berlouis, J. Electrochem. Soc., 2017, 164, A3342–A3348 CrossRef CAS.
- G. Choi, P. Sullivan, X.-L. Lv, W. Li, K. Lee, H. Kong, S. Gessler, J. R. Schmidt and D. Feng, Nature, 2024, 635, 89–95 CrossRef CAS PubMed.
- Y. Zeng, Z. Lai, Y. Han, H. Zhang, S. Xie and X. Lu, Adv. Mater., 2018, 30(33), 1802396 CrossRef PubMed.
- L. Ma, S. Chen, H. Li, Z. Ruan, Z. Tang, Z. Liu, Z. Wang, Y. Huang, Z. Pei, J. A. Zapien and C. Zhi, Energy Environ. Sci., 2018, 11, 2521–2530 RSC.
- Z. Zhao, B. Liu, Y. Shen, T. Wu, X. Zang, Y. Zhao, C. Zhong, F. Ma and W. Hu, J. Power Sources, 2021, 510, 230393 CrossRef CAS.
- C. Zhong, B. Liu, J. Ding, X. Liu, Y. Zhong, Y. Li, C. Sun, X. Han, Y. Deng, N. Zhao and W. Hu, Nat. Energy, 2020, 5, 440–449 CrossRef CAS.
- D. Chao, C. Ye, F. Xie, W. Zhou, Q. Zhang, Q. Gu, K. Davey, L. Gu and S. Qiao, Adv. Mater., 2020, 32(25), 2001894 CrossRef CAS PubMed.
- Y. Yu, J. Xie, H. Zhang, R. Qin, X. Liu and X. Lu, Small Science, 2021, 1(4), 2000066 CrossRef CAS.
- D. Boden, C. J. Venuto, D. Wisler and R. B. Wylie, J. Electrochem. Soc., 1967, 114, 415 CrossRef CAS.
- H. Y. Kang and C. C. Liang, J. Electrochem. Soc., 1968, 115, 6 CrossRef CAS.
- Y. Xu, P. Cai, K. Chen, Y. Ding, L. Chen, W. Chen and Z. Wen, Angew. Chem., Int. Ed., 2020, 59, 23593–23597 CrossRef CAS PubMed.
| This journal is © The Royal Society of Chemistry 2025 |