
 Open Access Article
 This Open Access Article is licensed under a
 Creative Commons Attribution 3.0 Unported Licence
Investigation of the structure and dynamics of amorphous calcium carbonate by NMR: stabilization by poly-aspartate and comparison to monohydrocalcite†
Sanjay
Vinod-Kumar
 a,
Albert A.
Smith-Penzel
b,
Venkata SubbaRao
Redrouthu‡
a,
Maxim B.
Gindele§
c,
Denis
Gebauer
c and
Guinevere
Mathies
*a
a,
Albert A.
Smith-Penzel
b,
Venkata SubbaRao
Redrouthu‡
a,
Maxim B.
Gindele§
c,
Denis
Gebauer
c and
Guinevere
Mathies
*a
aDepartment of Chemistry, University of Konstanz, Universitätsstrasse 10, 78464 Konstanz, Germany. E-mail: guinevere.mathies@uni-konstanz.de
bInstitute for Medical Physics and Biophysics, Leipzig University, Härtelstrasse 16-18, 04107 Leipzig, Germany
cInstitute of Inorganic Chemistry, Leibniz University Hannover, Callinstrasse 9, 30167 Hannover, Germany
First published on 6th May 2025
Abstract
Dense amorphous phases are key intermediates in biomineralization pathways. Structural information is required to understand these pathways, but is, as per the amorphous nature, difficult to obtain. We report an investigation of amorphous calcium carbonate (ACC) with magic-angle spinning (MAS) nuclear magnetic resonance (NMR) spectroscopy. Mimicking the use of acidic proteins, we stabilize ACC against crystallization with poly-aspartate (PAsp). Spectra are in agreement with incorporation of PAsp into ACC nanoparticles and show that it forms an α-helix. The pH of the solution, from which PAsp-stabilized ACC is synthesized, affects the 13C chemical shift of carbonate in a way that is identical for additive-free ACC. Generally, we observe that the magnetic properties of the 1H and 13C nuclei in the rigid environment of ACC are similar (though not identical) to those in monohydrocalcite (MHC). This allows us to establish, based on 1H–13C correlation spectra, relaxation properties, and spin dynamics simulations, that the structural water molecules in ACC undergo 180° flips on a millisecond time scale.
Introduction
In the late 1990s, Beniash et al. showed that newly formed spicules of sea urchin larvae are largely composed of amorphous calcium carbonate (ACC).1,2 As spicules age, unstable, disordered ACC is converted into stable, crystalline calcite via solid-state transformation. Since then, it has become clear that invertebrates commonly use ACC as a transient precursor phase in the production of mineralized tissues of calcium carbonate.3–5 By analogy, vertebrates use amorphous calcium phosphate as a precursor to form crystalline carbonated hydroxyapatite for bones and teeth.6,7 Even the magnetite in the teeth chitons (marine mollusks) is produced via a disordered form of iron hydroxide.8 An important reason for the widespread occurrence of amorphous phases in biomineralization is that they are condensed, yet flexible precursors that are conveniently manipulated into a final functional form.3 The strategy may have evolved from the necessity to avoid mineral deposition where it is not needed. Nucleation-inhibiting species make it possible to reach high degrees of supersaturation and molecular crowding, which favor the formation of amorphous phases.9Taking inspiration from biology, amorphous intermediates are gaining traction in materials engineering as a way to control the shape and properties of resulting crystalline materials and composites. This highlights the importance of understanding the structure of ACC as well as other dense amorphous phases. As these phases are not described by a unit cell and, consequently, do not diffract X-rays constructively, this necessitates the use of alternative methods of structural investigation with far less established workflows. Hence, there is, to date, no comprehensive structural model for ACC.
There are, however, several things we do know. ACC contains water and calcium carbonate in an approximately 1![[thin space (1/6-em)]](https://www.rsc.org/images/entities/char_2009.gif) :1 ratio and this water is critical to the thermodynamic and kinetic stabilities as well as the rapid growth of ACC nanoparticles.10 Extended X-ray absorption fine structure (EXAFS) analysis has shown that there is a short-range order around the calcium ions.11 This order can resemble that of monohydrocalcite (MHC),12 a crystalline form13,14 of calcium carbonate with the same stoichiometry. Infrared spectra of ACC also bear a striking resemblance to those of MHC, most notably the presence of a second peak in the carbonate asymmetric stretch region.3 Finally, (ab initio) molecular dynamics simulations have provided plausible structures,15–19 which are in agreement with the pair-distribution functions of ACC from X-ray20,21 and neutron22 total scattering. Unfortunately, these structures have so far not converged on, for example, the Ca coordination number, reflecting that matching to an experimental pair-distribution function is a necessary, but not sufficient condition for validating a structural model.23 Intriguingly, though, analysis of a recent model obtained in this way revealed that the potential for the effective Ca⋯Ca interaction has a double well, offering a possible explanation for the complex, soft-matter-like behavior of ACC.24
:1 ratio and this water is critical to the thermodynamic and kinetic stabilities as well as the rapid growth of ACC nanoparticles.10 Extended X-ray absorption fine structure (EXAFS) analysis has shown that there is a short-range order around the calcium ions.11 This order can resemble that of monohydrocalcite (MHC),12 a crystalline form13,14 of calcium carbonate with the same stoichiometry. Infrared spectra of ACC also bear a striking resemblance to those of MHC, most notably the presence of a second peak in the carbonate asymmetric stretch region.3 Finally, (ab initio) molecular dynamics simulations have provided plausible structures,15–19 which are in agreement with the pair-distribution functions of ACC from X-ray20,21 and neutron22 total scattering. Unfortunately, these structures have so far not converged on, for example, the Ca coordination number, reflecting that matching to an experimental pair-distribution function is a necessary, but not sufficient condition for validating a structural model.23 Intriguingly, though, analysis of a recent model obtained in this way revealed that the potential for the effective Ca⋯Ca interaction has a double well, offering a possible explanation for the complex, soft-matter-like behavior of ACC.24
We were recently able to contribute to the structural modelling of ACC using a combination of experimental methods.25 First, we showed, with magic-angle spinning (MAS) NMR spectroscopy, the presence of two chemical environments. The first environment consists of rigid (but amorphous) calcium carbonate with embedded structural water molecules, which undergo restricted, anisotropic motion. The second environment consists of water molecules undergoing slow, isotropic motion and dissolved hydroxide ions. Second, we showed, with conductive atomic force microscopy, that ACC nanoparticles conduct electricity. Since solid salts are insulators, the only way to reconcile the observations by the two methods is by assuming that the mobile water molecules form a network that pervades the bulk of ACC, with the hydroxide ions carrying the charge.
We proposed that the networked structure of ACC arises from a colloidal pathway of formation, starting with pre-nucleation clusters in solution.25 Pre-nucleation clusters are dynamic, but thermodynamically stable assemblies of cations and anions held together by ionic interactions.26 Their existence was first indicated by potentiometric titration experiments on carbonate buffer,27 but the phenomenon is general and has also been observed for calcium phosphates, iron(oxy)(hydr)oxides, silica, and amino acids.28 Prenucleation clusters in solution can undergo phase separation to form dense liquid nanodroplets, which are lean in solute.29–31 During the formation of ACC, these dense liquid nanoparticles aggregate, dehydrate, and eventually give rise to the rigid environment. The mobile environment remains from imperfect coalescence during dehydration towards solid ACC.25
Important information about the rigid environment of ACC was obtained by comparison of 1H MAS NMR spectra of ACC to those of MHC, the former indirectly detected via the dipolar coupling to 13C, the latter directly detected.25 Cross terms between the chemical shift anisotropies (CSAs) and the dipolar coupling between the two 1Hs of the structural water molecules of MHC produce an unusual pattern of spinning sidebands consisting of two interleaved manifolds.32 Numerical simulation of the spin dynamics during the MAS NMR experiment readily reproduced this pattern when we used the magnetic properties of MHC to specify the spin system; these properties had been computed beforehand with density functional theory and the GIPAW method. The indirectly detected 1H spectra of ACC resembled the spectra of MHC, but showed only one manifold of spinning sidebands. We hypothesized that rapidly swapping the 1Hs of the structural water molecules in the spin dynamics simulations would remove the orientational inequivalence and merge the two manifolds of spinning sidebands into one. This turned out to be the case; these simulations matched well with the indirectly detected 1H spectra of ACC. We concluded that the chemical environment of the structural water molecules in ACC and MHC is similar, but that in ACC, unlike in MHC, these water molecules undergo anisotropic motion, likely 180° flips.
In this article, we report further investigations into the structure and dynamics of primarily the rigid environment of ACC, again using MAS NMR. We start by characterizing ACC that has been stabilized against crystallization by poly-aspartate (PAsp), mimicking the use of acidic proteins in vivo.33 The synthesis procedure relies on a titration of CaCl2 solution into a carbonate buffer, which contains PAsp. ACC is subsequently obtained through an ethanol quench. The titration makes it possible to finely control conditions such as pH before nucleation and, in this way, synthesize ACCs with so-called proto-crystalline structures. Previously proto-calcite, proto-vaterite,34 and even proto-aragonite35 ACCs showed small, but significant differences in the isotropic chemical shifts of 13C-carbonate, characteristic features in infrared and EXAFS spectra, and distinct solubilities.27 We find here that the 13C isotropic chemical shifts of PAsp-stabilized proto-calcite and proto-vaterite are in perfect agreement with the literature values for their additive-free counterparts and measure, in addition, the chemical shift anisotropies. MAS NMR spectra furthermore show that PAsp is incorporated into ACC nanoparticles, in accordance with the proposed mechanism of stabilization,25 and that its secondary structure is α-helical.
Next, as part of the quest for a structural model for ACC, we explore MHC as a reference system, not only from the point of view of the 1H, but also from the 13C nuclei. First, we check the agreement between the computed and experimental 13C CSA. In passing we confirm the presence of a protective layer of amorphous magnesium carbonate surrounding MHC crystals. Second, using the computed magnetic properties of MHC, we numerically simulate, by accounting for the spin dynamics of homonuclear decoupling explicitly, the 1H–13C correlation spectrum of MHC. When we include 180° flips of the water molecules, this strategy allows us to simulate the 1H–13C correlation spectrum of ACC as well. Finally, from simulation of the 13C relaxation curves in the presence of a spin lock (T1ρ), we firmly establish that the structural water molecules in the rigid environment of ACC undergo 180° flips, on a millisecond time scale.
Materials and methods
Preparation of PAsp-stabilized ACCs
Solutions were prepared using Milli-Q water that was decarbonated by bubbling N2 through the solution overnight. Before use, poly(L-aspartate) sodium salt (Alamanda Polymers, molecular weight = 6800 Da, PD = 1.04) was dissolved and purified twice by diafiltration with a molecular-weight cutoff of 3 kDa.36 PAsp-containing carbonate solutions were prepared from PAsp stock solution to which appropriate amounts of Na2CO3 and NaHCO3 were added. For the preparation of isotopically labelled samples, Na213CO3 and NaH13CO3 (99% 13C, Cambridge Isotope Laboratories) were used. An automated setup by Metrohm was used for all titrations. The calcium potential was monitored using an ion-selective electrode.800 s, the reaction was quenched by pouring the solution into 4.5 L of pure ethanol, again under vigorous stirring. After stirring for 30 min, the solution was left standing for 60 min. The supernatant was decanted and the remaining sediment of PAsp-stabilized proto-calcite ACC was centrifuged at 7000g. The solid sediment was washed twice with pure ethanol, then once with pure acetone, and stored in pure acetone.
000 s, the reaction was quenched by pouring the solution into 2 L of pure ethanol that was stirred in a plastic beaker. The beaker was sealed with parafilm and after stirring for 30 min, the stirrer was removed and the beaker was resealed. The beaker was left standing for 60 min before the supernatant was slowly decanted. The remaining sediment of PAsp-stabilized proto-vaterite ACC was centrifuged at 6000g for 15 min. The solid sediment was then washed with pure ethanol, followed by another 15-min centrifugation. This procedure was repeated once more with ethanol and once with pure acetone. Storage was in pure acetone.
To quantify the incorporation of PAsp into ACC, thermogravimetric analysis (TGA) was used. TGA is normally an accurate method to assess the organic content of minerals, but complications arise in our samples because polymer and bicarbonate decomposition overlap. Carboxylate groups bound to calcium form CaCO3 upon decomposition, so even if an oxidative atmosphere is used, it is not certain that all organic species will have decomposed at 400 °C. Nevertheless, PAsp contents were estimated to range from 10 to 20%. To verify this percentage, MAS NMR spectra were obtained through direction excitation of the 13C nuclei. Signal intensities of the carbonate and the Cα of PAsp were compared, after correction for the slow longitudinal relaxation of 13C-carbonate. In this way, Asp contents up to 15% (m/m) were obtained.
To prepare for MAS NMR experiments, ACCs were isolated from the acetone dispersion by centrifugation at 6000g and dried at 40 °C in a vacuum for 1 h. After drying, the ACC powders were packed into 4 mm rotors. Packed (but still open) rotors were again dried for 30 min at 40 °C in a vacuum, followed by closing with a ZrO2 cap. For shipment, rotors containing ACC samples were placed in an Eppendorf tube, which was flushed with N2, sealed with parafilm and itself placed in a Falcon tube, which was also sealed with parafilm in N2 atmosphere. Rotors were only taken out of their packaging immediately before insertion into the MAS NMR probe, which had already been flushed and brought to the appropriate temperature with N2 gas. We note that pure ACC readily crystallizes in the rotor due to the centrifugal forces imposed by MAS. PAsp, however, stabilizes ACC effectively: our samples remain amorphous during prolonged spinning and storage for many months (see ESI,† and Fig. S1).
Preparation of microcrystalline monohydrocalcite
The formation of monohydrocalcite (MHC) requires magnesium in the solution. Nishiyama et al. have explored the effect of varying starting concentrations of calcium, magnesium and carbonate on the incorporation of magnesium into the final crystals.37 We follow their protocol aiming to restrict the Mg/Ca ratio in the crystals to a few percent. 50 mL of a solution of 0.077 M Na2CO3 was slowly poured into 250 mL of a stirred solution of 0.052 M CaCl2·2H2O and 0.010 M MgCl2·6H2O. The solution was stirred at 25 °C for 24 h. The product was isolated by centrifugation and washed two times with Milli-Q water and once with pure ethanol. The product was vacuum-dried at 40 °C overnight, yielding a white solid.By inductively coupled plasma optical emission spectroscopy (ICP-OES) a Mg/Ca ratio of 2.8% was determined. Magnesium is present, at least in part, as amorphous magnesium carbonate.38 A small exothermic event in differential scanning calorimetry (DCS) likely corresponds to its crystallization.25,39 Scanning electron microscopy (SEM) showed a mixture of spherical particles with diameters up to 5 μm and smaller-sized anisotropic (elongated) particles.25 Prior to rotor packing, the MHC was dried at 40 °C in vacuum for 1 h and finely ground. After packing, the sample in the still open rotor was dried at 40 °C in vacuum for 20 min to remove adsorbed water and closed with a ZrO2 cap.
PAsp sodium salt; preparation of PAsp calcium salt
PAsp sodium salt was investigated by MAS NMR without further purification. PAsp calcium salt was prepared as follows. 76.0 mg of PAsp sodium salt was dissolved in 40 mL of Milli-Q water. 7.5 mL of 1.0 M CaCl2 solution was slowly added to the stirred polymer solution, while the pH was monitored using an electrode (a drop from 9.5 to 8.2 was observed). The pH was then adjusted to 10.0 by slow addition of 0.1 M NaOH solution. After stirring for 5 min, the solution was added dropwise to 250 mL of a 1:1 (v:v) solution of absolute ethanol and acetone, which was stirred in a glass beaker for 10 min. A cloudy, white sediment could then be isolated by centrifugation at 7000g for 15 min. The obtained white sediment was resuspended in 100 mL pure ethanol and centrifuged again; this was repeated once. The final product was dried at 40 °C in a vacuum for 60 min. ICP-OES showed 0.38 Ca2+ per carboxylate and no significant amounts of Na+ (as opposed to 0.65 Na+ per carboxylate prior to ion exchange).
MAS NMR experiments
Magic-angle spinning (MAS) nuclear magnetic resonance (NMR) experiments were performed on a Bruker Avance III 400 MHz spectrometer (9.4 T) equipped with a wide-bore magnet and a 4 mm MAS HX probe. The sample temperature was maintained at 293 K. Chemical shifts were referenced to TMS using adamantane as an indirect reference.536 scans were recorded with a recycle delay of 3 s. For MHC, an acquisition time of 50 ms was used, with a dwell time of 12.13 μs. 51892 scans were recorded with a recycle delay of 3 s.
For experiments at a spinning frequency at 2 kHz, the RF power level was again 75 W (48 kHz) on the 13C channel. A 70–100% ramp up to 70 W (64 kHz) was applied on the 1H channel to match the Hartmann–Hahn condition. For the ACCs, an acquisition time of 6 ms was used, with a dwell time of 12.13 μs. 25600 scans were recorded with a recycle delay of 3 s. For MHC, an acquisition time of 50 ms was used, with a dwell time of 12.13 μs. 12800 scans were recorded with a recycle delay of 4.4 s.
Trials with a sample of microcrystalline, natural abundance α-glycine (see ESI,† and Fig. S4) showed that center-packing of the rotor and a higher 1H Rabi frequency improves the resolution in the indirect dimension.45 Hence, FSLG HETCOR spectra of MHC and of 10% and 100% 13C-carbonate PAsp-stabilized disACC were measured with reduced-volume (15 μL) rotors and with a 1H Rabi frequency of 100 kHz. The other parameters were adjusted as follows. The evolution time was incremented in 128 steps, for MHC, and in 64 steps, for disACC, of 65.3 μs. The cross-polarization contact time was 3 ms for MHC and 1 ms for disACC. 512 scans were recorded with a recycle delay of 2 s for MHC and 2.5 s for disACC. In the 13C dimension, acquisition times were 50 ms for MHC and 6 ms for disACC, with a dwell time of 12.13 μs. No window functions were applied.
 were measured using the pulse sequence shown in Fig. S2c (ESI†). The 90° pulse of 4 μs (63 kHz), on the 13C channel, is followed by a 90° phase change and a spin-lock pulse of varying length (0.2 to 90 ms). Rabi frequencies (ω1) of 2, 7, 12, 14, and 22 kHz were chosen, while the spinning frequency (ωr) was set to 5 kHz. Thus, care was taken to avoid HORROR (ω1 = ωr/2)46 and rotary resonance (ω1 = nωr, n = ±1, ±2, …)47 conditions. After the spin-lock pulse, the acquisition time was 8 ms, the dwell time was 12.13 μs, and 8 scans were recorded with a recycle delay of 1.26 times the T1 of 13C (170 s). The 13C NMR signal intensities were obtained by integrating the spectra from 164 to 174 ppm and plotted against the length of the spin-lock pulse.
Numerical simulations and analysis of the spectra
Following the Haeberlen convention, the anisotropy, ζ, and the asymmetry parameter, η, are defined as
 | (1) |
| |δZZ − δiso| > |δXX − δiso| > |δYY − δiso| | (2) |
 | (3) |
 | (4) |
 | (5) |
 | (6) |
Parameters were chosen as in the experiments with the exception of the cross-polarization contact time, which was 1 ms for both MHC and ACC. Apodization was used to emulate experimental line shapes. For MHC, the evolution time was incremented in 128 steps and an exponential window function (e−6x) was applied. For ACC, the evolution time was incremented in 64 steps and a Gaussian window function (e−19x2) was applied. In the 13C dimension, acquisition times were 36.8 ms for MHC and 25.6 ms for ACC with a dwell time of 400 μs. Gaussian window functions, e−3x2 and e−240x2, were applied for MHC and ACC, respectively.
 | (8) |
The magic-angle spinning frequency was 5 kHz, as in the experiments. 500 time points were simulated, one per rotor period, resulting in 100 ms of acquisition time. Powder averaging was done following Cheng et al., using 49 sets of angles.60 Calculations which considered a 13C spin coupled to two 1H spins were readily run on a workstation. Calculations which considered a 13C spin coupled to four 1H spins were performed on the Scientific Compute Cluster (SCC) of the University of Konstanz.
 | (9) |
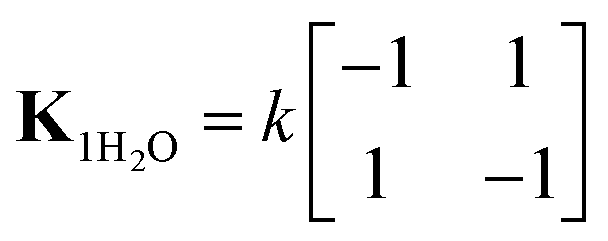
When two water molecules are considered, the exchange matrix is given by
 | (10) |
Thus, the two water molecules flip at equal rates, but simultaneous flips of both water molecules are deemed unlikely and these rates are set to zero. To simulate the 1H–13C correlation spectrum of ACC, the model was implemented using the chemical kinetics module of Spinach. Exchange takes place between two (for one water molecule) or four spin systems (for two water molecules), in which the two 1Hs have swapped positions. For simulation of the 13C T1ρ curves, in SLEEPY, exchange takes place between two 1H spins (for one water molecule) or between pairs of 1H spins on the same water molecule (for two water molecules). An exchange term was added to the Liouvillian for each water molecule.
Results and discussion
Fig. 1a shows the 1H–13C cross-polarization spectra of the three PAsp-stabilized ACCs: disordered (pH 9.8, with CaCl2 solution added at a high pace), proto-calcite (pH 9.0), and proto-vaterite (pH 9.8). The spectra are dominated by the strong signal from carbonate around 169 ppm. The α and β carbons (Cα and Cβ) of Asp are observed at 52.6 and 38.7 ppm; the γ and backbone carbons (Cγ and CO) are not separately resolved, but are observed as a foot on the low-field side of the carbonate peak, between 178 and 173 ppm. The small foot on the high-field side of the carbonate peak is due to bicarbonate.25,50,61 Fitting Gaussian functions to the carbonate signals of the three ACCs (Fig. 1b) yields the following chemical shifts and linewidths (at half maximum): 168.9 and 3.5 ppm for disACC, 168.6 and 3.4 ppm for pcACC, and 169.5 and 3.4 ppm for pvACC. These values are in perfect agreement with the literature for additive-free disordered,62 proto-calcite, and proto-vaterite34 ACCs. We return to this observation in a moment. | ||
| Fig. 1 1H–13C cross-polarization spectra of PAsp-stabilized natural abundance disordered ACC (disACC, green), proto-calcite ACC (pcACC, violet), and proto-vaterite ACC (pvACC, magenta). The spinning frequency was 10 kHz. (a) Spectra scaled at the amplitude of the signal from carbonate. The inset shows a zoom of the aliphatic region, with the spectra scaled at the amplitude of the Cα-signal of PAsp. The * indicates a spinning sideband of carbonate. (b) Zoom of the carbonyl region showing the shifts of the carbonate signals. | ||
In search of information about the interaction of PAsp with ACC, we recorded 1H–13C correlation spectra of PAsp sodium salt, of PAsp calcium, and of PAsp-stabilized disordered ACC (Fig. 2a–c). In the aliphatic regions, strong cross-peaks are observed from 1-bond contacts of the Cα and Cβ with their own protons. Weaker cross-peaks are observed from 2-bond contacts and also contacts with the amine protons are discernible from the noise. As noted by us before from 1-dimensional 1H–13C cross-polarization spectra,25 the Cβ chemical shift changes (to 38.7 ppm) upon incorporation into ACC from 39.5 ppm for PAsp sodium salt and 39.3 ppm for PAsp calcium salt, but the Cα is not affected at all (at 52.6 ppm). We did not previously realize that this implies that the main chain of PAsp is α-helical when interacting with ACC. Chemical shifts and local structure are strongly correlated and, in protein NMR, the Cα, CO, and to some extent Cβ, chemical shifts are reliable indicators of secondary structure. It is not evident that reference chemical shift values from biomolecular systems can be applied to PAsp in an inorganic environment, but fortunately a more closely related reference system is available. Poly-β-benzyl-L-aspartate forms right-handed α-helices, left-handed α-helices, ω-helices, or β-strands depending on the condition of crystallization. All four polymorphs were investigated by MAS NMR early on in ref. 63 and the chemical shifts of Cα and Cβ were subsequently used by Wang et al. to show that the main chain of PAsp sodium salt forms a right-handed α-helix.64 The Cα chemical shift observed by Wang et al., 52.4 ppm, is within experimental error the same as in our measurements, 52.6 ppm. Since we find the same value for PAsp calcium salt and PAsp-stabilized ACC, we infer that PAsp is α-helical in all three samples.
 | ||
| Fig. 2 (a) 1H–13C correlation spectra of (a) PAsp sodium salt, (b) PAsp calcium salt, and (c) PAsp-stabilized disordered ACC. The spinning frequency was 10 kHz. Frequency-switched Lee–Goldburg 1H–1H decoupling was applied during evolution. Assignments of resolved cross-peaks are indicated. | ||
The carbonyl region of the 1H–13C correlation spectrum of PAsp sodium salt (Fig. 2a), shows four well-defined cross-peaks. A Cγ resonance typically occurs down-field of a CO,65 which, interestingly, implies that the two strongest cross-peaks do not arise from dipolar contacts with the closest protons within each Asp residue, see the assignments in Fig. 2a. The unavoidable conclusion is that these cross-peaks arise from inter-residue contacts instead. This in turn implies that the bulk of PAsp sodium salt consists of parallel α-helices of PAsp. From the helices, the sidechains point out and coordinate to the sodium ions in a repeating pattern. Such a regular structure of PAsp sodium salt is supported by the observation of Wang et al. that strong ionic interactions between COO− and Na+ restrict the dynamics of the sidechains.66
Exchange of sodium with calcium distorts the ordering of the side chains, as it now takes two, possibly neighbouring,67 negatively charged carboxylate groups to neutralize one Ca2+ ion. This explains the loss of resolution in the carbonyl region of the spectrum of PAsp calcium salt (Fig. 2b). The poor resolution in this area is maintained in the spectrum of PAsp-stabilized ACC (Fig. 2c), which now also shows a strong cross-peak from carbonate and water. We observe that the base of this cross-peak is remarkably broad along the 1H dimension (Fig. S6, ESI†), extending from 0 to 10 ppm. This chemical shift range is beyond what we expect for structural water molecules and, hence, we strongly suspect contributions from contacts of the β- and amine-protons of PAsp with carbonate. The presence of these contacts provides evidence that PAsp is, at least partially, incorporated in the ACC nanoparticles.
PAsp is well-known to delay nucleation and likely does so by facilitating entrapment of bicarbonate into the dense liquid nanodroplets.25 During dehydration and solidification towards ACC, this bicarbonate reacts to a large extent with hydroxide ions to form carbonate and water, creating locally calcium deficient sites. In this way, PAsp induces a stoichiometric mismatch, which we postulated stabilizes ACC against crystallization.25 This mechanism of stabilization is in agreement with the incorporation of PAsp into the ACC nanoparticles, as observed in the 1H–13C correlation spectrum (Fig. 2c). However, local organic–inorganic interactions likely play a role as well. Though the pH of the solution imposes slight changes in the arrangement of the carbonate ions in ACC, the presence of PAsp does not, or else we would have observed a change in the 13C chemical shifts of the PAsp-stabilized proto-structured ACCs compared to their additive-free forms. Instead, we suspect that PAsp primarily interacts with ACC via the calcium ions, which of course makes sense given their positive charges. Weiner et al. noted that a chain of Asp residues in a β-strand conformation provides a regular spacing of the carboxylate groups (CγOO−) that complements the ordering of the calcium and oxygen atoms on, for example, the {001} face of calcite.33,68 Oriented calcite nucleation by acidic proteins has been shown to follow from this property. Conversely, the presence of PAsp inside the ACC nanoparticles in the form of an α-helix may help to preserve disorder.
To explore if proto-structured ACCs also differ in terms of the CSA of 13C-carbonate, we measured 1H–13C cross-polarization spectra at a spinning frequency of 2 kHz. Fig. 3a shows these spectra for disordered, proto-calcite, and proto-vaterite ACC. Following the fitting procedure described in the Materials and methods section, we extracted the isotropic chemical shift (δiso), the anisotropy (ζ), and the asymmetry parameter (η) for all three, see Table 1. In Fig. 3b, the experimental spectrum of disACC is plotted together with the simulation based on the extracted parameters. Fig. 3c is a map of the minimum. Corresponding figures for pvACC and pcACC are provided in the ESI† (Fig. S7–S9). The CSA parameters of disordered ACC are in good agreement with those reported by Sen et al. for additive-free ACC (note that following the Haeberlen convention, ζ is negative).69 The CSA parameters vary slightly among the three investigated ACCs. The error analysis shows that these variations are barely significant. The CSA parameters of pvACC stand out most, but the minimum is also less deep (Fig. S9c, ESI†). Whatever the structural differences between the proto-structured ACCs are, they must be very small, at least when probed by bulk spectroscopy. We devote some further discussion to this observation at the very end of this section.
 | ||
| Fig. 3 (a) Experimental 1H–13C cross-polarization spectra of PAsp-stabilized natural abundance ACCs. The spinning frequency was 2 kHz. The spinning sidebands from the CO and Cγ of PAsp are marked in grey. (b) Overlay of experiment and simulation with the parameters shown in Table 1, for disACC. (c) Visualization of the dependence of the fitting error on the CSA parameters, again for disACC. The white cross indicates χς,η,min2. The red line (here largely hidden behind the white cross) indicates the covariance ellipse. | ||
| δ iso (ppm) | ζ (ppm) | η | |
|---|---|---|---|
| disACC | 168.8 | −50.2 ± 0.1 | 0.47 ± 0.01 |
| pcACC | 168.6 | −49.8 ± 0.2 | 0.46 ± 0.02 |
| pvACC | 169.5 | −50.9 ± 0.3 | 0.50 ± 0.03 |
| MHC (exp.) | 171.6 | −53.8 ± 0.1 | 0.24 ± 0.02 |
| MHC (calc.) | 171.7 | −51.7 | 0.28 |
The 1H–13C cross-polarization spectrum of MHC, at a spinning frequency of 10 kHz (Fig. 4a), consists of a strong, narrow peak sitting on a broad foot (see Fig. S10 for the 13C direct excitation spectrum, ESI†). Fitting of a Gaussian curve to the peak yields a centre chemical shift of 171.7 ppm and a linewidth of 0.32 ppm (32 Hz). A similar chemical shift was previously observed by Nebel et al. for 13C-carbonate in the bulk of the MHC crystals, although they observed a larger linewidth of 70 Hz.70 The foot was found at a centre chemical shift of 170.7 ppm, with a linewidth of 3.3 ppm. Fukushi et al. performed Mg K-edge X-ray absorption near edge structure (XANES) measurements on MHC with different Mg/Ca ratios. They showed that Mg occurs as amorphous magnesium carbonate, which forms a protective layer, and as a second species, which is likely a Ca2+ → Mn2+ substitution into MHC. Judging from the linewidth, the species responsible for the foot is amorphous. Hence, we assign it to amorphous magnesium carbonate (AMC), even though the chemical shift differs from that of bulk amorphous magnesium carbonate (approximately 166 ppm).71 Interestingly, the two-Gaussian fit leaves signal intensity unaccounted for, particularly around 170.8 ppm. Relaxation filters in combination with 13C-labelling could be used to resolve and further characterize what appear to be more than two carbonate species.
 | ||
| Fig. 4 1H–13C cross polarization spectra of natural abundance MHC at a spinning frequency of (a) 10 kHz and (b) 2 kHz. The relative surface areas of the Gaussian curves fitted to the peak (blue, arising from MHC) and the foot (green, arising from amorphous magnesium carbonate (AMC)) in (a) are 1 and 0.021. (c) Zooms of the spinning sidebands in the 2 kHz spectrum. Black: experiment, red-dashed: numerical simulation with CSA parameters adjusted to best reproduce the experiment, blue: numerical simulation with CSA parameters from the quantum chemical calculation. | ||
The CSA of 13C-carbonate in MHC was determined from the 1H–13C cross polarization spectrum at a spinning frequency of 2 kHz (Fig. 4b). Fig. 4c shows zooms of the spinning sidebands in the experimental spectrum (black) as well as the numerical simulation (red, dashed) with optimized CSA parameters (Table 1). Compared to Sen et al., who analysed an experimental spectrum recorded at a spinning frequency of 4 kHz by Nebel et al. (δiso = 171.1 ppm, ζ = 56.6 ppm, η = 0.02),69,70 we find a smaller magnitude of the anisotropy and a larger asymmetry. The spinning frequency of 4 kHz was likely too fast to properly capture the CSA. For the second numerical simulation, the CSA parameters from the quantum chemical calculation were used (Table 1). The geometry optimization settled on distinct conformations for the three helices in the MHC unit cell and consequently provided three sets of CSA parameters for 13C-carbonate (see the ESI,† Fig. S5 and Table S1). The variation in δiso was about 0.5 ppm (50 Hz), which is beyond the linewidth in the experiment (30 Hz). Thus, the three distinct conformations are not experimentally observed, at least not by 13C NMR. We therefore used the average of the three sets of CSA parameters for the second simulation (blue) in Fig. 4c. Agreement with the experiment is very good.
Historically, 13C NMR on a single crystal of calcite provided the first direct measurement of chemical shift anisotropy.72 In calcite, carbonate takes an ideal geometry of an equilateral triangle with the 13C nucleus at the centroid (D3h symmetry).73 Hence, the CSA tensor is uniaxial and the principal axis corresponding to the unique principal value is perpendicular to the plane of the triangle (δXX = δYY = 194 ppm, δZZ = 119 ppm).74 In MHC, the predicted geometry of carbonate is no longer perfectly planar. Moreover, the bond between the carbon atom and the oxygen atom that does not form a hydrogen bond with water (but only coordinates to the calcium ion) is 1–2 pm shorter than the other two C–O bonds. As a consequence, a non-zero asymmetry parameter is predicted, in agreement with experiment (see Table 1, δXX = 204.6 ppm, δYY = 192.3 ppm, δZZ = 118.2 ppm). In ACC, the asymmetry parameter is larger still (see Table 1, δXX = 205.4 ppm, δYY = 182.4 ppm, δZZ = 118.9 ppm for disordered ACC), mostly due to increased shielding along the y-axis, which, in MHC, is approximately parallel to the short C–O bond. This could suggest that the symmetry of carbonate is further perturbed due to changes in the Ca coordination, but without a detailed structural model for ACC, this is hard to specify further.
Fig. 5a shows the 1H–13C correlation spectrum of MHC. The main cross-peak is observed at (171.7,5.0) ppm, with a shoulder at (171.7,5.9) ppm (see also the blue 1H slice in Fig. 5c). Both features are surprisingly well reproduced in the simulation (Fig. 5b, red 1H slice in Fig. 5c). The simulation considered three 13C nuclei (#2, #4, #9, see the ESI,† and Fig. S5), each with two nearest water molecules (see Table S2, ESI†). A maximum spin correlation level of three was sufficient. We observed no effects from 13C labelling (e.g., line broadening), contrary to the case of α-glycine (see the ESI†), likely because the 13C nuclei are relatively isolated in MHC. Nevertheless, the simulation shown in Fig. 5 is the sum of three separate simulations in which only one of the carbon nuclei was 13C. This allowed us to, before summation, shift spectra along the 13C dimension to match the average CSA parameters of Table 1.
 | ||
| Fig. 5 1H–13C correlation spectra of natural abundance MHC ((a) experiment, (b) simulation) and 100% 13C-carbonate PAsp-stabilized disACC ((d) experiment, (e) simulation) at a spinning frequency of 10 kHz. In (e), the values of the 13C chemical shift were adjusted to match the experimental values for ACC after the simulation was completed. (c) 1H slices from the MHC spectra at 171.7 ppm. (f) 1H slices from the ACC spectra at 168.9 ppm. The black, dashed slice is from the simulation of ACC, i.e., including 180° flips, but the apodization was the same as for the simulation of MHC. | ||
Fig. 5d shows the 1H–13C correlation spectrum of PAsp-stabilized ACC, this time prepared with 100% 13C-carbonate. The increased signal strength allowed us to measure with the reduced volume rotor and record the 1H dimension with higher resolution. The cross-peak of ACC, however, remains essentially featureless (see Fig. S11 for a direct comparison with MHC, ESI†) as also observed by others.50,61 Line broadening due to 13C labelling is not observed (Fig. S12, ESI†). To investigate the shape and origin of the cross-peak in Fig. 5d, we ran a simulation in which we considered the 13C nuclei #2, #4, and #9 of MHC, each with two nearest water molecules undergoing 180° flips at a rate of 1000 s−1. The 1H slice of the resulting 1H–13C correlation spectrum is shown in black (dashed) in Fig. 5f. The flipping of the water molecules has the expected effect: the shoulder and main peak merge into one. The resulting peak is, however, too narrow compared to the experiment. We suspect that the disorder in the rigid environment of ACC creates a distribution of chemical environments for the 1Hs of the water molecules, leading to chemical shifts both smaller and larger than encountered in the ordered environment of MHC. This effect can be emulated by apodization, which yields the simulation in Fig. 5e and the red 1H slice in Fig. 5f. Apart from a foot, which we, as before (Fig. 2c and Fig. S6, ESI†), attribute to carbonate coupled to the 1Hs of PAsp, agreement with the experiment is now good. But an unfortunate consequence of the broad distribution in 1H chemical shifts is that observation of the 1Hs in ACC under homonuclear decoupling does, even in combination with spin dynamics simulations, not provide conclusive evidence concerning the 180° flips.
In search of further information about molecular dynamics in ACC, we performed a series of relaxation measurements. We deliberately avoid spectroscopy of deuterium, because of strong indications that synthesis from deuterated solvent alters the structure of ACC.75 Outcomes on longitudinal relaxation are discussed in the ESI† (Fig. S13 and S14). Below, we only discuss relaxation of the 13C spins in the presence of a spin-lock, i.e.,  . In this experiment, contributions to signal decay from coherent evolution are strongly reduced and we gain access to the transverse relaxation rates.76 These, in turn, provide information regarding motion on time scales of nanoseconds to milliseconds. The measured
  curves (black dots) are shown in Fig. 6. For all spin-lock strengths, an initial steep drop of the 13C NMR signal is followed by a more gradual decay. The curves are well-fitted with a bi-exponential (Fig. S15, ESI†), indicating contributions from two processes at distinct time scales.
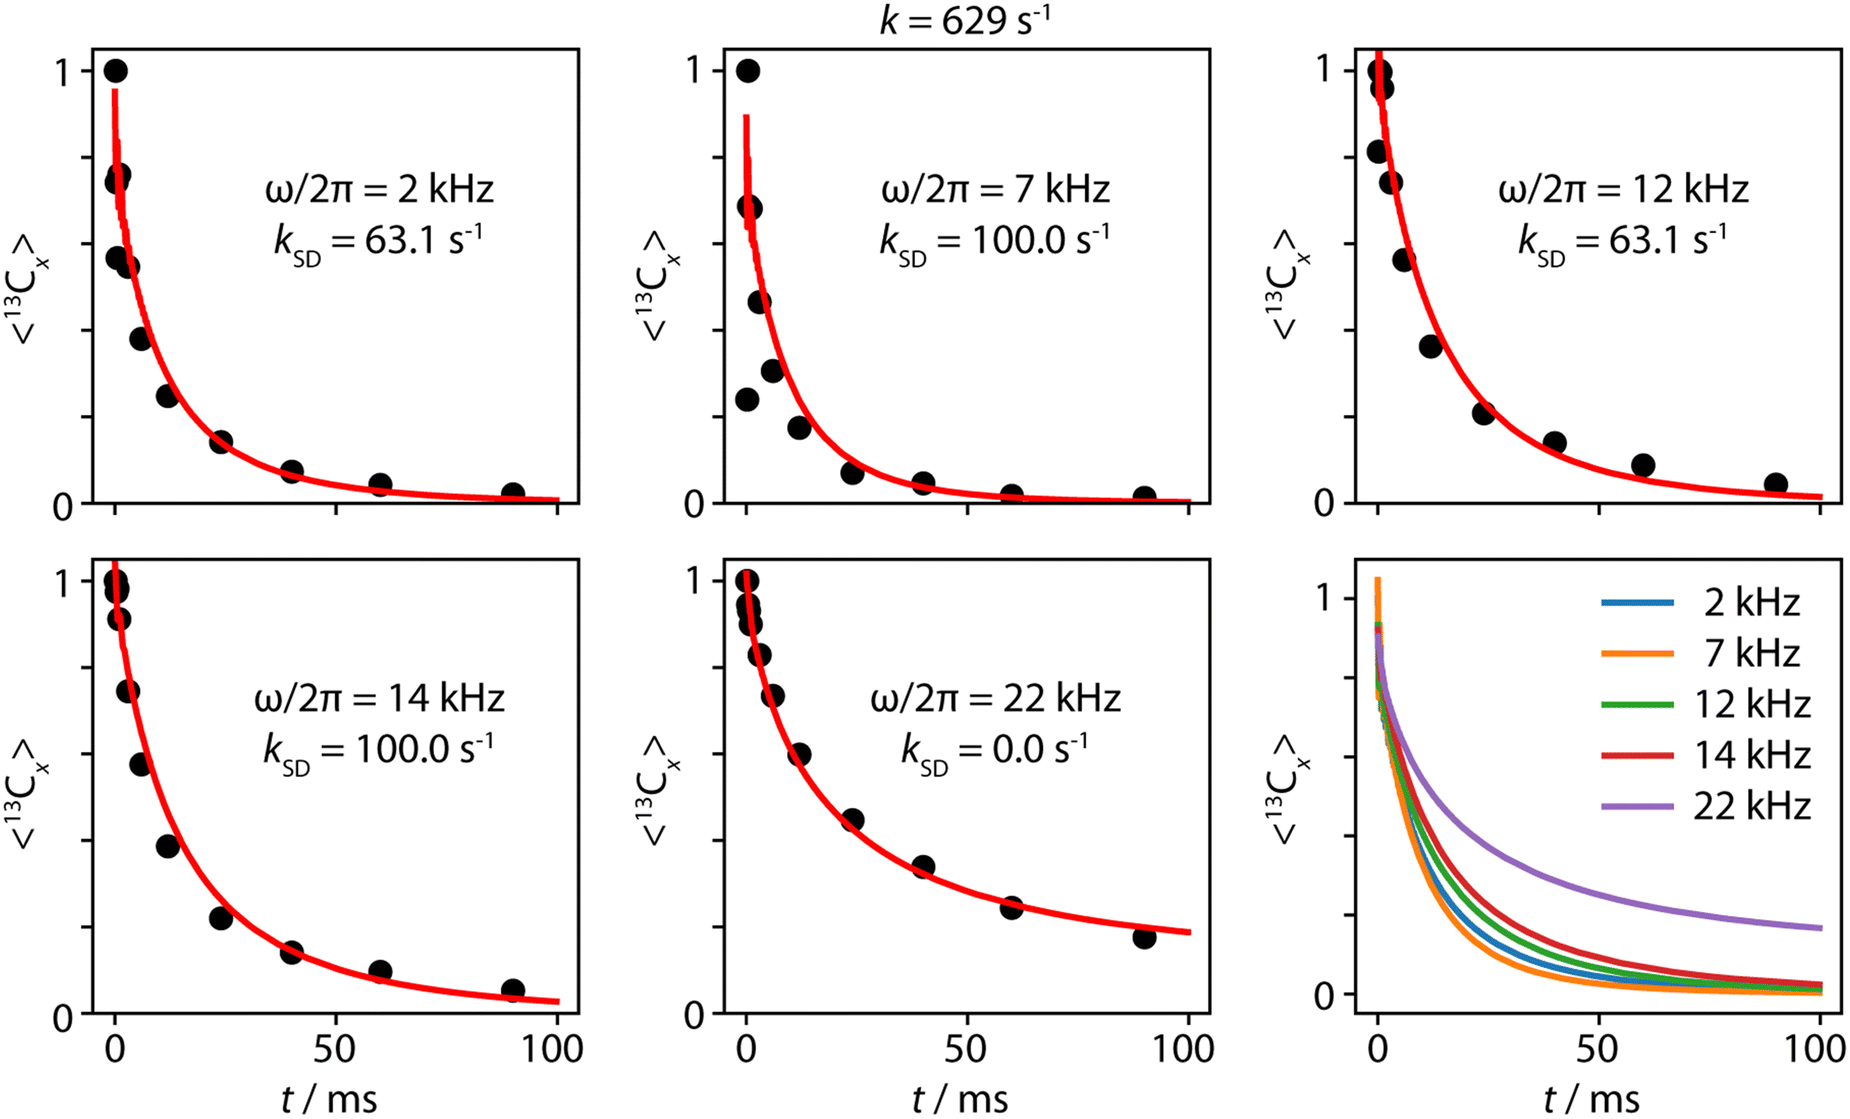 | ||
| Fig. 6 Relaxation of 13C in the presence of a spin-lock. Experiments (black dots) were performed on a sample of 100% 13C-carbonate PAsp-stabilized disordered ACC at a spinning frequency of 5 kHz. Numerical simulations (red curves) consider one 13C and four 1Hs from two nearby water molecules. Geometry and magnetic properties were taken from the unit cell of MHC. The optimized exchange rate, k = 629 s−1, was determined by a global fit to all five curves, while the spin diffusion rates, kSD, were optimized for each spin-lock strength individually. | ||
In a preliminary simulation of the  curves, the geometry and magnetic properties of 13C #9 and the 1Hs #13 and #16 (of the closest water molecule, see Table S2, ESI†) from the MHC unit cell are considered. If 180° flips of the water molecule are included, about half the magnetization decays (actually slightly more than half, due to coherent losses), reproducing the initial steep drop of the 13C magnetization, but not the subsequent gradual decay (Fig. S16a, ESI†). The reason is that if both 1Hs are in the same spin state (both up or both down), the dipolar coupling is not modulated and the 180° flips have no impact on the 13C magnetization. In reality, though, 1H spins can flip, a major source being 1H spin diffusion.77 In solids with strongly coupled homonuclear spin systems, this leads to line-narrowing (also called self-decoupling) and can be effectively modelled with a spin-diffusion type superoperator.59 If this spin diffusion term is added to the simulation (eqn (8)), the relaxation is completed and the bi-exponential decay is reproduced (Fig. S16b, ESI†). Optimization of the rate of the 180° flips (k = 1.26 × 10³ s−1) and the rate of the spin diffusion (kSD = 100 s−1) yields the simulations in Fig. S17 (ESI†), which are in good agreement with the experimental
  curves. This provides strong evidence that 180° flips of the structural water molecules in ACC, and not some other dynamic effect, are responsible for the decay during the spin lock.
Test simulations of the 1H–13C correlation spectra of MHC showed notable effects from inclusion of the water molecules second closest to each 13C. We therefore reran the simulation and fit to the  curves with a second water molecule (Table S2, ESI†), using the same model as for the simulations of the 1H–13C correlation spectra of ACC (eqn (10)). The results are shown in Fig. S18 (ESI†). The quality of the fits has improved for the spin-lock frequencies of 2 and 12 kHz, but has deteriorated for 22 kHz. A plausible explanation is that the spin diffusion rates, which drive the 1H flips, depend on the spin-lock frequency, especially when it is near one or two times the rotor frequency. Such a dependency has been observed experimentally in HET-s fibrils.78 An analogous mechanism, with the roles of 1H and 13C spins reversed, is responsible for the improved transfer of magnetization in dipolar-assisted rotational resonance (DARR) recoupling.79 When the spin diffusion rate is allowed to vary across the spin-lock frequencies, the quality of the simulations further improves. The final simulated
  curves and the optimized rates are shown in Fig. 6. Agreement with the experiments is excellent, which firmly establishes that the structural water molecules in ACC undergo 180° flips on a millisecond timescale.
In MHC, each water molecule is hydrogen-bonded via its two hydrogen atoms to two different carbonate ions (Fig. S5, ESI†). Demichelis et al. characterized the strength of these hydrogen bonds as medium to high.80 Since the 180° flips are already active at room temperature in ACC, the activation energy must be reduced compared to MHC and the hydrogen bonds have weakened. Vibrational IR spectra, however, suggest that they are still present, in a similar pattern. The IR spectra of MHC and ACC both show a double peak in the region from 1300 to 1600 cm−1,3 in contrast to calcite.34,35 Costa et al. performed an analysis of the normal modes of MHC and predicted the IR activity.81 They identified strong absorption peaks at 1373 and 1454 cm−1, both arising from asymmetric stretch vibrations of carbonate. The second of these peaks has a contribution from the scissoring of water and, hence, requires hydrogen bonding. The similarity between MHC and ACC, which we confirm here from an NMR perspective regarding the 1H and the 13C nuclei, makes it reasonable to assign the second peak in the IR spectrum of ACC also to an asymmetric stretch of carbonate involving a water molecule. This would be in agreement with the disappearance of this peak for transient (unstable) ACC, which has typically lost most of its structural water.3
Finally, IR spectra of vaterite also show a double peak in the region from 1300 to 1600 cm−1,34 but this has likely a different origin: MAS NMR has shown that carbonate takes on two distinct conformations in vaterite.20,34,70 It is tempting to connect this to the relatively shallow minimum of the fitting error for the spinning sideband pattern of pvACC (Fig. S9c, ESI†), which could hint at the presence of more than one conformation. This would confirm that pvACC indeed displays short-range order that is related to that of crystalline vaterite and is of course an exciting idea with an eye on polymorph selection. We nevertheless urge caution, as we could show, again by taking MHC as a reference system, that the cross-polarization step as well as the 180° flips can have an effect on the apparent set of CSA parameters, see Fig. S19 (ESI†). Further investigations, beyond the chemical environments of the 1H and 13C nuclei, are clearly needed to understand the structural differences between proto-structured ACCs.
Concluding remarks
Investigation by MAS NMR provided several new pieces of information regarding the structure and dynamics of PAsp-stabilized ACC. First, we performed characterization experiments. These showed that the pH of the solution from which ACC is synthesized slightly affects the arrangement of the carbonate ions, but stabilization with PAsp does not, even though it is at least partially incorporated into ACC. We attributed this to PAsp primarily interacting with the calcium ions. The secondary structure of PAsp is α-helical in ACC and this appears to be advantageous for preserving the disorder of ACC, probably in combination with the generation of calcium deficient sites, as proposed previously.25 Second, we compared ACC to MHC, which is crystalline, but has the same stoichiometry. Measurement of the 13C chemical shift anisotropy showed that the D3h symmetry of carbonate in calcite is further perturbed going from MHC to ACC. Previously, 1H spectra had suggested that, in contrast to MHC, structural water molecules in the rigid environment of ACC undergo 180° flips. 1H–13C spectra reported herein agreed with this notion, and, moreover, new evidence came from curves of ACC, which showed that these flips take place on a millisecond time scale.
The presented work is also an exploration into the role that spin dynamics simulations, at the state of the art, can play in developing structural models for amorphous minerals like ACC. The spin dynamics simulation packages Spinach and SLEEPY allowed us to almost casually include molecular dynamics and this proved crucial for the analysis of the spectra of ACC. We, however, also encountered limitations, in particular regarding the 1H chemical shift dispersion. Still, we envision spin dynamics simulations as a crucial part of an NMR-based structure-refinement approach for developing a structural model for ACC. We have shown here that, as long as we are not yet there, MHC is, from the perspective of the 1H and 13C nuclei, not a bad substitute.
Data availability
All data generated in this study as well as pulse programs (https://zenodo.org/records/14935875) have been deposited in the Zenodo repository (https://doi.org/10.5281/zenodo.14175542). Scripts for numerical simulations have been made available in the Spinach library (https://spindynamics.org/) or, when based on SLEEPY, in the Zenodo repository (https://doi.org/10.5281/zenodo.14138635).Conflicts of interest
There are no conflicts to declare.Acknowledgements
This research was funded by the Deutsche Forschungsgemeinschaft through the Emmy Noether Program (project-ID 321027114) and SFB 1527 (project-ID 454252029), both to G. M., and a research grant (project-ID 450148812) to A. A. S. The authors thank Julian Gale and Paolo Raiteri for sharing the results of the quantum chemical calculation on MHC, Ulrich Haunz for experimental support, and Ilya Kuprov for support regarding Spinach.References
- E. Beniash, J. Aizenberg, L. Addadi and S. Weiner, Amorphous Calcium Carbonate Transforms into Calcite during Sea Urchin Larval Spicule Growth, Proc. R. Soc. London, Ser. B, 1997, 264(1380), 461–465, DOI:10.1098/rspb.1997.0066.
- E. Beniash, L. Addadi and S. Weiner, Cellular Control Over Spicule Formation in Sea Urchin Embryos: A Structural Approach, J. Struct. Biol., 1999, 125(1), 50–62, DOI:10.1006/jsbi.1998.4081.
- L. Addadi, S. Raz and S. Weiner, Taking Advantage of Disorder: Amorphous Calcium Carbonate and Its Roles in Biomineralization, Adv. Mater., 2003, 15(12), 959–970, DOI:10.1002/adma.200300381.
- S. Weiner and L. Addadi, Crystallization Pathways in Biomineralization, Annu. Rev. Mater. Res., 2011, 41(1), 21–40, DOI:10.1146/annurev-matsci-062910-095803.
- L. Addadi and S. Weiner, Biomineralization: Mineral Formation by Organisms, Phys. Scr., 2014, 89(9), 098003, DOI:10.1088/0031-8949/89/9/098003.
- E. Beniash, R. A. Metzler, R. S. K. Lam and P. U. P. A. Gilbert, Transient Amorphous Calcium Phosphate in Forming Enamel, J. Struct. Biol., 2009, 166(2), 133–143, DOI:10.1016/j.jsb.2009.02.001.
- J. Mahamid, B. Aichmayer, E. Shimoni, R. Ziblat, C. Li, S. Siegel, O. Paris, P. Fratzl, S. Weiner and L. Addadi, Mapping Amorphous Calcium Phosphate Transformation into Crystalline Mineral from the Cell to the Bone in Zebrafish Fin Rays, Proc. Natl. Acad. Sci. U. S. A., 2010, 107(14), 6316–6321, DOI:10.1073/pnas.0914218107.
- K. M. Towe and H. A. Lowenstam, Ultrastructure and Development of Iron Mineralization in the Radular Teeth of Cryptochiton Stelleri (Mollusca), J. Ultrastruct. Res., 1967, 17(1–2), 1–13, DOI:10.1016/S0022-5320(67)80015-7.
- K. Kahil, S. Weiner, L. Addadi and A. Gal, Ion Pathways in Biomineralization: Perspectives on Uptake, Transport, and Deposition of Calcium, Carbonate, and Phosphate, J. Am. Chem. Soc., 2021, 143(50), 21100–21112, DOI:10.1021/jacs.1c09174.
- P. Raiteri and J. D. Gale, Water Is the Key to Nonclassical Nucleation of Amorphous Calcium Carbonate, J. Am. Chem. Soc., 2010, 132(49), 17623–17634, DOI:10.1021/ja108508k.
- M. G. Taylor, K. Simkiss, G. N. Greaves, M. Okazaki and S. Mann, An X-Ray Absorption Spectroscopy Study of the Structure and Transformation of Amorphous Calcium Carbonate from Plant Cystoliths, Proc. R. Soc. London, Ser. B, 1993, 252(1333), 75–80, DOI:10.1098/rspb.1993.0048.
- M. Neumann and M. Epple, Monohydrocalcite and Its Relationship to Hydrated Amorphous Calcium Carbonate in Biominerals, Eur. J. Inorg. Chem., 2007,(14), 1953–1957, DOI:10.1002/ejic.200601033.
- H. Effenberger, Kristallstruktur und Infrarot-Absorptionsspektrum von synthetischem Monohydrocalcit, CaCO3·H2O, Monatsh. Chem., 1981, 112(8–9), 899–909, DOI:10.1007/BF00905061.
- I. P. Swainson, The Structure of Monohydrocalcite and the Phase Composition of the Beachrock Deposits of Lake Butler and Lake Fellmongery, South Australia, Am. Mineral., 2008, 93(7), 1014–1018, DOI:10.2138/am.2008.2825.
- A. L. Goodwin, F. M. Michel, B. L. Phillips, D. A. Keen, M. T. Dove and R. J. Reeder, Nanoporous Structure and Medium-Range Order in Synthetic Amorphous Calcium Carbonate, Chem. Mater., 2010, 22(10), 3197–3205, DOI:10.1021/cm100294d.
- J. W. Singer, A. Ö. Yazaydin, R. J. Kirkpatrick and G. M. Bowers, Structure and Transformation of Amorphous Calcium Carbonate: A Solid-State 43Ca NMR and Computational Molecular Dynamics Investigation, Chem. Mater., 2012, 24(10), 1828–1836, DOI:10.1021/cm300389q.
- Y. G. Bushuev, A. R. Finney and P. M. Rodger, Stability and Structure of Hydrated Amorphous Calcium Carbonate, Cryst. Growth Des., 2015, 15(11), 5269–5279, DOI:10.1021/acs.cgd.5b00771.
- R. Innocenti Malini, Y. G. Bushuev, S. A. Hall, C. L. Freeman, P. M. Rodger and J. H. Harding, Using Simulation to Understand the Structure and Properties of Hydrated Amorphous Calcium Carbonate, CrystEngComm, 2016, 18(1), 92–101, 10.1039/C5CE01536G.
- M. P. Prange, S. T. Mergelsberg and S. N. Kerisit, Ab Initio Molecular Dynamics Simulations of Amorphous Calcium Carbonate: Interpretation of Pair Distribution Function and X-Ray Absorption Spectroscopy Data, Cryst. Growth Des., 2021, 21(4), 2212–2221, DOI:10.1021/acs.cgd.0c01655.
- F. M. Michel, J. MacDonald, J. Feng, B. L. Phillips, L. Ehm, C. Tarabrella, J. B. Parise and R. J. Reeder, Structural Characteristics of Synthetic Amorphous Calcium Carbonate, Chem. Mater., 2008, 20(14), 4720–4728, DOI:10.1021/cm800324v.
- R. J. Reeder, Y. Tang, M. P. Schmidt, L. M. Kubista, D. F. Cowan and B. L. Phillips, Characterization of Structure in Biogenic Amorphous Calcium Carbonate: Pair Distribution Function and Nuclear Magnetic Resonance Studies of Lobster Gastrolith, Cryst. Growth Des., 2013, 13(5), 1905–1914, DOI:10.1021/cg301653s.
- H.-W. Wang, L. L. Daemen, M. C. Cheshire, M. K. Kidder, A. G. Stack, L. F. Allard, J. Neuefeind, D. Olds, J. Liu and K. Page, Synthesis and Structure of Synthetically Pure and Deuterated Amorphous (Basic) Calcium Carbonates, Chem. Commun., 2017, 53(20), 2942–2945, 10.1039/C6CC08848A.
- P. M. Maffettone, W. J. K. Fletcher, T. C. Nicholas, V. L. Deringer, J. R. Allison, L. J. Smith and A. L. Goodwin, When Can We Trust Structural Models Derived from Pair Distribution Function Measurements?, Faraday Discuss., 2025, 255, 311–324, 10.1039/D4FD00106K.
- T. C. Nicholas, A. E. Stones, A. Patel, F. M. Michel, R. J. Reeder, D. G. A. L. Aarts, V. L. Deringer and A. L. Goodwin, Geometrically Frustrated Interactions Drive Structural Complexity in Amorphous Calcium Carbonate, Nat. Chem., 2024, 16(1), 36–41, DOI:10.1038/s41557-023-01339-2.
- M. B. Gindele, S. Vinod-Kumar, J. Rochau, D. Boemke, E. Groß, V. S. Redrouthu, D. Gebauer and G. Mathies, Colloidal Pathways of Amorphous Calcium Carbonate Formation Lead to Distinct Water Environments and Conductivity, Nat. Commun., 2024, 15(1), 80, DOI:10.1038/s41467-023-44381-x.
- R. Demichelis, P. Raiteri, J. D. Gale, D. Quigley and D. Gebauer, Stable Prenucleation Mineral Clusters Are Liquid-like Ionic Polymers, Nat. Commun., 2011, 2(1), 590, DOI:10.1038/ncomms1604.
- D. Gebauer, A. Völkel and H. Cölfen, Stable Prenucleation Calcium Carbonate Clusters, Science, 2008, 322(5909), 1819–1822, DOI:10.1126/science.1164271.
- D. Gebauer, M. Kellermeier, J. D. Gale, L. Bergström and H. Cölfen, Pre-Nucleation Clusters as Solute Precursors in Crystallisation, Chem. Soc. Rev., 2014, 43(7), 2348–2371, 10.1039/C3CS60451A.
- A. F. Wallace, L. O. Hedges, A. Fernandez-Martinez, P. Raiteri, J. D. Gale, G. A. Waychunas, S. Whitelam, J. F. Banfield and J. J. De Yoreo, Microscopic Evidence for Liquid-Liquid Separation in Supersaturated CaCO 3 Solutions, Science, 2013, 341(6148), 885–889, DOI:10.1126/science.1230915.
- M. A. Bewernitz, D. Gebauer, J. Long, H. Cölfen and L. B. Gower, A Metastable Liquid Precursor Phase of Calcium Carbonate and Its Interactions with Polyaspartate, Faraday Discuss., 2012, 159, 291, 10.1039/c2fd20080e.
- J. T. Avaro, S. L. P. Wolf, K. Hauser and D. Gebauer, Stable Prenucleation Calcium Carbonate Clusters Define Liquid–Liquid Phase Separation, Angew. Chem., Int. Ed., 2020, 59(15), 6155–6159, DOI:10.1002/anie.201915350.
- D. Carnevale, P. Pelupessy and G. Bodenhausen, Cross-Term Splittings Due to the Orientational Inequivalence of Proton Magnetic Shielding Tensors: Do Water Molecules Trapped in Crystals Hop or Tunnel?, J. Phys. Chem. Lett., 2019, 10(12), 3224–3231, DOI:10.1021/acs.jpclett.9b00914.
- S. Weiner and L. Addadi, Acidic Macromolecules of Mineralized Tissues: The Controllers of Crystal Formation, Trends Biochem. Sci., 1991, 16, 252–256, DOI:10.1016/0968-0004(91)90098-G.
- D. Gebauer, P. N. Gunawidjaja, J. Y. P. Ko, Z. Bacsik, B. Aziz, L. Liu, Y. Hu, L. Bergström, C.-W. Tai, T.-K. Sham, M. Edén and N. Hedin, Proto-Calcite and Proto-Vaterite in Amorphous Calcium Carbonates, Angew. Chem., Int. Ed., 2010, 49(47), 8889–8891, DOI:10.1002/anie.201003220.
- M. Farhadi-Khouzani, D. M. Chevrier, P. Zhang, N. Hedin and D. Gebauer, Water as the Key to Proto-Aragonite Amorphous CaCO3, Angew. Chem., Int. Ed., 2016, 55(28), 8117–8120, DOI:10.1002/anie.201603176.
- M. B. Gindele, K. K. Malaszuk, C. Peter and D. Gebauer, On the Binding Mechanisms of Calcium Ions to Polycarboxylates: Effects of Molecular Weight, Side Chain, and Backbone Chemistry, Langmuir, 2022, 38(47), 14409–14421, DOI:10.1021/acs.langmuir.2c01662.
- R. Nishiyama, T. Munemoto and K. Fukushi, Formation Condition of Monohydrocalcite from CaCl2–MgCl2–Na2CO3 Solutions, Geochim. Cosmochim. Acta, 2013, 100, 217–231, DOI:10.1016/j.gca.2012.09.002.
- K. Fukushi, Y. Suzuki, J. Kawano, T. Ohno, M. Ogawa, T. Yaji and Y. Takahashi, Speciation of Magnesium in Monohydrocalcite: XANES, Ab Initio and Geochemical Modeling, Geochim. Cosmochim. Acta, 2017, 213, 457–474, DOI:10.1016/j.gca.2017.06.040.
- Y.-C. Huang, M. B. Gindele, J. Knaus, A. Rao and D. Gebauer, On Mechanisms of Mesocrystal Formation: Magnesium Ions and Water Environments Regulate the Crystallization of Amorphous Minerals, CrystEngComm, 2018, 20(31), 4395–4405, 10.1039/C8CE00241J.
- A. Pines, M. G. Gibby and J. S. Waugh, Proton-enhanced NMR of Dilute Spins in Solids, J. Chem. Phys., 1973, 59(2), 569–590, DOI:10.1063/1.1680061.
- B. M. Fung, A. K. Khitrin and K. Ermolaev, An Improved Broadband Decoupling Sequence for Liquid Crystals and Solids, J. Magn. Reson., 2000, 142(1), 97–101, DOI:10.1006/jmre.1999.1896.
- M. Lee and W. I. Goldburg, Nuclear-Magnetic-Resonance Line Narrowing by a Rotating Rf Field, Phys. Rev., 1965, 140(4A), A1261–A1271, DOI:10.1103/PhysRev.140.A1261.
- A. Bielecki, A. C. Kolbert and M. H. Levitt, Frequency-Switched Pulse Sequences: Homonuclear Decoupling and Dilute Spin NMR in Solids, Chem. Phys. Lett., 1989, 155(4), 341–346, DOI:10.1016/0009-2614(89)87166-0.
- B.-J. van Rossum, H. Förster and H. J. M. de Groot, High-Field and High-Speed CP-MAS 13C NMR Heteronuclear Dipolar-Correlation Spectroscopy of Solids with Frequency-Switched Lee–Goldburg Homonuclear Decoupling, J. Magn. Reson., 1997, 124(2), 516–519, DOI:10.1006/jmre.1996.1089.
- J. Hellwagner, L. Grunwald, M. Ochsner, D. Zindel, B. H. Meier and M. Ernst, Origin of the Residual Line Width under Frequency-Switched Lee–Goldburg Decoupling in MAS Solid-State NMR, Magn. Reson., 2020, 1(1), 13–25, DOI:10.5194/mr-1-13-2020.
- N. C. Nielsen, H. Bildso/e, H. J. Jakobsen and M. H. Levitt, Double-quantum Homonuclear Rotary Resonance: Efficient Dipolar Recovery in Magic-angle Spinning Nuclear Magnetic Resonance, J. Chem. Phys., 1994, 101(3), 1805–1812, DOI:10.1063/1.467759.
- T. G. Oas, R. G. Griffin and M. H. Levitt, Rotary Resonance Recoupling of Dipolar Interactions in Solid-state Nuclear Magnetic Resonance Spectroscopy, J. Chem. Phys., 1988, 89(2), 692–695, DOI:10.1063/1.455191.
- J. Herzfeld and A. E. Berger, Sideband Intensities in NMR Spectra of Samples Spinning at the Magic Angle, J. Chem. Phys., 1980, 73(12), 6021–6030, DOI:10.1063/1.440136.
- H. J. Hogben, M. Krzystyniak, G. T. P. Charnock, P. J. Hore and I. Kuprov, Spinach – A Software Library for Simulation of Spin Dynamics in Large Spin Systems, J. Magn. Reson., 2011, 208(2), 179–194, DOI:10.1016/j.jmr.2010.11.008.
- Y. Huang, A. Rao, S. Huang, C. Chang, M. Drechsler, J. Knaus, J. C. C. Chan, P. Raiteri, J. D. Gale and D. Gebauer, Uncovering the Role of Bicarbonate in Calcium Carbonate Formation at Near-Neutral pH, Angew. Chem., Int. Ed., 2021, 60(30), 16707–16713, DOI:10.1002/anie.202104002.
- S. J. Clark, M. D. Segall, C. J. Pickard, P. J. Hasnip, M. I. J. Probert, K. Refson and M. C. Payne, First Principles Methods Using CASTEP, Z. Kristallogr. - Cryst. Mater., 2005, 220(5–6), 567–570, DOI:10.1524/zkri.220.5.567.65075.
- C. J. Pickard and F. Mauri, All-Electron Magnetic Response with Pseudopotentials: NMR Chemical Shifts, Phys. Rev. B: Condens. Matter Mater. Phys., 2001, 63(24), 245101, DOI:10.1103/PhysRevB.63.245101.
- I. Kuprov, Fokker–Planck Formalism in Magnetic Resonance Simulations, J. Magn. Reson., 2016, 270, 124–135, DOI:10.1016/j.jmr.2016.07.005.
- M. Bak and N. C. Nielsen, REPULSION, A Novel Approach to Efficient Powder Averaging in Solid-State NMR, J. Magn. Reson., 1997, 125(1), 132–139, DOI:10.1006/jmre.1996.1087.
- I. Kuprov, N. Wagner-Rundell and P. J. Hore, Polynomially Scaling Spin Dynamics Simulation Algorithm Based on Adaptive State-Space Restriction, J. Magn. Reson., 2007, 189(2), 241–250, DOI:10.1016/j.jmr.2007.09.014.
- A. Karabanov, I. Kuprov, G. T. P. Charnock, A. Van Der Drift, L. J. Edwards and W. Köckenberger, On the Accuracy of the State Space Restriction Approximation for Spin Dynamics Simulations, J. Chem. Phys., 2011, 135(8), 084106, DOI:10.1063/1.3624564.
- A. A. Smith-Penzel, Simulation in Liouville space for relaxation and exchange in Python (SLEEPY). https://github.com/alsinmr Search PubMed.
- M. Ernst, H. Zimmermann and B. H. Meier, A Simple Model for Heteronuclear Spin Decoupling in Solid-State NMR, Chem. Phys. Lett., 2000, 317(6), 581–588, DOI:10.1016/S0009-2614(99)01423-2.
- M. Ernst, Heteronuclear Spin Decoupling in Solid-State NMR under Magic-Angle Sample Spinning, J. Magn. Reson., 2003, 162(1), 1–34, DOI:10.1016/S1090-7807(03)00074-0.
- V. B. Cheng, H. H. Suzukawa and M. Wolfsberg, Investigations of a Nonrandom Numerical Method for Multidimensional Integration, J. Chem. Phys., 1973, 59(8), 3992–3999, DOI:10.1063/1.1680590.
- S.-Y. Yang, H.-H. Chang, C.-J. Lin, S.-J. Huang and J. C. C. Chan, Is Mg-Stabilized Amorphous Calcium Carbonate a Homogeneous Mixture of Amorphous Magnesium Carbonate and Amorphous Calcium Carbonate?, Chem. Commun., 2016, 52(77), 11527–11530, 10.1039/C6CC04522G.
- M. Farhadi Khouzani, D. M. Chevrier, P. Güttlein, K. Hauser, P. Zhang, N. Hedin and D. Gebauer, Disordered Amorphous Calcium Carbonate from Direct Precipitation, CrystEngComm, 2015, 17(26), 4842–4849, 10.1039/C5CE00720H.
- H. Saitô, R. Tabeta, I. Ando, T. Ozaki and A. Shoji, A high resolution 13C NMR study of solid poly(β-benzyl-L-aspartate) by the cross polarization-magic angle spinning method. Distinction of the right-handed α-helix, left-handed α-helix, ω-helix, and β-sheet forms by conformation-dependent 13C chemical shifts, Chem. Lett., 1983,(9), 1437–1440, DOI:10.1246/cl.1983.1437.
- P. Wang, S. Matsukawa, T. Kameda, H. Kurosu and I. Ando, Conformational Behaviour of Poly(Aspartic Acid) and Its Sodium Salt in the Solid State as Studied by High-Resolution Solid-State 13C-NMR Spectroscopy, J. Mol. Struct., 1997, 435(3), 229–234, DOI:10.1016/S0022-2860(97)00196-8.
- G. Platzer, M. Okon and L. P. McIntosh, pH-Dependent Random Coil 1H, 13C, and 15N Chemical Shifts of the Ionizable Amino Acids: A Guide for Protein pKa Measurements, J. Biomol. NMR, 2014, 60(2–3), 109–129, DOI:10.1007/s10858-014-9862-y.
- P. Wang and I. Ando, An NMR Study of Structure and Dynamics of Hydrated Poly (Aspartic Acid) Sodium Salt, J. Mol. Struct., 1998, 447(1–2), 81–88, DOI:10.1016/S0022-2860(98)00306-8.
- T. Lemke, M. Edte, D. Gebauer and C. Peter, Three Reasons Why Aspartic Acid and Glutamic Acid Sequences Have a Surprisingly Different Influence on Mineralization, J. Phys. Chem. B, 2021, 125(36), 10335–10343, DOI:10.1021/acs.jpcb.1c04467.
- L. Addadi and S. Weiner, Interactions between Acidic Proteins and Crystals: Stereochemical Requirements in Biomineralization, Proc. Natl. Acad. Sci. U. S. A., 1985, 82(12), 4110–4114, DOI:10.1073/pnas.82.12.4110.
- S. Sen, D. C. Kaseman, B. Colas, D. E. Jacob and S. M. Clark, Hydrogen Bonding Induced Distortion of CO3 Units and Kinetic Stabilization of Amorphous Calcium Carbonate: Results from 2D13 C NMR Spectroscopy, Phys. Chem. Chem. Phys., 2016, 18(30), 20330–20337, 10.1039/C6CP02729F.
- H. Nebel, M. Neumann, C. Mayer and M. Epple, On the Structure of Amorphous Calcium Carbonate—A Detailed Study by Solid-State NMR Spectroscopy, Inorg. Chem., 2008, 47(17), 7874–7879, DOI:10.1021/ic8007409.
- C. Chang, S. Yang and J. C. C. Chan, Solubility Product of Amorphous Magnesium Carbonate, J. Chin. Chem. Soc., 2021, 68(3), 476–481, DOI:10.1002/jccs.202000527.
- P. C. Lauterbur, Anisotropy of the C 13 Chemical Shift in Calcite, Phys. Rev. Lett., 1958, 1(9), 343–344, DOI:10.1103/PhysRevLett.1.343.
- E. N. Maslen, V. A. Streltsov and N. R. Streltsova, X-Ray Study of the Electron Density in Calcite, CaCo3, Acta Crystallogr., Sect. B: Struct. Sci., 1993, 49(4), 636–641, DOI:10.1107/S0108768193002575.
- W. S. Veeman, Carbon-13 Chemical Shift Anisotropy, Prog. Nucl. Magn. Reson. Spectrosc., 1984, 16, 193–235, DOI:10.1016/0079-6565(84)80006-0.
- M. King, J. T. Avaro, C. Peter, K. Hauser and D. Gebauer, Solvent-Mediated Isotope Effects Strongly Influence the Early Stages of Calcium Carbonate Formation: Exploring D2O vs. H2O in a Combined Computational and Experimental Approach, Faraday Discuss., 2022, 235, 36–55, 10.1039/D1FD00078K.
- P. Schanda and M. Ernst, Studying Dynamics by Magic-Angle Spinning Solid-State NMR Spectroscopy: Principles and Applications to Biomolecules, Prog. Nucl. Magn. Reson. Spectrosc., 2016, 96, 1–46, DOI:10.1016/j.pnmrs.2016.02.001.
- N. M. Szeverenyi, M. J. Sullivan and G. E. Maciel, Observation of Spin Exchange by Two-Dimensional Fourier Transform 13C Cross Polarization-Magic-Angle Spinning, J. Magn. Reson. 1969, 1982, 47(3), 462–475, DOI:10.1016/0022-2364(82)90213-X.
- A. A. Smith, E. Testori, R. Cadalbert, B. H. Meier and M. Ernst, Characterization of Fibril Dynamics on Three Timescales by Solid-State NMR, J. Biomol. NMR, 2016, 65(3), 171–191, DOI:10.1007/s10858-016-0047-8.
- K. Takegoshi, S. Nakamura and T. Terao, 13C–1H Dipolar-Assisted Rotational Resonance in Magic-Angle Spinning NMR, Chem. Phys. Lett., 2001, 344(5–6), 631–637, DOI:10.1016/S0009-2614(01)00791-6.
- R. Demichelis, P. Raiteri and J. D. Gale, Structure of Hydrated Calcium Carbonates: A First-Principles Study, J. Cryst. Growth, 2014, 401, 33–37, DOI:10.1016/j.jcrysgro.2013.10.064.
- S. N. Costa, V. N. Freire, E. W. S. Caetano, F. F. Maia, C. A. Barboza, U. L. Fulco and E. L. Albuquerque, DFT Calculations with van der Waals Interactions of Hydrated Calcium Carbonate Crystals CaCO3·(H2O, 6H2O): Structural, Electronic, Optical, and Vibrational Properties, J. Phys. Chem. A, 2016, 120(28), 5752–5765 CrossRef CAS PubMed.
Footnotes |
| † Electronic supplementary information (ESI) available. See DOI: https://doi.org/10.1039/d5cp01002k |
| ‡ Current address: Department of Chemistry, New York University Abu Dhabi, Saadiyat Marina district, Abu Dhabi, United Arab Emirates. |
| § Current address: BASF Coatings GmbH, Glasuritstrasse 1, 48165 Münster, Germany. |
| This journal is © the Owner Societies 2025 |