
 Open Access Article
 This Open Access Article is licensed under a Creative Commons Attribution-Non Commercial 3.0 Unported Licence
Computational investigation of silica-supported Pdn and Pdn(xO) nanoclusters†
C. J.
Lombard
a,
C. G. C. E.
van Sittert
 *a,
J. N.
Mugo
b,
C.
Perry
c and
D. J.
Willock
*d
*a,
J. N.
Mugo
b,
C.
Perry
c and
D. J.
Willock
*d
aLaboratory for Applied Molecular Modelling, Research Focus Area: Chemical Resource Beneficiation, North-West University, Private Bag X6001, Potchefstroom, 2520, South Africa. E-mail: cornie.vansittert@nwu.ac.za
bJohnson Matthey Technology Center, Belasis Avenue, Billingham TS23 1LH, UK
cJohnson Matthey Technology Center, Blount's Court, Sonning Common, Reading RG4 9NH, UK
dMax Planck – Cardiff Centre on the Fundamentals of Heterogeneous Catalysis FUNCAT, Cardiff Catalysis Institute, School of Chemistry, Cardiff University, Cardiff, CF10 3AT, UK. E-mail: willockdj@cardiff.ac.uk
First published on 30th April 2025
Abstract
Silica-supported Pd nanoclusters (Pdn/SiO2) are essential catalysts in methane oxidation for pollution abatement. These catalysts operate at high temperature for long periods exposed to the exhaust gases of combustion engines. For catalyst design to ensure the required longevity, insight into the interaction between nanoclusters and the SiO2 surface is essential. Accordingly, there is a need for well-defined, computationally inexpensive, quantum mechanical models of these structures from which cluster support interactions can be understood. In this work, we have found that a strong adsorption site for a single Pd1 atom on the hydroxylated α-SiO2(101) surface can be formed when Pd adsorption is accompanied by the elimination of water. We show that this becomes a thermodynamically favourable process at the temperatures commonly used for calcination following catalyst synthesis using wet impregnation. Using this initial anchor point Pdn and Pdn(xO) nanoclusters are systematically constructed guided by the Mulliken charges of atoms at each stage. We then investigate the surface interactions of these Pdn and Pdn(xO) nanoclusters by considering the gas phase references of the same clusters. Our calculations show stability varies according to cluster size. Oxidation of the clusters leads to a weakening of cluster–surface interaction.
1 Introduction
Silica-supported transition metals are fundamental in heterogeneous catalysis, and metal support interactions (M/SiO2) play a pivotal role in catalytic performance and thermal stability. Pd/SiO2 nanoclusters are a commonly used catalyst in a broad range of reactions from methane and alcohol oxidation to cross-coupling reactions such as the Buchwald–Hartwig, amination of allylic acetates, carbonylation, Stille, cyanation of aromatic halides, Suzuki–Miyaura, Sonogashira and Heck reactions.1–12 These reactions are generally performed in solvent-free conditions and paired with highly specialised Pd catalysts, tailored for selectivity and yield.13–15 The Pd/SiO2 catalysts have high chemical and thermal stability, making them an attractive option for applications requiring long catalytic lifetimes, such as vehicle pollution control.16 Catalytic stability requires that metal nanoparticles interact strongly with the silica support so that the active metal component is not lost to the environment and also to prevent surface diffusion leading to sintering.Consequently, these M/SiO2 interactions have been extensively investigated. Veith et al.17 studied the thermal stability and catalytic activity of Au/SiO2 and Au/TiO2 for CO oxidation. In their study, 2.5 nm Au nanoparticles on fumed silica deposited via magnetron sputtering showed stability against sintering up to 500 °C in an oxygen-containing atmosphere. In contrast, Au/TiO2 was found to sinter rapidly under the same conditions. While less active for CO oxidation than Au/TiO2, the Au/SiO2 catalyst allowed easier regeneration, fully restoring catalyst activity post-deactivation. The high stability of Au/SiO2 was assigned to the absence of impurities and strong Au–SiO2 bonds. Veith et al.17 included DFT calculations, which found that Au binds only weakly to the fully hydroxylated silica surface, but when an OH group is removed to allow Au binding at an Si dangling bond they estimated an Au–SiO2 bond strength of ∼3.8 eV.
A DFT-PBE investigation by Gueddida and co-workers18 examined interactions of transition metals (Co, Ni, and Cu) on amorphous SiO2 with varying hydroxyl group densities on the SiO2 surface. Their results showed that the stability of the metal species, their geometry, and their magnetic properties are influenced by the number of M–O–Si and M–O(H)–Si groups, potentially leading to SiO2 surface reorganisation. They reported that Co monomers exhibit higher stability on SiO2 than the other metals, while Ni clusters have the strongest adsorption of the clusters studied. Additionally, the magnetic moments of adsorbed metal clusters on SiO2 surfaces decreased compared to their free counterparts, particularly for Co and Ni.
A computational approach by Das et al.,19 combined cluster calculations using B3LYP/TZVP and periodic DFT-PBE calculations to look into the formation of unsaturated Zn(II) and Ga(III) ions on amorphous SiO2. The study focused on the impact of siloxane ring strain and cation charge density on the adsorption of the metal ions. Theoretical findings were validated against structural data obtained from extended X-ray absorption fine structure (EXAFS) spectroscopy for monomeric Zn(II) and Ga(III) ions on silica. Their results showed that large siloxane rings facilitate robust dative bonding between metal ions and surface hydroxyl groups, generating high-coordinate metal sites. Conversely, small siloxane rings induce weak metal–silanol interaction, leading to low-coordinate metal sites. Further work on surface sites by Demmelmaier et al.20 has shown shows that Cr/SiO2 catalysts are more effective for ethene polymerisation when the silica support is preheated above 800 °C due to the presence of strained 4-membered rings in dehydrated silica at high temperatures. Additionally, small ring structures promote the formation of low-coordination Ga/Zn ions.
Cluster and QM/MM calculations have also been used to compare the adsorption energy of coinage metals, Ag, Au, and Cu to silica surfaces.21 The interaction of these metals with the stoichiometric or fully hydroxylated surface was found to be very weak (|Eads| < 0.10 eV). Strong binding was observed if defect sites such as singly co-ordinated oxygen atoms with dangling bonds (≡Si–O) or exposed Si co-ordination sites (≡Si) are considered. For these defect sites the magnitude of the binding energy of single metal atoms is in the range 3–4 eV. For Pd, cluster results using the B3LYP functional show a weak interaction with a typical surface bridging oxygen site (|Eads| = 0.22 eV) with much stronger binding to defect sites (|Eads(≡Si–O)| = 2.51 eV and |Eads(≡Si)| = 2.27 eV).22 The preference for metal clusters deposited by soft-landing techniques to locate at defect centres has also been investigated using spectroscopic methods.23,24
Li et al.,16 have investigated the impact of metal deposition methods on methane oxidation over Pd/SiO2 catalysts under lean conditions. Their initial research employed SBA-15, a silica with well-defined mesoporosity as a support and they introduced an ammonia evaporation step as part of the catalyst synthesis method. The rational for this was that the ammonia evaporation would lead to deprotonation of surface silanol groups to give a strong electrostatic adsorption of the Pd2+ species used during metal deposition. In a second publication25 the same authors showed how the same method could be used with fumed silica as a cost-effective alternative to SBA-15. The study proposed that PdO serves as the catalyst's active form and suggested the potential presence and advantages of Pd4+. Additionally, their DFT-PBE calculations investigated methane adsorption on model catalyst surfaces, employing β-cristobalite as the SiO2 model. The single Pd atoms were simulated in various oxidation states induced by deprotonating hydroxyl groups adjacent to the Pd.
In recent experimental work by Sudheeshkumar et al.26 SiO2 encapsulation of Pd nanoparticles was employed to safeguard against sintering. The study demonstrated that this approach improves nanoparticle stability at elevated temperatures and observed the conversion of PdO to metallic Pd occurring between 250 and 650 °C. It is widely accepted that the catalytic activity of Pd/SiO2 catalysts relies on the size and oxidation state of the Pd nanoclusters as well as their interactions with the support surface.27–29 It is crucial to model these structures through quantum mechanical calculations to elucidate size effects and surface interactions in order to gain insight into the origin of experimentally observed catalyst stability.
Amorphous SiO2 support surfaces are commonly synthesised through sol–gel and flame pyrolysis methods.30–32 Previous experimental and theoretical work has identified hydroxyl functional groups in a wide range of environments on the surface of amorphous SiO2. These have been classified into isolated silanols, with a solitary –O3Si–OH, (–O indicating oxygen anions linking other Si cations), vicinal silanols, in which surface –O3SiOH groups are close enough to form inter-silanol hydrogen bonds and geminal silanols, –O3Si–(OH)2. Vicinal silanol groups are relatively abundant on the surface of amorphous SiO2.30,33–46 The dehydration of vicinal silanol groups can yield four-membered siloxane rings when the material is treated at high temperatures (>800 °C).20 The occurrence of the four-membered siloxane ring has been characterised experimentally; however, it is rarely detected on the surface of amorphous SiO2 under normal conditions due to the hydroxylation of the surface.47–51
In previous work, we have established the functionality of crystalline α-SiO2 as an efficient starting structure to isolate the different types of hydroxyl groups seen on the surface of amorphous SiO2.52 Dissociation of water on a slab model of α-SiO2(001) or α-SiO2(100) generates geminal silanol groups while the same process on α-SiO2(101) leads to vicinal silanols. The isolation of these classes of structures is beneficial for developing highly reproducible periodic models in first-principles quantum mechanics calculations. Our search for a suitable adsorption site for Pd1 on crystalline α-SiO2 in previous work52 also identified the vicinal silanol groups on α-SiO2(101) as giving a stronger binding site for Pd1 than seen for the geminal silanol groups of α-SiO2(001) and α-SiO2(100). The α-SiO2(101) surface gave more favourable adsorption energies for Pd1 than the other surfaces when the surfaces were considered both in hydroxyl free and hydroxylated forms.52
However, creating reproducible models of SiO2-supported Pd nanoclusters can be challenging, especially considering the vast number of configurations for Pd nanoclusters. In this contribution we address this question by creating DFT models of Pdn and Pdn(xO) nanoclusters supported on the α-SiO2(101) surface. We use a siloxane ring on the α-SiO2(101) surface to serve as an adsorption site for a single Pd1 atom and, from that, developed a systematic building process for Pdn (Pd2–13) nanoclusters. Through molecular dynamics simulations, we ensured that the resulting configurations of the Pdn nanoclusters are stable on the SiO2 surface.
We then create Pdn(xO) (namely, Pd4(2O), Pd6(2O), Pd10(2O), Pd13(2O), Pd4(4O), Pd6(6O), Pd10(10O), and Pd13(10O)) nanoclusters starting from their metallic counterparts. The reproducibility of the Pdn(xO) structures was ensured by a stepwise addition of oxygen atoms that was guided by calculated Mulliken charges for the Pd atoms in the clusters. We use the cohesion and adsorption energies of Pdn and Pdn(xO) nanoclusters to estimate their stability. Furthermore, we estimate the degree to which these clusters interact with the SiO2 surface and adsorbed oxygen atoms as a function of cluster size. Ultimately, we produced Pdn(xO)/SiO2 structures that can be applied as model catalysts for simulations of the reactions they catalyse.
2 Computational details
All calculations employed periodic models with first-principles DFT calculations using the Cambridge Serial Total Energy Package (CASTEP) software.53 Model visualisation and input file preparation were done using a combination of Biovia Materials Studio and Python scripts based on the atomic simulation environment (ASE) modules.54All vacuum reference structures of Pdn (Pd1–13) nanoclusters were optimised in a cubic 20 × 20 × 20 Å periodic cell. The slab models of surfaces studied were constructed from the same DFT-optimised bulk cell discussed in our earlier publication.52 The values for cell constants a = b = 4.98 Å, c = 5.40 Å, α = β = 90°, γ = 120° agree well with the experimental reference of a = b = 4.91 Å, c = 5.40 Å, α = β = 90°, γ = 120°.40,55 For the Pdn and Pdn(xO) clusters supported on hydroxylated α-SiO2(101), we employed a 2 × 3 supercell expansion of the surface cleaved from the DFT-optimised bulk cell. Note that in this section when referring to Pdn clusters supported on the hydroxylated surface, we have used the shorthand SiO2 for the slab model of the surface for simplicity. In the results section we will compare Pd1 adsorption on completely hydroxylated slab models and on a slab model with one water molecule removed. To aid the discussion we will then introduce nomenclature with the stoichiometry of the slab indicated. The periodic unit cell for all slab models of hydroxylated α-SiO2(101) has surface vectors of a = 14.771 Å and b = 14.960 Å with a depth of 36 atomic layers. All Pdn/SiO2 and Pdn(xO)/SiO2 periodic models were created with a 15 Å vacuum gap for the clean SiO2 surface. In all cases, the lattice parameters of the periodic slab models were fully constrained during all CASTEP calculations based on the optimised bulk lattice parameters.
We employed the Perdew–Burke–Ernzerhof56 (PBE) exchange correlated DFT functional57 with a plane-wave basis set with a 700 eV cut-off energy. The electronic functions of core electrons were simulated by on-the-fly generated (OTFG) ultrasoft pseudopotentials.58 We employed the Tkatchenko–Scheffler (TS) dispersion correction to all periodic models to account for the influence of the attractive van der Waals forces. To correct for the artificial dipole moments generated when Pd clusters are added to only one side of the slab models, we used a self-consistent dipole correction along the Z-axis of the Cartesian coordinate system, which was set to be normal to the surface in all cases.59
The convergence criterion for total electronic energy was set to 2 × 10⁻⁸ eV to ensure tight convergence and a high degree of accuracy for the electron optimisations. A scaling factor of 2.5 was used to adjust the real space grid spacing and the finer real space.
An additional 84 unoccupied electronic bands were included in all calculations to ensure a sufficiently accurate representation of the band structure. A smearing width of 0.2 eV was employed to control the amount of smearing applied to the Fermi–Dirac distribution. No constraints were imposed on the occupancy of electronic states. The supercell slab models have large real space dimensions, so reciprocal space sampling was restricted to the Γ-point only.60,61
Geometric convergence was accepted when all atomic forces fell below 0.01 eV Å−1. This strict convergence criteria required electronic structure self-consistent field (SCF) cycles to converge within 2 × 10⁻⁸ eV. In addition, we employed the limited-memory Broyden–Fletcher–Goldfarb–Shanno optimisation algorithm to ensure swift and effective optimisations of these large systems with minimal usage of random access memory (RAM) resources.62
The molecular dynamics (MD) calculations that were carried out on the supported Pd nanoclusters were performed for 36 ps with a timestep of 1 fs with PBE and a 700 eV cut-off energy.53 An NVT ensemble was employed with a Nose–Hoover thermostat set to a target temperature of 900 K.53 All NVT-MD calculations were performed at the Γ-point.53
The cohesive energy, Ecoh(Pdn), for Pd atoms within the gas phase Pdn and within the supported Pdn/SiO2 nanoclusters, Ecoh(Pdn/SiO2), were determined with reference to the calculated energy of an isolated Pd atom and the reference silica surface:
 | (1) |
 | (2) |
The adsorption energy for a Pdn cluster on the hydroxylated α-SiO2(101) surface, Eads(Pdn/SiO2), was calculated using:
| Eads(Pdn/SiO2) = E(Pdn/SiO2) − E(Pdn) − E(SiO2) | (3) |
The adsorption energies of the PdnOx nanoclusters, Eads(PdnxO), adsorbed on the partially hydroxylated α-SiO2(101) surface, were also calculated for a given level of oxidation of the nanoclusters following:
| Eads(PdnxO/SiO2) = E(PdnxO/SiO2) − E(PdnxO) − E(SiO2) | (4) |
Furthermore, we calculated the oxygen adsorption energy on the free, Eads(xO:PdnxO), and supported, Eads(xO:PdnxO/SiO2), clusters using the energy per oxygen atom relative to gas phase O2 for the free Pdn(xO) cluster and for supported Pdn(xO)/SiO2 nanoclusters,
 | (5) |
 | (6) |
For comparing the degree of charge transfer from cluster to support and for deciding on the positioning of metal atoms added to clusters as we extend them, we have used the Mulliken charge analysis approach. This requires the planewave density to be projected onto a localised basis set which can lead to errors due to charge not being captured in the localised basis set. The discrepancy is estimated using the spilling parameter and, in the calculations reported here, this indicated that only between 1.1% and 1.2% of the calculated density was “lost” in the projection process. Even so, the absolute values of the Mulliken charges are not a good indication of the true charge state of an atom in a solid, but can be useful in making comparisons between similar systems, which is the approach used here.24
3 Results
3.1 The adsorption of Pd1 on the α-SiO2(101) surface
In the presence of water, the hydrophilic four-member siloxane ring on the pristine α-SiO2(101) can spontaneously hydroxylate to form silanol groups. These silanol groups can, in turn, be dehydrated at 800 °C and revert to the siloxane ring so that these surface structures are interchangeable depending on experimental conditions. Fig. 1(a) shows the calculated siloxane ring structure, and Fig. 1(b) shows the hydroxylated surface following the reaction of the siloxane ring with water. The reaction results in the opening of the siloxane ring to produce two hydroxyl groups. To emphasize this stoichiometry we will use the general formula Six+y/2O2x(OH)2y when referring to a fully hydroxylated surface model with the y coefficient giving the number of water molecules adsorbed. | ||
| Fig. 1 The calculated structures of H2O and Pd1 on crystalline α-SiO2(101). (a) Reconstructed Si72O144 slab, SixO2x. (b) Hydroxylated Si72O156H24 after water adsorption on the reconstructed slab, Six+y/2O2x(OH)2y. (c) Pd1 adsorbed on a fully hydroxylated Si72O156H24 slab, Pd1/Six+y/2O2x(OH)2y. (d) Pd1 adsorbed in a siloxane ring on a partially hydroxylated (Si72O155H22) slab, Pd1/Six+y/2O2x+1(OH)2y−2. In (c) and (d) the adsorption energy of Pd1 relative to the free atom and the relevant surface (hydroxylated Si72O156H24 for (c) and Si72O144 slab + H2O for (d)) is reported. Atom colours: Si: yellow, O: red, H: white, and Pd: Cyan. The 2 × 3 SiO2 unit cells also contain 36 atomic layers but only the top layer region near to the water adsorption site (a) and (b) and Pd atom adsorption site (c) and (d) is shown for clarity. | ||
We have previously reported a value of −2.59 eV for the adsorption energy for water from the gas phase to α-SiO2(101).52 From this calculation, along with the entropy of water in the gas phase taken from the NIST database63 we have now estimated the free energy for dehydroxyaltion as detailed in ESI,† Fig. S1 gives a plot of the resulting free energy change for dehydroxylation as a function of temperature and shows that this becomes negative at around 795 °C. In this calculation we have assumed the entropy of the surface in the reference and adsorbed state roughly balance and so we have used DFT adsorption energies without correction for surface vibrational state entropy or the inclusion of zero-point vibrational energy. Even so, the estimate for the dehydroxylation temperature agrees remarkably well with the experimental observation that the hydroxylated surface is the preferred form at temperatures below 800 °C.20 We also conclude that the pristine surface of silica will be in a hydroxylated state under the conditions used to synthesise supported Pd catalysts.
The adsorption of Pd1 to the completely hydroxylated surface (Pd1/Six+y/2O2x(OH)2y) resulted in the structure shown in Fig. 1(c). The adsorbed Pd atom interacts with one of the hydroxyl oxygen atoms, and the adsorption energy is found to be favourable with Eads = −0.84 eV. If we remove one water molecule from the hydroxylated surface, an Si2O2 four membered siloxane ring will be formed to accommodate the resulting dangling bonds, as has been seen for the pristine surface (Fig. 1(a)).52 Adsorption of Pd1 to this ring structure gives Pd1/Six+y/2O2x+1(OH)2y−2 with the Pd atom inserted into the siloxane ring. In this structure, close interactions with surface oxygen and silicon atoms (O-1 and Si-2 defined in Fig. 1(b)) can be seen. In this case, the adsorption energy of Pd, relative to the surface shown in Fig. 1(a), is more favourable by 1 eV than found for the adsorption of Pd1 to the hydroxylated surface without the removal of water (Fig. 1(c)). The cluster models discussed in the introduction suggest a weaker interaction between Pd and the pristine silica surface (Eads = −0.22 eV).22 Our results differ partly due to the inclusion of dispersion corrections which were not present in the earlier work and partly due to our use of a periodic model in which Pd interacts closely with two hydroxyl groups. In the earlier work only the bridging oxygen site of the surface was considered. The defect sites used in the earlier work also contain similar interactions between Pd and the surface as seen here (direct Pd–Si interaction and O dangling bond interaction) but in these calculations this site has been produced by the elimination of water rather than the construction of a surface defect. Even so, we see that these interactions give stonger Pd-surface binding than seen on the stoichiometric surface which was also the case when defects were considered in the earlier work.
This suggests that the site produced by partial dehydration of the surface (Fig. 1(d)) could be an anchor point for Pd nanoparticles to form. This site is produced during catalyst synthesis by the elimination of water from the surface rather than the previously considered defect sites which are a feature of the silica surface itself. The Pd1 adsorption energies considered here have been calculated relative to their respective hydroxylated surface states. In order to obtain direct comparison we must also account for the elimination of water when Pd1/Six+y/2O2x(OH)2y is transformed into Pd1/Six+y/2O2x+1(OH)2y−2:
| Pd1/SixO2x−2(OH)2 = Pd1/SixO2x + H2O | (7) |
The thermodynamic cycle to link the energy of this process to the calculated adsorption energies given in Fig. 1 is shown in Fig. S2 (ESI†). The dehydration process will require an energy of around 1.57 eV to be supplied. Fig. S3 (ESI†) introduces the entropy of dehydration as was done for the discussion of the dehydration of the hydroxylated surface. In this case we see that the free energy for elimination of water in the presence of adsorbed Pd1 becomes negative at temperatures above around 400 °C.
This process is relevant because during catalyst preparation, Pd is usually introduced as a salt, which reacts with the surface and is then reduced under hydrogen to form metal nanoparticles at temperatures of 400–600 °C. These calculations show that, in this reduction step, dehydration of the surface local to the Pd particles would be expected to occur. So, the initial addition of Pd will take place on a fully hydroxylated surface but the temperatures used in reduction will lead to local dehydration and a stronger adsorption of Pd to the surface. We also note that the reduction treatment temperatures are insufficient to give dehydration on surfaces without Pd adsorbed (Fig. S1, ESI†) and so the major part of the silica surface will remain hydroxylated. Fig. 1(d) also suggests that this local dehydration will be accompanied by strong interactions between Pd and Si as well as Pd and O, as has been evidenced by X-ray photoelectron spectroscopy and X-ray diffraction.64
To further understand the interaction of Pd1 with the silica surface, Mulliken charges53,65,66 for the structures in Fig. 1 have been calculated and the charges of the atoms in the first neighbour shell of the adsorption site for water and Pd1 are listed in Table 1. While the absolute values of Mulliken charges have little physical meaning differences between structures can give insight into the differences in electron distribution.
| Structure | Atom | ||||
|---|---|---|---|---|---|
| O-1e | O-2e | Si-1e | Si-2e | Pde | |
| a Note: reconstructed α-SiO2(101) surface with siloxane 4 ring (see Fig. 1(a)). b Hydroxylated α-SiO2(101) surface (see Fig. 1(b)). c see Fig. 1(c). d see Fig. 1(d). e Atom numbering is defined in Fig. 1. | |||||
| SixO2xa | −1.10 | −1.19 | 2.25 | 2.35 | — |
| Six+y/2O2x(OH)2yb | −1.09 | −1.19 | 2.35 | 2.36 | — |
| Pd1/Six+y/2O2x(OH)2yc | −1.03 | −1.17 | 2.27 | 2.32 | 0.20 |
| Pd1/Six+y/2O2x+1(OH)2y−2d | −1.00 | −1.11 | 2.23 | 1.84 | 0.43 |
From this Mulliken charge analysis, we notice that in the strained structure of the 4-member siloxane ring (Fig. 1(a)), the oxygen atom labelled O-2 is more negatively charged than the outermost oxygen atom (O-1). There was a similar magnitude difference (0.1 |e|) between the two silicon atoms in the ring. When the ring is opened through the dissociative adsorption of water (Fig. 1(b)), the charges on the oxygen atoms remained the same as in the siloxane ring and the two Si atom charges have practically the same charge as one another. When Pd1 is adsorbed to the hydroxylated surface (Fig. 1(c)), the calculated charge on Pd is positive (0.20 |e|). In this structure, Pd is coordinated to O-1, and there is also a change in the Mulliken charges of O-1 and Si-1 compared to the hydroxylated surface without Pd, in fact the three atoms together carry a charge of 0.20 |e|, suggesting that the partial electron transfer from Pd to the atoms at the adsorption site takes place over a longer length scale.
When Pd was adsorbed to the partially dehydrated surface to give Pd1/Six+y/2O2x+1(OH)2y−2 (Fig. 1(d)), the positive charge on Pd was found to be just over twice that seen for the hydroxylated surface. The Pd atom was effectively inserted into the siloxane ring, coordinated by O-1 and Si-2, and these atoms also had notable changes in calculated Mulliken charges compared to the clean surface. In this case, the charge on the Pd atom was almost entirely balanced by the change in charge on these immediate neighbours, with the cation charge on Si-2 reducing by 0.51 |e| with respect to the pristine surface values, suggesting that, in this case, charge transfer between the Pd and surface is a local effect.
3.2 Building stable configurations of reduced Pd2–13 nanoclusters from the Pd1-siloxane adsorption site
Following the adsorption of Pd1 within the siloxane ring on the partially hydroxylated α-SiO2(101) support surface, we proceeded to build Pd2–13 nanoclusters that utilised the Pd1-siloxane ring on the partially hydroxylated surface, Six+y/2O2x+1(OH)2y−2, as a seeding point. Several previous studies have described the systematic addition of individual Pd atoms to form stable configurations of Pd2–13 nanoclusters.67–74 We adapted the method described by Su et al.74 for building Pd2–13 nanoclusters on the partially hydroxylated SiO2 surface.This approach systematically adds Pd atoms to the growing cluster, starting from the Pd1 atom in the Pd-siloxane adsorption site. At each stage in the process, the location of the next Pd atom was selected so that it neighbours the Pd atom with the most positive Mulliken charge in the preceding cluster. In this case we use the Mulliken charges simply as a guide to position the next atom in the growing cluster with the assumption that the charge will indicate the most likely position for the added Pd atom to interact strongly with the other atoms in the cluster. The Pdn/Six+y/2O2x+1(OH)2y−2 structures were optimised after adding each new Pd atom. It was noted in previous studies68–71,74,75 that the Pdn nanoclusters could exhibit various configurations/isomers in the isolated phase and on support surfaces. Several possible configurations exist for each Pdn nanocluster.67,69,71,75 To extend the method suggested by Su et al.,74 we performed molecular dynamics (MD) simulations on each optimised Pd2–13/Six+y/2O2x+1(OH)2y−2 system using the approach given in the computational details section. Following the MD simulations, each structure was optimised again. The idea behind these MD simulations was to perturb the structures obtained from the building procedure allowing them to visit alternative configurations nearby on the potential energy surface. The Pdn/Six+y/2O2x+1(OH)2y−2 structures that were obtained by optimisations following the MD simulations are shown in Fig. 2, along with the adsorption energy calculated for each cluster following this procedure.
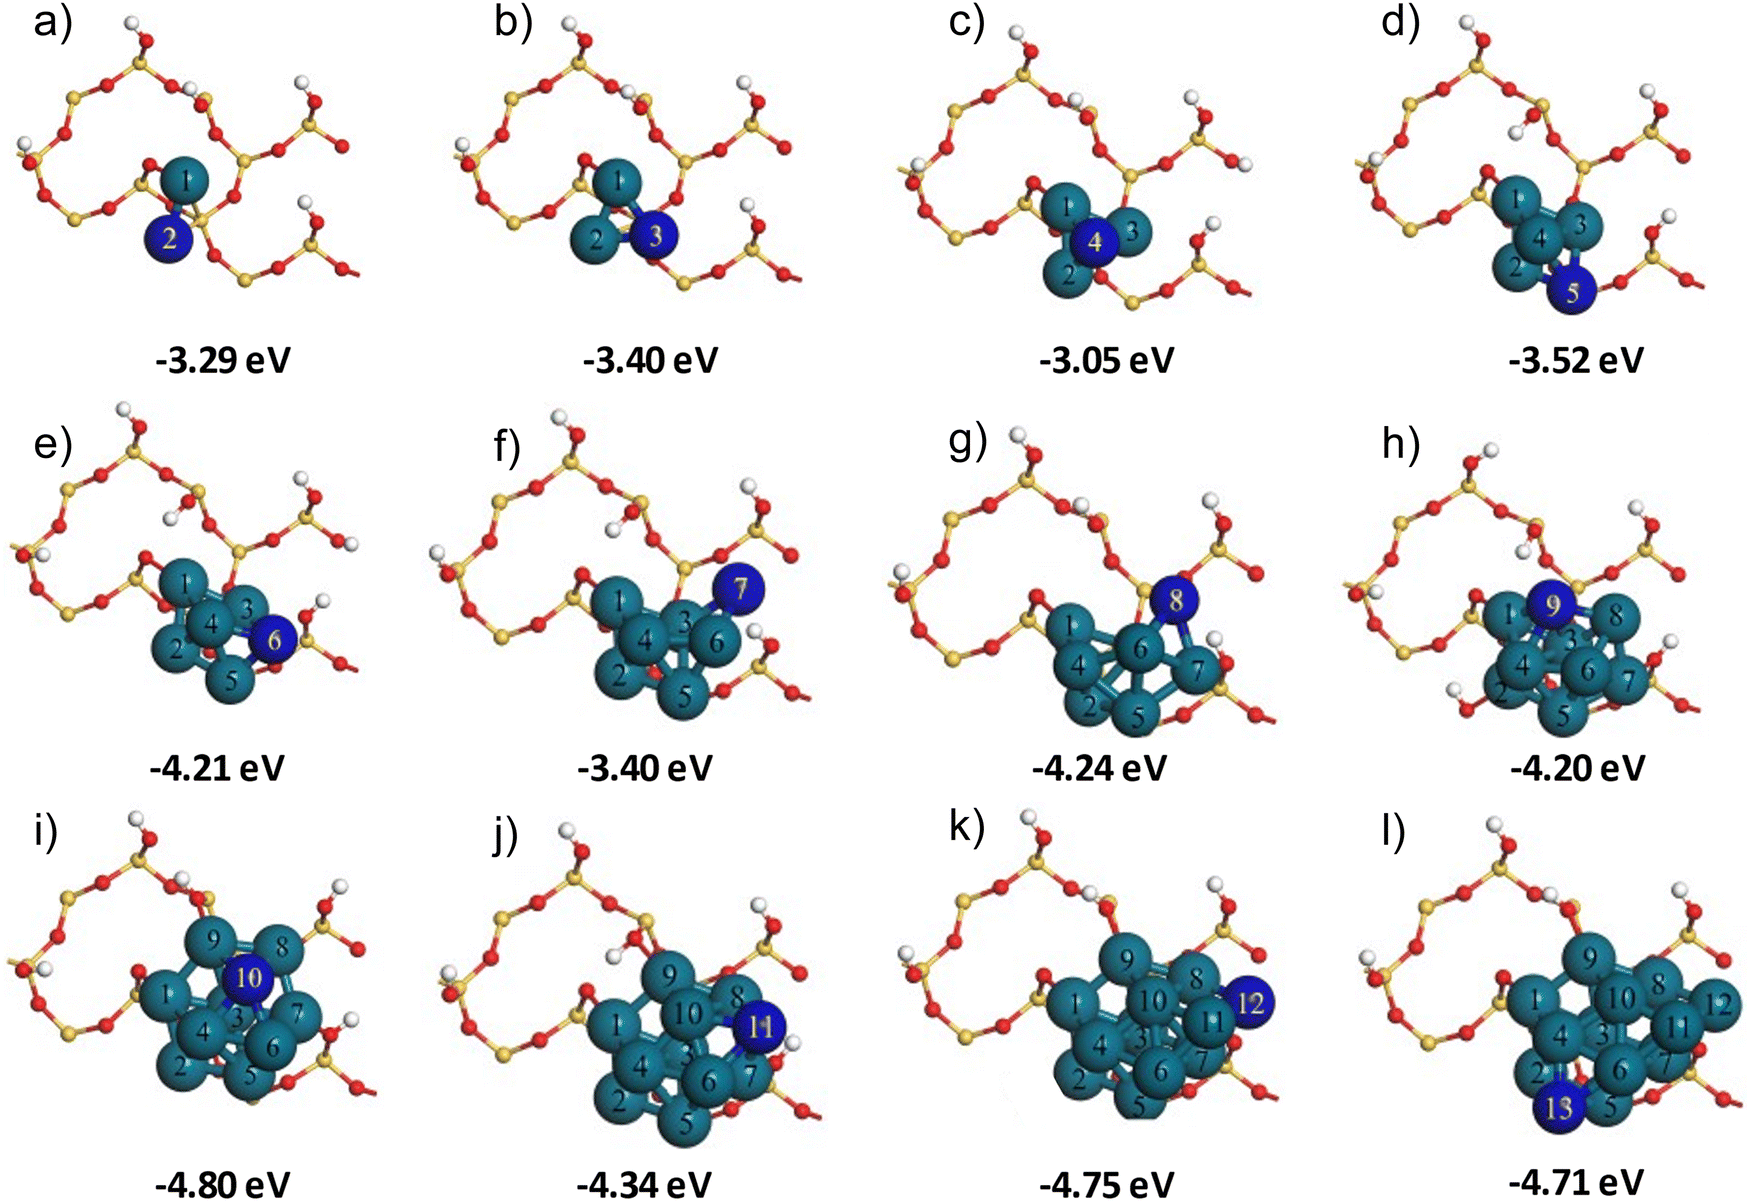 | ||
| Fig. 2 The systematic construction of Pd2–13 nanoclusters (a)–(l) from the initial Pd1 adsorption site on the hydroxylated α-SiO2(101) surface. The total adsorption energy Eads(Pdn/SiO2)_MD of each cluster is given under each image. Atom colours: Si: yellow, O: red, H: white, Pd: cyan, and last added Pd: dark blue. The 2 × 3 SiO2 unit cells contain 36 atomic layers only the top layer, is shown here for clarity. | ||
The adsorption energy for a single Pd atom through insertion into the siloxane ring is −1.86 eV (Fig. 1(d)). The dimer has a more negative adsorption energy but the value of −3.29 eV (Fig. 2(a)) is some 0.43 eV lower in magnitude than twice the adsorption energy of Pd1, meaning that the second Pd atom is more weakly interacting with the surface. The addition of a third Pd atom (Fig. 2(b)) gives a calculated adsorption energy only 0.11 eV more negative than the dimer. The fourth atom is added to the three-fold hollow site formed by the first three (Fig. 2(c)) and so is not in contact with the silica surface at all. This results in a calculated adsorption energy for Pd4 which is notably less favourable than Pd3. Addition of Pd atoms 5 and 6 does place atoms near to the silica surface and we see the adsorption energy become more negative once again. When a further Pd atom is added to Pd6 to give Pd7 (Fig. 2(f)) the atom is placed away from the silica surface, but in addition the cluster size is now close to the distance between Pd-1 in the siloxane ring and a nearby hydroxyl group, this appears to lead to some steric interactions as the calculated adsorption energy for Pd7 is some 0.81 eV less negative than that of Pd6. The steric effect is also evident at Pd10; the addition of the 10th atom leads to a more compact structure than seen for Pd9 and even though the 10th atom is away from the silica surface Pd10 has a calculated adsorption energy 0.60 eV more negative than Pd9.
The overall trend in the adsorption energy with cluster size shows that, for small clusters up to Pd6 the interaction with the surface increases with cluster size. But the rate of increase slows notably for larger clusters. The adsorption energy of Pd13 is only around 2.5 times that of Pd1, suggesting that the Pd1-siloxane ring provides an anchor site that ensures a strong cluster/support interaction which increases only slowly as more Pd atoms are added. This can also be seen in Fig. 3, where we plot the magnitude of adsorption energies per Pd atom for the Pdn clusters to the Six+y/2O2x+1(OH)2y−2 slab based on the first set of optimisation energies and from energies calculated following a further MD run and optimisation, |Eads|/n and |Eads_MD|/n, respectively. Both curves show a drop in the atom averaged adsorption energy up to cluster sizes of around Pd6, after which there appears to be convergence to around 0.38 eV (|Eads_MD|/n). For the Pd2 and Pd3 there are small differences between |Eads|/n and |Eads_MD|/n but for larger cluster sizes the two curves are practically identical. We observed that, directly after the MD calculations, the structures showed geometrical differences with the initial starting point of each run. However, on optimisation, the structures consistently returned to a geometry like that obtained from the construction process. This observation confirms that the building protocol followed here resulted in stable Pd2–13 configurations and indicates that the systematic addition of Pd atoms followed by optimisation was sufficient to obtain stable cluster configurations similar to those suggested in previous studies.67–74
 | ||
| Fig. 3 Plots of the cohesion and adsorption energies for Pdn and supported Pdn/Six+y/2O2x+1(OH)2y−2 (shorthand: Pdn/SiO2). Green circles: Pd cohesion energy for the isolated Pdn nanoclusters Ecoh(Pdn). Red symbols: the Pd cohesion energy for supported clusters with circles for structures after first optimisation and triangles for values calculated following a further MD run and optimisation, Ecoh(Pdn/SiO2) and Ecoh(Pdn/SiO2)_MD, respectively. Blue symbols: magnitude of adsorption energies per Pd atom for the Pdn clusters to the Six+y/2O2x+1(OH)2y−2 slab with circles based on first optimisation energies and triangles from energies calculated following a further MD run and optimisation, |Eads|/n and |Eads_MD|/n, respectively. All adsorption energies here are negative, but absolute values are plotted to compare trends between cohesion and adsorption energies. | ||
Fig. 3 also shows the calculated cohesion energy for Pd2–13 nanoclusters supported on the Six+y/2O2x+1(OH)2y−2 slab models, both from the optimised built structures, Ecoh(Pdn/SiO2) and after performing MD calculations followed by re-optimisation, Ecoh(Pdn/SiO2)_MD. To obtain models of the isolated Pd2–13 clusters, the Six+y/2O2x+1(OH)2y−2 slab model of the α-SiO2(101) surface was removed from the Pd2–13/SiO2 structures obtained from re-optimisation after MD simulations. The isolated clusters were then optimised again to serve as reference in adsorption energy calculations and to calculate Pd cohesion energies Ecoh(Pdn) for isolated clusters.
The data in Fig. 3 shows that the cohesion energy for the isolated Pd2–13 nanoclusters, Ecoh(Pdn), generally increased as each Pd atom was added to the cluster. The cohesion energy steadily increases with cluster size converging at around 2.25 eV, which is in good agreement with previous work.74 This estimate for the converged value of Ecoh(Pdn) was notably lower than that of the cohesive interaction estimated experimentally for the Pd bulk (3.9 eV) by Wagman et al.74,76 and computationally (4.5 eV) by Su et al.74 The smaller cohesion energies observed for the isolated Pd2–13 nanoclusters indicate that these clusters are significantly less stable than bulk Pd. In bulk Pd, all Pd atoms have 12 nearest neighbours, while in the nanoclusters studied here, the average coordination number was in the range of 1.0 to 5.4. Even in the larger clusters, only two atomic shells are present, so the Ecoh(Pdn) values would increase again if we could extend to much larger cluster sizes.
The significant energy difference seen for isolated Ecoh(Pdn) and supported Ecoh(Pdn/SiO2) in the Pd2–13 clusters can be attributed to the stabilisation effects of the SiO2 surface. By comparing Ecoh(Pdn) and Ecoh(Pdn/SiO2) in Fig. 3, it becomes clear that the interaction with the SiO2 support is a significant part of the cohesion energy of the nanoclusters. In fact, the cohesion energy we calculate for the supported cluster is roughly the sum of the cohesion energy for the isolated cluster plus the adsorption energy per Pd atom. So that for Pd2 the greater part of the cohesion energy is actually interacting with the surface but this falls to only 15% for the largest clusters.
To further study the interaction of nanoparticles with the partially hydroxylated surface we considered a representative range of the cluster sizes constructed. namely: Pd4/SiO2, Pd6/SiO2 Pd10/SiO2 and Pd13/SiO2 all using the Six+y/2O2x+1(OH)2y−2 slab model in the support. Fig. 4 shows these clusters in profile with the atom numbering following Fig. 3. This view highlights the interactions with the silica surface atoms that were in the siloxane four membered ring prior to the introduction of Pd atoms.
 | ||
| Fig. 4 Pd nanoclusters supported on the partially hydroxylated α-SiO2(101) surface support structure (Six+y/2O2x+1(OH)2y−2) with close contact to the adsorbed nanoclusters; (a) Pd4/SiO2, (b) Pd6/SiO2, (c) Pd10/SiO2 and (d) Pd13/SiO2 nanoclusters. The 2 × 3 SiO2 unit cells contain 36 atomic layers, of which most atoms were omitted for clarity. Atom colours: Si: yellow, O: red, and Pd: cyan. | ||
In Table 2, we present the Mulliken charges for atoms in these Pdn nanoclusters using the atom numbering defined in Fig. 2 and 4 alongside the Mulliken charges calculated for the corresponding isolated clusters for comparison. For all isolated clusters, the Mulliken charges sum to 0.00 |e| and for the tetrahedral geometry of Pd4, all atoms are equivalent in the isolated cluster, so the individual Pd atom Mulliken charges were also zero. Symmetry was lower for Pd6, Pd10 and Pd13, and the clusters contained atoms in different coordination environments. This leads to some charge transfer between atoms with those having higher co-ordination numbers (e.g. Pd-3) tending to have donated electron density to atoms of lower co-ordination (e.g. Pd-5 and Pd-12 or Pd-13 in Pd13).
| Structure | Atoma | ||||||||||||
|---|---|---|---|---|---|---|---|---|---|---|---|---|---|
| Pd-1 | Pd-2 | Pd-3 | Pd-4 | Pd-5 | Pd-6 | Pd-7 | Pd-8 | Pd-9 | Pd-10 | Pd-11 | Pd-12 | Pd-13 | |
| a Note: atom labels as defined in Fig. 2 and 4. b Labels in bold indicate Pd atoms in contact with the surface for Pdn/SiO2. | |||||||||||||
| Pd4 | 0.01 | 0.00 | 0.00 | −0.01 | |||||||||
| Pd4/SiO2 | 0.45 | 0.41 | 0.42 | −0.24 | |||||||||
| Pd6 | −0.03 | −0.05 | 0.10 | −0.15 | 0.07 | 0.05 | |||||||
| Pd6/SiO2 | 0.42 | 0.46 | 0.38 | −0.23 | 0.18 | −0.14 | |||||||
| Pd10 | −0.21 | 0.17 | 0.17 | 0.20 | −0.07 | −0.06 | −0.05 | −0.03 | −0.05 | −0.05 | |||
| Pd10/SiO2 | 0.32 | 0.32 | −0.07 | 0.07 | −0.02 | −0.05 | 0.29 | 0.18 | 0.07 | 0.12 | |||
| Pd13 | 0.21 | 0.14 | 0.24 | 0.25 | −0.13 | −0.08 | −0.08 | −0.01 | −0.07 | −0.08 | −0.08 | −0.18 | −0.14 |
| Pd13/SiO2 | 0.33 | 0.19 | 0.17 | 0.17 | 0.05 | 0.15 | 0.27 | 0.15 | 0.02 | 0.20 | −0.16 | 0.05 | −0.19 |
When we look at the charge difference between Pd4 and Pd4/SiO2, we notice a significant amount of charge density being transferred away from each of the individual Pd atoms in contact with the surface (bold in Table 2). Some of this charge moves to the atoms away from the surface as these have negative Mulliken charges which is also seen for the low co-ordination atoms of the isolated clusters. However, the total charge on the Pd atoms in Pd4/SiO2 is 1.04 |e| and so charge also moves from the cluster to surface Si/O atoms. The average charge on the silicon atom co-ordinated by Pd, Si-2, is 1.57 |e| across all of these structures, which is some 0.60 |e| lower than that of Si-1, a second neighbour of Pd and 0.79 |e| lower than for the same atom before Pd is added to the surface (Table 1). The total charge transfer from cluster to surface increases with cluster size. For the nanocluster in Pd13/SiO2, the total charge on Pd atoms is 1.40 |e| with Table 2 showing that most of this resides on the atoms in contact with the silica surface while the corresponding negative charge is more evenly spread among the near surface silica atoms.
3.3 Building reproducible Pdn(xO)/SiO2 systems form Pd4/SiO2, Pd6/SiO2, Pd10/SiO2 and Pd13/SiO2 starting structures
One objective of this work was to produce a method by which we can obtain highly reproducible Pdn(xO)/SiO2 systems that can serve as models for the catalyst surface state for studying the catalytic oxidation in future work. We approached this question by considering the Pd4/SiO2, Pd6/SiO2, Pd10/SiO2 and Pd13/SiO2 systems that were derived from MD simulations and re-optimisation shown in Fig. 4.To build the Pdn(xO)/SiO2 systems from the Pd4/SiO2, Pd6/SiO2, Pd10/SiO2, and Pd13/SiO2 starting structures, we followed a stepwise process of adding individual oxygen atoms to the reduced starting structures with a geometry optimisation following each oxygen addition. The adsorption site for O atoms was chosen based on the Mulliken charges of the Pd atoms in the cluster. In each case, the next oxygen atom would be placed near the most positively charged Pd atom on the nanocluster's surface. After optimising the new structure, the Mulliken charges of the Pd atoms were re-evaluated, and the next suitable Pd atom was selected to adsorb the next oxygen atom. This process was followed until the Pd nanoclusters were saturated with oxygen atoms. Saturation was reached when any additional oxygen atom added to the cluster would not adsorb on the Pd cluster. In these cases, optimisation resulted in the formation of O2 which desorbed from the cluster.
Fig. 5(a)–(d) show the structures and oxidised cluster adsorption energies to the silica support calculated using eqn (4). The structures shown were obtained by this stepwise oxidation method following the dissociative adsorption of a single oxygen molecule, i.e., Pd4(2O)/SiO2, Pd6(2O)/SiO2, Pd10(2O)/SiO2, Pd13(2O)/SiO2 and Fig. 5(e)–(h) shows the same information at the level of saturation for the cluster, i.e., Pd4(4O)/SiO2, Pd6(6O)/SiO2, Pd10(10O)/SiO2 and Pd13(10O)/SiO2.
 | ||
| Fig. 5 The structures and oxidised cluster adsorption energies to the silica support (eV) of (a) Pd4(2O), (b) Pd6(2O), (c) Pd10(2O), (d) Pd13(2O), (e) Pd4(4O), (f) Pd6(6O), (g) Pd10(10O),and (h) Pd13(10O) on the hydroxylated α-SiO2(101) support surface, (Six+y/2O2x+1(OH)2y−2). Atoms are coloured Si: yellow, O: red, H: white, and Pd: cyan. The 2 × 3 SiO2 unit cells contain 36 atomic layers, of which all except the top layer are omitted for clarity. | ||
We note that for Pd4, Pd6 and Pd10 the saturation level corresponds to the stoichiometry of PdO, while for Pd13 a lower capacity for oxygen than would be expected is found. The methodology used here concentrates on surface addition of O atoms and for Pd13 optimisation does not allow for the restructuring required for all Pd atoms to co-ordinate to added O atoms. The adsorption energies of the oxidised clusters on the partially hydroxylated SiO2 surface (see Fig. 5) show that, for all cluster sizes, the surface interaction of the Pdn(xO) nanoclusters with the SiO2 surface decreased as the number of oxygen atoms added to the nanocluster is increased.
The oxygen adsorption energies per oxygen atom with respect to O2(g) were calculated for all the clusters shown in Fig. 5 using eqn (5) for the isolated clusters and eqn (6) for supported clusters. These values of Eads(xO:PdnxO) and Eads(xO:PdnxO/SiO2) are given in Table 3.
| Pd4(2O) | Pd4(4O) | Pd6(2O) | Pd6(6O) | Pd10(2O) | Pd10(10O) | Pd13(2O) | Pd13(10O) | |
|---|---|---|---|---|---|---|---|---|
| E ads(xO:PdnxO) | −1.71 | −1.89 | −2.06 | −1.68 | −2.07 | −1.75 | −1.95 | −1.69 |
| E ads(xO:PdnxO/SiO2) | −1.49 | −1.55 | −1.70 | −1.55 | −1.95 | −1.66 | −1.87 | −1.69 |
Generally, adsorption of oxygen to isolated clusters gives a stronger, more negative, adsorption energy per oxygen atom than seen for the corresponding Pdn(xO)/SiO2 structures. This is especially the case for the smaller clusters with Eads(2O:Pd42O) − Eads(2O:Pd42O/SiO2) = −0.22 eV, but less so for the larger clusters, indeed for Pd13 the corresponding difference is only −0.08 eV. A similar trend can be seen for the clusters with saturation oxygen coverage. This indicates that, for the smaller clusters, isolated nanoparticles are more susceptible to oxidation than the same supported clusters but for larger particles the SiO2 support has a lesser influence on the reactivity of the clusters during oxidation. If we compare high and low coverages of oxygen, in most cases, the low coverage adsorption energy per O atom is more negative than the high coverage value for both isolated and supported clusters. The exception is Pd4, possibly because the Pd4O4 structure represents a fully oxidised state for the cluster with 2 Pd atoms centred in near linear O–Pd–O structures and two with O–Pd–O angles close to 90°. In bulk PdO the Pd2+ ions adopt a square planar arrangement with four co-ordinating O anions and so the structure of Pd4O4 appears to be a pre-cursor to this arrangement. In the larger clusters square planar arrangements are seen, e.g. Pd-10 in Pd10O10 (Fig. 5(g)) but there are not fully formed networks.
The oxygen–Pd interactions were also analysed based on the calculated Mulliken atomic charges, which are given in Table 4.
| Clustera | Atomb | |||||||||||||
|---|---|---|---|---|---|---|---|---|---|---|---|---|---|---|
| Pd-1 | Pd-2 | Pd-3 | Pd-4 | Pd-5 | Pd-6 | Pd-7 | Pd-8 | Pd-9 | Pd-10 | Pd-11 | Pd-12 | Pd-13 | 〈Pd〉 | |
| a Note:in the names given here the SiO2 support is omitted for the sake of brevity. b Atom labels defined in Fig. 5. c 〈Pd〉 denotes average Pd charge. For the Pdn(2O) clusters the Pd atoms co-ordinated by O have Mulliken charges in bold. | ||||||||||||||
| Pd4(2O) | 0.78 | 0.78 | 0.40 | 0.07 | 0.51 | |||||||||
| Pd4(4O) | 1.10 | 1.26 | 0.82 | 0.67 | 0.96 | |||||||||
| Pd6(2O) | 0.72 | 0.44 | 0.63 | 0.43 | 0.21 | 0.03 | 0.62 | |||||||
| Pd6(6O) | 0.85 | 0.70 | 0.99 | 0.84 | 1.07 | 0.75 | 1.30 | |||||||
| Pd10(2O) | 0.61 | 0.69 | 0.03 | 0.32 | −0.20 | 0.22 | 0.49 | 0.23 | 0.02 | 0.19 | 0.65 | |||
| Pd10(10O) | 0.81 | 0.81 | −0.03 | 0.72 | 1.01 | 1.01 | 0.76 | 0.93 | 0.85 | 0.67 | 1.89 | |||
| Pd13(2O) | 0.37 | 0.47 | 0.03 | 0.74 | 0.07 | 0.22 | 0.41 | 0.10 | 0.04 | 0.20 | −0.18 | 0.04 | 0.16 | 0.67 |
| Pd13(10O) | 0.56 | 0.58 | 0.12 | 1.07 | 0.63 | 0.53 | 0.45 | 0.32 | 0.26 | 0.75 | 0.95 | 0.66 | 0.75 | 1.91 |
This gives a comparison of Mulliken charges for individual Pd atoms in Pdn(2O)/SiO2 and saturated Pdn(xO)/SiO2 structures, with n = 4, 6, 10, and 13 and x = 4, 6, 10 and 10, respectively. For Pd4(2O)/SiO2 three Pd atoms are co-ordinated by O atoms and these have notably higher positive charge, showing electron density donated to the more electronegative O atom neighbours. The Pd atoms co-ordinated by O in Pd6(2O)/SiO2 are similarly more positively charged than Pd atoms that are further away from O atoms. This would indicate that at low oxygen coverages it is possible to have regions of the nanoparticle oxidised while other regions remain metallic. The picture is less clear for the larger particles Pd10(2O)/SiO2 and Pd13(2O)/SiO2 where Pd-7 has a significant positive charge even though it is not co-ordinated by O. Pd-7 is in close proximity to a surface hydroxyl group (Fig. 5) and even without O adsorbed on Pd this Pd atom has a positive Mulliken charge (Table 2). It appears that the partial oxidation of the cluster also enhances the charge transfer to the surface in this case. Table 4 also reports the average Mulliken charges for the Pd atoms in each cluster. This shows that charge transfer away from Pd in the saturated clusters is much greater than for the low coverage Pdn(2O)/SiO2 structures and for the larger clusters the Mulliken charge approaches the formal charge of Pd2+.
4 Conclusion
In this work, we set out to use DFT slab models for supported Pd catalysts, Pdn/SiO2 and Pdn(xO)/SiO2 to give insight into the metal–support interaction as a function of cluster size. We have also considered the effect on this interaction of oxidising the metal nanoparticles.For a single Pd atom we have found that adsorption on the hydroxylated surface with concurrent elimination of water gives a stable structure with Pd co-ordinating to surface Si and O atoms. When considering the entropy of the eliminated water the free energy of this process becomes negative around the temperature commonly used for the calcination of supported catalysts following synthesis by wet impregnation. This Pd1/SiO2 structure was then used as an anchor point for the construction of larger nanoparticles guided by the Mulliken charge analysis of the cluster at each step. This led to stable structures which maintained their integrity during short MD simulations. The adsorption energy of the cluster to the support calculated on a per Pd basis showed the most favourable values for the smallest clusters falling to a near constant value of −0.38 eV for the larger clusters. Oxidation of the clusters selected to form Pdn(xO)/SiO2 structures leads to a weakening of the nanoparticle/support interaction (compare data in Fig. 2 and 5) and the calculated adsorption energy for the clusters reduces in magnitude as oxidation increases to a saturation coverage of O atoms. Mulliken charges suggest that in the larger clusters studied here the saturation coverage of oxygen corresponds to oxidation of Pd.
In future work we will use these supported cluster models to consider the oxidation of methane in pollution control catalysis.
Data availability
Data for this article, is supplied in the Supplementary Information. Files containing the co-ordinates of structures presented as graphics in figures are available at figshare at https://doi.org/10.17035/cardiff.28130255.Conflicts of interest
There are no conflicts of interest to declare.Acknowledgements
We would like to thank Johnson Matthey plc. for providing support throughout this work, including providing a PhD studentship for CL. Computing facilities for this work were provided by Supercomputing Wales (Hawk), the Supercomputing Facilities at the Centre for High-Performance Computing (CHPC) facility in South Africa, and via our membership of the UK's HEC Materials Chemistry Consortium, which is funded by EPSRC (EP/R029431). This work used the ARCHER2 UK National Supercomputing Service (https://www.archer2.ac.uk) and UK Materials and Molecular Modelling Hub for computational resources, MMM Hub, which is partially funded by EPSRC (EP/P020194).References
- M. G. Banwell, T. E. Goodwin, S. Ng, J. A. Smith and D. J. Wong, Eur. J. Org. Chem., 2006, 3043–3060 CrossRef CAS.
- S. Cacchi and G. Fabrizi, Chem. Rev., 2005, 105, 2873–2920 CrossRef CAS PubMed.
- J. Biemolt and E. Ruijter, Adv. Synth. Catal., 2018, 360, 3821–3871 CrossRef CAS.
- F. Sadegh, O. Bagheri, M. Moghadam, V. Mirkhani, S. Tangestaninejad and I. Mohammadpoor-Baltork, J. Organomet. Chem., 2014, 759, 46–57 CrossRef CAS.
- M. Nikoorazm, A. Ghorbani-Choghamarani and A. Jabbari, J. Porous Mater., 2016, 23, 967–975 CrossRef CAS.
- Z. Pahlevanneshan, M. Moghadam, V. Mirkhani, S. Tangestaninejad, I. Mohammadpoor-Baltork and A. R. Khosropour, Appl. Organomet. Chem., 2015, 29, 346–352 CrossRef CAS.
- H. Veisi, R. Azadbakht, F. Saeidifar and M. R. Abdi, Catal. Lett., 2017, 147, 976–986 CrossRef CAS.
- S. Rezaei, A. Ghorbani-Choghamarani and R. Badri, Appl. Organomet. Chem., 2016, 30, 985–990 CrossRef CAS.
- K. A. De Castro and H. Rhee, J. Inclusion Phenom. Macrocyclic Chem., 2015, 82, 13–24 CrossRef CAS.
- S. Keshipour and N. K. Khalteh, J. Iran. Chem. Soc., 2016, 13, 1977–1982 CrossRef CAS.
- H. M. Hassan, E. M. Saad, M. S. Soltan, M. A. Betiha, I. S. Butler and S. I. Mostafa, Appl. Catal., A, 2014, 488, 148–159 CrossRef CAS.
- B. Qi, Y. Wang, L.-L. Lou, L. Huang, Y. Yang and S. Liu, J. Mol. Catal. A: Chem., 2013, 370, 95–103 CrossRef CAS.
- P. Gélin and M. Primet, Appl. Catal., B, 2002, 39, 1–37 CrossRef.
- D. Mousavi, M. H. Ardakani, S. Saeednia and M. Sabet, Res. Chem. Intermed., 2021, 47, 1105–1121 CrossRef CAS.
- V. Polshettiwar, C. Len and A. Fihri, Coord. Chem. Rev., 2009, 253, 2599–2626 CrossRef CAS.
- C. Li, B. Tang, W. Li, Q. Lu and L. Yuan, ACS Appl. Nano Mater., 2022, 5, 13055–13068 CrossRef CAS.
- G. M. Veith, A. R. Lupini, S. Rashkeev, S. J. Pennycook, D. R. Mullins, V. Schwartz, C. A. Bridges and N. J. Dudney, J. Catal., 2009, 262, 92–101 CrossRef CAS.
- S. Gueddida, S. Lebègue and M. Badawi, Appl. Surf. Sci., 2020, 533, 147422 CrossRef CAS.
- U. Das, G. Zhang, B. Hu, A. S. Hock, P. C. Redfern, J. T. Miller and L. A. Curtiss, ACS Catal., 2015, 5, 7177–7185 CrossRef CAS.
- C. A. Demmelmaier, R. E. White, J. A. van Bokhoven and S. L. Scott, J. Catal., 2009, 262, 44–56 CrossRef CAS.
- G. Pacchioni, N. Lopez and F. Illas, Faraday Discuss., 1999, 114, 209–222 RSC.
- N. Lopez, F. Illas and G. Pacchioni, J. Am. Chem. Soc., 1999, 121, 813–821 CrossRef CAS.
- A. Del Vitto, G. Pacchioni, K. H. Lim, N. Rösch, J.-M. Antonietti, M. Michalski, U. Heiz and H. Jones, J. Phys. Chem. B, 2005, 109, 19876–19884 CrossRef CAS PubMed.
- J.-M. Antonietti, M. Michalski, U. Heiz, H. Jones, K. H. Lim, N. Rösch, A. D. Vitto and G. Pacchioni, Phys. Rev. Lett., 2005, 94, 213402 CrossRef PubMed.
- C. Li, B. Tang, X. Fu, T. Zheng, L. Wang, H. Zhang, W. Li and L. Yuan, Mol. Catal., 2023, 549, 113522 CrossRef CAS.
- V. Sudheeshkumar, M. Lavier, B. Lukan, J. Shen, N. Semagina and R. W. Scott, Catal. Today, 2023, 407, 223–229 CrossRef CAS.
- D. Ciuparu, M. R. Lyubovsky, E. Altman, L. D. Pfefferle and A. Datye, Catal. Rev., 2002, 44, 593–649 CrossRef CAS.
- D. Ciuparu, E. Altman and L. Pfefferle, J. Catal., 2001, 203, 64–74 CrossRef CAS.
- D. Ciuparu and L. Pfefferle, Appl. Catal., A, 2001, 209, 415–428 CrossRef CAS.
- A. Comas-Vives, Phys. Chem. Chem. Phys., 2016, 18, 7475–7482 RSC.
- F. Rascón, R. Wischert and C. Copéret, Chem. Sci., 2011, 2, 1449–1456 RSC.
- K. W. Kolasinski, Surface science: foundations of catalysis and nanoscience, John Wiley & Sons, 2012 Search PubMed.
- Y.-W. Chen, C. Cao and H.-P. Cheng, Appl. Phys. Lett., 2008, 93, 181911 CrossRef.
- J. M. Rimsza, R. E. Jones and L. J. Criscenti, Langmuir, 2017, 33, 3882–3891 CrossRef CAS PubMed.
- S. S. Rath, H. Sahoo, B. Das and B. K. Mishra, Miner. Eng., 2014, 69, 57–64 CrossRef CAS.
- G. M. Rignanese, J. C. Charlier and X. Gonze, Phys. Chem. Chem. Phys., 2004, 6, 1920–1925 RSC.
- O. I. Malyi, V. V. Kulish and C. Persson, RSC Adv., 2014, 4, 55599–55603 RSC.
- P. N. Plessow, R. S. Sánchez-Carrera, L. Li, M. Rieger, S. Sauer, A. Schaefer and F. Abild-Pedersen, J. Phys. Chem. C, 2016, 120, 10340–10350 CrossRef CAS.
- A. V. Bandura, J. D. Kubicki and J. O. Sofo, J. Phys. Chem. C, 2011, 115, 5756–5766 CrossRef CAS.
- T. P. Goumans, A. Wander, W. A. Brown and C. R. Catlow, Phys. Chem. Chem. Phys., 2007, 9, 2146–2152 RSC.
- A. Ruiz Puigdollers, P. Schlexer, S. Tosoni and G. Pacchioni, ACS Catal., 2017, 7, 6493–6513 CrossRef CAS.
- M. Pfeiffer-Laplaud and M.-P. Gaigeot, J. Phys. Chem. C, 2016, 120, 4866–4880 CrossRef CAS.
- J. W. Han and D. S. Sholl, Phys. Chem. Chem. Phys., 2010, 12, 8024–8032 RSC.
- X. Wang, Q. Zhang, X. Li, J. Ye and L. Li, Minerals, 2018, 8, 58–74 CrossRef.
- W. Ji, Q. Tang, Z. Shen, M. Fan and F. Li, Appl. Surf. Sci., 2020, 501, 144233 CrossRef CAS.
- A. Abramov, A. Keshavarz and S. Iglauer, J. Phys. Chem. C, 2019, 123, 9027–9040 CrossRef CAS.
- M. J. Fink, K. J. Haller, R. West and J. Michl, J. Am. Chem. Soc., 1984, 106, 822–823 CrossRef CAS.
- L. Zhuravlev, Colloids Surf., A, 2000, 173, 1–38 CrossRef CAS.
- A. Grabbe, T. Michalske and W. Smith, J. Phys. Chem., 1995, 99, 4648–4654 CrossRef CAS.
- A. Rimola, P. Ugliengo and M. Sodupe, Comput. Theor. Chem., 2015, 1074, 168–177 CrossRef CAS.
- C. M. Chiang, B. R. Zegarski and L. H. Dubois, J. Phys. Chem., 1993, 97, 6948–6950 CrossRef CAS.
- C. Lombard, C. van Sittert, J. Mugo, C. Perry and D. Willock, Phys. Chem. Chem. Phys., 2023, 25, 6121–6130 RSC.
- S. J. Clark, M. D. Segall, C. J. Pickard, P. J. Hasnip, M. I. Probert, K. Refson and M. C. Payne, Z. Kristallogr. – Cryst. Mater., 2005, 220, 567–570 CrossRef CAS.
- A. H. Larsen, J. J. Mortensen, J. Blomqvist, I. E. Castelli, R. Christensen, M. Dułak, J. Friis, M. N. Groves, B. Hammer and C. Hargus, J. Phys.: Condens. Matter, 2017, 29, 273002 CrossRef PubMed.
- L. Levien, C. T. Prewitt and D. J. Weidner, Am. Mineral., 1980, 65, 920–930 CAS.
- M. Ernzerhof and G. E. Scuseria, J. Chem. Phys., 1999, 110, 5029–5036 CrossRef CAS.
- R. G. Parr, Annu. Rev. Phys. Chem., 1983, 34, 631–656 CrossRef CAS.
- D. Vanderbilt, Phys. Rev. B: Condens. Matter Mater. Phys., 1990, 41, 7892 CrossRef PubMed.
- J. Neugebauer and M. Scheffler, Phys. Rev. B: Condens. Matter Mater. Phys., 1992, 46, 16067 CrossRef CAS PubMed.
- D. J. Chadi and M. L. Cohen, Phys. Rev. B, 1973, 8, 5747 CrossRef.
- J. Singleton, Band theory and electronic properties of solids, Oxford University Press, 2001 Search PubMed.
- D. Packwood, J. Kermode, L. Mones, N. Bernstein, J. Woolley, N. Gould, C. Ortner and G. Csányi, J. Chem. Phys., 2016, 144, 164109 CrossRef PubMed.
- R. D. Johnson, NIST Computational Chemistry Comparison and Benchmark Database, https://cccbdb.nist.gov, DOI:10.18434/T47C7Z.
- M. Bonarowska, W. Juszczyk and Z. Karpiński, J. Catal., 2013, 301, 112–115 CrossRef CAS.
- M. Segall, R. Shah, C. J. Pickard and M. Payne, Phys. Rev. B: Condens. Matter Mater. Phys., 1996, 54, 16317 CrossRef CAS PubMed.
- D. Sanchez-Portal, E. Artacho and J. M. Soler, Solid State Commun., 1995, 95, 685–690 CrossRef CAS.
- M. Chuma, H. Chauke, G. Jones and P. Ngoepe, Proceedings of SAIP2013, Annual Conference of the South African Institute of Physics, 2013, pp. 8–12 Search PubMed.
- R. Hussain, M. Saeed, M. Y. Mehboob, S. U. Khan, M. U. Khan, M. Adnan, M. Ahmed, J. Iqbal and K. Ayub, RSC Adv., 2020, 10, 20595–20607 RSC.
- S.-T. Zhang, C.-M. Li, H. Yan, M. Wei, D. G. Evans and X. Duan, J. Phys. Chem. C, 2014, 118, 3514–3522 CrossRef CAS.
- A. Roudgar and A. Groß, Surf. Sci., 2004, 559, L180–L186 CrossRef CAS.
- T. Abdollahi and D. Farmanzadeh, Appl. Surf. Sci., 2018, 433, 513–529 CrossRef CAS.
- I. V. Yudanov, A. Genest, S. Schauermann, H.-J. Freund and N. Rösch, Nano Lett., 2012, 12, 2134–2139 CrossRef CAS PubMed.
- B. Huber, P. Koskinen, H. Hakkinen and M. Moseler, Nat. Mater., 2006, 5, 44–47 CrossRef CAS PubMed.
- Y.-Q. Su, J.-X. Liu, I. A. Filot and E. J. Hensen, Chem. Mater., 2017, 29, 9456–9462 CrossRef CAS PubMed.
- T. Prasomsri, D. Shi and D. E. Resasco, Chem. Phys. Lett., 2010, 497, 103–107 CrossRef CAS.
- D. D. Wagman, J. Phys. Chem. Ref. Data, 1982, 11, 1 CrossRef.
Footnote |
| † Electronic supplementary information (ESI) available. See DOI: https://doi.org/10.1039/d5cp00164a |
| This journal is © the Owner Societies 2025 |