
 Open Access Article
 This Open Access Article is licensed under a
 Creative Commons Attribution 3.0 Unported Licence
Internal vibrational energy redistribution precedes energy dissipation into the solvent upon photoexcitation of heme proteins†
Adrian
Buchmann
 a,
Luigi
Caminiti
bc,
Lion Luca
Stiewe
a,
Sebastian
Jung
d,
David M.
Leitner
e and
Martina
Havenith
*a
a,
Luigi
Caminiti
bc,
Lion Luca
Stiewe
a,
Sebastian
Jung
d,
David M.
Leitner
e and
Martina
Havenith
*a
aChair of Physical Chemistry II, Ruhr-Universität Bochum, Bochum, Germany. E-mail: martina.havenith@rub.de
bEuropean Laboratory for Non-Linear Spectroscopy, University of Florence, Florence, Italy
cDepartment of Physics and Astronomy, University of Florence, Florence, Italy
dZEMOS, Ruhr-Universität Bochum, Bochum, Germany
eDepartment of Chemistry, University of Nevada, Reno, NV 89557, USA
First published on 7th April 2025
Abstract
Efficient energy dissipation is a fundamental property of proteins that has been challenging to observe. This study investigates the mechanism of energy flow from excited heme proteins into the surrounding solvent using optical-pump THz–probe spectroscopy. The results were compared with a computational model of the energy flow. We find that the experimentally observed time constants of 6.1 ± 0.3 ps and 7.3 ± 0.4 ps for cytochrome c and myoglobin are in excellent agreement with the computational model. This suggests a diffusive energy transfer for the release of excitation energy from the excited heme group through the protein as the dominant pathway of energy flow to the surrounding solvent in heme proteins. We also observe a notable isotope effect suggesting a complex coupling of the protein to the solvent.
In nature, proteins require the ability to effectively dissipate energy. This is needed to avoid radiation damage in photosynthesis and allow communication between allosteric sites through directed energy transfer.1 The capability of proteins to conduct energy efficiently is more fundamentally linked to the nature of proteins as highly flexible structures that continuously change conformation on timescales from picoseconds to microseconds.2 This conformational flexibility naturally enables numerous energy dissipation pathways after photoexcitation. These dynamics can be selectively induced in heme proteins, by dissociating bound carbon monoxide, in a process denoted ‘protein quake’. This widely investigated phenomenon has been the focus of scientific discussion for many years.3–9 Despite extensive efforts, the molecular mechanism of the internal energy redistribution and the coupling to the solvent remains elusive.10 Ansari et al. postulated that the energy relaxation in the protein takes place in a quake-like manner via a hierarchical glass-like structure.11 Due to the highly dynamic nature of proteins and their strong coupling to the solvent observations of the energy flow have been challenging and vary depending on the observation technique. Observing the Soret band directly in transient absorption measurements, the Champion group was able to observe the oscillations in the intensity of the Soret band associated with a heme deformation called ‘doming’ when dissociating NO, lasting around 1 ps after excitation.9 In a follow-up study, they observed a 300 fs internal conversion after excitation of the heme group followed by a 1 ps relaxation time of the heme for myoglobin with bound oxygen.3
The heme group has been shown to be strongly dependent on the protein folding showing significant changes in UV-Vis absorption12 as well as changes in its ability to transfer electrons.13
Mizutani and Kitagawa studied the anti-Stokes intensity of the υ4 band in the heme group in myoglobin reporting a biphasic decay of the excited populations. The best fit to double exponentials yielded time constants of 1.9 ± 0.6 and 16 ± 9 ps for vibrational population decay in the heme group and 3.0 ± 1.0 and 25 ± 14 ps for the cooling of the photolyzed heme via energy flow to the water bath.6 In a study by the cooling of heme subsequent to photoexcitation of the carbon-monoxy myoglobin, heme was characterized by probing the spectral evolution of a porphyrin-iron charge-transfer transition near 13![[thin space (1/6-em)]](https://www.rsc.org/images/entities/char_2009.gif) 110 cm−1 (763 nm) that is sensitive to temperature. They deduced a single time constant of 6.2 ± 0.5 ps for the exponential cooling of the electronically relaxed heme.
110 cm−1 (763 nm) that is sensitive to temperature. They deduced a single time constant of 6.2 ± 0.5 ps for the exponential cooling of the electronically relaxed heme.
On the structural dynamics side, advancements in X-ray free electron lasers (X-FEL) made it possible to “film” molecular movies of ultrafast protein dynamics, and capture the protein quake in action.14 Time-resolved femtosecond crystallography, complemented by QM/MM simulations, indicated a collective response of the protein within 500 fs of photolysis of Mb that originates from the coupling of heme vibrations to global protein modes. Similarly, time-resolved solution phase small-(SAXS) and wide-angle X-ray scattering (WAXS) showed an increase in the radius of gyration (Rg) of Mb within 1 ps, followed by damped oscillations with a period of ∼3.6 ps. The oscillations were later explained from the results of molecular dynamics (MD) simulations as arising from fluctuations in the density of water surrounding the protein15
Hochstrasser et al. observed the solvent directly, probing the bend-libration combination band of D2O at 1800 cm−1 to study the heating of the solvent after photoexcitation at 580 nm. They observed a signal they attributed to a temperature change within 4 ps.16 The kinetics could be fitted to a model that consists of a fast and a slow component. The slow component (∼20 ps), with 40% of the total amplitude, is attributed to energy transfer from heme to water through the protein via a classical diffusion process. The fast component with a time constant of 7.5 ± 2 and 8.5 ± 1.5 ps for Mb and Hb, was too fast to be described by classical diffusion and was assumed to be proceeding through collective motions of the protein.
Chergui et al. utilized transient absorption spectroscopy to observe the spectral region of the Soret band in cytochrome c and were able to pinpoint both the heme relaxation at 1.8 ± 0.5 ps and the relaxation of cytochrome c at 11 ± 0.5 ps for the oxidized protein.8 They were not able to resolve the relaxation time for the ferrous cytochrome c used in this study.
The open questions are: What are the modes responsible for the fast energy transfer in proteins? Is the energy flow governed by ballistic energy transfer or can it be described as diffusive? What are the time scales for energy dissipation into the solvent? Straub and co-workers investigated the molecular mechanisms of the transfer of excess heme energy to the solvents using MD simulations and identified three distinct relaxation pathways, which can contribute to the relaxation completing in ∼5 ps: (1) “through projectile” due to interactions between the dissociated ligand and protein sidechains, (2) “through space” due to interactions between the heme and sidechains in the heme pocket, and (3) “through bond”, with the bond between the heme iron and the proximal histidine (His93). Based on a comparison of selected mutants evidence was found that the predominant channel for fast kinetic energy relaxation of the heme in native myoglobin is directed energy “funneling” through the heme side via electrostatic interaction of the propionate side chains to the surrounding solvent.17
In the present study, we want to focus on the energy flow of the excited heme into the solvent via a coupling of the protein dynamics to the solvent dynamics.18,19 Rapid transfer of energy requires an efficient coupling of the collective modes of proteins and solvent, from where it is dissipated by thermal diffusion or as a solvent quake.16,20–22 This energy transfer into the solvent should be correlated to the vibrational relaxation of the protein.1
Using our sensitive optical pump THz probe (OPTP) set-up in Bochum, we report time-resolved THz measurements monitoring the energy flow into the low-frequency water modes subsequent to photoexcitation of heme, allowing us to observe the energy flow in a less congested spectral region. Upon photoexcitation by a 400 nm laser pulse, a large amount of excess energy is selectively deposited in the heme group due to rapid internal conversion. This excess energy is redistributed to the surrounding protein moiety via intramolecular vibrational relaxation (IVR) and then to the water, where it can be probed selectively by optical pump THz probe measurements. We compare the results for myoglobin and cytochrome c with the predicted time constants and find an excellent agreement. We conclude that subsequent to photoexcitation, cooling first takes place via internal energy redistribution in the protein. Subsequent to this, the energy is transferred into the solvent primary diffusively, limited only by the thermal diffusivity of the protein matrix.
Methods
Our optical pump THz probe spectrometer is described in detail in ref. 23; briefly: 50 fs, 800 nm laser pulses were produced by a Ti:Sa amplified laser, which generated broad THz pulses via a two-color plasma filament.24 The optical pump beam was frequency-doubled to 400 nm in a BBO crystal and attenuated to a pump fluence of 13 mJ cm−2 on a spot size slightly exceeding that of the THz, which had a diameter of 400 μm (1/e2). The THz absorption was recorded as a function of pump–probe delay Δt between 0.25 ps and 300 ps. Under these conditions typical window materials with good THz transmission are prone to free carrier excitation, therefore we used a thin water jet instead.23,25–27 The thickness of the jet was determined to be 28 μm for cytochrome c and myoglobin in water and 25 μm for myoglobin in D2O. For cytochrome c in D2O, we used a nozzle with a thickness of 13 μm for the deuterated water jet. The myoglobin (equine) was obtained from Sigma Aldrich, the cytochrome c (equine) was purchased from Gerbu Biotechnik, both were used without further purification. The protein solutions (70 ml, 20.0 g L−1) were prepared in potassium phosphate buffer (pH: 7.3, molarity: 0.05 M) and filtered with syringe filters of 20 μm pore size. To exclude protein degradation an SDS PAGE was performed, and CD spectra were measured before and after the measurement. The sample was circulated through the jet for 72 hours while OPTP spectra were recorded. To mitigate foam formation, defoamer BYK 019 was added to the sample reservoir, which was cooled just above 0 °C. The THz field is detected by electro-optic sampling (EOS) using a 100 μm-thick GaP crystal. The recorded field traces are analyzed by Fourier transformation, we plot the difference between optical pump off–optical pump on as ΔmOD (milli Optical Density) values. These values indicate the transmission change induced by optically pumping the sample, where a positive ΔmOD corresponds to reduced THz transmission at that frequency. Thus, all reported signals result from optical excitation. The reported errors are the standard error of 50 consecutive measurements.Experimental results
Heme proteins are ideal molecules for studying the molecular mechanism of the energy flow in proteins. Vibrational excess energy as large as 25000 cm−1 is deposited on the heme moiety immediately after photoexcitation with an optical pulse at 400 nm, resulting from extremely fast internal conversion in less than 100 fs via the Soret transition.12
In Fig. 1a we plot transient THz spectra after excitation of a cytochrome c solution as a function of time. Within the first 0.5 ps we expect an overlap of the optical pump and THz probe, therefore we cannot take this into account for further analysis.28 This artifact signal is a convoluted response of the pump and probe beam related to a Raman response of the sample29 that decays within 0.25 ps and is observed for all investigated samples.
 | ||
| Fig. 1 (a) OPTP measurements of an aqueous cytochrome c solution as a function of time delay. (b) Transient THz spectra (vertical slices of the map) at representative pump–probe time delays (1, 5, 9, and 300 ps). The arrow serves as a guide to the eye. For comparison we plot in black the difference in absorption for bulk water upon a temperature change of 0.2 K. (c) Plot of the fitted maximum amplitude when fitting a Gaussian to the OPTP spectrum (ΔmOD) at a given time delay. The result of the fit (see eqn (1)) is shown as solid line, yielding a decay time of 6.09 ± 0.30 ps. The inset shows a zoom in for time delays between 1 ps and 20 ps. | ||
The first transient spectra at 1 ps show a maximum centered around 120 cm−1, then shifting to 110 cm−1 which increases between 1–20 ps, see Fig. 1c). For comparison, we also plot the change in absorption of bulk water when increasing the temperature by 0.2 K, see Fig. 1b.30–32 The timescales of the experiment do not allow for significant protein diffusion, thus we do not expect aggregation. For further analysis, we fitted the signal with a Gaussian function and plotted the amplitude of the Gaussian as a function of time. The amplitude increases until it reaches an equilibrium at around 30 ps, see Fig. 1c. For the fit of the data, we used eqn (1), with Coffset being the equilibrium value, τ the time constant, and A1 the maximum amplitude. The result of the fit is shown in Fig. 1c.
 | (1) |
The deduced time constants are summarized in Table 1. We have repeated the measurements for two different proteins, cytochrome c and myoglobin as well as two solvents: H2O and D2O. For cytochrome c we obtain τ = 6.1 ± 0.3 ps and τ = 7.1 ± 0.3 ps in H2O and D2O, respectively. The results for the OPTP measurements of myoglobin are shown in Fig. 3. The fitted time constants are 7.3 ± 0.4 ps and 10.3 ± 0.7 ps in in H2O and D2O, respectively. These time scales exceed the fast time scale of 2–3 ps observed for HPTS.20
| Sample | Experimental time constant τexp [ps] | Predicted time constant τcalc [ps] |
|---|---|---|
| Cytochrome c | 6.1 ± 0.3 | 5.8 |
| Cytochrome c in D2O | 7.1 ± 0.3 | 6.1 |
| Myoglobin | 7.3 ± 0.4 | 7.7 |
| Myoglobin in D2O | 10.3 ± 0.7 | 8.2 |
In order to avoid reflection at windows we use a liquid jet. The absolute amplitudes of the signals will depend on the thickness of the liquid jet which in turn depends on the viscosity of the sample and the specific nozzle (see ESI,† Table S1, and Fig. 2b), however, the rise times remain unaffected (ESI,† Fig. S1).
 | ||
| Fig. 2 Transient OPTP spectra at representative pump–probe time delays of 1–10 ps of cytochrome c in H2O (a) and D2O (b). The amplitude for cytochrome c in D2O is smaller because it was measured in a thinner jet, decreasing the signal intensity. | ||
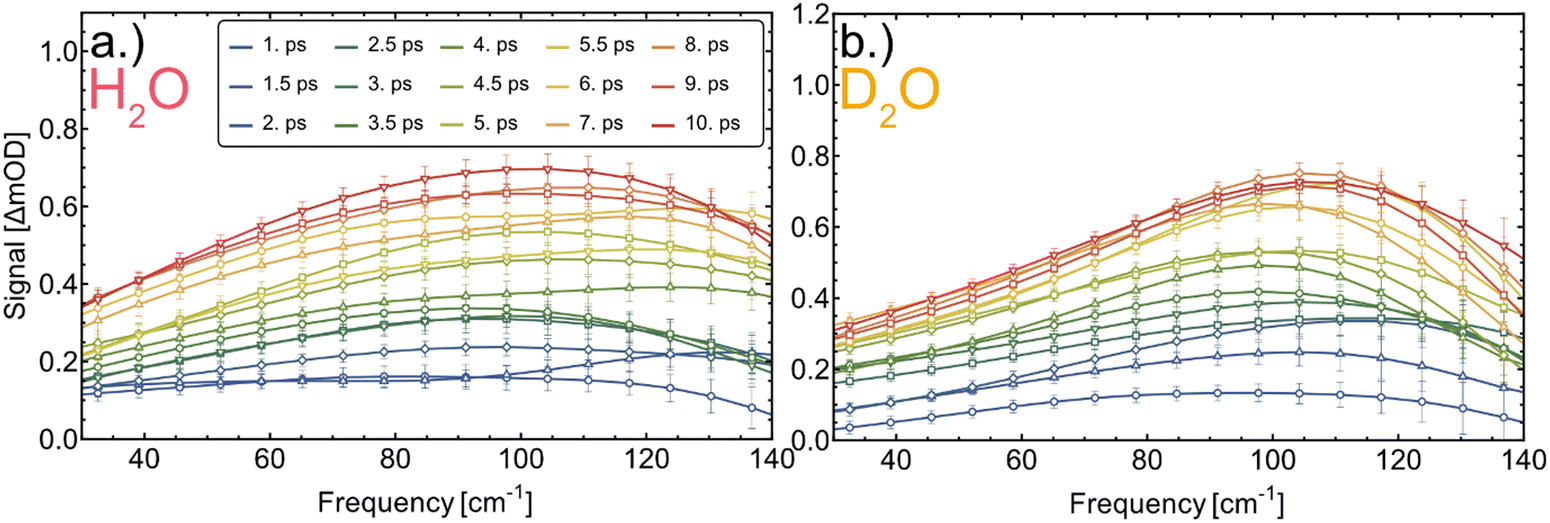 | ||
| Fig. 3 Transient THz difference spectra at representative pump–probe time delays of 1–10 ps of myoglobin in H2O (a) and D2O (b). | ||
Experimentally we find that exchanging the solvent from H2O to D2O increases the time constant τ for both proteins, by a factor of 1.16 ± 0.06 in cytochrome c and by a factor of 1.41 ± 0.08 in myoglobin.
The different time scales for energy dissipation into the solvent are visualized in Fig. 4. We plotted the normalized difference to the equilibrium value on a logarithmic scale as a function of time. The expected exponential decrease, see eqn (2) should yield a linear line, with the slope being −1/τ, see Fig. 4.
 | (2) |
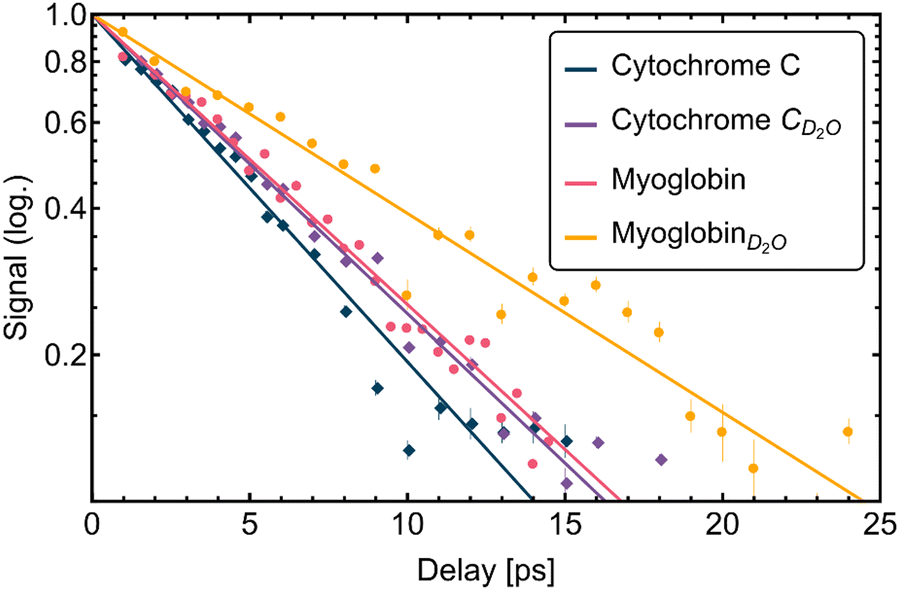 | ||
| Fig. 4 Plot of the transient amplitude signals for all samples (cytochrome c, myoglobin in H2O and D2O) and the fits obtained viaeqn (1). Data and fit were linearized with eqn (2) and the semi-logarithmic scale of the plot. | ||
Modeling results
Thermal energy in a protein has been suggested to flow primarily diffusively in experimental21 and computational studies.1,33 To model the flow of thermal energy from the heme to the surrounding water we assume, for simplicity, a spherical protein (Fig. 5(a)) where the heat source lies at the center, a picture that has been proposed in the past.34 We solve a diffusion equation for the temperature, T(r,t), where r is the distance from the center and t is time, with heat source g(r,t), | (3) |
 . Similar models have been studied to examine photothermal effects on time-resolved IR spectroscopy following photoexcitation of a solute,35 and thermal energy has been seen in computational studies to flow diffusively.36 We take the initial temperature of the system to be 288 K, consistent with the temperature at which the experiments were done, and the increase in temperature of the heme due to photoexcitation, ΔT, to be 400 K, which corresponds to the rise in temperature of the heme due to optical excitation.37–39 The heating time of the surrounding solvent does not depend on the initial temperature or on ΔT, which was checked in the numerical analysis. The time constant for the decay of excess thermal energy from the heme into the protein, τH, is set to 1 ps, and σ is taken to be an effective radius for the heating source (i.e., the heme) and is set to 3.5 Å. The values for τH and σ are reasonable and modest variation does not significantly change the time constants for heating of water surrounding the protein.
 | ||
| Fig. 5 (a) Schematic model for protein in solvent, with heat source (heme) taken as the center, where r1 is the radius of the protein and r2 is the distance from the center of the protein to the edge of the hydration shell. (b) Temperature computed for H2O (blue) and D2O (black) surrounding myoglobin; fitting to obtain the heating time, τw, of the solvent (see text for details) is shown in inset for H2O (D2O is similar), where T∞ is the temperature at long times. (c) Temperature computed for H2O (blue) and D2O (black) surrounding cytochrome c; fitting to obtain τw is shown in inset for H2O (D2O is similar). | ||
The thermal diffusivity for myoglobin has been calculated to be 14.0 Å2 ps−1,12 and we use this value for both myoglobin and cytochrome c. The thermal diffusivity for H2O near room temperature and atmospheric pressure is 14.6 Å2 ps−1 and for D2O it is 12.7 Å2 ps−1.40 Protein–water thermal boundary conductance, G, has been computed to be of order 108 W m−2 K−1,22 and we use 3 × 10⁸ W m−2 K−1, consistent with computational results for the myoglobin–water41 and cytochrome c–water42 interface. The radius of the protein (r1 in Fig. 5(a)) is taken to be 1.9 nm for myoglobin43 and 1.4 nm for cytochrome c.44 To account for the boundary conductance we replace D(r) in eqn (3) at the protein–water interface with Δr G/(ρCp) for a boundary width, Δr, of 4 Å, where Cp and ρ are the protein heat capacity and mass density, respectively. Small variation of Δr does not change the result. In the experiments, the concentration of myoglobin is 20.0 g L−1, which corresponds to a shell of water that reaches r2 = 7 nm, where r2 is the distance from the center of the protein to the edge of the hydration shell (Fig. 5(a)). The concentration of cytochrome c is 21.3 g L−1, which corresponds to a shell of water that reaches r2 = 6 nm. Eqn (3) is solved numerically by finite difference.
We compute with eqn (3) the average temperature of the solvent surrounding the protein as a function of time. The results are plotted in Fig. 5(b) for myoglobin in H2O and D2O and Fig. 5(c) for cytochrome c in H2O and D2O. For both proteins, we see the rise in temperature to be higher in H2O than D2O and somewhat faster, due to the greater thermal diffusivity of H2O compared to D2O. To obtain the heating time, τw, of the water (H2O or D2O), we fit the data plotted in Fig. 5(b) and (c) to 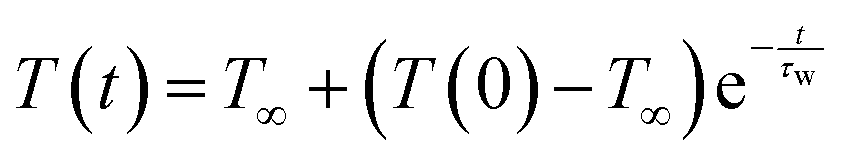 , where T∞ corresponds to the temperature at long times. For myoglobin, the heating time is obtained from a linear fit of ln(T∞ − T(t)) vs. t between 3 and 14 ps. For cytochrome c, with somewhat shorter heating times compared to myoglobin, the heating time is obtained from a linear fit of ln(T∞ − T(t)) vs. t between 2 and 13 ps. The fits are shown in Fig. 5(b) and (c) together with ln(T∞ − T(t)) for myoglobin and cytochrome c, respectively. In this way, we find for myoglobin the time constant, τw, for heating H2O to be 7.7 ps and D2O to be 8.2 ps. For cytochrome c we find τw for heating H2O to be 5.8 ps and D2O to be 6.1 ps.
Discussion
For myoglobin in D2O, we find good agreement between our experimental and predicted results of 10.3 ± 0.7 ps and 8.3 ps, respectively. These time constants also agree with the 7.5 ps time constant observed in the combination band of the bend and the libration of D2O, as reported by the Hochstrasser group.16 In addition, they reported a slower component (∼20 ps). In our data—within experimental uncertainty—we find no evidence for a slower component. This implies, that the energy transfer into the low-frequency modes of the protein and subsequent relaxation into the translational modes of the surrounding hydration water, (centered around 50–80 cm−1) is the dominant relaxation pathway. The relaxation into the MIR modes and librational band proceeds slower, on the 20 ps timescale, visible in the experiments of the Hochstrasser group but not visible in our frequency range. This is also consistent with the relaxation process in the hydrogen bond network where the relaxation happens faster into the low-frequency modes than into the bending mode of water.45When myoglobin or cytochrome c are excited via absorption in the Soret band, the heme group is electronically excited and will undergo intramolecular vibrational relaxation, thereby releasing energy into the protein matrix within 1 ps.3 Here, we report new results on the molecular mechanism for the energy flow into the solvent. We want to note, that relaxation time of the larger myoglobin matrix is increased compared to the smaller cytochrome c protein. In the model, we set the time constant for the decay of excess thermal energy from the heme into the protein to 1 ps, and an effective radius for the heating source (i.e., the heme) is set to 3.5 Å. For both proteins, we assume the same thermal diffusivity D(r) with the only difference that the effective radius is assumed to be 1.9 nm for myoglobin43 and 1.4 nm for cytochrome c.44 For the thermal protein water boundary conductance, we used the previous computational results for the myoglobin–water41 and cytochrome c–water42 interface.
We want to note that the predicted time scale of 5.8 ps for cytochrome c and 7.7 ps for myoglobin are in excellent agreement with the measured time scales of 6.1 ± 0.3 ps and 7.3 ± 0.4 ps, respectively. This confirms that the energy flow from the hot heme in the protein matrix is mostly diffusive and not directional or protein-specific.
We now want to come back to the previous assumption that fast kinetic energy relaxation of the heme in native myoglobin is directed energy “funneling” through the heme side via electrostatic interaction of the propionate side chains into the surrounding solvent.4,17
In cytochrome c the propionate side chains are less exposed to the solvent as in the case of myoglobin, however, the measured relaxation time is shorter. As a consequence, our measurements suggest that the energy transfer time scales are determined by the intramolecular energy redistribution into the protein matrix, for both myoglobin and cytochrome c. We find indications for a difference in the relaxation mechanism between cytochrome c and myoglobin: when substituting the solvent from H2O to D2O, we observe a more pronounced isotope effect for myoglobin compared to cytochrome c. Thus, for cytochrome c the intramolecular vibrational relaxation is decisive, while in the case of myoglobin, with a larger solvent-exposed surface area, the protein–water conductance appears to play a larger role: The relaxation time constant is measured to increase from 7.3 ± 0.4 to 10.3 ± 0.7 ps in the case of myoglobin, and such a large increase in time is not reproduced by our simplified model. The model predicts a longer time constant for myoglobin in D2O compared to H2O, in qualitative agreement with the experiment, but the time constant is only about 15% larger for myoglobin in D2O, whereas the measured value is about 40% larger. However, the simplified model does not take into account the molecular details of the coupling. This might dependent on the relative energy match between the low frequency modes of the propionate groups versus those of D2O/H2O, thus affecting the time for energy transfer. We note that folding is not affected by deuteration, thus the protein folding dynamics remains unchanged when replacing H2O with D2O.46
In summary, OPTP is able to sensitively probe the relaxation of the internal energy from the protein into the solvent and is complementary to more local intermolecular probes like Raman and IR. Combining OPTP measurements with theoretical modeling we can uncover the energy relaxation pathway in heme proteins: We can show that the energy relaxation in heme protein takes place via a hierarchical energy flow. While the first step occurs in about 1 ps from the hot heme into the protein matrix, the second step can be described by the thermal diffusivity of the protein matrix to the protein surface that is completed within 15 ps. The coupling to the solvent taken into account via the protein–water thermal boundary conductance seems to be more protein-specific. We propose that the difference in boundary conductance of the propionate side chains between H2O and D2O is responsible for the increase in the relaxation time by a factor of 1.41 ± 0.08 in myoglobin where the side chains are exposed, whereas the impact is smaller (factor of 1.16 ± 0.06) for cytochrome c where the side chains are not as exposed.
Data availability
All the data generated in this study has been deposited in our open-access repository: https://doi.org/10.17877/RESOLV-2025-M7NAK2E7.Conflicts of interest
There are no conflicts to declare.Acknowledgements
Support from NSF grant CHE-2245240 (DML) is gratefully acknowledged. This study has also been funded by the Deutsche Forschungsgemeinschaft (DFG; German Research Foundation) under Germany's Excellence Strategy—EXC 2033—Projektnummer 390677874. We used core facilities of the Center for Solvation Science ZEMOS funded by the German Federal Ministry of Education and Research BMBF and by the Ministry of Culture and Research of North Rhine-Westphalia.References
- D. M. Leitner, Energy Flow in Proteins, Annu. Rev. Phys. Chem., 2008, 59(1), 233–259, DOI:10.1146/annurev.physchem.59.032607.093606.
- G. Wei, W. Xi, R. Nussinov and B. Ma, Protein Ensembles: How Does Nature Harness Thermodynamic Fluctuations for Life? The Diverse Functional Roles of Conformational Ensembles in the Cell, Chem. Rev., 2016, 116(11), 6516–6551, DOI:10.1021/acs.chemrev.5b00562.
- X. Ye, A. Demidov and P. M. Champion, Measurements of the Photodissociation Quantum Yields of MbNO and MbO 2 and the Vibrational Relaxation of the Six-Coordinate Heme Species, J. Am. Chem. Soc., 2002, 124(20), 5914–5924, DOI:10.1021/ja017359n.
- Y. Gao, M. Koyama, S. F. El-Mashtoly, T. Hayashi, K. Harada, Y. Mizutani and T. Kitagawa, Time-Resolved Raman Evidence for Energy ‘Funneling’ through Propionate Side Chains in Heme ‘Cooling’ upon Photolysis of Carbonmonoxy Myoglobin, Chem. Phys. Lett., 2006, 429(1–3), 239–243, DOI:10.1016/j.cplett.2006.07.085.
- T. R. M. Barends, L. Foucar, A. Ardevol, K. Nass, A. Aquila, S. Botha, R. B. Doak, K. Falahati, E. Hartmann, M. Hilpert, M. Heinz, M. C. Hoffmann, J. Köfinger, J. E. Koglin, G. Kovacsova, M. Liang, D. Milathianaki, H. T. Lemke, J. Reinstein, C. M. Roome, R. L. Shoeman, G. J. Williams, I. Burghardt, G. Hummer, S. Boutet and I. Schlichting, Direct Observation of Ultrafast Collective Motions in CO Myoglobin upon Ligand Dissociation, Science, 2015, 350(6259), 445–450, DOI:10.1126/science.aac5492.
- Y. Mizutani and T. Kitagawa, Direct Observation of Cooling of Heme Upon Photodissociation of Carbonmonoxy Myoglobin, Science, 1997, 278(5337), 443–446, DOI:10.1126/science.278.5337.443.
- M. Mizuno and Y. Mizutani, Role of Atomic Contacts in Vibrational Energy Transfer in Myoglobin, Biophys. Rev., 2020, 12(2), 511–518, DOI:10.1007/s12551-020-00681-w.
- C. Consani, O. Bräm, F. van Mourik, A. Cannizzo and M. Chergui, Energy Transfer and Relaxation Mechanisms in cytochrome c, Chem. Phys., 2012, 396, 108–115, DOI:10.1016/j.chemphys.2011.09.002.
- L. Zhu, J. T. Sage and P. M. Champion, Observation of Coherent Reaction Dynamics in Heme Proteins, Science, 1994, 266(5185), 629–632, DOI:10.1126/science.7939716.
- H. Li, S. Wu and A. Ma, Origin of Protein Quake: Energy Waves Conducted by a Precise Mechanical Machine, J. Chem. Theory Comput., 2022, 18(9), 5692–5702, DOI:10.1021/acs.jctc.2c00514.
- A. Ansari, J. Berendzen, S. F. Bowne, H. Frauenfelder, I. E. Iben, T. B. Sauke, E. Shyamsunder and R. D. Young, Protein States and Proteinquakes, Proc. Natl. Acad. Sci. U. S. A., 1985, 82(15), 5000–5004, DOI:10.1073/pnas.82.15.5000.
- A. A. Moosavi-Movahedi, Formation of the Molten Globule-Like State of cytochrome c Induced by n-Alkyl Sulfates at Low Concentrations, J. Biochem., 2003, 133(1), 93–102, DOI:10.1093/jb/mvg008.
- A. A. Moosavi-Movahedi, J. Chamani, H. Ghourchian, H. Shafiey, C. M. Sorenson and N. Sheibani, Electrochemical Evidence for the Molten Globule States of cytochrome c Induced by N-Alkyl Sulfates at Low Concentrations, J. Protein Chem., 2003, 22(1), 23–30, DOI:10.1023/A:1023011609931.
- D. Arnlund, L. C. Johansson, C. Wickstrand, A. Barty, G. J. Williams, E. Malmerberg, J. Davidsson, D. Milathianaki, D. P. DePonte, R. L. Shoeman, D. Wang, D. James, G. Katona, S. Westenhoff, T. A. White, A. Aquila, S. Bari, P. Berntsen, M. Bogan, T. B. Van Driel, R. B. Doak, K. S. Kjær, M. Frank, R. Fromme, I. Grotjohann, R. Henning, M. S. Hunter, R. A. Kirian, I. Kosheleva, C. Kupitz, M. Liang, A. V. Martin, M. M. Nielsen, M. Messerschmidt, M. M. Seibert, J. Sjöhamn, F. Stellato, U. Weierstall, N. A. Zatsepin, J. C. H. Spence, P. Fromme, I. Schlichting, S. Boutet, G. Groenhof, H. N. Chapman and R. Neutze, Visualizing a Protein Quake with Time-Resolved X-Ray Scattering at a Free-Electron Laser, Nat Methods, 2014, 11(9), 923–926, DOI:10.1038/nmeth.3067.
- L. U. L. Brinkmann and J. S. Hub, Ultrafast Anisotropic Protein Quake Propagation after CO Photodissociation in Myoglobin, Proc. Natl. Acad. Sci. U. S. A., 2016, 113(38), 10565–10570, DOI:10.1073/pnas.1603539113.
- T. Lian, B. Locke, Y. Kholodenko and R. M. Hochstrasser, Energy Flow from Solute to Solvent Probed by Femtosecond IR Spectroscopy: Malachite Green and Heme Protein Solutions, J. Phys. Chem., 1994, 98(45), 11648–11656, DOI:10.1021/j100096a005.
- D. E. Sagnella and J. E. Straub, Directed Energy “Funneling” Mechanism for Heme Cooling Following Ligand Photolysis or Direct Excitation in Solvated Carbonmonoxy Myoglobin, J. Phys. Chem. B, 2001, 105(29), 7057–7063, DOI:10.1021/jp0107917.
- M.-C. Bellissent-Funel, A. Hassanali, M. Havenith, R. Henchman, P. Pohl, F. Sterpone, D. van der Spoel, Y. Xu and A. E. Garcia, Water Determines the Structure and Dynamics of Proteins, Chem. Rev., 2016, 116(13), 7673–7697, DOI:10.1021/acs.chemrev.5b00664.
- J. T. King and K. J. Kubarych, Site-Specific Coupling of Hydration Water and Protein Flexibility Studied in Solution with Ultrafast 2D-IR Spectroscopy, J. Am. Chem. Soc., 2012, 134(45), 18705–18712, DOI:10.1021/ja307401r.
- T. Ockelmann, C. Hoberg, A. Buchmann, F. Novelli and M. Havenith, Energy Dissipation into the Solvent during Proton Transfer Occurs via Acoustic Phonons, J. Phys. Chem. B, 2023, 127(44), 9560–9565, DOI:10.1021/acs.jpcb.3c04874.
- V. Botan, E. H. G. Backus, R. Pfister, A. Moretto, M. Crisma, C. Toniolo, P. H. Nguyen, G. Stock and P. Hamm, Energy Transport in Peptide Helices, Proc. Natl. Acad. Sci. U. S. A., 2007, 104(31), 12749–12754, DOI:10.1073/pnas.0701762104.
- A. Lervik, F. Bresme, S. Kjelstrup, D. Bedeaux and J. Miguel Rubi, Heat Transfer in Protein–Water Interfaces, Phys. Chem. Chem. Phys., 2010, 12(7), 1610, 10.1039/b918607g.
- C. Hoberg, J. J. Talbot, J. Shee, T. Ockelmann, D. Das Mahanta, F. Novelli, M. Head-Gordon and M. Havenith, Caught in the Act: Real-Time Observation of the Solvent Response That Promotes Excited-State Proton Transfer in Pyranine, Chem. Sci., 2023, 14(15), 4048–4058, 10.1039/D2SC07126F.
- X. Xie, J. Dai and X. C. Zhang, Coherent Control of THz Wave Generation in Ambient Air, Phys. Rev. Lett., 2006, 96(7), 075005, DOI:10.1103/PhysRevLett.96.075005.
- A. Buchmann; C. Hoberg and M. Havenith Improvements in Windowless Spectroscopy: 3D Printed Nozzles. In 2022 47th International Conference on Infrared, Millimeter and Terahertz Waves (IRMMW-THz); IEEE, 2022 DOI:10.1109/IRMMW-THz50927.2022.9896081.
- Y. Mizutani and T. Kitagawa, Direct Observation of Cooling of Heme Upon Photodissociation of Carbonmonoxy Myoglobin, Science, 1997, 278(5337), 443–446, DOI:10.1126/science.278.5337.443.
- P. M. Champion and R. Lange, On the Quantitation of Light Emission from cytochrome c in the Low Quantum Yield Limit, J. Chem. Phys., 1980, 73(12), 5947–5957, DOI:10.1063/1.440153.
- J. Savolainen, S. Ahmed and P. Hamm, Two-Dimensional Raman-Terahertz Spectroscopy of Water, Proc. Natl. Acad. Sci. U. S. A., 2013, 110(51), 20402–20407, DOI:10.1073/pnas.1317459110.
- J. Savolainen, S. Ahmed and P. Hamm, Two-Dimensional Raman-Terahertz Spectroscopy of Water, Proc. Natl. Acad. Sci. U. S. A., 2013, 110(51), 20402–20407, DOI:10.1073/pnas.1317459110.
- M. Heyden, J. Sun, S. Funkner, G. Mathias, H. Forbert, M. Havenith and D. Marx, Dissecting the THz Spectrum of Liquid Water from First Principles via Correlations in Time and Space, Proc. Natl. Acad. Sci. U. S. A., 2010, 107(27), 12068–12073, DOI:10.1073/pnas.0914885107.
- D. C. Elton and M. Fernández-Serra, The Hydrogen-Bond Network of Water Supports Propagating Optical Phonon-like Modes, Nat. Commun., 2016, 7(1), 10193, DOI:10.1038/ncomms10193.
- P. Schienbein, G. Schwaab, H. Forbert, M. Havenith and D. Marx, Correlations in the Solute–Solvent Dynamics Reach Beyond the First Hydration Shell of Ions, J. Phys. Chem. Lett., 2017, 8(11), 2373–2380, DOI:10.1021/acs.jpclett.7b00713.
- X. Yu and D. M. Leitner, Anomalous Diffusion of Vibrational Energy in Proteins, J. Chem. Phys., 2003, 119(23), 12673–12679, DOI:10.1063/1.1626636.
- P. Li and P. M. Champion, Investigations of the Thermal Response of Laser-Excited Biomolecules, Biophys. J., 1994, 66(2), 430–436, DOI:10.1016/S0006-3495(94)80793-3.
- M. Cho, Molecular Photothermal Effects on Time-Resolved IR Spectroscopy, J. Chem. Phys., 2022, 157(12), 124201, DOI:10.1063/5.0108826.
- T. Yamato, T. Wang, W. Sugiura, O. Laprévote and T. Katagiri, Computational Study on the Thermal Conductivity of a Protein, J. Phys. Chem. B, 2022, 126(16), 3029–3036, DOI:10.1021/acs.jpcb.2c00958.
- E. R. Henry, W. A. Eaton and R. M. Hochstrasser, Molecular Dynamics Simulations of Cooling in Laser-Excited Heme Proteins, Proc. Natl. Acad. Sci. U. S. A., 1986, 83(23), 8982–8986, DOI:10.1073/pnas.83.23.8982.
- X. Yu and D. M. Leitner, Vibrational Energy Transfer and Heat Conduction in a Protein, J. Phys. Chem. B, 2003, 107(7), 1698–1707, DOI:10.1021/jp026462b.
- D. M. Leitner, Temperature Dependence of Thermal Conductivity of Proteins: Contributions of Thermal Expansion and Grüneisen Parameter, ChemPhysChem, 2024, e202401017, DOI:10.1002/cphc.202401017.
- N. Matsunaga and A. Nagashima, Transport Properties of Liquid and Gaseous D2O over a Wide Range of Temperature and Pressure, J. Phys. Chem. Ref. Data, 1983, 12(4), 933–966, DOI:10.1063/1.555694.
- D. M. Leitner, Thermal Boundary Conductance and Thermal Rectification in Molecules, J. Phys. Chem. B, 2013, 117(42), 12820–12828, DOI:10.1021/jp402012z.
- J. K. Agbo; Y. Xu; P. Zhang; J. E. Straub and D. M. Leitner, in Vibrational Energy Flow across Heme–Cytochrome c and Cytochrome c–Water Interfaces, ed. S. E. Gregory, S. Keshavamurthy and S. Wiggins, Springer Berlin Heidelberg, Berlin, Heidelberg, 2015, vol. 7, pp. 129–138 DOI:10.1007/978-3-662-47377-1_11.
- D. Eliezer, P. A. Jennings, P. E. Wright, S. Doniach, K. O. Hodgson and H. Tsuruta, The Radius of Gyration of an Apomyoglobin Folding Intermediate, Science, 1995, 270(5235), 487, DOI:10.1126/science.270.5235.487.
- S. Akiyama, S. Takahashi, T. Kimura, K. Ishimori, I. Morishima, Y. Nishikawa and T. Fujisawa, Conformational Landscape of cytochrome c Folding Studied by Microsecond-Resolved Small-Angle x-Ray Scattering., Proc. Natl. Acad. Sci. U. S. A., 2002, 99(3), 1329–1334, DOI:10.1073/pnas.012458999.
- J. Yang, R. Dettori, J. P. F. Nunes, N. H. List, E. Biasin, M. Centurion, Z. Chen, A. A. Cordones, D. P. Deponte, T. F. Heinz, M. E. Kozina, K. Ledbetter, M. F. Lin, A. M. Lindenberg, M. Mo, A. Nilsson, X. Shen, T. J. A. Wolf, D. Donadio, K. J. Gaffney, T. J. Martinez and X. Wang, Direct Observation of Ultrafast Hydrogen Bond Strengthening in Liquid Water, Nature, 2021, 596(7873), 531–535, DOI:10.1038/s41586-021-03793-9.
- H. Susi, S. N. Timasheff and L. Stevens, Infrared Spectra and Protein Conformations in Aqueous Solutions, J. Biol. Chem., 1967, 242(23), 5460–5466, DOI:10.1016/S0021-9258(18)99381-6.
Footnote |
| † Electronic supplementary information (ESI) available. See DOI: https://doi.org/10.1039/d5cp00797f |
| This journal is © the Owner Societies 2025 |