
 Open Access Article
 This Open Access Article is licensed under a
 Creative Commons Attribution 3.0 Unported Licence
Electronic structure of aqueous nitrite and nitrate ions from resonant inelastic X-ray scattering†
Sebastian
Eckert
 *a,
Laurenz
Otto
a,
Eric J.
Mascarenhas
ab,
Annette
Pietzsch
a,
Rolf
Mitzner
a,
Mattis
Fondell
a,
Vinícius
Vaz da Cruz
a and
Alexander
Föhlisch
ab
*a,
Laurenz
Otto
a,
Eric J.
Mascarenhas
ab,
Annette
Pietzsch
a,
Rolf
Mitzner
a,
Mattis
Fondell
a,
Vinícius
Vaz da Cruz
a and
Alexander
Föhlisch
ab
aHelmholtz-Zentrum Berlin für Materialien und Energie GmbH, Institute for Methods and Instrumentation for Synchrotron Radiation Research, 12489 Berlin, Germany. E-mail: sebastian.eckert@helmholtz-berlin.de
bUniversität Potsdam, Institut für Physik und Astronomie, 14476 Potsdam, Germany
First published on 11th April 2025
Abstract
In a comparative synchrotron X-ray absorption, non-resonant X-ray emission and resonant inelastic X-ray scattering investigation of aqueous nitrite and nitrate ions, we access both their unoccupied and occupied valence electronic structures. Complementary information is gained through the sensitivity to specific orbitals at the nitrogen and the oxygen 1s absorption edges. In particular, scattering through the pronounced 1s → π* resonances in combination with the scattering anisotropy and symmetry selection rules allow for an unambiguous assignment of molecular orbitals to their detected spectroscopic fingerprints. The nuclear dynamics in the 1s core-excited states are discussed in the context of the vibrational substructure of the detected spectral lines and signatures of core-excited state symmetry breaking are characterized through an analysis of the excitation energy detuning dependent spectra in combination with the involved potentials. A comparison between TD-DFT based spectrum simulations for isolated molecules and sampled structures from a QM/MM simulation reveals signatures of symmetry breaking induced by the solute–solvent interactions and a different response of spectral signatures of in- and out-of-plane orbitals to the solution environment.
1 Introduction
Nitrite and nitrate ions are omnipresent in environmental processes through their use in fertilizers, in the chemical industry and as a preservative in the food industry.1,2 Therefore, their detection3,4 and the analysis of their impact on living organisms in biological systems1,5,6 has received incessant attention. The photochemical dissociation of both systems in solution, with strong absorption bands in the range of deep UV radiation, is discussed as a source of reactive radicals inducing subsequent reactions in environmental and atmospheric processes.7,8 Investigations on the presence of nitrate in the form of nitric acid on atmospheric aerosols or ice have been enabled through surface sensitive X-ray photo-electron spectroscopy techniques.9 Especially the distinct signature of an O–H σ* absorption feature in the spectra allowed determining the propensity of nitric acid formation on ice surfaces under supercooled conditions.10 Quantum chemical effects have been proven to largely affect the solvation dynamics of nitrite11 and nitrate12,13 in a hydrogen bonded aqueous environment, yielding a more diffuse coordination with the solvent environment, especially for nitrate,14 than predicted by classical molecular dynamics simulations. These methods have also been combined with X-ray absorption spectroscopy to investigate the unoccupied electronic structure of the fluctuating weakly coordinating nitrate and nitrite ions in the context of ion pairing in concentrated solutions.15Here, we use bulk sensitive K-edge X-ray absorption spectroscopy, X-ray emission and resonant inelastic X-ray scattering to investigate the impact of solvation on the electronic structure of aqueous nitrite and nitrate ions in the ground state distribution of molecular geometries and distorted molecular structures induced by the 1s core-excitations. Scattering through the 1s → π* resonances at the nitrogen and the oxygen edge provides access to the full occupied electronic structure of the anions and allows identifying distinct signatures of occupied molecular orbitals down to binding energies of 30 eV.
2 Experimental and computational methods
The experimental nitrogen K-edge RIXS spectra were recorded using the EDAX experiment at the UE49_SGM beamline of the synchrotron light source BESSY II, Helmholtz-Zentrum Berlin. The details of the setup have been described by Kunnus et al.16 In short, the solutions of aqueous sodium–nitrite and sodium–nitrate at a concentration of 1 M were introduced into the experimental vacuum chamber in a liquid jet with a diameter of 20 to 30 μm. The sample was excited using synchrotron radiation monochromatized in the UE49_SGM beamline with photon energies at the nitrogen and oxygen 1s absorption resonances at either horizontal or vertical polarisation and a bandwidth of roughly 0.2 eV and 0.35 eV, respectively. The emitted radiation was spectrally dispersed and detected using a Scienta XES 350 spectrometer in a 90° scattering geometry. To compare spectra recorded for different polarisation of the exciting radiation, they were normalized to the total detected intensity in the interval from 40 eV to 60 eV energy loss at the nitrogen edge and the interval from 20 eV to 30 eV energy loss at the oxygen edge. A minute contamination of the oxygen edge RIXS spectra through a solvent background is discussed in the ESI.† Supporting measurements were performed in the AXSYS-nmTransmission NEXAFS experiment using the UE52_SGM beamline.The quantum chemical simulations were performed using version 5 of the Orca package.17 For simulations of isolated systems, molecular geometries were optimized using the DFT/PBE0 level of theory with the ma-def2-TZVP(-f) basis,18,19 the def2/J auxiliary basis20 and the atom-pairwise dispersion correction with the Becke–Johnson damping scheme (D3BJ).21,22 The aqueous environment was treated implicitly using a conductor-like polarizable continuum model (CPCM).23 Nitrogen K-edge X-ray emission spectra were modeled using dipole moments between the occupied valence orbitals and the nitrogen 1s orbital. Electronic RIXS transition amplitudes were calculated in the restricted subspace approximation (RSA) TD-DFT framework described by Vaz da Cruz et al.24 20 virtual orbitals were considered in the acceptor space. As only closed-shell systems are treated in bound states, the simulations were carried out based on a restricted Kohn–Sham determinant. The 1s → π* potential energy curves along normal modes were simulated within the Z + 1 equivalent core approximation, as potentials from TD-DFT have a tendency to underestimate core-excited state dynamics.24 Additionally, optimized geometries using a converged determinant for the 1s → π* excited state25 are compared to ones resulting from the Z + 1 equivalent core approximation in the ESI.† The distortions agree qualitatively with minor quantitative differences in bond lengths and angles. This confirms the validity of the geometric distortions derived from the potentials within the Z + 1 equivalent core approximation.
The TD-DFT simulations of spectra at the oxygen K-edge were performed for localized and delocalized core-holes to assess the impact of symmetry breaking within the femtosecond scattering duration through the core-excited Jahn–Teller effect. Note that these simulations use the ground-state determinant as a reference. The set of oxygen 1s derived near degenerate Kohn–Sham orbitals were localized via the Pipek–Mezey method and included individually or collectively in the TD-DFT donor space to either consider or neglect interference of scattering channels through the corresponding energetically degenerate 1s core-excited states. Spectrum simulations of explicitly solvated structures, extracted from trajectories of QM/MM simulations were also carried out in the RSA-TD-DFT framework. The structures originate from published QM/MM trajectories calculated by Vchirawongkwin et al.11,13 100 snapshots were randomly selected from the trajectories for each of the ions. The cutoffs for the selection of water molecules in proximity of the ions are given in the ESI.† To generate an average solvated spectrum, the RIXS simulations (with an increased acceptor space of 40 virtual orbitals) for the snapshots were sampled on the same incident photon energy grid, the X-ray absorption spectra and the RIXS maps were convoluted with a Gaussian accounting for the incident photon energy bandwidth. A 0.75 eV broadening along the energy loss axis of all presented theoretical RIXS spectra was applied. The spectra at the maximum of the individual resonances in the PFY of the resulting RIXS planes were averaged to generate the presented spectra. Oxygen edge RIXS spectra for individual structures were omitted, if the involved oxygen 1s orbitals were delocalized across multiple oxygen atoms. The simulated X-ray absorption spectra were shifted by 11.4 eV at the nitrogen and 12.8 eV at the oxygen K-edge. The simulated nitrogen K-edge X-ray emission spectra were shifted by 20.9 eV. Visualisations of orbital iso-surfaces were prepared using VMD at an iso-value of 0.04. The radial distribution functions presented in the ESI† were also generated using VMD.26
3 Results and discussion
3.1 Electronic structure and X-ray absorption spectra
The nitrogen K-edge X-ray absorption spectra of nitrite and nitrate have been investigated in previous studies in the context of a concentration dependent ion pairing effect in solution.15 Here, we summarize the link between the X-ray absorption spectra at the nitrogen and oxygen K-edges and the electronic structure in Fig. 1. The nitrogen K-edge absorption spectra of nitrite and nitrate depicted in Fig. 1b exhibit both strong and sharp π*-resonances at 401.47 eV and 405 eV and a broad σ* absorption band in the intervals between 405 eV to 416 eV and 410 eV to 420 eV for nitrite and nitrate respectively. The spectrum of nitrite exhibits a distinct σ* absorption feature at the onset of the absorption band at 405.9 eV. Note that the experimental spectra were shifted to align the π*-resonance of nitrate at 405 eV. This resonance energy of nitrate has been reported by Smith et al.15 as well as by Kleine et al.27 The π*-resonances correspond to excitations from the nitrogen 1s derived 2a1 and 3a1 orbitals to the 2b2 and 3b2 orbitals for nitrite and nitrate, respectively. The energetic shift between the resonances of 3.53 eV agrees well with the shift of 3.7 eV reported by Smith et al.15 considering that the spectra displayed in Fig. 1 were recorded on different days. The day to day energy stability of the used monochromator is ∼0.1 eV. Considering the orbital energies in Fig. 1a, it becomes clear that the chemical shift between the resonances does not originate from altered valence orbital energies, but from a shift of the core-level binding energy through the additional N–O bond in nitrate compared to nitrite. Note, that the discussions in this section are based on simulations considering only an implicit impact of solvation on the spectra. The discussed origin of the chemical shift was derived by Smith et al. Their prediction of the energetic position of the π*-resonances at the oxygen K-edge below the resonances of the water solvent background were correct, enabling the analysis of these resonances, which are presented in Fig. 1c. The experimental spectra were shifted to align the water 4a1 resonance in the spectra at 535 eV. The position of the π*-resonances shifts only by 0.76 eV between nitrite and nitrate (a factor 4.6 lower than at the nitrogen edge), which is linked to the fact that the energy of the oxygen 1s derived orbitals 1b1, 1a1 and 2a1 (in the case of nitrate) is only 0.5 eV lower for the nitrate ion. The presence of the third oxygen has thus a major charge abstracting effect at the nitrogen site, whereas the electron delocalization towards the additional oxygen atom has less severe impact on the energy of the oxygen 1s derived orbitals. | ||
| Fig. 1 Comparison of the electronic structure in nitrite and nitrate. (a) Kohn–Sham orbital energies and visualization of the oxygen and nitrogen 1s derived core- and the π*-orbitals. (b) X-ray absorption spectra at the nitrogen and oxygen K-edge with distinct π* resonances exhibiting shifts linked to the 1s–π* energy differences. | ||
3.2. Nitrogen K-edge X-ray emission spectra
Having characterized the transition from the 1s derived orbitals to the antibonding virtual orbitals, in particular the π* LUMO, we will now focus on the investigation of the occupied orbitals through nitrogen K-edge X-ray emission and resonant inelastic X-ray scattering at both edges. To rationalize the spectral signatures in the nitrogen K-edge X-ray emission spectra of the two systems, we consider the dipole moments between the occupied valence orbitals and the nitrogen 1s orbital. The orbitals in Fig. 2c and d are assigned to the emission lines in the spectra in Fig. 2a and b. Note that the considered orbitals are optimized for the NO2/3− anions in their ground state geometry imposing C2v symmetry constraints, even though nitrate belongs to the D3h point group. In the performed comparison in the so-called frozen orbital approximation, it is assumed that the nuclear geometry, as well as the orbitals remain unaffected by the nitrogen 1s core-ionization. This approximation is more justified for non-resonant than for resonant excitation conditions, as no anti-bonding orbitals are populated through the core-excitation. Still, ultrafast dynamical processes in the core-ionized state can invalidate this approximation. Here, we use orbital energies and frozen-orbital derived transition moments as a first indication for the origin of the detected spectral features. Combination with a TD-DFT based full state description of the RIXS process will allow understanding details of the spectroscopic signatures, which are inaccessible through the frozen orbital scheme. | ||
| Fig. 2 Orbital information from nitrogen K-edge X-ray emission. Experimental emission spectra for nitrite (a) and nitrate (b) at an excitation photon energy of 450 eV and theoretical emission intensities for decay from occupied orbitals. (c) and (d) Orbital visualization corresponding to the emission channels labeled in (a) and (b). | ||
In the X-ray emission spectrum of nitrite, a pronounced emission line at 399.5 eV is detected, whereas nitrate exhibits only a very subtle intensity increase in this energy range. For nitrite this intensity originates dominantly from decay from a mostly non-bonding valence orbital 6a1 with local in-plane lone pair character at the nitrogen site. This orbital is absent in nitrate in exchange for the σ-bonding orbital 8a1 to the additional oxygen, which exhibits a smaller amplitude at the central nitrogen atom. It also loses its nitrogen 2p character, as an additional sign change occurs along the O–N bond in comparison to nitrite. Generally, the higher lying orbitals with Kohn–Sham orbital energies between −10 eV and 0 eV are located rather on the oxygen sites, which results in a comparably low decay probability into the nitrogen 1s hole from these orbitals.
In the case of nitrite the strongest emission line peaking at 393.9 eV originates from decay from the bonding in- and out-of-plane π-orbitals 5a1 and 1b2 as well as from the bonding 3b1 σ-orbital directly along the N–O bonds. These three orbitals clearly have strong nitrogen, but also oxygen, 2p character and are energetically close-lying, resulting in the high emission intensity for the related transitions. The weaker emission lines at lower emission energies resemble decay from the symmetric 3a1 and the antisymmetric 2b1 orbitals. Their oxygen 2s character causes their binding energy below −10 eV and differentiates them from the other discussed orbitals.
For nitrate, the most intense emission line at 395.3 eV results from decay from the 1b2, 3b1 and 7a1 orbitals which essentially reflect the corresponding orbitals in nitrite with 2p admixture of the additional oxygen atom. The emission line at lower photon energies around 382 eV probes decay from the oxygen 2s derived orbitals 2b1 and 5a1, which are energetically almost degenerate. The orbital character for the detected emission lines is therefore fully analogous for the two systems with the nitrite 6a1 lone pair emission line and the splitting of the lines related to the oxygen 2s derived molecular orbitals as the main difference between the nitrogen K-edge emission spectra of the two systems.
Here, we would like to highlight the importance of the presence of the nitrite 6a1 orbital for the detected spectroscopic signatures. The high electronegativity of oxygen withdraws electron density from the nitrogen forming the σ bonding 8a1 orbital in nitrate. The spectroscopic signatures of the red shifted X-ray absorption resonance and the presence/absence lone-pair emission line are analogous to nitrogen K-edge signatures of protonation of nitrogen sites, which have been used as a fingerprint in various XAS28–33 and RIXS34–38 studies. Interestingly the oxygen 2p derived 5a1, 1b2 and 3b1 orbitals of nitrite and 1b2, 3b1 and 7a1 of nitrate exhibit an energetic shift similar to the nitrogen 1s orbital towards lower energies, inducing a much smaller energy shift of the strongest nitrogen K-edge emission line compared to the shift detected for the absorption resonances.
3.3. Nitrogen and oxygen K-edge RIXS at the 2b2 π*-resonances of nitrite
We turn towards the resonant inelastic X-ray scattering spectra of nitrite, recorded for scattering through the nitrogen π*- and σ*-resonances in Fig. 3a. The spectra are shown on an energy loss scale allowing assignment of the spectral signatures to electronically excited states relative to the ground state energy. This change of energy scale is easy to follow considering the energy ranges for decay from deep and high lying molecular orbitals, which were introduced in the context of the XES discussion. At ∼3.5 eV loss the in-plane 6a1 orbital contributes. In addition, transitions extending from energy losses of 0 eV to approximately 3 eV are detected. These correspond to electronically elastic scattering processes into vibrationally excited final states, which will be analysed based on the ground- and core-excited state potentials illustrated in Fig. 3c. Note, that the polarisation anisotropy for these two transitions is inverse for excitation at the π*-resonance, whereas they exhibit the same anisotropy (higher scattering intensity for χ = 90°) for excitation at the σ*-resonance. This inverse behavior of the polarisation anisotropy of the two transitions is reproduced by the simulations and results from the orientation of the excited 2b2 and 7a1 orbitals out-of and in the molecular plane respectively. | ||
| Fig. 3 Polarisation dependent nitrogen K-edge RIXS of nitrite. (a) Experimental RIXS spectrum at the σ*- and detuning series at the π*- resonance for horizontal and vertical excitation with variations in elastic line asymmetry and intensity changes in the electronically inelastic channels as signs of core-excited state dynamics. (b) Simulation of RIXS at the 1s → 2b2 (bottom) and 1s → 7a1 (top) resonances modeling the polarisation anisotropy of the 6a1 emission band at the two resonances and allowing us to determine the substructure of the emission band at 10 eV energy loss. (c) Potential energy scans along the symmetric stretch and bending coordinate in the core excited state (CES) within the Z + 1 equivalent core approximation exhibiting minima shifted with respect to the ground-state (GS) configuration, thereby inducing the dynamical signatures in the spectra in (a). The minimum of the ground-state potential was shifted to the Franck–Condon point of the core-excited state potential. | ||
Let us focus on the transitions at ∼10 eV energy loss for excitation at the π*-resonance related to decay from the oxygen 2p derived orbitals. We detect a clear asymmetry for these transitions. Comparison with the simulated spectra reveals that the more intense fraction of the peak towards lower energy loss is related to decay from the in-plane 3b1 and 5a1 orbitals, which also induces the same polarisation anisotropy as for the 6a1 decay channel. The less intense shoulder at higher loss is formed by transitions into final states characterized mainly by 1b2 → π* excitations. The two features are not as well separated in the experimental as in the simulated spectrum, because the spectral broadening through the vibrational fine structure, final state lifetimes, as well as the solvation induced distribution of the transition energies are not taken into account. These aspects are likely also the reason for the strong underestimation of the high energy shoulder between 13 and 15 eV loss in the spectrum simulation for excitation at the σ*-resonance.
Based on the potential energy curves along the two symmetric modes of nitrite in Fig. 3c, the vibrational substructure of the detected electronically elastic scattering intensity results mainly from excitation along the symmetric-stretch coordinate of nitrite. The core-excited state potential along this coordinate exhibits a shift of the potential minimum to Q = 2.2 and a sizable gradient at the ground state configuration at Q = 0. The potential along the bending coordinate is comparably shallow and exhibits a shift only to Q = 1.1. We thus expect the vibrational progression to consist of mainly symmetric stretch excitation in combination with few bending overtones. The potential along the anti-symmetric stretch mode, visualized in the ESI,† is not shifted from the ground state minimum. Therefore, no dynamics along non-symmetric directions are expected upon creation of the nitrogen 1s core-hole.
Through the RIXS detuning series at the oxygen 1s → 2b2 resonance of nitrite, displayed in Fig. 4a, we get additional access to the 4a1, 1a2 and 4b1 orbitals which are visualized in Fig. 4c. To assign the detected spectral signatures, we compare the detuned spectra with the spectrum simulation for delocalized core-holes and full interference between the RIXS channels, and the resonant spectra with the ones for localized core-holes without interference between scattering channels at the different sites. This different treatment between negatively detuned and resonant spectra is necessary, because the core-excited Jahn–Teller effect induces symmetry breaking within the femtosecond core-hole lifetime.39–42 This in turn causes a localization of the core-hole and quenches the interference effects due to the reduced overlap between the core-excited state wavepackets on the two oxygen 1s core-excited state surfaces. Detuned conditions reduce the effective scattering duration and cause a partial restoration of the symmetry selection rules. This, in combination with the polarisation anisotropy gives us an ideal tool to assign the additional transitions detected in the RIXS spectra. This procedure has proven useful in orbital assignment and the assessment of symmetry breaking within the core-hole lifetime from RIXS measurements of gas-phase molecules41,43 and larger organic samples. Recently, the concepts were transferred to symmetry breaking of molecules in a liquid-environment.36,44–46
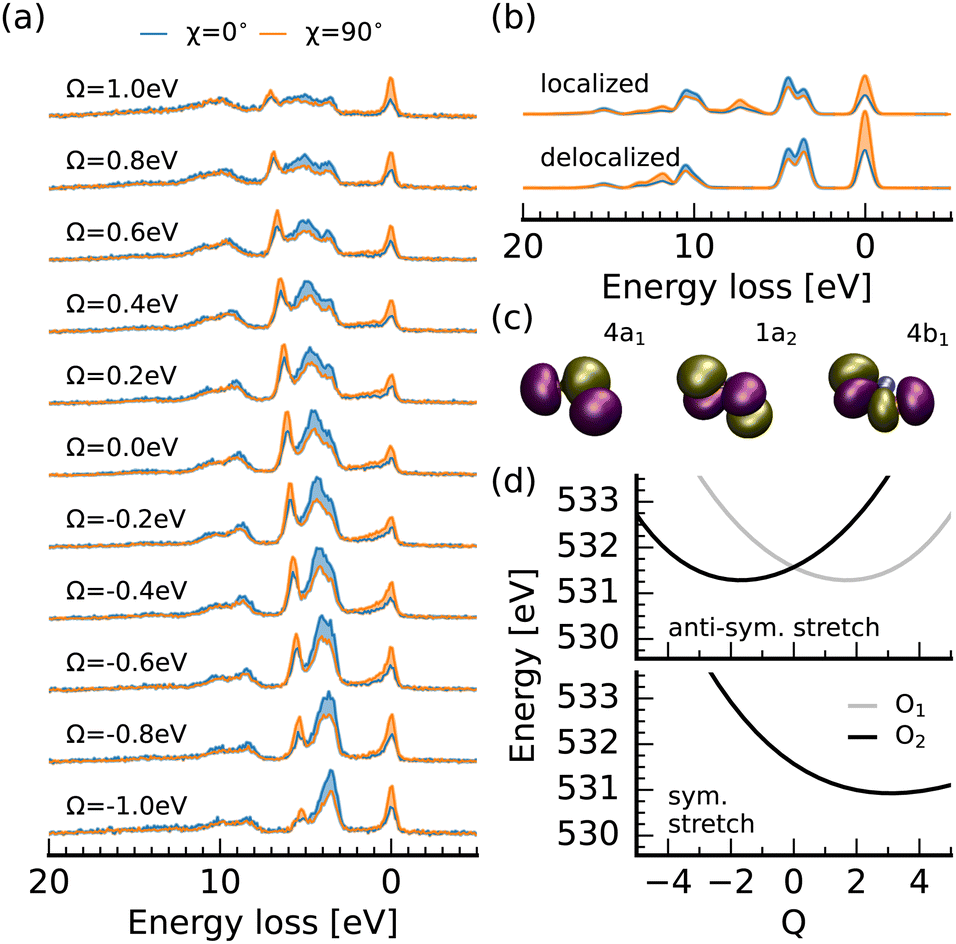 | ||
| Fig. 4 Polarisation dependent oxygen K-edge RIXS of nitrite. (a) Experimental detuning dependent RIXS spectra for horizontal and vertical excitation at the π*-resonance. (b) RIXS simulations for excitation of the oxygen 1s → 2b2 resonance for (de)localized core-holes modeling the loss of symmetry selection rules induced by core-excited state dynamics. (c) Visualization of the 4a1, 1a2 and 4b1 orbitals, which were inaccessible at the nitrogen edge but show spectroscopic fingerprints at the oxygen edge. (d) Z + 1 equivalent core excited state potentials for 1s excitation at the individual oxygen atoms along the (anti-)symmetric stretching coordinate. | ||
We start by considering the spectrum for a detuning of Ω = −1 eV in comparison to the simulated spectrum for delocalized oxygen 1s orbitals. The emission band at an energy loss around 10 eV is formed through RIXS transitions into the same final states generating the main emission line at the nitrogen edge. In contrast, the emission band between 3 and 5 eV loss is not exclusively formed through final states characterized by excitations from the 6a1 orbital. The shoulder towards higher losses results from excitations from the 4b1 orbital which has the same polarisation anisotropy as the 6a1 transitions (inverse to the electronically elastic scattering channel), due to the in-plane orientation of both orbitals. Tuning towards the top of the 2b2 π*-resonance, the 4b1 line becomes more intense than the 6a1 line at lower losses and a sharp emission line between 5 and 7 eV loss with the same scattering anisotropy as the elastic channel arises. Both signatures result from the quenching of interference between scattering-channels filling the core-holes at the two oxygen sites and are reproduced in the simulated spectrum for localized core-holes. Due to the non-parallel alignment of the oxygen 2p lone-pairs, which form the 4b1 orbital, interference induces a partial cancellation of the scattering amplitude for the corresponding channel. For the 1a2 orbital the decay moments at the two oxygen sites are fully anti-parallel causing a full cancellation through interference under detuned conditions. This interference is suppressed by the core-hole induced symmetry breaking in the RIXS spectra for resonant excitation. This effect is seen in the emission line in the experimental spectrum between 5 and 7 eV energy loss. The theoretical spectrum shows the corresponding transition between 7 and 8 eV energy loss. We additionally detect a weak emission feature at a loss of 15 eV corresponding to decay from the 4a1 orbital, which is even weaker in the nitrogen edge spectra due to the strong nitrogen 2s character of the 4a1 orbital.
Considering the potential energy curves modeling the oxygen 1s core-excited states in Fig. 4d, we see that both the symmetric and the anti-symmetric stretch potentials are shifted substantially from the ground state minimum. This activation of a combination of symmetric and anti-symmetric modes has been observed in core-excited states of other systems.44,47 Only the potential along the antisymmetric stretching coordinate shows the splitting for excitation at the different oxygen sites, characteristic for the core-excited Jahn–Teller effect, which induces the suppression of symmetry selection rules for resonant excitation. The potential along the bending coordinate, presented in the ESI,† shows an even smaller shift from the ground-state minimum than for excitation at the nitrogen 1s → 2b2 resonance of only Q = 0.4.
3.4 Nitrogen and oxygen K-edge RIXS at the 3b2 π*-resonances of nitrate
The nitrogen K-edge RIXS spectra at the 3b2 π*-resonance of nitrate, presented in Fig. 5a, exhibit an intense spectral feature between 10 and 13 eV energy loss and two features with comparably low intensity between 5 eV to 8 eV and 21 eV to 26 eV energy loss. The theoretical spectrum allows an assignment of the weakest emission line at 6.3 eV energy loss to excited states characterized by an excitation from the 4b1 and 8a1 (see Fig. 2d and Fig. 6b) orbitals to the 3b2 orbital. The more intense emission band between 21 eV and 26 eV energy loss results from decay from the 2b1 and 5a1 orbitals. Due to the in-plane orientation of these two orbitals, the weak polarisation anisotropy of this band is inverse to the anisotropy at the elastic line. For these two spectral signatures, the orbital character derived from full state description in the TD-DFT simulations agrees well with the assignment resulting from the crude frozen orbital scheme used to interpret the XES spectra. | ||
| Fig. 5 Polarisation dependent nitrogen K-edge RIXS of nitrate. (a) Experimental RIXS detuning series at the π*-resonance for horizontal and vertical excitation. (b) Simulation of RIXS at the 1s → 3b2 resonance. (c) Potential energy scans along the symmetric stretch and umbrella coordinate in the core excited state (CES). Dynamics in the CES are induced mainly through the high slope of the symmetric stretch potential at the ground state (GS) molecular geometry Q = 0. The minimum of the ground-state potential was shifted to the Franck–Condon point of the core-excited state potential. | ||
 | ||
| Fig. 6 Polarisation dependent oxygen K-edge RIXS of nitrate. (a) Experimental detuning dependent RIXS spectra for horizontal and vertical excitation at the π*-resonance. (b) RIXS simulations for excitation of the oxygen 1s → 3b2 resonance for (de)localized core-holes modeling the loss of symmetry selection rules induced by core-excited state dynamics. (c) Visualization of the 6a1, 4b1, 1a2, 2b2 and 5b1 orbitals, which were inaccessible at the nitrogen edge but show spectroscopic fingerprints at the oxygen edge. (d) Z + 1 equivalent core excited state potentials for 1s excitation at the individual oxygen atoms along two symmetry reducing normal modes. | ||
For the emission band between 10 eV and 13 eV, we detect a single emission line with a weak polarisation anisotropy. The theoretical spectrum exhibits two emission lines with inverse anisotropy. The feature at 11.9 eV loss is related to RIXS final states characterized by excitation from the in-plane 3b1 and 7a1 orbitals, whereas the emission line at 14.1 eV is formed through RIXS transitions dominated by excitations from the 1b2 bonding π-orbital into the 3b2 π*-orbital. In solid-state RIXS measurements of ammonium- and lithium-nitrate, these transitions were labeled π-band,48,49 whereas our assignment suggests a mixed character of the transitions based on the involved 3b1 and 7a1 orbitals with partial σ-character. The experimentally detected band shows only a weak anisotropy, whereas the theoretically predicted emission lines exhibit a more pronounced but inverse scattering anisotropy. We therefore believe that splitting between the two transitions is overestimated in the theoretical spectra. The origin of this effect can be four-fold. Firstly, the TD-DFT state energies and scattering intensities could be inaccurate. Secondly, core-excited state nuclear dynamics can cause a final state dependent intensity variation and shift of the central position of the emission bands. Another aspect which has proven to impact relative spectral intensities in nitrogen K-edge RIXS of nitrate salts are final state lifetime broadening effects,48,49 which are also not included in our model. Finally, the solute–solvent interaction can have an impact on the peak positions and intensities. The last aspect will be discussed in detail in Section 4.
To consider the impact of core-excited state dynamics on the spectra, we analyse the Z + 1 potentials in Fig. 5c. Even though nitrate has six vibrational degrees of freedom, the symmetric excitation at the nitrogen 1s orbital induces motion along the symmetric stretching and the umbrella mode. We illustrate the potentials only along these modes. The potentials along the additional modes are illustrated in the ESI.† Due to the much larger slope of the stretching potential at Q = 0 we predict the vibrational progression at the electronically elastic scattering band around 0 eV loss to consist dominantly of stretching excitations dressed with few excitations along the umbrella mode. Let us compare the vibrational progression of the elastic line with the one for nitrite. A gradual decay of the intensity towards higher losses is detected for nitrate, whereas a more structured, abruptly decaying progression is observed for nitrite. These different envelopes of the vibrational structures of the two emission bands can be rationalized based on the much smaller shift for the symmetric stretch core-excited state potential in nitrite. There the wavepacket reflects at the potential barrier within the scattering duration. In contrast, the potential for nitrate exhibits an almost twofold shift allowing the wavepacket to delocalize towards larger Q values and decay without a significant contribution of the wavepacket fraction reflected at the barrier within the scattering duration.
Overall, the spectral shape of the electronically inelastic transitions is unaffected by the detuning Ω of the excitation photon energy from the resonance. The vibrational progression is reduced, as the effective scattering duration is shortened. This insensitivity of the 10 eV to 13 eV emission band to the excitation energy detuning is indicative of a non-dynamical origin of the absence of the energetic splitting between the theoretically predicted σ- and π-orbital emission lines.
Scattering through the oxygen 1s → 3b2 π*-resonance yields, as it did for nitrite, access to the oxygen 2p derived non-bonding orbitals. The detuning series of RIXS spectra is compared to the spectrum simulations in Fig. 6. Again, we make use of the scattering anisotropy, the degeneracy of the three oxygen 1s levels and the resulting symmetry selection rules, as well as their breakdown through the core-excited Jahn–Teller effect to facilitate the assignment of the detected electronic transitions.
The main emission line in the detuned spectrum (Ω = −1 eV) at 5 eV to 7 eV energy loss has only a weak anisotropy with higher intensity for horizontal excitation (χ = 0°). With the aid of the strongest emission line in the theoretical spectrum considering interference for the delocalized core-holes, this intensity can be attributed to decay from the 4b1 and 8a1 orbitals which are illustrated in Fig. 6c and 2d, respectively. Both the excitation and the decay dipole moments for these orbitals are almost parallel at the three different oxygen sites. Hence, the scattering amplitudes add up constructively.
The intensity at losses of ∼4 eV results from decay from the 5b1 orbital. This transition should not be detectable due to the 120° angle between the decay moments. This condition is experimentally not achievable, as it would require detuning values far off the resonance. Even then, the solvent induced symmetry breaking, as well as non-dipole terms contributing a dependence of the decay moments on the nuclear coordinates50 could impede a complete suppression of the scattering intensity. This 5b1 emission line, which has the same anisotropy favoring scattering for horizontal excitation due to the in-plane orientation of the orbital, gains intensity upon reduction of the detuning.
Additionally, the high energy loss flank of the previously discussed 4b1/8a1 emission line gains intensity and inverts the polarisation anisotropy in favor for vertically polarised excitation (χ = 90°). Considering the simulated spectrum for localized core-holes without interference, we can assign this intensity gain to the additional close lying transition characterized by decay from the 1a2 and 2b2 orbitals. Their antiparallel orientation of the decay moments at the oxygen sites causes the suppression of the line and their out-of-plane orientation induces the anisotropy inversion compared to the emission lines discussed before.
At 11.9 eV we detect the final states, which caused the highest scattering intensity at the nitrogen edge (see Fig. 2 and 5) and are mainly characterized by decay from the 3b1 and 7a1 orbitals. These orbitals are visualized in Fig. 2d. Here, the non-parallel alignment of the decay moments induces an intensity increase when the excitation energy is tuned in resonance (Ω → 0).
Experimentally, we detect a comparably weak scattering intensity at losses between 14 and 17 eV. At losses of 14.1 eV and 15.2 eV the scattering intensity for the 1b2 → 3b2 and 6a1 → 3b2 excited states is predicted theoretically. The former state might be energetically closer to the 3b1/7a1 → 3b2 transitions, whereas the latter shows a full suppression of the scattering cross-section due to the orientation of the orbital strictly along the N–O bonds. Note that the experimentally detected intensity in this energy range is affected by the solvent emission creating a broad background, which is discussed in more detail in the ESI.† Considering the comparison to the measurements without the nitrate solute, we can safely say that the previously discussed emission line at 11.9 eV is clearly detected in the experimental spectra.
Let us assess the dynamics in the oxygen 1s → 3b2 core-excited states inducing the suppression of the destructive interference effects on the detected transitions. Generally, all modes of nitrate except for the symmetric stretching mode reduce the symmetry from the D3h ground state configuration. Here, we discuss two selected cases based on the exemplary depicted Z + 1 potentials in Fig. 6d which reduce the symmetry to Cs and C2v. The potentials along all normal mode coordinates are illustrated in the ESI.† The dynamics along the Cs stretching mode cause a dephasing of all three core-excited state wave-packets for the 1s holes at the individual oxygen sites. In contrast, the dynamics along the second mode, which reduces the symmetry to C2v, has identical potentials for core-holes at two of the oxygen sites of nitrate. As the minima of both types of potentials for modes reducing the symmetry have a sizable shift to the ground state minimum at Q = 0, the core-excited state dynamics cause the substantial quenching of the symmetry selection rules detected in the experimental spectra.
4 Solvation signatures at the different edges
To estimate the impact of solute–solvent coordination on the X-ray absorption and RIXS spectra of nitrite and nitrate, we compare spectrum simulations for optimized molecular geometries to averaged spectra from snapshots from a QM/MM simulation including water molecules within the first solvation shell of the solute in Fig. 7. A comparison between classical molecular dynamics (MD) simulations and ab initio MD simulations for aqueous nitrate has shown that the classical schemes predict a too tight and structured first solvation shell of the solute.14 It has been shown that this shortcoming can be overcome in a QM/MM framework. We use the QM/MM trajectories calculated by Vchirawongkwin et al.11,13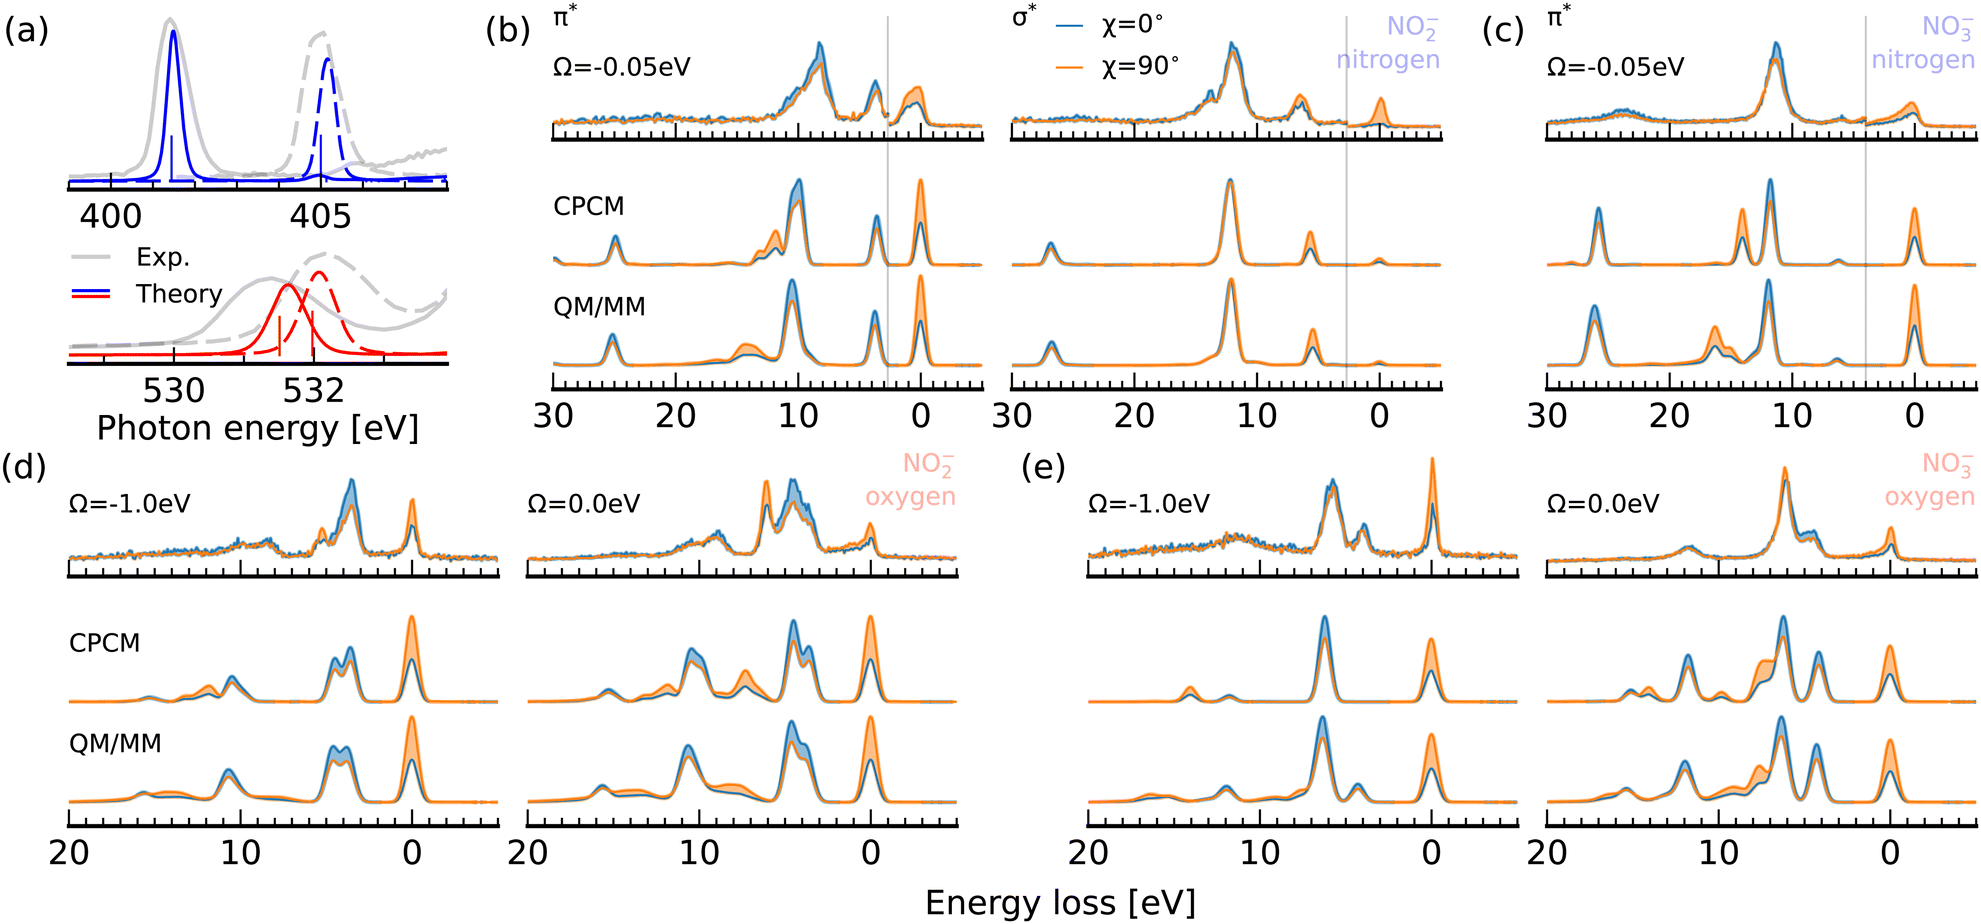 | ||
| Fig. 7 Impact of explicit solvation on the electronic structure of nitrite and nitrate. (a) X-ray absorption spectra of nitrite (solid) and nitrate (dashed) for CPCM (vertical bars) and QM/MM (continuous curves) solvation models in comparison to the experimental PFY spectra (grey) at the nitrogen (top) and oxygen (bottom) edges. (b)–(e) Experimental RIXS spectra (top) at the nitrogen and oxygen edges for nitrite (b) and (d) and nitrate (c) and (e) compared to simulations (bottom) within the two solvation models. | ||
The averaged absorption spectra at both the nitrogen and oxygen 1s edges are shown for the explicitly solvated structures in Fig. 7a in comparison to the experimental data and the simulations using the implicit CPCM solvation model. Our results are in agreement with previous studies, which have focused on the fact that both resonance energies as well as relative spectral intensities have proven to be rather insensitive regarding a possible association of nitrite and nitrate with counter-ions in concentrated solutions. It is therefore not striking that the inclusion of solvation in our simulations in addition to the incident photon energy bandwidth induces a broadening of the π*-resonances below the one of the experimentally detected absorption bands, as they exhibit additionally a vibrational substructure, which is not taken into account in the presented simulations. We can report a shift of the resonances with respect to the implicit CPCM solvation model at the nitrogen and oxygen edge for nitrite of 0.04 eV and 0.14 eV respectively. The respective shifts for nitrate are 0.16 eV and 0.11 eV. The stronger impact of solvation at the oxygen edge of the asymmetric nitrite results from the non-homogenous solvation structure within the molecular plane. The spectral shift is largest at the oxygen edge, as the oxygen sites are expected to be the hydrogen bond acceptors. Interestingly, all π*-resonances are blue-shifted, which often reflects an increased core-level binding energy through a reduction of electron density at the respective atomic site. In this model, the explicitly solvated structures thus exhibit only a slightly higher charge abstraction from the ions than the implicit solvation model predicts. It has to be noted that the theoretical spectrum for nitrite even overestimates the blueshift in comparison to the energetic separation of the resonances in the experimental spectra. For nitrate, the weak impact of solvation on the π*-resonance underlines the general classification of the solvated ion as weakly hydrogen bonded to the solvent water molecules at the oxygen sites.
In contrast to the X-ray absorption spectrum, the effect of solvation on the K-edge RIXS spectra depicted in Fig. 7b–e is sizable. Let us start by analyzing the RIXS spectra at the nitrogen edges of nitrite and nitrate in Fig. 7b and c, respectively. At the 2b2 π*-resonance of nitrite, the 1b2 emission band, which exhibits the same polarisation anisotropy as the elastic line, exhibits a ∼2.5 eV shift towards higher losses and undergoes a strong broadening. This broadening is reflected in an intensity reduction of the emission band compared to the 3b1/5a1 emission band, which is not broadened as strongly. The same effect is noted in the RIXS spectrum of nitrate in Fig. 7c. Here, the 1b2 band is also the only emission band, which is strongly broadened and shifted towards higher losses in the spectrum generated from explicitly solvated structures. In neither of the experimental spectra is an emission line with the corresponding polarisation anisotropy detected for losses higher than 10 eV. The high energy shoulder between 13 and 15 eV detected in the experimental spectrum of nitrite at the σ*-resonance in Fig. 7b is present in the simulated spectra sampled from QM/MM structures.
Let us consider RIXS through the oxygen K-edge π*-resonance of nitrite and nitrate in Fig. 7d and e, respectively. For nitrite, the symmetry forbidden 1a2 emission line between 5 and 6 eV energy loss, which is not fully quenched in the detuned experimental spectrum at Ω = −1.0 eV, gains intensity upon explicit solvation. The corresponding line emerges in the simulated spectrum for explicitly solvated structures at ∼8 eV energy loss. The spectrum for resonant excitation at Ω = 0.0 eV shows a broadening of this emission line originating from decay from the orbital with out-of-plane lone-pair character. Decay amplitudes and energy losses of the in-plane orbitals remain mostly unaffected by the explicit treatment of the solvent environment. For nitrate, we can report an excellent agreement between the detuned experimental spectra at Ω = −1.0 eV and the QM/MM sampled simulation in Fig. 7e, which nicely shows the lifting of the selection rule for the 5b1 in-plane lone pair emission line under symmetry distortions induced by the solvent. The most prominent effect in the resonant spectrum is again the broadening of the out of plane 1a2/2b2 emission line. In the experimental spectrum this broadening is not clearly detected.
5 Conclusions
We demonstrate that the occupied valence orbitals of both nitrite and nitrate ions in solution can be sensitively accessed through XAS, XES and RIXS of the nitrogen and oxygen K-edges. The energetic shift of the nitrogen edge absorption spectrum coincides with the presence and absence of the in-plane nitrogen lone-pair orbital. Explicitly, the formation of the 8a1 N–O σ-orbital in nitrate (instead of 6a1 in nitrite) shifts the entire nitrogen absorption spectrum through the 1s core-level shift and drastically reduces the intensity of the related emission feature. This effect is analogous to protonation dependent absorption shifts and lone-pair orbital emission feature intensity variations in nitrogen containing heterocycles. In the case of nitrite and nitrate, the relative intensity of this lone-pair emission line is comparably weak due to the stronger nitrogen 2p character of other orbitals and their reduced delocalization induced by the smaller size of the molecules.RIXS through the nitrogen 1s → π*-resonances confirms the 6a1 and 8a1 assignment to the emission features at the highest emission energy (lowest energy loss) derived from the non-resonant X-ray emission spectra through their different scattering intensity and scattering anisotropy for nitrite and nitrate respectively. It also allows rationalizing the asymmetry of the strongest emission band, formerly denoted the π band, reflecting an energetic splitting of excited states characterized by in-plane and out-of-plane 2p derived orbitals in nitrite with the 1b2 π orbital exhibiting the highest excited state energy. This splitting is not observed for nitrate, even though it is predicted theoretically. The elastic scattering channel reveals pronounced signatures of dynamics on the core-excited state potential with dominant involvement of the symmetric stretch coordinate. For nitrite, the shape of the vibrational progression indicates a reflection of the core excited state wavepacket within the core-hole-lifetime. Future investigation of these vibrational progressions with higher resolution could reveal the intricate details of the coordination with the surrounding solvent molecules through the alteration of the ground and core excited state potential along the symmetric stretch mode.
Oxygen edge RIXS gives additional access to non-bonding oxygen 2p derived orbitals at low binding energies. The assignment of the corresponding spectral signatures was facilitated through a combination of symmetry selection rules and scattering anisotropy and the strong detuning dependence of the emission intensities. In this context, the core-excited Jahn–Teller effect and the multitude of symmetry reducing modes of nitrate which are activated upon oxygen 1s excitation were discussed.
The spectrum simulations for explicitly solvated structures exhibit blue shifts of the π* X-ray absorption resonances smaller than 0.16 eV indicating only a minor abstraction of electron density by the surrounding water molecules from all sites in the two ions in a core-level shift picture. Deeper analysis of the local charges and the valence orbital structure in the explicitly solvated snapshots is required to verify this indication. The simulated RIXS spectra at both edges indicate a dominant response of the out-of-plane molecular orbitals as a consequence of the solute–solvent interactions, reflected by a broadening induced intensity reduction of the corresponding emission lines. The in-plane emission lines remain nearly unaffected. This effect is not reflected in the experimental data and thus requires further investigation. Solvent induced symmetry breaking effects among the emission lines from in-plane orbitals are particularly well described for nitrate.
Overall the comparison between the experimental X-ray absorption, emission and RIXS data and the DFT based electronic structure and spectrum simulations allowed access to all valence orbitals of the two anions except for the 4a1 orbital of nitrate. For both systems, vibrational core-excited state dynamics strongly affect the intensities and line shapes of the electronically elastic, as well as the selection rules and line-shapes of inelastic scattering channels. The analysis of the core-excited state potentials in this work can be used as a starting point in high resolution investigations of the vibrational substructure of the discussed RIXS transitions.
Data availability
Data supporting the results discussed in the manuscript are included in the ESI.† Additional information and data will be provided upon request by the corresponding author.Conflicts of interest
There are no conflicts to declare.Acknowledgements
We thank the Helmholtz-Zentrum Berlin for the allocation of synchrotron radiation beamtime. We thank Viwat Vchirawongkwin for providing the QM/MM trajectories of aqueous nitrite and nitrate.Notes and references
- S. Chamandoost, M. Fateh Moradi and M.-J. Hosseini, J. Hum., Environ., Health Promot., 2016, 1, 80–86 Search PubMed.
- S. Singh, A. G. Anil, V. Kumar, D. Kapoor, S. Subramanian, J. Singh and P. C. Ramamurthy, Chemosphere, 2022, 287, 131996 Search PubMed.
- M. Moorcroft, Talanta, 2001, 54, 785–803 Search PubMed.
- P. Singh, M. K. Singh, Y. R. Beg and G. R. Nishad, Talanta, 2019, 191, 364–381 Search PubMed.
- J. O. Lundberg, E. Weitzberg and M. T. Gladwin, Nat. Rev. Drug Discovery, 2008, 7, 156–167 Search PubMed.
- R. Picetti, M. Deeney, S. Pastorino, M. R. Miller, A. Shah, D. A. Leon, A. D. Dangour and R. Green, Environ. Res., 2022, 210, 112988 Search PubMed.
- J. Mack and J. R. Bolton, J. Photochem. Photobiol., A, 1999, 128, 1–13 Search PubMed.
- M. Gen, Z. Liang, R. Zhang, B. R. Go Mabato and C. K. Chan, Environ. Sci.: Atmos., 2022, 2, 111–127 Search PubMed.
- A. Krepelová, J. Newberg, T. Huthwelker, H. Bluhm and M. Ammann, Phys. Chem. Chem. Phys., 2010, 12, 8870 Search PubMed.
- G. Marcotte, P. Ayotte, A. Bendounan, F. Sirotti, C. Laffon and P. Parent, J. Phys. Chem. Lett., 2013, 4, 2643–2648 Search PubMed.
- S. Vchirawongkwin, C. Kritayakornupong, A. Tongraar and V. Vchirawongkwin, Dalton Trans., 2014, 43, 12164–12174 Search PubMed.
- A. Tongraar, P. Tangkawanwanit and B. M. Rode, J. Phys. Chem. A, 2006, 110, 12918–12926 Search PubMed.
- V. Vchirawongkwin, C. Kritayakornupong, A. Tongraar and B. M. Rode, J. Phys. Chem. B, 2011, 115, 12527–12536 Search PubMed.
- J. Thøgersen, J. Réhault, M. Odelius, T. Ogden, N. K. Jena, S. J. K. Jensen, S. R. Keiding and J. Helbing, J. Phys. Chem. B, 2013, 117, 3376–3388 Search PubMed.
- J. W. Smith, R. K. Lam, O. Shih, A. M. Rizzuto, D. Prendergast and R. J. Saykally, J. Chem. Phys., 2015, 143, 084503 Search PubMed.
- K. Kunnus, I. Rajkovic, S. Schreck, W. Quevedo, S. Eckert, M. Beye, E. Suljoti, C. Weniger, C. Kalus, S. Grübel, M. Scholz, D. Nordlund, W. Zhang, R. W. Hartsock, K. J. Gaffney, W. F. Schlotter, J. J. Turner, B. Kennedy, F. Hennies, S. Techert, P. Wernet and A. Föhlisch, Rev. Sci. Instrum., 2012, 83, 123109 Search PubMed.
- F. Neese, WIREs Comput. Mol. Sci., 2022, 12, e1606 Search PubMed.
- F. Weigend and R. Ahlrichs, Phys. Chem. Chem. Phys., 2005, 7, 3297–3305 Search PubMed.
- J. Zheng, X. Xu and D. G. Truhlar, Theor. Chem. Acc., 2011, 128, 295–305 Search PubMed.
- F. Weigend, Phys. Chem. Chem. Phys., 2006, 8, 1057–1065 Search PubMed.
- S. Grimme, J. Antony, S. Ehrlich and H. Krieg, J. Chem. Phys., 2010, 132, 154104 Search PubMed.
- S. Grimme, S. Ehrlich and L. Goerigk, J. Comput. Chem., 2011, 32, 1456–1465 Search PubMed.
- V. Barone and M. Cossi, J. Phys. Chem. A, 1998, 102, 1995–2001 Search PubMed.
- V. Vaz da Cruz, S. Eckert and A. Föhlisch, Phys. Chem. Chem. Phys., 2021, 23, 1835–1848 Search PubMed.
- A. T. B. Gilbert, N. A. Besley and P. M. W. Gill, J. Phys. Chem. A, 2008, 112, 13164–13171 Search PubMed.
- W. Humphrey, A. Dalke and K. Schulten, J. Mol. Graphics, 1996, 14, 33–38 Search PubMed.
- C. Kleine, M. Ekimova, G. Goldsztejn, S. Raabe, C. Strüber, J. Ludwig, S. Yarlagadda, S. Eisebitt, M. J. J. Vrakking, T. Elsaesser, E. T. J. Nibbering and A. Rouzée, J. Phys. Chem. Lett., 2019, 10, 52–58 Search PubMed.
- S. Eckert, P. Miedema, W. Quevedo, B. O'Cinneide, M. Fondell, M. Beye, A. Pietzsch, M. Ross, M. Khalil and A. Föhlisch, Chem. Phys. Lett., 2016, 647, 103–106 Search PubMed.
- M. Ekimova, M. Kubin, M. Ochmann, J. Ludwig, N. Huse, P. Wernet, M. Odelius and E. T. J. Nibbering, J. Phys. Chem. B, 2018, 122, 7737–7746 Search PubMed.
- S. Eckert, J. Norell, R. M. Jay, M. Fondell, R. Mitzner, M. Odelius and A. Föhlisch, Chem. - Eur. J., 2019, 25, 1733–1739 Search PubMed.
- S. Eckert, M. Winghart, C. Kleine, A. Banerjee, M. Ekimova, J. Ludwig, J. Harich, M. Fondell, R. Mitzner, E. Pines, N. Huse, P. Wernet, M. Odelius and E. T. J. Nibbering, Angew. Chem., Int. Ed., 2022, 61, e20220070 Search PubMed.
- S. K. Das, M.-O. Winghart, P. Han, D. Rana, Z.-Y. Zhang, S. Eckert, M. Fondell, T. Schnappinger, E. T. J. Nibbering and M. Odelius, J. Phys. Chem. Lett., 2024, 15, 1264–1272 Search PubMed.
- C. M. Loe, C. Liekhus-Schmaltz, N. Govind and M. Khalil, J. Phys. Chem. Lett., 2021, 12, 9840–9847 Search PubMed.
- S. Eckert, J. Norell, P. S. Miedema, M. Beye, M. Fondell, W. Quevedo, B. Kennedy, M. Hantschmann, A. Pietzsch, B. E. Van Kuiken, M. Ross, M. P. Minitti, S. P. Moeller, W. F. Schlotter, M. Khalil, M. Odelius and A. Föhlisch, Angew. Chem., Int. Ed., 2017, 56, 6088–6092 Search PubMed.
- S. Eckert, J. Niskanen, R. M. Jay, P. S. Miedema, M. Fondell, B. Kennedy, W. Quevedo, M. Iannuzzi and A. Föhlisch, Phys. Chem. Chem. Phys., 2017, 19, 32091–32098 Search PubMed.
- F. Meyer, M. Blum, A. Benkert, D. Hauschild, Y. L. Jeyachandran, R. G. Wilks, W. Yang, M. Bär, F. Reinert, C. Heske, M. Zharnikov and L. Weinhardt, Phys. Chem. Chem. Phys., 2018, 20, 8302–8310 Search PubMed.
- V. Vaz da Cruz, R. Büchner, M. Fondell, A. Pietzsch, S. Eckert and A. Föhlisch, J. Phys. Chem. Lett., 2022, 13, 2459–2466 Search PubMed.
- A. Nimmrich, N. Govind and M. Khalil, J. Phys. Chem. Lett., 2024, 15, 12652–12662 Search PubMed.
- F. Gel’mukhanov and H. Ågren, Phys. Rev. A:At., Mol., Opt. Phys., 1994, 49, 4378–4389 Search PubMed.
- L. S. Cederbaum, J. Chem. Phys., 1995, 103, 562–567 Search PubMed.
- P. Skytt, P. Glans, J.-H. Guo, K. Gunnelin, C. Såthe, J. Nordgren, F. K. Gel'mukhanov, A. Cesar and H. Ågren, Phys. Rev. Lett., 1996, 77, 5035–5038 Search PubMed.
- F. Gel’mukhanov and H. Ågren, Phys. Rep., 1999, 312, 87–330 Search PubMed.
- D. Maganas, P. Kristiansen, L.-C. Duda, A. Knop-Gericke, S. DeBeer, R. Schlögl and F. Neese, J. Phys. Chem. C, 2014, 118, 20163–20175 Search PubMed.
- S. Eckert, V. Vaz da Cruz, M. Ochmann, I. von Ahnen, A. Föhlisch and N. Huse, J. Phys. Chem. Lett., 2021, 12, 8637–8643 Search PubMed.
- S. Eckert, E. J. Mascarenhas, R. Mitzner, R. M. Jay, A. Pietzsch, M. Fondell, V. Vaz da Cruz and A. Föhlisch, Inorg. Chem., 2022, 61, 10321–10328 Search PubMed.
- V. Savchenko, S. Eckert, M. Fondell, R. Mitzner, V. Vaz da Cruz and A. Föhlisch, Phys. Chem. Chem. Phys., 2024, 26, 2304–2311 Search PubMed.
- F. Hennies, S. Polyutov, I. Minkov, A. Pietzsch, M. Nagasono, H. Ågren, L. Triguero, M.-N. Piancastelli, W. Wurth, F. Gel'mukhanov and A. Föhlisch, Phys. Rev. A:At., Mol., Opt. Phys., 2007, 76, 032505 Search PubMed.
- J. Vinson, T. Jach, M. Müller, R. Unterumsberger and B. Beckhoff, Phys. Rev. B, 2016, 94, 035163 Search PubMed.
- J. Vinson, T. Jach, M. Müller, R. Unterumsberger and B. Beckhoff, Phys. Rev. B, 2019, 100, 085143 Search PubMed.
- J. Söderström, A. Ghosh, L. Kjellsson, V. Ekholm, T. Tokushima, C. SÅthe, N. Velasquez, M. Simon, O. Björneholm, L. Duda, A. N. de Brito, M. Odelius, J.-C. Liu, J. Wang, V. Kimberg, M. AgÅker, J.-E. Rubensson and F. Gelmukhanov, Sci. Adv., 2024, 10, eadk3114 Search PubMed.
Footnote |
| † Electronic supplementary information (ESI) available. See DOI: https://doi.org/10.1039/d5cp00748h |
| This journal is © the Owner Societies 2025 |