The interface hydrophilic–hydrophobic integration of fluorinated defective graphene towards biomedical applications†
Received
7th January 2025
, Accepted 19th March 2025
First published on 20th March 2025
Abstract
In biomedical fields, rational design of novel two-dimensional (2D) biomedical nanomaterials aims to precisely manipulate biomolecules, including efficient capture, structural–functional transformation, directional movement, and self-assembly. In this work, we innovatively proposed new graphene nanosheets and selected two representative proteins to explore their binding mechanisms, structural–functional transformation of proteins, and biological effects of the materials. Fluorinated defective graphene (FDG) exhibited highly efficient capture and structural–functional transformation for the receptor binding domain (RBD), and we observed its collapse phenomenon in 2D materials for the first time. For the main protease (Mpro), FDG achieved an optimal balance between efficient capture, immobilization, and structural disruption. Further studies showed that fluorination on oxygen-containing defect graphene significantly enhanced variances in water distribution, surface properties, and hydrogen bond networks on the material surface. This allowed amino acids to be confined to specific areas, achieving efficient capture and directional movement. Additionally, the adsorption behavior and interaction strength of peptides and deoxynucleotides on FDG further validated the possibility of self-assembly. In summary, we highlight FDG as an excellent biomedical material with hydrophilic–hydrophobic integration.
1. Introduction
As an remarkable 2D material that can broaden its properties through surface modification, graphene is the most promising candidate to meet the extensive needs and application prospects.1,2 Graphene has been applied in extensive biomedical fields, such as sensing, drug assembly and delivery, biological detection, and nanoenzyme engineering.3–5 Additionally, graphene serves as an ideal substrate for capturing and manipulating biomolecules, achieving self-assembly, and inducing structural–functional transformation of biomolecules.6–10 Liu et al.'s work demonstrates that the binding behavior on graphene oxide (GO) can be controlled by temperature.11 Zhou et al. proposed a 2D in-plane heterostructure, which can achieve unidirectional and self-propelled transport of nanodroplets carrying various biomolecules such as DNA, RNA, and peptides.12 Our previous work demonstrated that by patterning engineering on graphene, amino acids can be confined to non-patterned regions.13 Notably, amino acids can shuttle back and forth across the interface of two patterned regions, which underscores graphene's versatility in biomedical applications and highlights its ability to precisely manipulate biomolecules.
Defects are often regarded as nonideal states in the synthesis of materials. Recently, with increasing research on defect engineering, actively and reasonably introducing defects has become an effective method to change the original properties of materials and expand their application fields. For example, Gu et al. designed a defective graphene (DG) with large and regular defects, which significantly enhanced the destructive effect on HP35.14 In addition, GO often naturally forms small and random defects during the preparation process, and this type of DG is generally considered to have specific application potential.15–17 Unfortunately, the biological effects of this DG have not been reported. On the other hand, halogenated graphene, especially fluorinated graphene (FG), has attracted much attention because of its unique fluorine effect.18 For example, Keller et al. revealed that there is a unique interaction mechanism between F and biomacromolecules, including the ability to form hydrogen bonds (H-bonds), interactions with aromatic groups, interference with water networks and entropy effects.19 These findings indicate that F may endow graphene with unprecedented properties and functions.20 Importantly, the magic of the C–F effect is not limited to biomedicine. Recently, Cui et al. found that the strategy of adjusting the electrocatalytic microenvironment by introducing C–F bonds can effectively break the scaling relationship between *OOH and *OH, promote the diffusion of H2O and the mass transfer of O2, and thus significantly improve the performance of the oxygen reduction reaction.21 Most previous studies focused on precisely regulating the C–F ratio; however, they often overlooked the difficulty and inherent randomness of the fluorination process.22,23 Notably, Fan et al. confirmed that, compared with introducing point defects, adding oxygen-containing defects can more effectively enhance F atom binding to graphene.24,25 Therefore, further fluorination on the basis of DG can yield a new graphene material, fluorinated defective graphene (FDG).
In recent years, the biomedical applications of 2D materials have become a popular research direction. For example, designing excellent 2D materials that can be applied to SARS-CoV-2.26,27 Seo et al. successfully achieved highly sensitive detection of SARS-CoV-2 in clinical samples by coating a layer of graphene on a field effect transistor and covering it with a specific antibody against the SARS-CoV-2 spike protein.28 Additionally, Fukuda et al. confirmed that GO nanosheets are promising materials for inhibiting the global spread of SARS-CoV-2.29 Furthermore, Unal et al. demonstrated that GO can interact with and disrupt the infectivity of SARS-CoV-2 surface components.30 Mofrad et al. explored the interaction mechanism between representative 2D materials and the receptor binding domain (RBD) of the spike protein.31–34 Building on this exploration, the main protease (Mpro) is another crucial target protein that plays a significant role in the lifecycle of SARS-CoV-2.31,35 Here, 2D nanomaterials are expected to be applied in drug loading and delivery, as well as in immobilizing Mpro on their surfaces to interfere with their intrinsic functions. These two proteins, an external protein and an internal protein of the virus, although belonging to different types, can serve as model proteins for mutual validation to examine the biological effects of 2D nanomaterials and assess their potential as excellent biomedical materials.
Therefore, via molecular dynamics (MD) simulations, we explored the binding mechanism, structural–functional transformation of proteins, and the biological effects of two novel materials. For the RBD, FDG not only shows extremely efficient capture and structural destruction, and, notably, we observed its collapse phenomenon on the 2D material for the first time, which indicates that the transformation of the top and bottom regions of the RBD is feasible. For Mpro, FDG can achieve an optimal balance between efficient capture, immobilization and structural destruction, effectively compensating for the limitations of patterned graphene. Further research revealed that further fluorination on the basis of oxygen defects would significantly exacerbate the differences in water molecule distribution, hydrophilic–hydrophobic properties, charge distribution and H-bond networks on the material surface. These differences allow amino acids to exhibit selective affinity and confinement in specific regions, facilitating efficient capture, structural disruption, and directional movement. In addition, the adsorption behavior and interaction strength of the small peptide and deoxynucleotides on the FDG further validated our findings and suggested the possibility of self-assembly. In summary, we summarize the advantages of FDG and believe that it is an excellent biomedical material with hydrophilic–hydrophobic integration.
2. Simulation methods
System preparation
The initial structures of the RBD (PDB ID: 6M17, and resolution: 2.90 Å) and Mpro (PDB ID: 6LU7, resolution: 2.16 Å, and R-value free: 0.235) were obtained from the Protein Data Bank (https://www.pdb.org/pdb/).36,37 CHARMM-GUI was utilized for initial structural optimization and hydrogen atom addition.38 The protein structure after the initial treatment was used for further modeling. The DG model is derived from qualitative insights from previous research: defects on the graphene may appear randomly and further oxidize.15,17,39 Then, we constructed approximately 5% random defects on the surface via a Python script and the atomic simulation environment software package.40 Subsequently, specific oxygen-containing groups (–O–, –OH, –COO−, ![[double bond, length as m-dash]](https://www.rsc.org/images/entities/char_e001.gif) O) were modified on the unsaturated C atoms (Fig. S1a, ESI†). Two types of defects on the surfaces of DG and FDG: one is a simple vacancy defect, which remains hydrophobic as it is not oxidized by oxygen-containing groups. The other is an oxygen-containing defect, which is a hydrophilic region. Experimental observations suggests F atoms tend to cluster near oxygen-containing defects.24,25 Therefore, we further modified F atoms (approximately 15%) with DG to obtain FDG (Fig. S1b, ESI†). The detailed modeling processes are described in the ESI.† Finally, the investigated materials were optimized via the Forcite module of Materials Studio. The DREIDING force field was used for structure optimization.41–43 Energy calculations employed Gasteiger charges (maximum iteration: 50
O) were modified on the unsaturated C atoms (Fig. S1a, ESI†). Two types of defects on the surfaces of DG and FDG: one is a simple vacancy defect, which remains hydrophobic as it is not oxidized by oxygen-containing groups. The other is an oxygen-containing defect, which is a hydrophilic region. Experimental observations suggests F atoms tend to cluster near oxygen-containing defects.24,25 Therefore, we further modified F atoms (approximately 15%) with DG to obtain FDG (Fig. S1b, ESI†). The detailed modeling processes are described in the ESI.† Finally, the investigated materials were optimized via the Forcite module of Materials Studio. The DREIDING force field was used for structure optimization.41–43 Energy calculations employed Gasteiger charges (maximum iteration: 50![[thin space (1/6-em)]](https://www.rsc.org/images/entities/char_2009.gif) 000; convergence: 5.0 × 10⁻⁶) with ultrafine quality.44 Their optimized structures were used for the MD simulations. CR1–CR3 of the RBD is located at the lowest part of the spike protein and is an important region for binding to angiotensin-converting enzyme 2 (ACE2).34 Therefore, the conformation of CR1–CR3 directly toward the investigated materials was specifically selected.33 Similarly, the active pocket of Mpro is also directly oriented toward the material.45 The protein-material complexes were subsequently embedded into a water box,46 and their minimum distance was approximately 2 nm. Water molecules within 4 Å of the protein and investigated materials were removed. Finally, some counterions were added to the systems. The detailed MD simulation information is shown in Fig. 1 and Table S1 (ESI†).
000; convergence: 5.0 × 10⁻⁶) with ultrafine quality.44 Their optimized structures were used for the MD simulations. CR1–CR3 of the RBD is located at the lowest part of the spike protein and is an important region for binding to angiotensin-converting enzyme 2 (ACE2).34 Therefore, the conformation of CR1–CR3 directly toward the investigated materials was specifically selected.33 Similarly, the active pocket of Mpro is also directly oriented toward the material.45 The protein-material complexes were subsequently embedded into a water box,46 and their minimum distance was approximately 2 nm. Water molecules within 4 Å of the protein and investigated materials were removed. Finally, some counterions were added to the systems. The detailed MD simulation information is shown in Fig. 1 and Table S1 (ESI†).
 |
| | Fig. 1 From the top views, (a) the MD systems for the RBD-investigated materials and (b) Mpro-investigated materials. The conformation of proteins and investigated materials at the initial input stage, i.e., at 0 ns. RBD and Mpro highlighted by “Newcartoon” drawing methods. Three important contact regions (CR1–CR3) for the RBD and active pocket of Mpro highlighted by “Licorice” drawing methods. The C, O, H and F atoms of the investigated materials are represented by cyan, red, white and pink balls, respectively. Water molecules are hidden for clarity. | |
MD simulations
All MD simulations were performed using the NAMD3.0 simulation package in the constant temperature and constant pressure (NPT) ensemble at 1 atm and 310 K.47–49 To simulate the NPT ensemble, pressure control is achieved by the modified Nosé–Hoover method in which Langevin dynamics is used to control fluctuations in the barostat. Temperature control is achieved by introducing a thermostat coupled with Langevin dynamics. Before formal MD sampling, we conducted the following steps: (1) 5000 steps of energy minimization. (2) A 1 ns equilibration of water molecules was achieved by fixing the protein–material complexes in the NPT ensemble. (3) Further equilibration for 4 ns was carried out with the protein position restraints released in the NPT ensemble. We used various force fields to describe MD systems: proteins are described by the CHARMM36 force field, and investigated materials are described by the DREIDING force field.41–43,48 The water molecules use the TIP3P model.46 The combined use of CHARMM and DREIDING force fields has already been demonstrated in previous research.38,50,51 According to NAMD user's guide, periodic boundary conditions were applied to the systems. Particle mesh Ewald summation was used to simulate the electrostatic interactions of the entire system, with a cutoff of 12 Å for separating direct space summation and reciprocal space summation.52 The SWITCH algorithm with a cutoff distance of 12 Å was also used to calculate van der Waals (vdW) interactions.53 The “switchdist” and “pairlistdist” were set to 10 and 16, respectively. The non-bonded exclusion policy (exclude) uses “scaled1-4”. The time step is set to 2 fs, and 1 frame is extracted at a 0.5 ns interval for final analysis. The investigated material was fixed during the MD simulation. All MD are accelerated with NVIDIA A800 graphics. For each system, we performed three independent 500 ns MD simulations to ensure accuracy, and there are no significant differences in the settings for the three independent MD simulations. To clearly show the differences between different systems, we averaged three independent MD datasets for each system. For detailed explanations of the data analysis, refer to the ESI.†
Additional system preparation and MD simulations
To gain a deeper understanding of the biological effects and applications of the investigated materials, in addition to the aforementioned systems, we also constructed and simulated the following systems. First, the FDG-small peptide (F3-R4-K5) system, the small peptide was stripped from Mpro, maintaining its initial conformation. The simulation time for this system is 20 ns. Second, for the investigated material-deoxynucleotide system, four deoxynucleotides were constructed via an online tool (web.x3dna.org) and placed at a vertical distance of approximately 15 Å from the investigated material.54 As shown in Fig. S2 (ESI†), to eliminate the influence of their initial position, five distinct initial positions were selected for each deoxynucleotide. The simulation time for each system is 50 ns, with a total time of 2 μs. The MD simulation setup of the above systems was the same as before. The detailed MD simulation information is also shown in Table S1 (ESI†).
3. Results and discussion
3.1. The adsorption process and strength between proteins and the investigated materials
We extracted trajectories for each system and captured the representative snapshots.55 Significant differences exist in the RBD adsorption behavior between the two materials. For the RBD–DG system, the RBD can stably anchor the surface with slight adjustments. During the whole simulation time, the RBD maintains a “standing posture” on the surface, which is consistent with previous literature.33 In contrast, for the RBD-FDG system, although the RBD initially also contacts the surface in a “standing posture”, the RBD gradually tilts and eventually collapses as the simulation time increases. This collapse results in a transition from the original upright contact to an almost extreme “lying flat” orientation on the FDG surface. Notably, this collapse phenomenon of the RBD on 2D materials has not been reported. We select a set of representative trajectories for detailed elaboration. As shown in Fig. 2a–d and i, at 57 ns, the CR1 contacted the surface first, laying their adsorption foundation. Subsequently, CR3 is gradually captured by the surface. At approximately 80 ns, the RBD has established stable contact with the DG. Thereafter, the RBD tends to slide on the DG surface, further exposing CR2 and bringing it into unstable contact with the surface. After approximately 250 ns, the RBD has reached a relatively stable state. However, as shown in Fig. 2e–h and k, at 30 ns, the RBD also establishes initial contact with the FDG through CR1, followed by the approach of CR3. At 100 ns, CR1 and CR3 establish a stable foundation with FDG. As time passes, rather than sliding on the surface, the RBD tends to tilt itself and undergoes significant collapse at 300 ns. This collapse exposes more amino acids that were originally unable to contact the surface, completing the transition from a “standing” to a “lying flat” posture. After the collapse, various regions of the RBD are significantly stretched by the FDG, ultimately exhibiting an extremely extended adsorption morphology (Fig. 2h). This phenomenon not only reveals the strong interaction between FDG and the RBD but also indicates significant structural changes in the RBD. By combining the trajectories and carefully comparing Fig. 2i and k, two interesting phenomena can be observed: firstly, compared to CR1 and CR3, CR2 does not easily come into contact with the surface. Secondly, despite the obvious collapse phenomenon of RBD on the FDG, CR2 still cannot contact the surface and instead shows a slight tendency to move away. Fig. 2i and j intuitively reflect the number of amino acids in contact with the investigated material during the simulation time. It is evident that when RBD contacts the investigated material in a “standing posture”, the number of amino acids in contact with the surface is around 20. However, after a dramatic collapse of RBD at 300 ns, this number rises to around 40, allowing RBD to make more extensive contact with FDG. Fig. S3–S6 (ESI†) present representative snapshots of other independent simulation systems that are not discussed in detail: although the specific adsorption processes may differ, the overall conclusion remains the same.
 |
| | Fig. 2 Representative trajectory snapshots of RBD adsorbed onto (a)–(d) DG and (e)–(h) FDG. RBD and investigated materials highlighted by “Newcartoon” and “Lines” drawing methods. Amino acids in contact with the surface highlighted using the “CPK” drawing method. The C, O, H and F atoms of the investigated materials are represented by cyan, red, white and pink balls, respectively. (i) and (j) Z-direction centroid distance of CR1–CR3. The green lines represent the Z-direction centroid distance of investigated materials. (k) and (l) The number of residues in contact with the investigated materials. | |
Compared with those of the RBD, the adsorption processes of Mpro and the two investigated materials were similar: Mpro contacted the surface, adjusted its structure, and finally reached a relatively stable state. As shown in Fig. 3, domain III of Mpro contacted the surface and pulled domains I and II toward the surface within 10 ns, and this process laid the adsorption foundation. Subsequently, partial amino acids were more fully exposed to the investigated materials, and this process caused Mpro to undergo movement and structural adjustment on the surfaces. After 100 ns, Mpro did not seem to have obvious position migration, but some amino acids still exhibited changes. Mpro seems exhibits greater stretchability and more extensive contact with the FDG surface compared to DG (Fig. 3j and l). Fig. S7–S10 (ESI†) shows representative snapshots of other independent simulation systems. Here, we hypothesize that the differences in the adsorption behavior of the two proteins on the investigated materials may stem from their unique structural characteristics. Specifically, due to its relatively elongated structure, the RBD has limited amino acids directly interacting with the investigated materials, a feature that allows FDG to induce continuous tilting of the RBD, thereby altering its contact posture with the surface. In contrast, Mpro has a relatively compact and bulkier structure, with a greater number of amino acids in direct contact with the investigated materials, resulting in more localized differences being induced in Mpro by the investigated materials.
 |
| | Fig. 3 Representative trajectory snapshots of Mpro adsorbed onto (a)–(d) DG and (e)–(h) FDG. Mpro and investigated materials highlighted by “Newcartoon” and “Lines” drawing methods. Amino acids in contact with the surface highlighted by the “CPK” drawing method. The C, O, H and F atoms of investigated materials are represented by cyan, red, white and pink balls, respectively. (i) and (j) Z-direction centroid distance of M276–G278 (Domain III) and active pocket (Domain I–II). The green lines represent the Z-direction centroid distance of the investigated materials. (k) and (l) The number of residues in contact with the investigated materials. | |
To show the dynamic adsorption process of proteins with the investigated material more clearly, we calculated their geometric center (centroid) migration path. As shown in Fig. 4a and b and Fig. S11 (ESI†), in the first 100 ns, the RBD mainly experienced significant changes in the vertical direction. This process indicates that the RBD is gradually being adsorbed by DG and FDG, and this stage is similar for both systems. After 100 ns, the RBD transitions to planar motion on the DG, resulting in sliding behavior (Fig. 4a). Notably, although the RBD also exhibited slight sliding behavior on the FDG, it underwent significant changes in the vertical direction again after 300 ns, indicating a collapse process (Fig. 4b). The adsorption of most amino acids on the FDG strictly limits its sliding behavior. To more accurately quantify their interaction strength, we calculated the interaction energy and contact area.56 For the RBD–DG system, the interaction energy and contact area tend to stabilize within 100 ns (Fig. 4c). However, for the RBD-FDG system, the curve clearly shows stage-by-stage adsorption characteristics, requiring a longer time to reach the relatively stable state (Fig. 4d). Specifically, the final interaction energy between the RBD and DG is approximately −115 kcal mol−1, and the contact area is 700 Å2. Remarkably, the final interaction energy between the RBD and FDG is as high as −370 kcal mol−1, and the contact area is also significantly increased to approximately 2000 Å2. Considering the adsorption process, the number of contact residues, and the interaction strength, it is evident that both DG and FDG can effectively capture RBD on their surfaces. However, in comparison, FDG can induce the collapse of RBD, resulting in a more efficient capture capability.
 |
| | Fig. 4 Centroid migration path of the RBD on the (a) DG and (b) FDG during 500 ns. The corresponding Z-axis coordinates of investigated materials is approximately −36.5 Å. (c) Interaction energy and (d) contact area between the RBD and the investigated materials. | |
Similarly, we explored the centroid migration process and interaction strength of Mpro on the investigated materials. As shown in Fig. 5a and b and Fig. S12 (ESI†), the adsorption process of Mpro on both materials follow similar trends but reveal subtle distinctions. Specifically, Mpro adsorbs relatively quickly onto the FDG, and its migration range is relatively small, indicating that its migration is restricted. This may be attributed to the special surface properties of the FDG, inducing more amino acids to be gradually exposed and adsorbed. In terms of interaction strength, the two systems exhibit differences after 150 ns (Fig. 5c and d). Mpro exhibits an interaction energy of −360 kcal mol−1 and a contact area of 2200 Ų with DG, whereas these values rise to −470 kcal mol−1 and 2800 Ų with FDG. In short, both proteins exhibit more significant adsorption processes and stronger interaction strengths on the FDG, with their migration processes being restricted. Obviously, similar to RBD, Mpro can also be captured more efficiently by FDG. This feature may have a positive impact on the detection and diagnosis of SARS-CoV-2.
 |
| | Fig. 5 Centroid migration path of Mpro on the (a) DG and (b) FDG over 500 ns. The corresponding Z-axis coordinates of the investigated materials is approximately −25.2 Å. (c) Interaction energy and (d) contact area between Mpro and the investigated materials. | |
3.2. Structural and functional transformation of the RBD
Since the RBD not only plays a vital role in binding with ACE2 but is also considered a pivotal target for effectively monitoring and disabling the virus, an in-depth discussion of the structural–functional transformation is critical. First, we calculate the root-mean-square deviation (RMSD) to evaluate the overall structural changes. As shown in Fig. 6a, the RMSD of RBD is approximately 3.3 Å and 4.5 Å, respectively. This indicates that more severe structural changes for the RBD adsorbed on the FDG. Notably, compared with previously reported 2D nanomaterials, FDG has the most notable effect on damaging the structure of the RBD.31–34 The radius of gyration (Rg) indicates that the overall structure of the RBD is becoming looser and more extended, especially on the FDG surface, consistent with previous reports (Fig. 6b). Furthermore, the fluctuations in the RBD in the two systems were similar, and the critical regions (CR1–CR3) were generally located in the peak regions, which is attributed to their function. Compared with DG, FDG can interact with more amino acids, thus increasing their flexibility while preserving their inherent flexibility characteristics. Having examined the primary structural changes, we next analyzed its secondary structure. Fig. 6d, e and Fig. S13 (ESI†) show that the overall secondary structure of the RBD-FDG system changes more significantly. This may be due to the RBD adsorbing onto the FDG in a “lying flat” posture, allowing more residues to make effective contact with the surface. In both systems, the significant breakdown of the secondary structure is concentrated around CR1–CR3, which is critical for the function of the RBD. H-bonds, as the primary force maintaining the stability of secondary structures, begin to differ between the two systems after 100 ns, and this disparity further increases after 300 ns (Fig. 6f). In summary, FDG causes more significant disruptions to the structure and function of the RBD while effectively increasing the flexibility of most amino acids on its surface.
 |
| | Fig. 6 (a) RMSD, (b) Rg and (c) RMSF of the RBD. Secondary structure of the RBD adsorbed on (d) DG and (e) FDG. (f) H-bonds of the RBD. The correspondence between color and secondary structure is as follows: pink and blue represent helical structures; green represents turn structures; yellow represents sheet structures and white represents random coil structures. | |
CR1–CR3 are key regions for binding ACE2, and RMSF analysis reveals distinctions in these regions (Fig. 6c). In the DG, CR1 exhibited greater flexibility, whereas FDG seemed to endow greater flexibility to CR3 and its adjacent amino acids, with no significant difference observed in their impact on CR2. Therefore, we extracted representative trajectory snapshots of CR1–CR3 at the end of the MD simulations (Fig. 7a, b and Fig. S14, ESI†). Specifically, there are differences in the behavior of the three regions on the investigated material. In the early stages of the adsorption process, CR1 is the first region to contact the surface, followed by the CR3. Both MD trajectory and centroid distance analyses indicate that CR3 allows the RBD to slide freely on the DG (Fig. 2a, d, 4a and Fig. S3, S4, S14a, b, ESI†). This is due to RBD's structural characteristics, which concentrate amino acids near CR1. CR3 allows more amino acids to contact the surface, and these amino acids form secondary structures that are mostly loose turns and coils rather than tight α-helices and β-sheets. Interestingly, the sliding of the RBD on the FDG is relatively restricted. The trajectories indicate that CR3 always stops sliding near larger oxygen-containing defects and F-rich regions (Fig. 7b and Fig. S14c, d, ESI†). As CR3 migrates toward these regions, it stretches the amino acid while enabling more to interact with the FDG surface. Notably, the collapse of the RBD can also result in most amino acids being captured by the surface. These factors may explain why CR3 and its surrounding amino acids exhibit increased flexibility. For CR1, since the RBD collapses forward along the CR1 direction, some amino acids may not be captured by FDG, making its performance less pronounced than that of CR3. CR2 has similar behaviors in both systems: when the RBD adsorbs onto the DG surface in a “standing” posture, CR2 makes contact with the surface but is unstable (Fig. 2l, 7a and Fig. S14a, b, ESI†); when the RBD adsorbs onto the FDG surface in a “lying flat” posture, it is even more difficult for CR2 to contact the surface (Fig. 2k, 7b and Fig. S14c, d, ESI†). We also calculated the RMSD and Rg of CR1–CR3, and the results revealed that FDG had a more significant structural impact on these regions (Fig. 7c and d). In summary, FDG can induce more extensive structural–functional transformation in RBD and important regions. This is not only crucial for the design of antiviral devices and products but also an indispensable attribute of superior biomedical materials.
 |
| | Fig. 7 At 500 ns, representative snapshots of CR1–CR3 (highlighted by “CPK” drawing method) of the RBD adsorbed onto (a) DG and (b) FDG. (c) RMSD and (d) Rg of CR1–CR3 for the RBD. Investigated materials highlighted by “Lines” drawing methods. The C, O, H and F atoms of investigated materials are represented by cyan, red, white and pink balls, respectively. | |
3.3. Structural and functional transformation of Mpro
Similar to the discussion on the RBD, we discuss the changes in the overall structural and functional transformation of Mpro, but with a focus on exploring the changes in its active pocket. As shown in Fig. 8a, the RMSD of Mpro is approximately 5 Å and 6.3 Å, respectively. This finding indicates that DG damages the overall structure of Mpro, and F atom introduction amplifies this effect. The Rg results indicate that the overall conformation of Mpro is becoming looser and more extended, especially on the FDG (Fig. 8b). Fig. 8c indicates that FDG induces more amino acids to further improve flexibility. The RMSF shows pronounced peaks corresponding to the important regions for Mpro. Taking the Mpro–FDG system as an example, for domains I and II, active pockets generally have a high degree of flexibility compared with other regions, with T24-L27 exhibiting moderate flexibility and S46-N51 and F140-C145 exhibiting the most flexibility. This finding is consistent with previous literature: the high flexibility of the active pocket can adapt to different types of substrates or maintain the stability of its conformation.45,57–59 Similarly, the loop (F185-I200) linking domains II and III is also very flexible. Domain III plays a significant role in maintaining the stability of Mpro due to its high flexibility and significantly exhibits five RMSF peaks that correspond to the five helices. Generally, conformational changes in the active pocket impact activity, while those in domain III affect its stability. Therefore, structural adjustments in these regions represent key strategies to regulate the function of Mpro. Then, we separately calculated the RMSD of these two parts to measure their structural changes (Fig. 8d and e). Compared with those in domain III, the changes in the active pocket appeared to be more significant. This result indirectly suggested that inhibiting the activity of Mpro by disrupting the active pocket may be more feasible than disrupting domain III. In Fig. 8e, an interesting phenomenon is observed: although the investigated materials cannot significantly alter the five α-helices of domain III, the RMSD of these helices is relatively larger when RBD is on the DG surface, unlike the behavior observed in the active pocket. This may be due to the inherent stability of these five α-helices, making them less prone to change. The differences between the two systems are more likely attributed to normal errors in the three independent simulation systems. Like the RMSD and RMSF results, the Rg results revealed that the active pockets adsorbed on the DG and FDG became looser and extended and that FDG still had a greater effect on the active pockets (Fig. 8f).
 |
| | Fig. 8 The (a) RMSD, (b) Rg and (c) RMSF of Mpro. The RMSD of (d) the active pocket and (e) five α-helices (domain III) for Mpro. (f) Rg of the active pocket for Mpro. | |
Next, we delve into the conformational changes in the active pocket in detail. As illustrated in Fig. 9a, b and Fig. S15 (ESI†), when Mpro is adsorbed onto DG and FDG, both terminals of the active pocket contact the surfaces, and the contacts of Mpro with FDG are more extensive. Then, the two terminals seem to be pulled apart by opposite forces in the FDG, resulting in a final structure resembling an “outward-opening door”. Furthermore, the active pocket seems to extend farthest toward larger oxygen-containing defects and F-rich regions. This may again indicate that “oxygen-containing defects” and F atoms are important factors for adjusting the adsorption behavior of biomolecules. To further compare the conformational changes in the active pocket, we constructed Fig. 9c, d and Fig. S16 (ESI†). The overall contour of the active pocket adsorbed onto DG and FDG, characterized by irregular triangular or narrow strip shapes with voids and tears, undergoes changes in amino acid adsorption positions due to opposing “tensions” exerted by factors such as surface hydrophilicity, an abundance of oxygen-containing groups, random defects, fluorination, and interfacial water molecules, ultimately leading to the disruption of the compact and intact conformation of the active pocket. According to previous studies, Mpro comprises four subsites (S1, S1′, S2 and S4), which collectively form a compact and fully integrated three-dimensional active pocket conformation.60 Due to the attraction of both terminals of the active pocket to larger oxygen-containing defects and F-rich regions, the S4 and S2 subsites shifted significantly in the opposite direction (Fig. S17, ESI†). The differential variation of different subsites should be taken into account in the design of drug loading methods based on DG/FDG. Previous studies have shown that the N3 ligand can specifically inhibit the activity of Mpro in a variety of coronaviruses, including SARS-CoV and MERS-CoV.61–63 Therefore, we calculated their interaction energy (Table S2, ESI†), and the results suggest that conformational changes in the subsites weaken the interaction between the active pocket and N3. In summary, we found that FDG caused more obvious structural damage to Mpro, along with the functional transformation of important parts, and induced it to improve the flexibility of important parts. These findings have implications for FDG-based drug design and demonstrate once again that FDG may be an excellent biomedical material.
 |
| | Fig. 9 At 500 ns, representative snapshots of the active pocket (highlighted by “CPK” drawing method) of Mpro adsorbed onto (a) DG and (b) FDG. The crystal structure of the active pocket compared with the active pocket of Mpro, which adsorbed onto (c) DG and (d) FDG. Investigated materials highlighted using “Lines” drawing methods. The C, O, H and F atoms of the investigated materials are represented by cyan, red, white and pink balls, respectively. | |
3.4. Further discussion – comparison with other 2D materials
Previously, Du et al. explored the interaction between intact graphene (IG) and the RBD.32 They revealed that their adsorption primarily depends on vdW forces and suggested that IG might not be the best material for capturing the RBD. Khavani et al. further investigated the interaction between 2D metal nanosheets and the RBD, emphasizing the significant advantages of the use of Au nanosheets as sensor substrates.33 Mehranfar et al. reported that phosphorene (Pp) has greater affinity and sensitivity for the RBD. Bosch et al. investigated the differences in the adsorption process of RBD on hydrophobic and hydrophilic surfaces.31 Without considering the differences brought by using different force fields in these works, FDG demonstrates exceptional performance in effectively capturing and immobilizing, and inducing structural–functional transformations in proteins (Fig. 10a and b). Furthermore, we first reported that FDG can induce the RBD to collapse on its surface and ultimately cover it in a “lying flat” posture. As part of the Spike protein, RBD's “lying flat” orientation on FDG not only enhances its adsorption and immobilization but may also impact other functions of the Spike protein significantly.64 Further investigation is needed, as this may indirectly alter our antiviral strategies utilizing 2D materials.
 |
| | Fig. 10 RBD (orientation 1): (a) the RMSD and (b) H-bonds of the RBD adsorbed on IG, Ag, Au, Pt, phosphorene (Pp), DG and FDG. Mpro: (c) the RMSD of Mpro and (d) the active pocket adsorbed on IG, GO, DG*, CG, SG, DG and FDG. (e) Interaction energy and (f) contact area between Mpro and IG, GO, DG, CG, and SG. | |
As illustrated in Fig. 10c–f, the progressive inhibition of Mpro can be achieved through the introduction of oxygen-containing groups, defects, pattern engineering, and fluorination of GRMs.45 To distinguish these two types of DG, the defective graphene with large and regular holes is named DG*.14,65,66 When comparing two defective graphene, we find that DG with small and random defects have a slight edge in terms of interaction strength and overall structural–functional changes in Mpro. However, DG* with large and regular defects results in better performance in terms of changes in the active pocket. In terms of facilitating the active introduction of defects and functioning as an effective drug carrier, DG with small and random defects appear to have more potential. Compared to DG, FDG with additional fluorination performs even better. Previous studies have shown that PG can also achieve excellent regulatory effects by completely separating the hydrophilic–hydrophobic regions.13 In contrast, checkboard graphene (CG) focuses more on regulating the structural–functional changes in Mpro, whereas stripped graphene (SG) tends to regulate the adsorption and immobilization of Mpro. Fortunately, FDG achieves an optimal balance between these two aspects. In fact, FDG and PG share a common feature, which is the clear boundary between hydrophobic and hydrophilic regions on their surfaces. This material, with a distinct surface boundary, alters the selectivity and affinity of amino acids, thereby further enhancing the capture, immobilization, and regulation of Mpro. Most importantly, FDG can induce conformational stretching of biomolecules. For example, the active pocket exhibits remarkable flexibility and is separated by notable gaps (Fig. 9a and b). Therefore, we believe that they are hydrophilic–hydrophobic integrated materials and that these materials usually have excellent biological effects and application potential.
3.5. Further discussion – the biological effects of DG and FDG
Generally, π–π interactions, hydrophobic interactions, electrostatic interactions, vdW forces, and interfacial water are important driving forces that mediate the interactions between biomolecules and nanomaterials.67,68 Different driving forces imply selective biases in the adsorption of biomolecules on nanomaterials. From the perspective of structure, the oxygen-containing groups on the DG surface concentrated around the defects. This not only makes the surface properties more prominent and dispersed but also profoundly affects the interaction patterns of amino acids with the surface. This characteristic is similar to that of the “Shi-Tu” GO model, and their biological effects are different from those of randomly modified GO.69,70 Furthermore, the FDG, derived from DG fluorination, exhibits enhanced surface property concentrations and dispersions. This feature enhances the amino acid selectivity and surface affinity. Additionally, F atoms can participate in the formation of H-bond networks, reshaping the H-bond network and introducing novel material properties. Compared to hydrophobic graphene, defects, oxidation, and fluorination endow FDG strong hydrophilic–hydrophobic properties. The unmodified regions and vacancy defect regions on its surface are typically hydrophobic, while the oxygen-containing defect regions and their surroundings are usually hydrophilic. The hydrophilic and hydrophobic regions on the material's surface also profoundly influence the driving forces, ultimately resulting in significant enhancement in overall interaction energy (hydrophilic and hydrophobic interactions). This “hydrophilic–hydrophobic integration” material has excellent application potential, and a comprehensive and detailed summary of its biological effects is needed.
Oxygen-containing defects and F-rich regions induced the rearrangement of water molecules
Owing to water molecules preferentially occupying the material surfaces, biomolecules need to break the dense layer of water molecules to contact the surface, so the distribution of water molecules significantly affects the early adsorption process. As shown in Fig. 11a, the oxygen-containing defects change the original uniform distribution of water molecules so that the inner water molecules are mainly concentrated around the oxygen-containing defects. Since F atoms are able to form H-bonds with water molecules, the number of water molecules on the FDG increases and is further concentrated around oxygen-containing defects and F-rich regions (Fig. 11b and Fig. S18a, ESI†). We scanned the water distributions of the investigated materials in both the horizontal and vertical directions via MDAnalysis.71 In the horizontal direction, due to the random surface defects in DG and FDG, it is not possible to scan the distribution of water molecules as in PG, but the distribution of water molecules on FDG is more uneven than that on DG (Fig. 11c and d).13 This characteristic enhances the selectivity on amino acids, further altering the adsorption morphology of proteins. Fig. 11e, f and Fig. S19 (ESI†) show that the water distribution along the vertical direction of the investigated materials presents a typical layered distribution and that FDG can induce more amino acids to fully contact the FDG, thereby squeezing out more inner water and improving their interaction strength. In other words, the uneven distribution of water molecules not only plays a role in the early stages of the adsorption process, but also facilitates further interaction between hydrophilic amino acids and the investigated material after the protein has made contact with it.
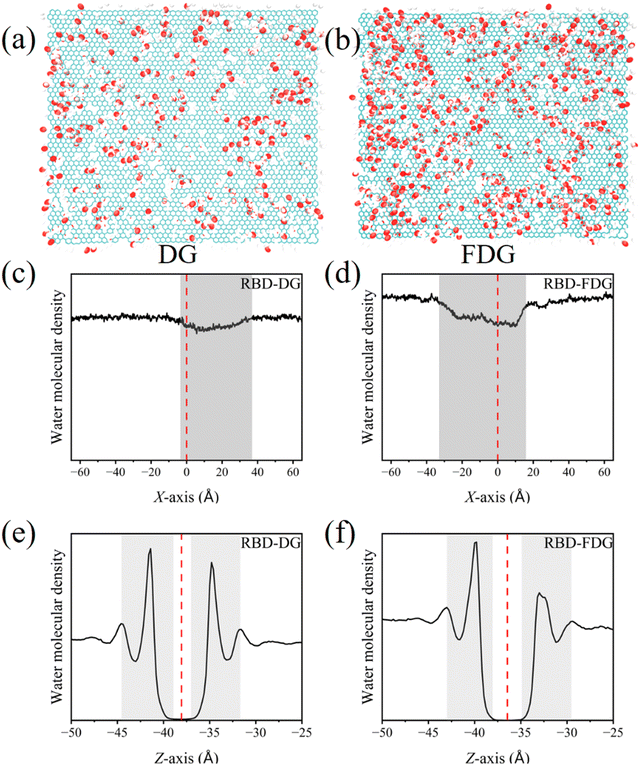 |
| | Fig. 11 High-density hydration layers (cutoff is 3 Å) on the (a) DG and (b) FDG. Scanning water molecules within the 6 Å range of (c) DG and (d) FDG along the horizontal direction. Scanning water molecules within the 12 Å range of (e) DG and (f) FDG along the vertical direction. The investigated materials are highlighted using “Lines” drawing methods. The C, O, H and F atoms of the investigated materials are represented by cyan, red, white and pink balls, respectively. | |
Oxygen-containing defects and F-rich regions induce high selectivity and affinity for amino acids
Owing to the rearrangement of water molecules, when positional constraints on the proteins are lifted, hydrophobic amino acids can more easily contact hydrophobic regions with fewer water molecules, whereas the binding of hydrophilic amino acids to hydrophilic regions becomes increasingly difficult. This enables hydrophobic amino acids to dominate early adsorption stages and aligns protein distribution with hydrophobic regions. This effect is crucial for the capture, directional guidance, and even self-assembly of biomolecules. We further decompose the interaction energy into vdW and electrostatic energy. As clearly shown in Fig. S20a and b (ESI†), during the initial stage of adsorption, the increase in the vdW energy is particularly significant compared with the increase in the electrostatic energy. Notably, in the early stages, the growth rate of the vdW energy between the two proteins and DG even surpassed their respective growth rates in FDG. This phenomenon not only highlights the dominant role of vdW forces but also suggests that hydrophilic regions may limit the contact with amino acids. As the amino acids gradually emerge from the surface, they eventually contribute to the contact with other amino acids with the surface, ultimately resulting in stronger hydrophilic and hydrophobic interactions between FDG and proteins. The selective contact of amino acids is also accompanied by further stretching of the biomolecules, which is why FDG can efficiently capture proteins, while also leading to significant structural function transformation.
We further monitored specific amino acids. For the RBD-investigated material systems, early adsorption is dominated by V114–G115 and G154–F155. Fig. 12a and b clearly show that these amino acids exhibit positional preferences on the investigated surface. Similarly, for the Mpro-investigated material systems, M276–G278 are the first to contact the surface and dominate early adsorption (Fig. 12c and d). It is clear that these amino acids are hydrophobic and tend to bind to hydrophobic regions and are strictly confined around oxygen-containing defects and F-rich regions. Furthermore, aromatic amino acids exhibit specific preferences during the adsorption process, tending to form “face-to-face” or “edge-to-face” π–π stacking with hydrophobic regions. Therefore, these amino acids also exhibit greater sensitivity to hydrophilic–hydrophobic integration surfaces, as they not only restrict the formation of π–π stacking but also improve the stability of already established π–π stacking. For the RBD, when it contacts the DG surface in a “standing” posture, only Y118 and F155 are able to form effective π–π stacking interactions with the surface (Fig. S21a, ESI†). When the RBD collapses on the FDG in a “lying flat” posture, despite the increased contact area, Y120 and F16, owing to the presence of oxygen-containing defects and F-rich regions beneath them, still fail to form effective contacts with the surface (Fig. S21b, ESI†). However, the adsorption process between Mpro and the investigated material proves that FDG is conducive to the formation of π–π stacking (Fig. S21c and d, ESI†). Although these two systems appear to differ at this point, a closer look reveals that the aromatic amino acids that make up the π–π stacking tend to cluster near the oxygen-containing defects and F-rich regions but do not cross this specific regional boundary. Additionally, we observed differences in the orientation of the aromatic rings of these amino acids on the investigated materials. On the DG, aromatic rings tend to avoid oxygen-containing defects, whereas on the FDG, aromatic rings prefer to face F-rich regions. Positional constraints, stability, and orientation adjustments of aromatic amino acids also constitute significant biological effects of hydrophilic–hydrophobic integration materials.
 |
| | Fig. 12 From the top views, a representative snapshot and the migration path of important amino acids (V114–G115, G154–F155) for the RBD on the (a) DG and (b) FDG. From the top views, a representative snapshot and the migration path of important amino acids (M276–G278) for Mpro on the (c) DG and (d) FDG. A total of 5 frame structures, one frame represents 100 ns. Important amino acids and investigated materials highlighted using “Licorice” and “Lines” drawing methods. The C, O, H and F atoms of the investigated materials are represented by cyan, red, white and pink balls, respectively. | |
Oxygen-containing defects and F-rich regions induce uneven surface charge distributions
Like the distribution of water molecules, surface charge distribution is also uneven due to the influence of oxygen-containing defects and fluorination. This property causes non-charged amino acids to prefer unmodified regions, while charged amino acids bind to charged regions. Energy decomposition further confirmed that FDG significantly increase the electrostatic energy with the two proteins (Fig. S20, ESI†). Owing to its surface characteristics, only K113 is capable of interacting with the DG under electrostatic forces (Fig. 13a and b). However, the collapse of the RBD is initiated when R15 is suddenly captured by the F-rich region at 300 ns and lays the foundation for other charged amino acid contact surfaces (Fig. 13c and d). Fig. 13e and f highlight the decisive role of electrostatic forces, driven by the abundant charge distribution in the F-rich region and the longer side chain of R15. Significant differences subsequently emerge between these two systems: R15 drives the collapse phenomenon and accelerates the exposure of other amino acids, resulting in a notable increase in both vdW and electrostatic forces. While the electrostatic forces differences for Mpro are less pronounced than for RBD, FDG still attracts more charged amino acids (Fig. S20b and d, ESI†). Notably, the side chains of charged amino acids clearly tend to approach regions with oxygen defects and fluorine enrichment, in stark contrast to the tendency of aromatic rings to stay away from these regions. In short, uneven charge distribution is an important factor in inducing changes in protein contact posture and even structural–functional transformation, which is also an important biological effect of GRMs with hydrophilic–hydrophobic integration.
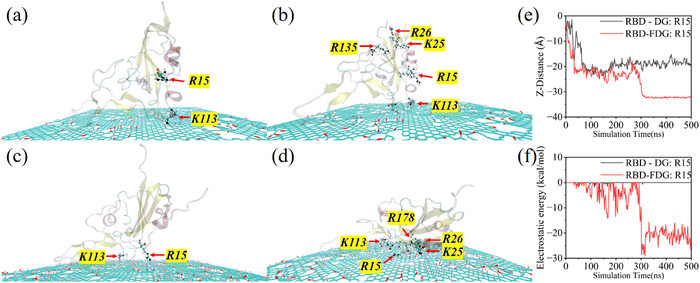 |
| | Fig. 13 Representative trajectory snapshots of several important charged amino acids in the (a) and (b) RBD–DG and (c) and (d) RBD-FDG systems at 300 ns and 500 ns. (e) Z-Direction distance of R15. (f) The electrostatic energy between R15 and the investigated materials. Mpro and investigated materials highlighted by “Newcartoon” and “Lines” drawing methods. Proteins are blurred, and the important charged amino acids are highlighted using “CPK” drawing methods. The C, O, H and F atoms of investigated materials are represented by cyan, red, white and pink balls, respectively. | |
Oxygen-containing defects and F-rich regions induce H-bond distribution
Scientists have long recognized the unique physical and chemical properties of F atoms, leading to extensive studies on fluorine chemistry and its effects.72 One of the unique effects of F atoms lies in their ability to participate in the formation of H-bonds and alter the existing H-bond network. In addition, the mentioned F atoms participate in the rearrangement of water molecules through H-bonds. F atoms can also greatly increase the affinity of FDG by forming H-bonds (Fig. S18b, ESI†). This is not only a unique advantage of an FDG but also establishes its potential as an excellent biomedical material. Finally, combined with the hedgehog plot and dynamic cross-correlation matrix (DCCM) (Fig. 14 and Fig. S22, S23, ESI†), it is evident that most amino acids interact with hydrophobic regions, especially hydrophilic amino acids that extend to oxygen-containing defects and F-rich boundaries, maximizing their selectivity and affinity. In summary, oxygen-containing defects and fluorination reshape the water molecule distribution, charge distribution and H-bond network, profoundly enhancing the selectivity and affinity of amino acids. Finally, we intercepted a small peptide (F3–R4–K5) from Mpro and simulated its migration behavior on the surface of FDG. Phe3 represents an aromatic amino acid and simulates π–π interactions. R4 and K5 represent charged amino acids and simulate electrostatic interactions. As shown in Fig. S24a (ESI†), initially, the small peptide had a folded structure and was located approximately 1.1 nm from the FDG. Upon removing the restriction, the peptide rapidly approached the surface, exhibiting dynamic and vigorous movement as it searched for the optimal binding region. At 10 ns, the small peptide has completed the unfolding process, and it is obvious that F3 is bound to the nonmodified C atom region and that R4 and K5 are bound to the surface defects and modifications. At 20 ns, the small peptide appears as a triangle as a whole, F3 and the nonmodified carbon atom region form π–π stacking, and R4 and K5 bind to the oxygen-containing defects. We calculated the electrostatic energy between each amino acid and FDG (Fig. S24b, ESI†), and the energy of R4 and K5 was greater than that of F3. This discovery revealed that the hydrophilic–hydrophobic integration of FDG can effectively induce significant differences in the diffusion of these specific amino acids, thereby accelerating the unfolding process of proteins. These effects not only significantly improve the ability to capture and immobilize proteins but may also cause significant changes in their structural–functional transformation, underscoring unique and excellent biological effects of FDG.
 |
| | Fig. 14 At 500 ns, the hedgehog plot and DCCM of (a)–(d) the RBD and (e)–(h) Mpro, which was adsorbed on the investigated materials. The investigated materials were highlighted using “Lines” drawing methods. The C, O, H and F atoms of the investigated materials are represented by cyan, red, white and pink balls, respectively. Color scale: dark blue (−0.88) – dark red (+1). | |
3.6. Adsorption behavior and strength of deoxynucleotides on the investigated materials
To further explore the potential biomedical applications of FDG, we shifted our research focus to deoxynucleotides, the building blocks of DNA. Overall, the migration behavior of deoxynucleotides molecules are concentrated in hydrophobic regions on the investigated materials. When deoxynucleotide is positioned on the FDG, its mobility significantly decreases, accompanied by intense interaction energy (Tables 1 and 2). Taking deoxyguanosine monophosphate (dGMP) as an example, dGMP exhibited a relatively loose movement path on the DG surface, with a relatively large moving range (Fig. 15a and c). However, the movement of dGMP on the FDG surface was confined to a narrow hydrophobic region, resulting in more restricted behavior (Fig. 15b and d). The adsorption behavior and strength of other deoxynucleotides on the investigated materials are consistent with the conclusions discussed here, and their representative trajectory snapshots are shown in Fig. S25–S27 (ESI†). Notably, their migration predominantly occurred within extensive hydrophobic regions of the investigated materials, whereas oxygen-containing defects and F-rich regions served as boundaries, restricting their free migration. This characteristic is consistent with the migration behavior of single amino acids on PG.13 In other words, owing to their similar surface characteristics, both FDG and PG are fully feasible for efficiently capturing and directing the migration of biomolecules on the basis of amino acids and deoxynucleotides and further achieving self-assembly.
Table 1 Moving range for four deoxynucleotides (Å2). dAMP, dTMP and dGMP represent deoxyadenosine monophosphate, deoxythymidine monophosphate and deoxycytidine monophosphate, respectively
|
|
dAMP |
dTMP |
dCMP |
dGMP |
| DG |
457.13 |
583.73 |
767.6 |
715.24 |
| FDG |
211.31 |
215.38 |
259.24 |
170.44 |
Table 2 Interaction energy between four deoxynucleotides and the investigated materials (kcal mol−1)
|
|
dAMP |
dTMP |
dCMP |
dGMP |
| DG |
−25.71 |
−22.93 |
−23.26 |
−28.63 |
| FDG |
−28.61 |
−25.97 |
−24.71 |
−30.2 |
 |
| | Fig. 15 From the top views, a representative snapshot and the migration path of G on the (a) and (c) DG and (b) and (d) FDG. A total of 5 frame structures, one frame represents 10 ns. dG and investigated materials highlighted using “Licorice” and “Lines” drawing methods. The C, O, H and F atoms of the investigated materials are represented by cyan, red, white and pink balls, respectively. | |
4. Conclusions
FDG, as an excellent 2D material, offers the following biomedical application prospects and advantages. Hydrophilic–hydrophobic integration: This characteristic not only enhances biocompatibility but also perfectly matches the characteristics of biomolecules. This results in high selectivity and affinity, thereby improving the efficiency of biomolecule capture and structural–functional transformation. Diverse types of defects: in addition to vacancy defects and oxygen-containing defects, different hydrophilic and hydrophobic effects on the graphene surface can be simulated by constructing amination, nitration, hydrogenation, chlorination, and heteroatom (B, N, Al, etc.) substitution, and linear defects, etc. These defects can also alter the graphene with hydrophilic–hydrophobic integration, thereby affecting its biomedical applications. Unique fluorine effect: the strong electronegativity of F atoms not only endows the material new properties, more importantly, F atoms can participate in the formation of H-bonds, thus profoundly changing the H-bond network of the material and biomolecules and providing a new regulatory dimension for their interactions. Controllable ratio of defects and fluoridation: defects and fluorination ratios in FDG can also be precisely regulated and tailored to specific locations, and this high degree of tunability provides a variety of possibilities for the diverse applications of FDG in the biomedical field. Directional manipulation and self-assembly: whether they are proteins or DNA, these structures are assembled from a limited variety of amino acids or deoxyribose through dehydration condensation. Defect and fluorination engineering is similar to building a “molecular barrier and bridge” on surfaces and works in the same effect as a heterogeneous structure, temperature, and patterning, jointly promoting the orderly arrangement and manipulation of biomolecules, laying the foundation for the self-assembly of biomolecules.11,12 Of course, further experimental exploration and simulations will be needed to develop even more perfect FDG materials towards biomedical applications.73
Author contributions
Jiawen Wang: investigation, data curation, theoretical analysis, and writing-original draft. Yi Yu: data curation, writing, review, and editing. Huilong Dong: review and editing. Yujin Ji: review and editing. Weihua Ning: formal analysis, writing review, and editing. Youyong Li: conceptualization, formal analysis, data curation, funding acquisition, writing review, and editing.
Data availability
The data supporting this article have been included as part of the ESI.† All data generated in this study, including simulation trajectories totaling approximately 2 TB, are available from the corresponding author upon request.
Conflicts of interest
The authors declare that they have no known competing financial interests or personal relationships that could have appeared to influence the work reported in this paper.
Acknowledgements
This work was supported by the National Key Research Program of China (Grant No. 2022YFA1503101), the National Natural Science Foundation of China (Grant No. 22173067), the Science and Technology Development Fund, Macau SAR (FDCT No. 0024/2022/ITP), the Collaborative Innovation Center of Suzhou Nano Science & Technology, the Priority Academic Program Development of Jiangsu Higher Education Institutions (PAPD), 111 Project, and the Joint International Research Laboratory of Carbon-Based Functional Materials and Devices.
References
- Y. Liao, Z. Li, L. Chen, A. B. Croll and W. Xia, Nano Lett., 2023, 23, 3637–3644 CAS.
- P. Zhang, Z. Guo, C. Chen and I. Lynch, Nano Today, 2022, 43, 101436 CAS.
- J. J. Grant, S. C. Pillai, S. Hehir, M. McAfee and A. Breen, ACS Biomater. Sci. Eng., 2021, 7, 1278–1301 CAS.
- A. P. Johnson, H. V. Gangadharappa and K. Pramod, J. Controlled Release, 2020, 325, 141–162 CAS.
- K. Ghosal and K. Sarkar, ACS Biomater. Sci. Eng., 2018, 4, 2653–2703 CAS.
- P. Katyal, M. Meleties and J. K. Montclare, ACS Biomater. Sci. Eng., 2019, 5, 4132–4147 CAS.
- S. Sarkar, K. Gulati, A. Mishra and K. M. Poluri, Int. J. Biol. Macromol., 2020, 151, 467–482 CAS.
- X. Wang, Y. Zhu, M. Chen, M. Yan, G. Zeng and D. Huang, Adv. Colloid Interface Sci., 2019, 270, 101–107 CAS.
- O. Colak, A. Nicolaï, V. Meunier and M. C. Demirel, Carbon, 2024, 228, 119332 CAS.
- L. Liu, L. H. Klausen and M. Dong, Nano Today, 2018, 23, 40–58 CAS.
- B. Liu, Y. Zhao, Y. Jia and J. Liu, J. Am. Chem. Soc., 2020, 142, 14702–14709 CAS.
- T. Xie, Z. He, D. Zhang and R. Zhou, J. Phys. Chem. B, 2024, 128, 4751–4758 CrossRef CAS PubMed.
- J. Wang, H. Dong, Y. Ji, Y. Li and S.-T. Lee, J. Colloid Interface Sci., 2024, 673, 202–215 Search PubMed.
- Z. Gu, W. Song, S. H. Chen, B. Li, W. Li and R. Zhou, Nanoscale, 2019, 11, 19362–19369 Search PubMed.
- A. J. Marsden, M. Skilbeck, M. Healey, H. R. Thomas, M. Walker, R. S. Edwards, N. A. Garcia, F. Vuković, H. Jabraoui, T. R. Walsh, J. P. Rourke and N. R. Wilson, Phys. Chem. Chem. Phys., 2022, 24, 2318–2331 Search PubMed.
- W. Zhang, F. W. Starr, K. L. Beers and J. F. Douglas, J. Phys. Chem. A, 2022, 126, 3167–3173 CrossRef CAS PubMed.
- Y. Shi, D. Xiong, J. Li, K. Wang and N. Wang, RSC Adv., 2017, 7, 1045–1055 Search PubMed.
- H. Geng, T. Wang, H. Cao, H. Zhu, Z. Di and X. Liu, Colloids Surf., B, 2019, 173, 681–688 CrossRef CAS PubMed.
- L. Wehrhan and B. G. Keller, J. Phys. Chem. B, 2024, 128, 5925–5934 Search PubMed.
- X. Chen, K. Fan, Y. Liu, Y. Li, X. Liu, W. Feng and X. Wang, Adv. Mater., 2022, 34, 2101665 Search PubMed.
- J. Liang, L. Liang, B. Zeng, B. Feng, L. Du, X. Qiu, Y. Wang, H. Song, S. Liao, M. Shao and Z. Cui, Angew. Chem., Int. Ed., 2024, 63, e202412825 CrossRef CAS PubMed.
- S. Chen, F. Zheng, J. Feng, H. Dong and Y. Li, Appl. Surf. Sci., 2021, 560, 150033 CAS.
- F. Zou, Z. Gu, J. M. Perez-Aguilar and Y. Luo, Sci. Rep., 2024, 14, 9168 CAS.
- M. Jahanshahi, E. Kowsari, V. Haddadi-Asl, M. Khoobi, B. Bazri, M. Aryafard, J. H. Lee, F. B. Kadumudi, S. Talebian, N. Kamaly, M. Mehrali and A. Dolatshahi-Pirouz, Appl. Surf. Sci., 2020, 515, 146071 CAS.
- K. Fan, J. Fu, X. Liu, Y. Liu, W. Lai, X. Liu and X. Wang, Chem. Sci., 2019, 10, 5546–5555 CAS.
- N. H. L. Nguyen, S. Kim, G. Lindemann and V. Berry, ACS Nano, 2021, 15, 11743–11752 CAS.
- G. Reina, D. Iglesias, P. Samorì and A. Bianco, Adv. Mater., 2021, 33, 2007847 CAS.
- G. Seo, G. Lee, M. J. Kim, S.-H. Baek, M. Choi, K. B. Ku, C.-S. Lee, S. Jun, D. Park, H. G. Kim, S.-J. Kim, J.-O. Lee, B. T. Kim, E. C. Park and S. I. Kim, ACS Nano, 2020, 14, 5135–5142 CAS.
- M. Fukuda, M. S. Islam, R. Shimizu, H. Nasser, N. N. Rabin, Y. Takahashi, Y. Sekine, L. F. Lindoy, T. Fukuda, T. Ikeda and S. Hayami, ACS Appl. Nano Mater., 2021, 4, 11881–11887 CAS.
- M. A. Unal, F. Bayrakdar, H. Nazir, O. Besbinar, C. Gurcan, N. Lozano, L. M. Arellano, S. Yalcin, O. Panatli, D. Celik, D. Alkaya, A. Agan, L. Fusco, S. Suzuk Yildiz, L. G. Delogu, K. C. Akcali, K. Kostarelos and A. Yilmazer, Small, 2021, 17, 2101483 CAS.
- A. Mehranfar, M. Khavani and M. Izadyar, J. Mol. Liq., 2022, 345, 117852 CrossRef CAS PubMed.
- J. Du, C. Yang, X. Ma and Q. Li, Appl. Surf. Sci., 2022, 578, 151934 CrossRef CAS PubMed.
- M. Khavani, A. Mehranfar and M. R. K. Mofrad, J. Chem. Inf. Model., 2023, 63, 1276–1292 CrossRef CAS PubMed.
- A. M. Bosch, H. V. Guzman and R. Pérez, J. Chem. Inf. Model., 2024, 64, 5977–5990 CrossRef CAS PubMed.
- Z. Jin, X. Du, Y. Xu, Y. Deng, M. Liu, Y. Zhao, B. Zhang, X. Li, L. Zhang, C. Peng, Y. Duan, J. Yu, L. Wang, K. Yang, F. Liu, R. Jiang, X. Yang, T. You, X. Liu, X. Yang, F. Bai, H. Liu, X. Liu, L. W. Guddat, W. Xu, G. Xiao, C. Qin, Z. Shi, H. Jiang, Z. Rao and H. Yang, Nature, 2020, 582, 289–293 Search PubMed.
- Z. M. Jin, X. Y. Du, Y. C. Xu, Y. Q. Deng, M. Q. Liu, Y. Zhao, B. Zhang, X. F. Li, L. K. Zhang, C. Peng, Y. K. Duan, J. Yu, L. Wang, K. L. Yang, F. J. Liu, R. D. Jiang, X. L. Yang, T. You, X. C. Liu, X. N. Yang, F. Bai, H. Liu, X. Liu, L. W. Guddat, W. Q. Xu, G. F. Xiao, C. F. Qin, Z. L. Shi, H. L. Jiang, Z. H. Rao and H. T. Yang, Nature, 2020, 582, 289 CrossRef CAS PubMed.
- R. Yan, Y. Zhang, Y. Li, L. Xia, Y. Guo and Q. Zhou, Science, 2020, 367, 1444–1448 Search PubMed.
- Y. Yu, H. Sun, K. Gilmore, T. Hou, S. Wang and Y. Li, ACS Appl. Mater. Interfaces, 2017, 9, 32452–32462 CrossRef CAS PubMed.
- W. Zhang, F. W. Starr, K. L. Beers and J. F. Douglas, J. Phys. Chem. A, 2022, 126, 3167–3173 CrossRef CAS PubMed.
- A. H. Larsen, J. J. Mortensen, J. Blomqvist, I. E. Castelli, R. Christensen, M. Dulak, J. Friis, M. N. Groves, B. Hammer, C. Hargus, E. D. Hermes, P. C. Jennings, P. B. Jensen, J. Kermode, J. R. Kitchin, E. L. Kolsbjerg, J. Kubal, K. Kaasbjerg, S. Lysgaard, J. B. Maronsson, T. Maxson, T. Olsen, L. Pastewka, A. Peterson, C. Rostgaard, J. Schiotz, O. Schutt, M. Strange, K. S. Thygesen, T. Vegge, L. Vilhelmsen, M. Walter, Z. H. Zeng and K. W. Jacobsen, J. Phys.: Condens. Matter, 2017, 29, 273002 CrossRef PubMed.
- M. D. Gourlay, J. Kendrick and F. J. J. Leusen, Cryst. Growth Des., 2007, 7, 56–63 CrossRef CAS.
- D. Kunzel, T. Markert, A. Gross and D. M. Benoit, Phys. Chem. Chem. Phys., 2009, 11, 8867–8878 RSC.
- S. L. Mayo, B. D. Olafson and W. A. Goddard, J. Phys. Chem., 1990, 94, 8897–8909 Search PubMed.
- Z. Bikadi and E. Hazai, J. Cheminf., 2009, 1, 15 Search PubMed.
- J. W. Wang, Y. Yu, T. L. Leng, Y. Y. Li and S. T. Lee, ACS Appl. Mater. Interfaces, 2022, 14, 191–200 CrossRef CAS PubMed.
- W. L. Jorgensen, J. Chandrasekhar, J. D. Madura, R. W. Impey and M. L. Klein, J. Chem. Phys., 1983, 79, 926–935 CrossRef CAS.
- J. C. Phillips, R. Braun, W. Wang, J. Gumbart, E. Tajkhorshid, E. Villa, C. Chipot, R. D. Skeel, L. Kale and K. Schulten, J. Comput. Chem., 2005, 26, 1781–1802 CrossRef CAS PubMed.
- A. D. MacKerell, D. Bashford, M. Bellott, R. L. Dunbrack, J. D. Evanseck, M. J. Field, S. Fischer, J. Gao, H. Guo, S. Ha, D. Joseph-McCarthy, L. Kuchnir, K. Kuczera, F. T. K. Lau, C. Mattos, S. Michnick, T. Ngo, D. T. Nguyen, B. Prodhom, W. E. Reiher, B. Roux, M. Schlenkrich, J. C. Smith, R. Stote, J. Straub, M. Watanabe, J. Wiorkiewicz-Kuczera, D. Yin and M. Karplus, J. Phys. Chem. B, 1998, 102, 3586–3616 CrossRef CAS PubMed.
- J. C. Phillips, D. J. Hardy, J. D. C. Maia, J. E. Stone, J. V. Ribeiro, R. C. Bernardi, R. Buch, G. Fiorin, J. Hénin, W. Jiang, R. McGreevy, M. C. R. Melo, B. K. Radak, R. D. Skeel, A. Singharoy, Y. Wang, B. Roux, A. Aksimentiev, Z. Luthey-Schulten, L. V. Kalé, K. Schulten, C. Chipot and E. Tajkhorshid, J. Chem. Phys., 2020, 153, 044130 CrossRef CAS PubMed.
- M. Luo, Y. Yu, Z. Jin, H. Dong and Y. Li, Appl. Surf. Sci., 2020, 517, 146181 CrossRef CAS.
- X. Sun, Z. Feng, T. Hou and Y. Li, ACS Appl. Mater. Interfaces, 2014, 6, 7153–7163 CrossRef CAS PubMed.
- U. Essmann, L. Perera, M. L. Berkowitz, T. Darden, H. Lee and L. G. Pedersen, J. Chem. Phys., 1995, 103, 8577–8593 CrossRef CAS.
- S. Park, F. Khalili-Araghi, E. Tajkhorshid and K. Schulten, J. Chem. Phys., 2003, 119, 3559–3566 CrossRef CAS.
- S. Li, W. K. Olson and X.-J. Lu, Nucleic Acids Res., 2019, 47, W26–W34 CAS.
- W. Humphrey, A. Dalke and K. Schulten, J. Mol. Graphics Modell., 1996, 14, 33–38 CrossRef CAS PubMed.
- D. Zhao, L. Li, D. He and J. Zhou, Appl. Surf. Sci., 2016, 377, 324–334 CrossRef CAS.
- D. W. Kneller, S. Galanie, G. Phillips, H. M. O'Neill, L. Coates and A. Kovalevsky, Structure, 2020, 28, 1313 CrossRef CAS PubMed.
- D. W. Kneller, G. Phillips, H. M. O’Neill, R. Jedrzejczak, L. Stols, P. Langan, A. Joachimiak, L. Coates and A. Kovalevsky, Nat. Commun., 2020, 11, 3202 CrossRef CAS PubMed.
- O. Sheik Amamuddy, G. M. Verkhivker and Ö. Tastan Bishop, J. Chem. Inf. Model., 2020, 60, 5080–5102 CrossRef CAS PubMed.
- S. V. Stoddard, S. D. Stoddard, B. K. Oelkers, K. Fitts, K. Whalum, K. Whalum, A. D. Hemphill, J. Manikonda, L. M. Martinez, E. G. Riley, C. M. Roof, N. Sarwar, D. M. Thomas, E. Ulmer, F. E. Wallace, P. Pandey and S. Roy, Viruses, 2020, 12, 942 CrossRef CAS PubMed.
- L. Zhang, D. Lin, X. Sun, U. Curth, C. Drosten, L. Sauerhering, S. Becker, K. Rox and R. Hilgenfeld, Science, 2020, 368, 409–412 CrossRef CAS PubMed.
- H. T. Yang, W. Q. Xie, X. Y. Xue, K. L. Yang, J. Ma, W. X. Liang, Q. Zhao, Z. Zhou, D. Q. Pei, J. Ziebuhr, R. Hilgenfeld, K. Y. Yuen, L. Wong, G. X. Gao, S. J. Chen, Z. Chen, D. W. Ma, M. Bartlam and Z. Rao, PLoS Biol., 2005, 3, 1742–1752 Search PubMed.
- V. R. Naik, M. Munikumar, U. Ramakrishna, M. Srujana, G. Goudar, P. Naresh, B. N. Kumar and R. Hemalatha, J. Biomol. Struct. Dyn., 2021, 39, 4701–4714 CrossRef CAS PubMed.
- X. Tang, Z. Qian, X. Lu and J. Lu, Mol. Biol. Evol., 2023, 40, msad089 CrossRef CAS PubMed.
- J. Wang, Y. Yu, T. Leng, Y. Li and S.-T. Lee, ACS Appl. Mater. Interfaces, 2022, 14, 191–200 CrossRef CAS PubMed.
- B. Li, D. R. Bell, Z. Gu, W. Li and R. Zhou, Carbon, 2019, 146, 257–264 CrossRef CAS.
- S. Roy, Aastha, K. A. Deo, K. Dey, A. K. Gaharwar and A. Jaiswal, ACS Appl. Mater. Interfaces, 2023, 15, 35753–35787 CAS.
- M. Kaffash, S. Tolou-Shikhzadeh-Yazdi, S. Soleimani, S. Hoseinpoor, M. R. Saberi and J. Chamani, Spectrochim. Acta, Part A, 2024, 309, 123815 CAS.
- J. R. Yang, G. S. Shi, Y. S. Tu and H. P. Fang, Angew. Chem., Int. Ed., 2014, 53, 10190–10194 CrossRef CAS PubMed.
- X. Lei, H. Ma and H. Fang, Nanoscale, 2020, 12, 6699–6707 RSC.
- N. Michaud-Agrawal, E. J. Denning, T. B. Woolf and O. Beckstein, J. Comput. Chem., 2011, 32, 2319–2327 CrossRef CAS PubMed.
- C. Ni and J. Hu, Chem. Soc. Rev., 2016, 45, 5441–5454 RSC.
- M. Tabasi, P. Maghami, Z. Amiri-Tehranizadeh, M. Reza Saberi and J. Chamani, J. Mol. Liq., 2023, 392, 123472 CrossRef CAS.
|
| This journal is © the Owner Societies 2025 |
Click here to see how this site uses Cookies. View our privacy policy here. 
 Open Access Article
 This Open Access Article is licensed under a
  c,
Yujin
Ji
c,
Yujin
Ji


