
 Open Access Article
 This Open Access Article is licensed under a
 Creative Commons Attribution 3.0 Unported Licence
Controlled encapsulation of colloidal semiconductor quantum dots in a microdroplet†
Maciej
Biały
a,
Martyna
Jankowska
b,
Karolina
Sulowska
 bc,
Marcin
Szalkowski
b,
Joanna
Niedziółka-Jonsson
*a and
Sebastian
Maćkowski
*b
bc,
Marcin
Szalkowski
b,
Joanna
Niedziółka-Jonsson
*a and
Sebastian
Maćkowski
*b
aInstitute of Physical Chemistry, Polish Academy of Sciences, ul. Kasprzaka 44/52, 01-224 Warszawa, Poland. E-mail: jniedziolka@ichf.edu.pl
bInstitute of Physics, Faculty of Physics, Astronomy and Informatics, Nicolaus Copernicus University in Toruń, ul. Grudziądzka 5, 87-100 Toruń, Poland. E-mail: mackowski@fizyka.umk.pl
cInstitute of Advanced Materials, Wroclaw University of Science and Technology, Wybrzeże Wyspianskiego 27, 50-370 Wroclaw, Poland
First published on 29th November 2024
Abstract
Precise deposition of materials on surfaces is one of the crucial steps in a broad range of applications and functional device fabrication at both the micro- and nanoscale. Semiconductor quantum dots (QDs), with their unique optical and physical properties, have frequently been a focus of attempts for micro- or nano-positioning. Here, we present a method for reproducible, repetitive, and precise deposition of QD-containing microdroplets using hydrophobic micropipettes without any need to apply an actuation voltage. We show that upon deposition, the droplets can be translated across the surface and placed in defined patterns. The incorporation of semiconductor QDs allows for the confirmation of the morphological integrity of the microdroplets after deposition and translation. Fluorescence blinking observed for droplets containing highly diluted QD solution proves that our approach is suitable for embedding individual emitters in such microdroplets.
1. Introduction
Techniques of local deposition and precise manipulation of various materials have been constantly developed using both micro- and nano-fabrication approaches, driven primarily by potential medical1 and electronic2 applications. This rather diverse research field covers advanced methods of material deposition, such as photolithography,3 lift-off techniques,4 thin film deposition,5 etching,6 and many more. These classical techniques yield micro- and nanostructures that are well-organized and precisely placed on desired locations on the substrate. Additionally, novel approaches for controlled deposition of materials, including ultra-precise printing of silver lines7 or nanotransfer printing of patterned gold arrays8 have been gaining ground.Semiconductor quantum dots (QDs), featuring nanoscale dimensions, have frequently been a focus of micro- or nano-positioning efforts. After decades of synthesis development, their morphology and optical properties can be adequately controlled. Indeed, depending on core composition, presence of a shell, solvent, and surface functionalization, QDs can feature tuneable narrow emission spectra,9 high luminescence quantum yields, as well as sufficient optical,10 chemical, and thermal stability.11 Their unique electronic and optical properties12 have rendered them useful for numerous application areas, including photovoltaics,13 flexible wearable electronic devices,14 or light-emitting diodes.15
In this regard, precise deposition of colloidal QDs on arbitrary surfaces and in controlled quantities and geometries is a natural path of development towards further optimization of electronic and optoelectronic devices containing QDs. Recently, a number of techniques related to QD deposition have been demonstrated. Using spin-coating,16 photolithography,17,18 electrohydrodynamic jet spraying,19 electron beam lithography,20 ink-jet printing,21 dip-pen nanolithography22 or microcontact printing,23 well-organized QDs architectures have been achieved, were QDs were aligned in the form of stripes, layers or droplet arrays. In most, if not all cases, the obtained structures contained large number of QDs. Alternatively, in order to prepare samples where single QDs can be observed and individually probed, spin-coating,24 self-alignment25 or functionalized surface binding26 were applied. However, these approaches, while yielding single QDs deposited over relatively large areas, lack the precision of spatial positioning, as the locations of the QDs are random and difficult to control.
Yet another limitation of most of these techniques concerns the requirement of advanced, rather expensive apparatus as well as competencies and experience in many fabrication techniques necessary for obtaining well-organized depositions of material with submicrometric precision. An appealing approach aimed to overcome these inconveniences regarding droplet deposition is the voltage-controlled injection of small amounts of liquid with nanocapillaries, where single-molecule delivery was achieved.27–30 In an alternative approach, adjusting the diameter of a microcapillary connected to a compressor enabled on-demand deposition of droplets in the volume range from nanoliters31 to a few femtoliters32 over the substrate.
The applicability of glass capillaries for quantitative local deposition of materials has been demonstrated by Hennig et al.,30 where nanopipettes with diameters of approximately 100 nm were used to deposit negatively charged oligonucleotides attached to Alexa fluor 647 dye. The experiments were carried out using modified scanning ion conductance microscopy, where a conductive layer covered the coverslip to allow voltage-driven deposition of negatively charged, fluorescence-labelled oligonucleotides. With microelectrodes connected both to the surface and the nanopipette, by applying potentials in the range of millivolts, nanometer-sized spots were deposited in a polymer layer.
In this work, we have developed a voltage-less approach to the precise deposition of microdroplets in desired locations over a hydrophobic glass surface. The droplets are deposited directly onto the surface with no need to embed them into any additional matrix. In our approach, a microcapillary connected to a syringe pump was filled with a QD colloid to make the droplets optically active. Importantly, after being deposited, the droplets can be smoothly moved across the surface without any degradation of either their morphology or their optical properties. Fluorescence imaging of matrixes of droplets containing highly diluted QD colloids confirms the ability of this technology to embed just a single quantum emitter in such a droplet. Contrary to previous reports, our method requires no applied potential, with the associated limitations of needing a conductive surface and electrolyte in the solution. We also work with a standard syringe pump in contrast to the very expensive compressors used in ref. 31 and 32.
2. Experimental section
2.1 Materials
All compounds were purchased and used without further purification. Hydrophilic cadmium telluride Quantum Dots (5 nm CdTe QDs, emission maximum at 720 nm ± 5 nm, coated with carboxylic groups) were purchased from PlasmaChem GmbH. Toluene (99.8%, anhydrous) was obtained from Sigma-Aldrich. Ammonium hydroxide solution (NH3 × H2O, 25%), acetone (99.5%) and 1,2-dichloroethane (AR) were purchased from Chempur. N-Octyltrimethoxysilane (OTMS, 97%), was obtained from abcr GmbH. Hydrogen peroxide (H2O2, 30%) was purchased from Stanlab. Deionized water (DI) with a resistivity of 18.2 MΩ cm was obtained using a Sartorius purification system. Glass capillaries with filament (GB120F-10) were acquired from Science product.2.2 Hydrophobization of glass surface
To increase the contact angle while depositing microdroplets, the glass surface was silanized using OTMS.33 At first, the glass coverslips were cleaned by ultrasonicating them in acetone (10 minutes), then in 1,2-dichloroethane (10 minutes) and three times in DI water (3 × 2 minutes). In the next step, a polypropylene rack with the cleaned glass was placed inside a vessel with a mixture of 5![[thin space (1/6-em)]](https://www.rsc.org/images/entities/char_2009.gif) :1:1 v/v/v ratio of H2O:H2O2:NH3 × H2O at 70 °C for one hour. Afterwards, the coverslips were washed with DI water and dried in an oven at 100 °C for four hours. Then, the glass coverslips were submerged in a 4% solution of OTMS in toluene and kept for one week in a desiccator. Finally, the glass coverslips were cleaned in toluene in an ultrasonic bath (20 minutes) and then in 1,2-dichloroethane (30 minutes), dried with inert gas and stored in a desiccator until used.
:1:1 v/v/v ratio of H2O:H2O2:NH3 × H2O at 70 °C for one hour. Afterwards, the coverslips were washed with DI water and dried in an oven at 100 °C for four hours. Then, the glass coverslips were submerged in a 4% solution of OTMS in toluene and kept for one week in a desiccator. Finally, the glass coverslips were cleaned in toluene in an ultrasonic bath (20 minutes) and then in 1,2-dichloroethane (30 minutes), dried with inert gas and stored in a desiccator until used.
2.3 Manufacturing and surface modification of microcapillaries
A laser puller (P-2000, Sutter Instruments) apparatus was used to obtain microcapillaries with the desired tip diameter. The inner tip diameter was varied for experimentation but was kept in the rage from several to about 25 micrometres. To prevent leakage of the suspension around the microcapillaries, they were chemically modified with OTMS to render them hydrophobic. The microcapillaries were put in a vial with few droplets of OTMS and kept at 150 °C in an oven for two hours. After that, they were stored in a Petri dish until used.2.4 Dark field optical images
To control the placement of microdroplets on hydrophobic glass in real time, an inverted optical microscope was used (Nikon Eclipse MA200). The microscope was set for dark field mode during all experiments. Images were collected with a 20× air objective (TU Plan Fluor 20×, NA = 0.45, Nikon).2.5 Deposition of microdroplets onto the modified glass surfaces
In order to spatially control the deposition of microdroplets with emitters, the inverted optical microscope was equipped with a micromanipulator (MT3-Z8, Thorlabs). At first, the hydrophobic microcapillary, attached to the arm of the micromanipulator, was filled with 2 μL of QD suspension of with a concentration of 0.1 mg mL−1 of QDs in DI water, corresponding to ∼2.6 × 10¹⁴ mL−1 (from the weight given by the supplier as 230 kDa). The microcapillary was connected to a syringe in a pump (Harvard Apparatus, Pump 11 Elite) using a silicone tube. Pressure was applied to push the colloid suspension to the tip of the microcapillary. After that, the modified glass was placed under the microcapillary. Next, the microcapillary was gradually lowered until colloid at the tip of the capillary touched the glass surface. During lifting of the microcapillary, a droplet of QDs was left on the glass surface.2.6 Spatial organization of microdroplets with QDs on the glass surface
Spatial organization of emitter droplets utilises the same setup as for the deposition of microdroplets. The difference is that instead of a microcapillary, a hydrophilic glass microrod was placed in the arm of the micromanipulator. The glass microrod was pulled using the laser puller and its diameter was around 2 μm. After mounting, the glass microrod was gradually lowered until tip touches the glass surface. To move a droplet, the tip of the microrod was placed next to the microdroplet. Then, using a joystick controller, the hydrophilic tip was slowly moved in the desired direction dragging the microdroplet along with it. After reaching the required position, the microrod was lifted away from the glass surface.2.7 Fluorescence imaging and spectroscopy
To measure the optical properties of the deposited microdroplets a wide-field fluorescence microscope was used. The microscope was based on a Nikon Ti-U inverted microscope body. Excitation of 100 μW at 405 nm wavelength was provided by an LED illuminator (Prizmatrix Ltd) passing through an optical bandpass filter (ET 405/10, Chroma). Next, light was reflected by a dichroic mirror (FF655, DiO2, Semrock) and reached the sample through an oil immersion objective (Plan Apo 100×, NA = 1.4, Nikon). The emission signal was filtered out using optical longpass (FELH650, Thorlabs) and bandpass filters (FB 700/40, Thorlabs). As a detector Andor iXon3 EMCCD camera was used. Fluorescence kinetics were recorded using gain 300 with an acquisition time of 0.3 second per fluorescence intensity map. Single fluorescence intensity maps were collected with gain 0 and an acquisition time of 0.3 seconds.3. Results and discussion
The key idea behind the experiments described in this work concerns controlled deposition of microdroplets with QDs at desired locations using a microcapillary but, in contrast to the approach described in,30 without the need of applying an external voltage. The results of the initial approach, where a hydrophilic microcapillary filled with QDs colloid was used to deposit microdroplets in desired locations onto a hydrophobic glass surface, are displayed in Fig. 1. In Fig. 1(a) we show a typical microcapillary, which touches the glass coverslip. As described above, the microcapillary filled with QD colloid was attached to a silicone tube, in which pressure was generated pushing the QD solution to the tip. Next, the microcapillary was lowered to the point in which the colloid touches the glass coverslip in the desired place. The deposition process, from lowering of the microcapillary to the point when the suspension touches the surface, was monitored and controlled in real time using optical microscope operating in a dark-field mode. In the final step, the microcapillary was lifted and a microdroplet was left behind in the location, where it was in contact with the glass surface. | ||
| Fig. 1 Droplet deposition with an unmodified microcapillary. (a) Dark-field optical image of a hydrophilic microcapillary with inner diameter of 9 μm. (b) Dark-field microscopy image of 15 QD containing droplets deposited successively in a single process. Yellow arrows indicate the sequence of droplets deposition. (c) Wide-field fluorescence intensity map of QDs in deposited droplets upon illumination with 405 nm excitation wavelength, the emission was detected at 720 nm. (d) Fluorescence intensity profiles extracted for 3 selected droplets containing QDs. The scale bar is always 10 μm, and the concentration of the QD colloid used for deposition was 0.1 mg mL−1. | ||
In Fig. 1(b) we show a dark-field microscopy image of a sequence of microdroplets deposited using this method with the microcapillary shown in Fig. 1(a). The sequence of microdroplet deposition is shown in Fig. 1(b) with arrows. The parameters of the deposition were identical in each case. The dark-field image indicates a highly non-uniform distribution of QDs within the droplets, as well as high variation of the sizes of the deposited droplets. This might be due to the low surface tension between the QD colloid suspension and the micropipette which leads to the suspension wetting the outside of the microcapillary. As this process is difficult to control, it may result in microdroplets with broadly distributed sizes. A second explanation may have been that the glass coverslip was not uniformly covered with the hydrophobic compound, which would also affect surface tension between the deposited suspension and the surface. Such effects could easily contribute to high variability of sizes of microdroplets and non-uniform distribution of QDs within them.
The non-uniform distribution of QDs within the microdroplets is confirmed with fluorescence image of the microdroplets, acquired using a wide-field fluorescence microscope (Fig. 1(c)). Fluorescence of QDs was excited using 405 nmlight. Indeed, the fluorescence image displays large variability of both the size of microdroplets and the distribution of QDs within the droplets. For quantitative demonstration of this effect, we have extracted cross-sections for three typical microdroplets (Fig. 1(d)). All of them feature high intensity of emission at the edges attributable to the coffee ring effect. In addition, there is also a high-intensity signal in the middle of the droplet. These results indicate that using the approach based on a hydrophilic microcapillary working as a deposition nozzle it would be very difficult to control the size of the microdroplets and the distribution of QDs within the droplets. To address these points, we took a step to hydrophobized the microcapillary to prevent adsorption and accumulation of colloid on the outer wall.
The effect of hydrophobization of the micropipette on the quality of microdroplets is readily visible in Fig. 2, where the results of microdroplet deposition using micropipettes with diameters of 24 μm and 6 μm are presented. The results obtained for the larger capillary are summarized in the left column, while on the right side the results from the smaller capillary are presented. As previously, both experiments were performed on hydrophobic glass coverslips.
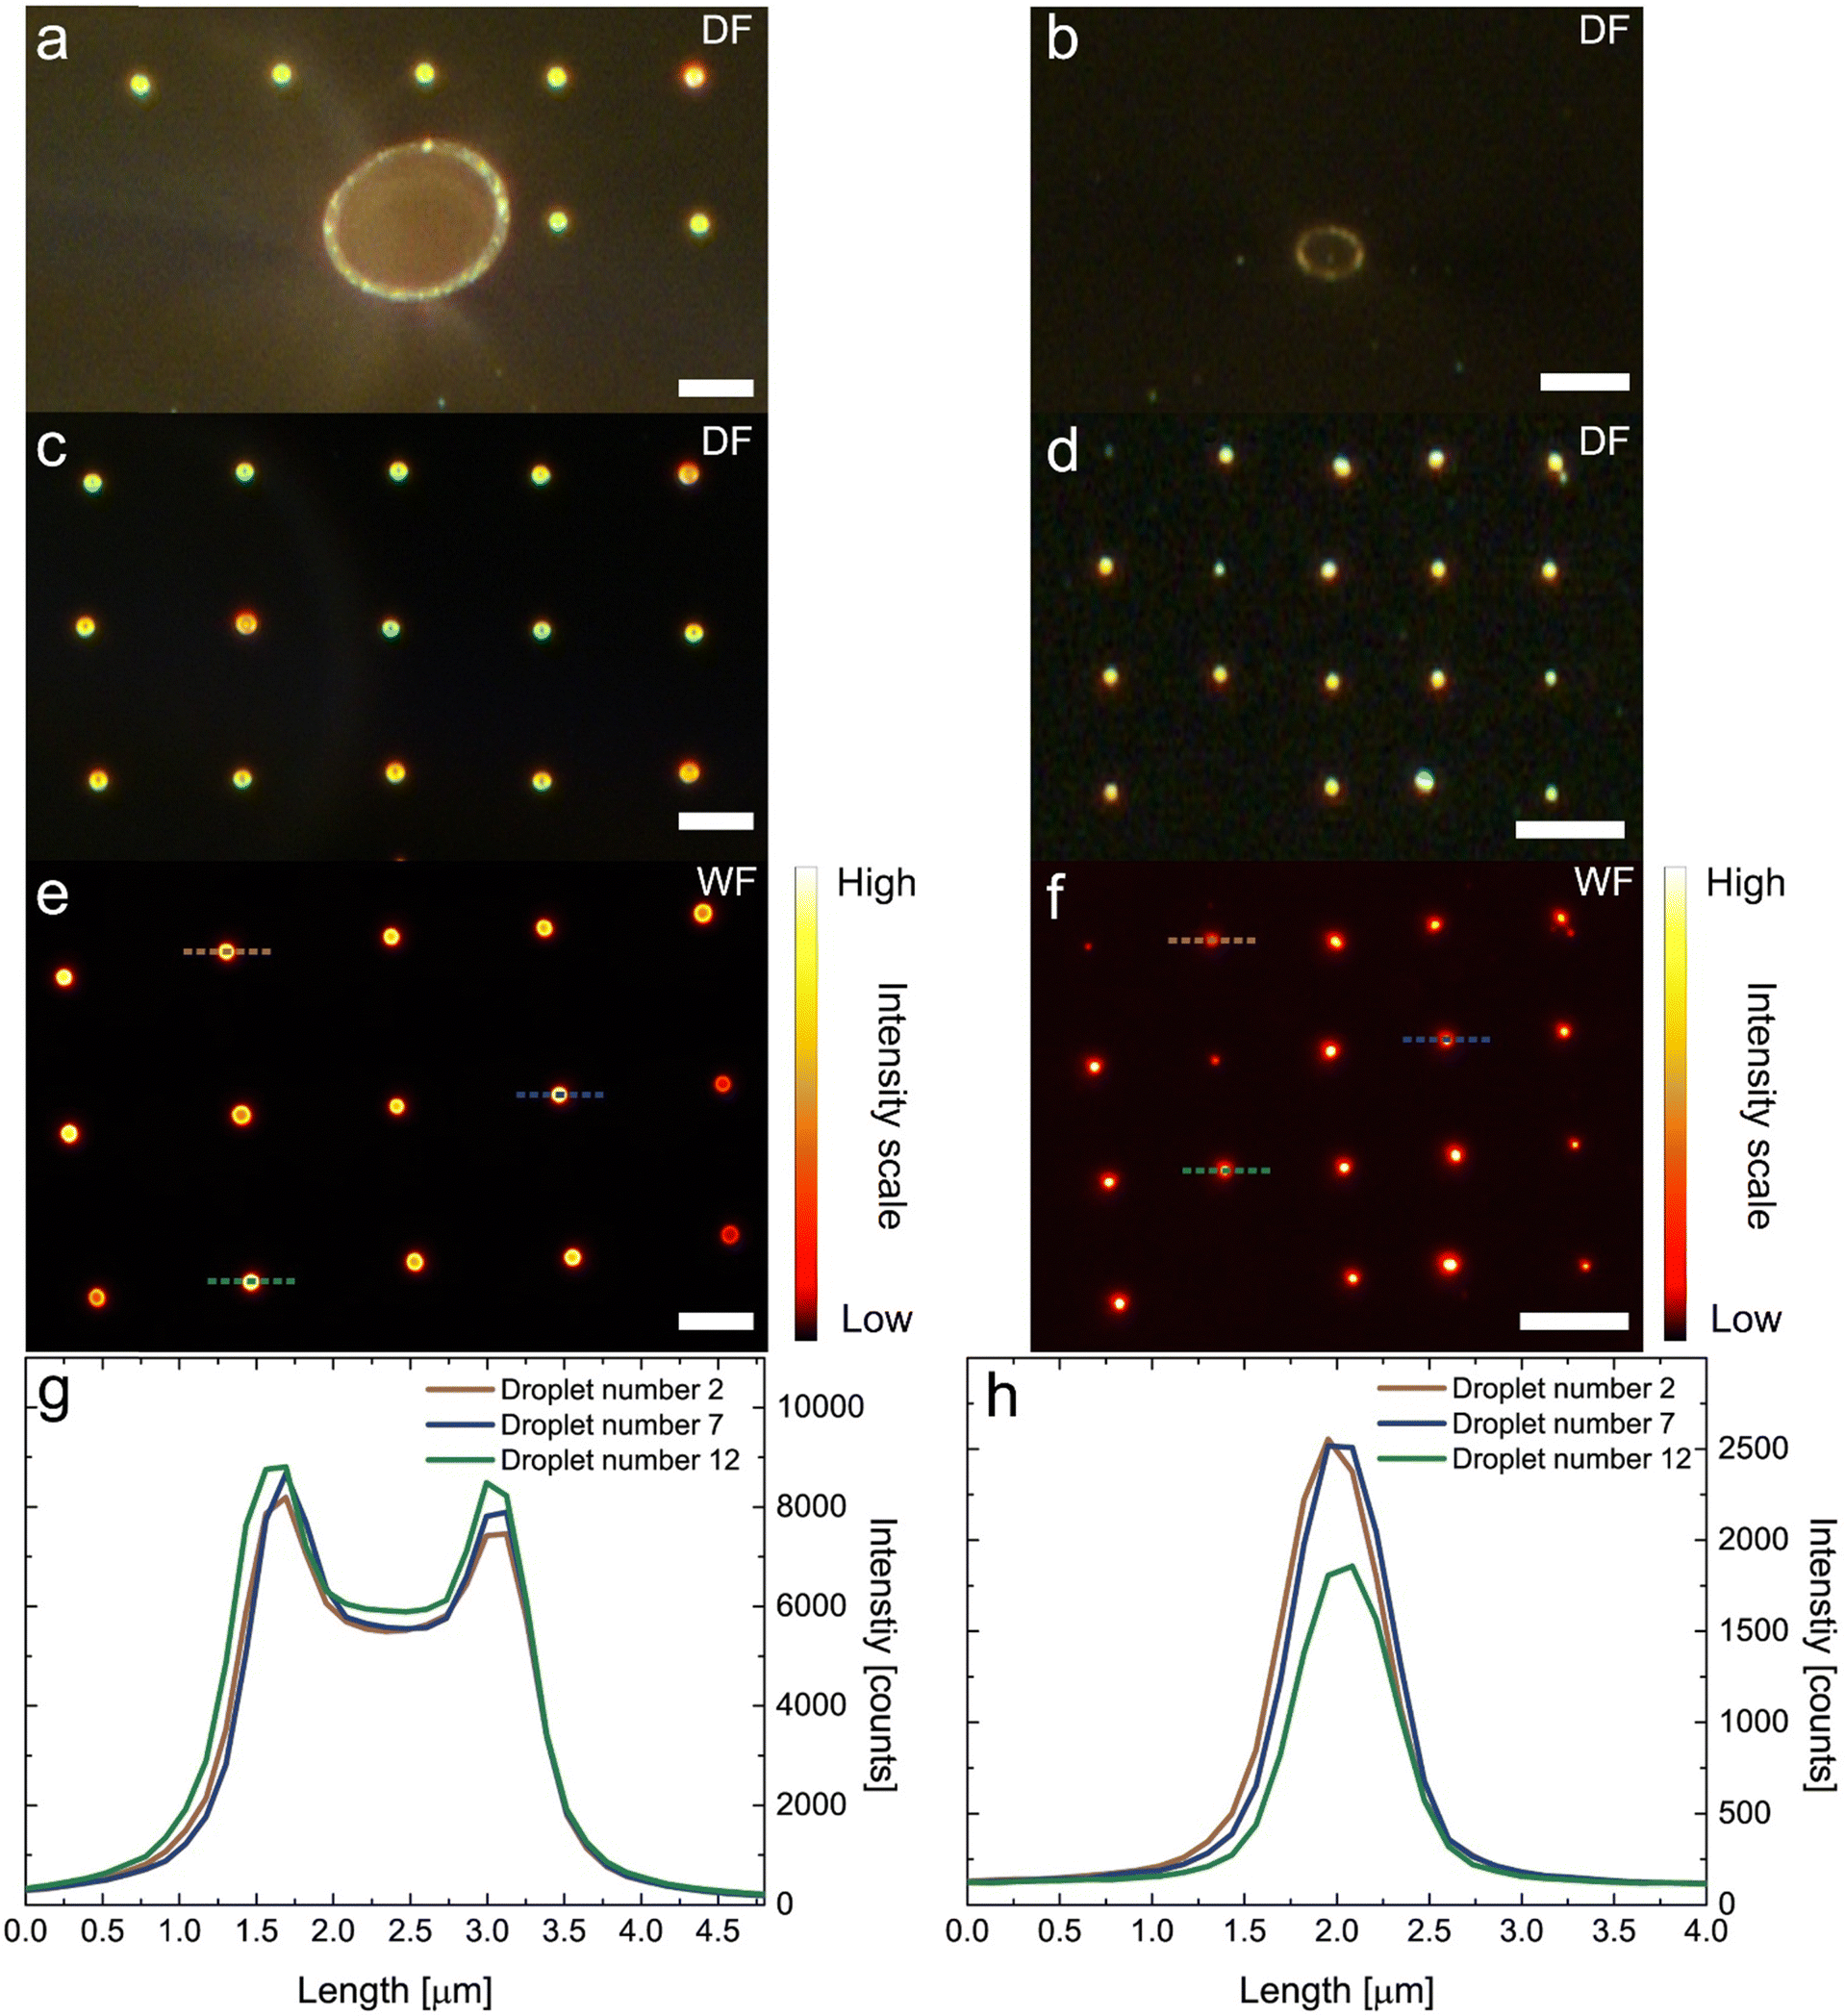 | ||
| Fig. 2 Influence of the microcapillary diameter on both shape and intensity of deposited droplets with QDs. (a) and (b) Dark field images of hydrophobic microcapillaries (inner diameters were 24 μm and 6 μm, respectively). (c) and (d) Dark field microscopy images of droplets of QDs deposited on hydrophobic glass using these microcapillaries. (e) and (f) Wide-field fluorescence intensity maps of microdroplets of QDs excited with 405 nm excitation wavelength and detected at 720 nm wavelength. (g) and (h) Fluorescence intensity profiles of selected microdroplets of QDs. Scale bars are 10 μm. The concentration of the QD colloid used for deposition was 0.1 mg mL−1. | ||
Using an identical protocol as the one applied for obtaining the results shown in Fig. 1, a micropipette with 24 μm in diameter (Fig. 2(a)) was filled with a QD colloid, and with the assistance of pressure generated through a silicone tube, the suspension was pushed to the tip of the nozzle. In Fig. 2(c) a dark field image features an array of microdroplets deposited using the microcapillary with large diameter. The improvement is clearly visible. Unlike in the previous attempt, the deposited microdroplets are similar in size and shape. Moreover, they are located in the central areas, exactly where the colloid suspension was in contact with the glass coverslip. This reproducibility is presumably due to the increased surface tension between the colloid and both the hydrophobized glass coverslip and the microcapillary, which inhibits any substantial wetting of the QD suspension around the micropipette.
The distribution of QDs inside deposited microdroplets is presented in the fluorescence intensity map acquired for the same area using wide-field fluorescence microscopy (Fig. 2(e)). The area containing QDs was illuminated using 405 nm wavelength. Once again, in contrast to the microdroplets shown in Fig. 1, the microdroplets deposited with hydrophobized microcapillary are very similar in size and diameter, as well as being organized in a regular array. The distribution of QDs inside the microdroplets is shown with fluorescence intensity profiles of cross-sections of three selected microdroplets (Fig. 2(g)). While the intensity profiles feature a coffee ring shape, with characteristic high intensity at the edges of the microdroplets, all of them are essentially identical. This is valid for the vast majority of the microdroplets deposited in this sequence. In clear contrast to the previous measurements, the microdroplets are similar both in terms of fluorescence intensities and diameters. These results unequivocally prove the advantage of using hydrophobic microcapillary for the controlled deposition of microdroplets with positional control and comparable diameters, with uniform distribution of QDs inside the droplets.
To reduce, or ideally – remove – the coffee ring effect, a microcapillary with a smaller tip diameter was used. The experiment shown in the right column of Fig. 2 was performed using a hydrophobic micropipette with an inner diameter of 6 μm (Fig. 2(b)). The sequence of microdroplet deposition was identical as in the case where a larger micropipette was used. A dark-field microscopy image shown in Fig. 2(d) features a matrix of equidistantly deposited microdroplets with high size uniformity, which are also visibly smaller than the droplets obtained with the 24-micron diameter microcapillary. Clearly, the morphology of the microdroplets depends not only on the surface modifications but also on the inner diameter of the used microcapillary.
A wide-field fluorescence image acquired for the matrix of microdroplets deposited using a 6-μm diameter micropipette (Fig. 2(f)) demonstrates the high size and shape uniformity of the QD microdroplets, in addition to their precise positioning on the substrate. As seen from the cross-sections of the fluorescence spots (Fig. 2(h)), the fluorescence profiles feature an almost Gaussian shape with a maximum intensity of the QD emission located in its centre (Fig. 2(h)). This observation is qualitatively different from both cases discussed previously. The width of the fluorescence profiles extracted for these microdroplets is below 1 micron (the full-width-at-half-maximum is 600 nm), which is quite remarkable, taking into account the size of the micropipette used for deposition. By comparing the emission intensities shown in Fig. 2(g) and (h), we may claim that the microdroplets obtained using a smaller micropipette contain fewer QDs. This is expected as the area the suspension covers was much smaller using the smaller micropipette and a smaller amount of the QD suspension had a chance to be deposited. In conclusion, the smaller contact area results in lower amounts of deposited QDs, shown by the lower fluorescence intensity compared to microdroplets deposited using a larger diameter capillary.
With the appropriate chemical modification of microcapillaries, we have achieved a method of reproducible and repetitive, precise deposition of microdroplets at glass surfaces. The increase of surface tension between the suspension and the depositing nozzle results in substantial improvement of size control as well as distribution of QD emitters within the microdroplets. Furthermore, by changing the capillary diameter, it is possible to vary the contact area between QD colloid suspension and the hydrophobic surface. It results in different amounts of QDs in the deposited microdroplets and thus, when decreasing the tip size, we observe a transformation in the QDs distribution in microdroplets from a coffee ring like to Gaussian like shapes.
An intriguing aspect of this microdroplet deposition technology concerns the ability to vary – in a controlled way – the positions of microdroplets after the deposition process. Devising an approach to allow the movement of such microdroplets with emitters would enable a straightforward way towards assembling various types of hybrid nanostructures, where control over position and distance plays a critical role.
The result of experiments aimed at the positional movement and control of deposited microdroplets is presented in Fig. 3. In the first step, a matrix of microdroplets was deposited on a glass substrate in the same way as described previously. In this case, a hydrophobic microcapillary with an inner diameter of 7.5 μm was used (showed in the inset in Fig. 3(a)). The image of a matrix with spatially organized microdroplets was acquired using dark-field optical microscopy (Fig. 3(a)). In the second step, the microcapillary was replaced with a glass microrod in the piezoelectrically controlled manipulation arm. Precise control of the microrod spatial position (in X and Y directions) was essential for achieving the movement and precise positioning of microdroplets. In this procedure, we first lower the microrod until touching the glass surface next to a deposited microdroplet. Then, we moved the microrod towards the selected QD droplet. When it reached the microdroplet, the microdroplet could be pushed by the moving microrod. This procedure was repeated until 3 selected QD-containing microdroplets were aligned along a line at a remote location (Fig. 3(b)). During this procedure, we did not observe any residues at the places of deposition of the transferred microdroplets. At first glance, the droplets, when inspected with the optical microscope, look undamaged after being pushed back and forth. However, the image shown in Fig. 3(b) contains some spots that were not observed during the initial scan, particularly on the left side of the image. These are not QD droplets but rather can be attributed to residues deposited accidentally during the imaging process. This is confirmed by the absence of any fluorescence associated with these spots (Fig. 4(a)).
 | ||
| Fig. 3 Spatial organization of QDs droplets. (a) Dark field image of deposited QDs droplets before physical re-alignment. White rectangle inset: hydrophobic microcapillary with inner diameter of 7.5 μm. (b) A dark field image of the same region presented in a with 3 moved droplets of QDs. Scale bars are 10 μm. The concentration of the QD colloid suspension used for deposition was 0.01 mg mL−1. | ||
 | ||
| Fig. 4 Fluorescence intensity emission of deposited and aligned QDs droplets. (a) Wide-field fluorescence intensity map of QDs droplets from Fig. 3(b), upon illumination with 405 nm excitation wavelength, the emission was detected at 720 nm. (b) Fluorescence intensity profiles of 3 unmoved droplets of QDs. (c) (solid lines) Fluorescence intensity profiles of 3 moved droplets of QDs. (dotted lines) Colour-coded fluorescence intensity profiles along places where droplets were originally deposited. The scale bar is 10 μm. | ||
In order to verify that the spatial organization of microdroplets using the microrod leaves minimal effect on the microdroplets themselves, a wide-field fluorescence microscopy experiment was carried out (Fig. 4(a)). Measurements displayed in Fig. 4 were performed on the spatially organized microdroplets shown in Fig. 3(b).
Based on this result, we can observe that all the microdroplets emit light at comparable intensity levels. Moreover, no emission is visible from the initial locations from where the 3 selected microdroplets were moved. This suggests that the droplets maintain their properties despite the movement; they are intact and experience no degradation when being pushed by the glass microrods. Importantly, the residual-free movement of the microdroplets can only be achieved on a sufficiently hydrophobic surface. In such cases, the droplet is held together by surface tension and does not wet the substrate. The capping agents of the quantum dots are hydrophilic, so the QDs stay in the droplet during its movement on the surface.
For more quantitative information, fluorescence intensity profiles were extracted for the three spatially organized QD-containing microdroplets. In Fig. 4(b), we show the fluorescence intensity profiles obtained for three microdroplets that were re-deposited and three that were left in their initial locations. As expected, the shape of the profiles mimics a single Gaussian peak, similarly as discussed for the microdroplets deposited using the smaller microcapillary (Fig. 2(h)). However, the emission intensity measured for these droplets was somewhat less due to the more diluted QD suspension used in this experiment. Importantly, evaluation of diameters of as-deposited QDs droplets yields widths at the half maximum of less than 500 nm. This might suggest that the amount of the deposited emitter dispersion depends to a larger degree on the suspension concentration than the tip diameter of a microcapillary.
The cross-sections extracted for the microdroplets that were moved from their original, as-deposited positions are displayed in Fig. 4(c), with the intensity scale identical to the results obtained for the previous three microdroplets. In this case, we also see similar Gaussian-shaped lines, which again strongly suggests that droplets were not damaged during translation across the surface. In other words, their shape is preserved. Moreover, the intensity level of the QD emission is comparable to that measured for the fixed microdroplets deposited within the same process. The dotted lines in Fig. 4(c) are the intensity profiles obtained at the initial locations of the moved microdroplets. No fluorescence emission was detected for these places, meaning no leftovers remained.
These experiments show that QD droplets containing less-concentrated QD suspension are much more uniform in terms of fluorescence intensity than the more concentrated ones. The microdroplets can be moved onto a glass surface with a microrod without changing their morphology and optical properties. Importantly, the size of the microdroplets depends more strongly on the concentration of the QD suspension than the diameter of a microcapillary.
In the final step of the experiments, we test the feasibility of encapsulating just a single QD in a microdroplet. The approach was based on depositing a series of microdroplets using hydrophobic microcapillaries with similar diameters but with gradually more diluted suspensions of the QD colloid. The results are summarized in Fig. 5, where fluorescence images of deposited microdroplets containing QD colloid at varied concentrations are displayed (Fig. 5(a)–(d)). In all cases, the excitation wavelength of 405 nm was used. The images are accompanied by fluorescence intensity profiles extracted along the microdroplets for more quantitative data analysis (Fig. 5(e)–(h)). Importantly, for unambiguous observation of single QDs in microdroplets, we have also collected movies of fluorescence, from which timetraces for emission spots can be obtained. Kinetics were acquired for 135 seconds with a gain of 300 set on the EMCCD camera. Corresponding timetraces calculated for individual microdroplets are plotted in respective panels in Fig. 5(i)–(l).
 | ||
| Fig. 5 Deposition of droplets with different QD concentrations. All droplets were deposited onto hydrophobic glass surfaces. (a)–(d) Wide-field fluorescence intensity maps for droplets of QDs with concentrations of: (a) 10−3 mg mL−1, (b) 6.6 × 10⁻⁴ mg mL−1, (c) 5 × 10⁻⁴ mg mL−1, (d) 3.3 × 10⁻⁴ mg mL−1. The excitation wavelength was 405 nm and emission was detected at 720 nm. (e)–(h) Corresponding intensity profiles along droplets with varied QDs concentration. (i)–(l) Corresponding fluorescence intensity timetraces for selected areas containing measured droplets with background correction. The scale bar is 10 μm. | ||
With a gradual decrease of concentration of the QD colloid from 10−3 mg mL−1 to 3.3 × 10⁻⁴ mg mL−1 we observe a substantial change of the fluorescence intensity measured for the microdroplets. While for the most concentrated microdroplets (Fig. 5(e)) the average intensity is of the order of 2000 counts, the microdroplets obtained with highly diluted QDs suspension feature intensities of around 100 counts. Importantly, the experimental conditions and acquisition parameters were the same throughout the whole sequence of QD dilutions to facilitate straightforward comparison of the results. For the medium concentrations of the QD colloid, the intensities are between these extreme cases (1000 and 700 counts, respectively, for concentrations of 6.6 × 10⁻⁴ mg mL−1 and 5 × 10⁻⁴ mg mL−1). We emphasize that in all cases fluorescence intensity profiles are of Gaussian shape and are comparable within each given set of microdroplets. This shows, once again, the uniformity and repeatability of the microdroplet deposition technology developed in this work.
Semiconductor QDs are known for the blinking effect when monitoring the fluorescence intensity of single QDs.34,35 This behavior stems from the continuous transition between the dark, non-emissive state and the bright electronic state in the QD. Importantly, the dilution of QD suspension used for depositing microdroplets – in addition to a substantial reduction of fluorescence intensity – also yields a qualitative metamorphosis of the fluorescence timetraces, as shown in Fig. 5(i)–(l). For the first two concentrations (Fig. 5(i) and (j)) the timetraces indicate a gradual decrease of fluorescence, maybe with some occasional intensity steps. The gradual decrease results from the photobleaching of QDs within a microdroplet. Such behavior is characteristic of multiple emitters, indicating that at least 10 QDs are located within the studied microdroplets in these two cases. The intensity steps, although not obvious, are better visible for microdroplets obtained with the suspension of 6.6 × 10⁻⁴ mg mL−1 QD concentration. In clear contrast, for microdroplets obtained from the QD colloid with the concentration of 5 × 10⁻⁴ mg mL−1, the emergence of well-defined blinking of fluorescence is obvious (Fig. 5(k)), although a gradual decrease of fluorescence intensity is also observed, in particular for shorter times. One can assume that just a few QDs are contained in the microdroplet. Finally, for the most diluted microdroplets, the timetrace features a step-like character, frequently observed for single QDs36 (see movie in the ESI†). This is an indication that probably a single QD is contained in this microdroplet (Fig. 5(l)). Examination of intensity changes reveal zero-one emission property. Clearly, the microdroplet deposition technology developed in this work enables not only on-demand deposition of small amounts of emitters at controlled locations and their precise movement on the substrate. It also offers the unique possibility of encapsulating a single optically active emitter in such a microdroplet.
The main difference between the method proposed here and the voltage-driven deposition based on the SICM technique30 is that with our approach microdroplets can be deposited on any substrate – including non-conductive ones. In addition, there is no need to introduce an electrode in the pipette or to add an electrolyte to the deposited liquid to make it conductive. Additionally, in contrast to approaches described in31 and,32 our system works with a standard syringe pump. The main limitation of our method is connected with the optical control, which limits the smallest size of the droplets that can be deposited with some feedback. Significant reduction of the size of the droplets would require working with nanocapillaries and all the technical complications associated with those.
4. Conclusion
Controlled manipulation of nanostructures is an important aspect of research, with high implications for on-demand assembly of functional systems. Our results, which demonstrate a reproducible, repetitive, and voltage-less method of precise deposition of microdroplets, can be considered a significant step towards building hybrid nanostructures comprising a variety of materials. Incorporation of semiconductor QDs into the microdroplets allows for confirmation of their morphological and optical integrity, also upon precise translations over the substrate surface. The unique QD property of fluorescence blinking provides indication that such an approach can be used to embed just a single quantum emitter in a microdroplet.Data availability
Data for the article is available at the RepOD repository, https://doi.org/10.18150/9ACT09.37Conflicts of interest
The authors declare that they have no conflict of interest. They have no known competing financial interests or personal relationships that could have appeared to influence the work reported in this paper.Acknowledgements
JNJ acknowledge financial support from the National Science Centre of Poland grant no. 2023/49/B/ST4/01450.References
- T. Ngernsutivorakul, T. S. White and R. T. Kennedy, Microfabricated Probes for Studying Brain Chemistry: A Review, ChemPhysChem, 2018, 19, 1128–1142 CrossRef CAS PubMed.
- Z. Dong, Q. He, D. Shen, Z. Gong, D. Zhang, W. Zhang, T. Ono and Y. Jiang, Microfabrication of functional polyimide films and microstructures for flexible MEMS applications, Microsyst. Nanoeng., 2023, 9, 31 CrossRef.
- E. Sharma, R. Rathi, J. Misharwal, B. Sinhmar, S. Kumari, J. Dalal and A. Kumar, Evolution in Lithography Techniques: Microlithography to Nanolithography, Nanomaterials, 2022, 12(16), 2754 CrossRef CAS.
- L. Guo and S. P. DeWeerth, An Effective Lift-Off Method for Patterning High-Density Gold Interconnects on an Elastomeric Substrate, Small, 2010, 6(24), 2847–2852 CrossRef CAS PubMed.
- Y. Yunus, N. A. Mahadzir, M. N. Mohamed Ansari, T. H. Tg Abd Aziz, A. Mohd Afdzaluddin, H. Anwar, M. Wang and A. G. Ismail, Review of the Common Deposition Methods of Thin-Film Pentacene, Its Derivatives, and Their Performance, Polymers, 2022, 14, 1112 CrossRef CAS PubMed.
- T. He, Z. Wang, F. Zhong, H. Fang, P. Wang and W. Hu, Etching Techniques in 2D Materials, Adv. Mater. Technol., 2019, 4, 1900064 CrossRef CAS.
- M. Łysień, Ł. Witczak, A. Wiatrowska, K. Fiączyk, J. Gadzalińska, L. Schneider, W. Stręk, M. Karpiński, Ł. Kosior, F. Granek and P. Kowalczewski, High-resolution deposition of conductive and insulating materials at micrometer scale on complex substrates, Sci. Rep., 2022, 12, 9327 CrossRef PubMed.
- K. S. Kwok, Y. Zuo, S. J. Choi, G. J. Pahapale, L. Gu and D. H. Gracias, Toward Single Cell Tattoos: Biotransfer Printing of Lithographic Gold Nanopatterns on Live Cells, Nano Lett., 2023, 23, 7477–7484 CrossRef CAS PubMed.
- D. J. Norris and M. G. Bawendi, Measurement and assignment of the size-dependent optical spectrum in CdSe quantum dots, Phys. Rev. B: Condens. Matter Mater. Phys., 1996, 53, 16338–16346 CrossRef CAS.
- C. Yang, G. Zhang, L. Feng, B. Li, Z. Li, R. Chen, C. Qin, Y. Gao, L. Xiao and S. Jia, Suppressing the photobleaching and photoluminescence intermittency of single near-infrared CdSeTe/ZnS quantum dots with p-phenylenediamine, Opt. Express, 2018, 26, 11889 CrossRef CAS.
- J. Ko, B. G. Jeong, J. H. Chang, J. F. Joung, S.-Y. Yoon, D. C. Lee, S. Park, J. Huh, H. Yang, W. K. Bae, S. G. Jang and J. Bang, Chemically resistant and thermally stable quantum dots prepared by shell encapsulation with cross-linkable block copolymer ligands, NPG Asia Mater., 2020, 12, 19 CrossRef CAS.
- F. P. García De Arquer, D. V. Talapin, V. I. Klimov, Y. Arakawa, M. Bayer and E. H. Sargent, Semiconductor quantum dots: Technological progress and future challenges, Science, 2021, 373, eaaz8541 CrossRef.
- R. D. Chavan, M. Wolska-Pietkiewicz, D. Prochowicz, M. Jędrzejewska, M. M. Tavakoli, P. Yadav, C. K. Hong and J. Lewiński, Organic Ligand-Free ZnO Quantum Dots for Efficient and Stable Perovskite Solar Cells, Adv. Funct. Mater., 2022, 32, 2205909 CrossRef CAS.
- M. K. Choi, J. Yang, T. Hyeon and D.-H. Kim, Flexible quantum dot light-emitting diodes for next-generation displays, npj Flexible Electron., 2018, 2, 10 CrossRef.
- Y. Yu, Y. Liang, J. Yong, T. Li, M. S. Hossain, Y. Liu, Y. Hu, K. Ganesan and E. Skafidas, Low-Temperature Solution-Processed Transparent QLED Using Inorganic Metal Oxide Carrier Transport Layers, Adv. Funct. Mater., 2022, 32, 2106387 CrossRef CAS.
- S. Shin, B. Hwang, Z.-J. Zhao, S. H. Jeon, J. Jung, J.-H. Lee, B.-K. Ju and J.-H. Jeong, Transparent Displays Utilizing Nanopatterned Quantum Dot Films, Sci. Rep., 2018, 8, 2463 CrossRef.
- Y. Wang, I. Fedin, H. Zhang and D. V. Talapin, Direct optical lithography of functional inorganic nanomaterials, Science, 2017, 357, 385–388 CrossRef CAS PubMed.
- J.-S. Park, J. Kyhm, H. H. Kim, S. Jeong, J. Kang, S. Lee, K.-T. Lee, K. Park, N. Barange, J. Han, J. D. Song, W. K. Choi and I. K. Han, Alternative Patterning Process for Realization of Large-Area, Full-Color, Active Quantum Dot Display, Nano Lett., 2016, 16, 6946–6953 CrossRef CAS.
- T. C. Nguyen, T. T. T. Can and W.-S. Choi, Optimization of Quantum Dot Thin Films using Electrohydrodynamic Jet Spraying for Solution-Processed Quantum Dot Light-Emitting Diodes, Sci. Rep., 2019, 9, 13885 CrossRef PubMed.
- R. Palankar, N. Medvedev, A. Rong and M. Delcea, Fabrication of Quantum Dot Microarrays Using Electron Beam Lithography for Applications in Analyte Sensing and Cellular Dynamics, ACS Nano, 2013, 7, 4617–4628 CrossRef CAS.
- P. Yang, L. Zhang, D. J. Kang, R. Strahl and T. Kraus, High-Resolution Inkjet Printing of Quantum Dot Light-Emitting Microdiode Arrays, Adv. Opt. Mater., 2020, 8, 1901429 CrossRef CAS.
- S. Biswas, F. Brinkmann, M. Hirtz and H. Fuchs, Patterning of Quantum Dots by Dip-Pen and Polymer Pen Nanolithography, Nanofabrication, 2015, 2, 19–26 Search PubMed.
- S. Liu, W. Liu, W. Ji, J. Yu, W. Zhang, L. Zhang and W. Xie, Top-emitting quantum dots light-emitting devices employing microcontact printing with electricfield-independent emission, Sci. Rep., 2016, 6, 22530 CrossRef CAS.
- K. Ray, R. Badugu and J. R. Lakowicz, Metal-Enhanced Fluorescence from CdTe Nanocrystals: A Single-Molecule Fluorescence Study, J. Am. Chem. Soc., 2006, 128, 8998–8999 CrossRef CAS PubMed.
- J. Fulmes, R. Jäger, A. Bräuer, C. Schäfer, S. Jäger, D. A. Gollmer, A. Horrer, E. Nadler, T. Chassé, D. Zhang, A. J. Meixner, D. P. Kern and M. Fleischer, Self-aligned placement and detection of quantum dots on the tips of individual conical plasmonic nanostructures, Nanoscale, 2015, 7, 14691–14696 RSC.
- Y. Yang, A. Dev, I. Sychugov, C. Hägglund and S.-L. Zhang, Plasmon-Enhanced Fluorescence of Single Quantum Dots Immobilized in Optically Coupled Aluminum Nanoholes, J. Phys. Chem. Lett., 2023, 14, 2339–2346 CrossRef CAS PubMed.
- R. A. Seger, P. Actis, C. Penfold, M. Maalouf, B. Vilozny and N. Pourmand, Voltage controlled nano-injection system for single-cell surgery, Nanoscale, 2012, 4, 5843 RSC.
- A. Bruckbauer, L. Ying, A. M. Rothery, D. Zhou, A. I. Shevchuk, C. Abell, Y. E. Korchev and D. Klenerman, Writing with DNA and Protein Using a Nanopipet for Controlled Delivery, J. Am. Chem. Soc., 2002, 124, 8810–8811 CrossRef CAS.
- A. P. Ivanov, P. Actis, P. Jönsson, D. Klenerman, Y. Korchev and J. B. Edel, On-Demand Delivery of Single DNA Molecules Using Nanopipets, ACS Nano, 2015, 9, 3587–3595 CrossRef CAS PubMed.
- S. Hennig, S. Van De Linde, S. Bergmann, T. Huser and M. Sauer, Quantitative Super-Resolution Microscopy of Nanopipette-Deposited Fluorescent Patterns, ACS Nano, 2015, 9, 8122–8130 CrossRef CAS PubMed.
- J. Xu, R. Reiserer, J. Tellinghuisen, J. P. Wikswo and F. J. Baudenbacher, A Microfabricated Nanocalorimeter: Design, Characterization, and Chemical Calibration, Anal. Chem., 2008, 80, 2728–2733 CrossRef CAS.
- M. Ćwierzona, K. Sulowska, M. A. Antoniak, M. Żebrowski, M. Nyk, S. Maćkowski and D. Piątkowski, Precise laser-cutting of single silver nanowires for direct measurement of SPPs propagation losses, Appl. Phys. Lett., 2022, 120, 261108 CrossRef.
- I. Markovich and D. Mandler, Preparation and characterization of octadecylsilane monolayers on indium–tin oxide (ITO) surfaces, J. Electroanal. Chem., 2001, 500, 453–460 CrossRef CAS.
- M. Nirmal, B. O. Dabbousi, M. G. Bawendi, J. J. Macklin, J. K. Trautman, T. D. Harris and L. E. Brus, Fluorescence intermittency in single cadmium selenide nanocrystals, Nature, 1996, 383, 802–804 CrossRef CAS.
- A. L. Efros and M. Rosen, Random Telegraph Signal in the Photoluminescence Intensity of a Single Quantum Dot, Phys. Rev. Lett., 1997, 78, 1110–1113 CrossRef CAS.
- P. Kukura, M. Celebrano, A. Renn and V. Sandoghdar, Imaging a Single Quantum Dot When It Is Dark, Nano Lett., 2009, 9, 926–929 CrossRef CAS.
- J. Niedziółka-Jonsson, S. Maćkowski and M. Biały, Transmission of plasmons between silver wires interfaced with colloidal quantum dots, 2024, RepOD DOI:10.18150/9ACT09.
Footnote |
| † Electronic supplementary information (ESI) available. See DOI: https://doi.org/10.1039/d4cp03419h |
| This journal is © the Owner Societies 2025 |