
 Open Access Article
 This Open Access Article is licensed under a Creative Commons Attribution-Non Commercial 3.0 Unported Licence
Microplastic occurrence in sediments of informal settlement in Durban, South Africa: assessing the ocean impact in the aftermath of floods
Nokwanda
Hendricks
 ,
Olatunde S.
Olatunji
and
Bhekumuzi P.
Gumbi
*
,
Olatunde S.
Olatunji
and
Bhekumuzi P.
Gumbi
*
School of Chemistry and Physics, University of KwaZulu-Natal, Private Bag X54001, Westville, Durban, 4000, South Africa. E-mail: gumbib@ukzn.ac.za
First published on 29th April 2024
Abstract
The environmental impact of microplastics is increasingly being recognized, leading to their inclusion as contaminants of emerging concern. Consequently, it is essential to identify and monitor microplastics and their impact on the ecosystem. In this study, a ball miller was employed to process plastic waste, generating microplastics for the optimisation of separation methods. Microplastics of various sizes and shapes were produced and used to spike the sediments for optimisation of the density separation method. The recovered microplastics ranged from 0.74–5 mm, as confirmed by stereomicroscopy. In addition, the types of polymers present in microplastics were confirmed using Fourier Transform Infrared Spectroscopy-Attenuated Total Reflectance (FTIR-ATR). The developed analytical method was employed to study the occurrence of microplastics in river sediments passing through informal settlements after floods. Moreover, the evaluated data confirmed that informal settlements are a major source of microplastics found in the ocean after a flood. Microplastics in river and ocean sediments were predominantly composed of polypropylene, polyethylene, and polystyrene with a size range of 0.90–5 mm. To the best of our knowledge, this study is the first to report the impacts of informal settlements on the ocean during floods in Africa.
Environmental significanceThis research highlights the pervasive issue of microplastic pollution in water systems, particularly in areas affected by floods where microplastic concentration can increase due to factors like runoff and sediment transport. Understanding the distribution and abundance of microplastics in these sediments is crucial for comprehending the extent of plastic pollution in aquatic environments and its potential impact on marine ecosystems. By examining the presence of microplastics in sediments post-flood events, this study provides valuable insights into the dynamics of plastic waste transport, accumulation, and the subsequent implications for water quality, biodiversity, and ecosystem health in coastal regions. This research aids in formulating effective strategies for mitigating microplastic pollution and safeguarding the marine environment against the detrimental effects of plastic contamination. |
1 Introduction
Plastics exposed to the environment do not degrade rapidly; instead, they break into smaller particles and gradually undergo degradation over time, influenced by various environmental conditions.1–3 Plastics entering the environment have recently become a significant environmental concern as they break down into nanoplastics and microplastics, classified as contaminants of emerging concern (CECs).4–6 Microplastics can serve as effective environmental indicators, helping us understand whether rivers passing through informal settlements transport significant contaminant loads into the oceans.7 Given the physiochemical properties of plastics, microplastics do not form during flooding, making them perfect indicators of years of river pollution by informal settlements. MPs have been identified as carriers of pollutants because of their significant ability to absorb pollutants.7–9 Hence, they can serve as a representative measure of contaminants (CECs) entering the environment through human activities around informal settlements and ultimately reaching the ocean.10,11 Occurrence studies supported by new analytical methods are important to inform policymakers, especially for the environmental protection of rivers by preventing the building of informal structures along them.12–14 The pollution of rivers and subsequently oceans by informal settlements can be monitored during floods by indicators such as microplastics.Some microplastics are intentionally produced for specific applications, such as in medicine for pharmaceuticals, cosmetic products, equipment used in estuary–sea separation (nets), and cleaning products.15–18 Microplastics present in the environment cause toxic effects if ingested at high concentrations, such as the disruption of the internal organs and the digestive system of aquatic organisms.6,19–22 They can cause intense effects, such as the potential for cancer, disturbance of the nervous and immune systems, and alterations in reproduction and development.23–25 As a result, it is crucial to protect the environment from microplastics, which are made up of various polymers such as polyvinyl chloride (PVC), polyester (PE), polypropylene (PPE), polyethylene (PET), polystyrene (PS), polyamide (nylon 6), and acrylic.26 It is imperative to monitor the occurrence of these microplastics in the environment to understand how to address the issue and contribute additional data to the existing knowledge.3,14,27
However, analytical methods for the quantitative extraction of microplastics from sediments are lacking.28,29 Techniques for sampling the top layer of sediments are crucial, as they result from deposition during flooding. It is imperative to isolate these top layers to obtain distribution data during such events. Several techniques have been proposed for the recovery of microplastics from sediments.29,30 The most promising analytical method is a density separation technique that employs a saline solution for size separation, followed by sieving and filtration.31,32 Moreover, the development of new techniques requires microplastic standards for the optimization and validation of these analytical methods. However, matching microplastic standards for specific study areas is either lacking or nonexistent.33 Consequently, many researchers have prepared microplastic standards from plastic waste, embracing the principles of the circular economy. B. Quinn et al. 2017 (ref. 32) employed a single-stage method that utilizes various saline solutions to reliably acquire microplastic polymers of 1 mm or less from sediment samples. The high density of a density separation solution results in an increase in the rate of microplastic recovery. Hence, it was reported that the density of the brine solution should be considered for the high recovery rate of microplastics. Also, A. Käppler et al. 2016 (ref. 34) employed the sieving method to separate the particles into different sieves sized between less than 20 μm and above 500 μm. Finally, a size category separation method was implemented in the lower microplastic fraction (500 μm). FTIR imaging was used to analyze particles with a diameter of 500–50 μm in a comparable amount of time and accuracy. Raman imaging was employed for a more detailed and time-consuming analysis of particles sized 50–1 μm. This method proved effective, especially as the amount of microplastics in both salt and freshwater samples increases with decreasing sample size.
This study was undertaken to evaluate the occurrence and distribution of microplastics after floods in Durban, South Africa. Additionally, the role of informal settlements in contributing to transporting loads of contaminants to the ocean during floods was investigated by comparing microplastic distribution in the Mgeni River and Palmiet River. The analytical method developed for this evaluation was based on a density separation method and validated using microplastic standards produced from waste plastic collected upstream of the Palmiet River.
2 Experimental
2.1 Chemicals and reagents
All polymer standards, polyamide (PA), polyethylene (PET), polystyrene (PS), polyvinyl chloride (PVC), polyvinylpyrrolidone (PVP), polyethersulfone (PES), and polyvinyl sulfate (PVS), were purchased from Sigma Aldrich (Steinheim, Germany). Sodium chloride (NaCl) was purchased from Sigma Aldrich (Steinheim, Germany). All plastic waste was collected from a dumping site in Durban, South Africa. Millipore water was obtained from a Gradient A10 Milli-Q (18 Ω m) system bought from Microsep, South Africa.2.2 Characterization of microplastics
2.3 Extraction method
The spiked sediments were shaken at 2000 rpm for 3 hours and allowed to settle overnight. Subsequently, they were filtered under vacuum using Whatman filter paper and washed with Millipore water. The recovered plastic fragments in the filter paper were transferred to a Petri dish and allowed to dry before analysis. Stereomicroscopy equipped with a camera was employed to determine the number and sizes of microplastics recovered. ATR-FTIR was used for spectral analysis.
 | ||
| Fig. 1 Sampling map for the studied area, Durban, South Africa. | ||
3 Results and discussion
3.1 Method development
The construction of an in-house database of microplastics was established using plastic waste collected from a dumpsite upstream of the Palmiet River.28 Different product containers were collected from the dumpsite, including containers for food products, cosmetic products, trash bags, takeaways, and food containers. The source of this garbage can be traced to people living upstream of the informal settlement and the demographic of these people is the same as that downstream. The database was built using the prepared microplastic standards with stereo microscopy and FTIR-ATR. The standards purchased from Sigma Aldrich helped in identifying polymers in the prepared microplastic from waste. These plastic wastes were prepared to align with the properties of microplastics. During flooding, there is the potential for this waste to be washed into the river.35–37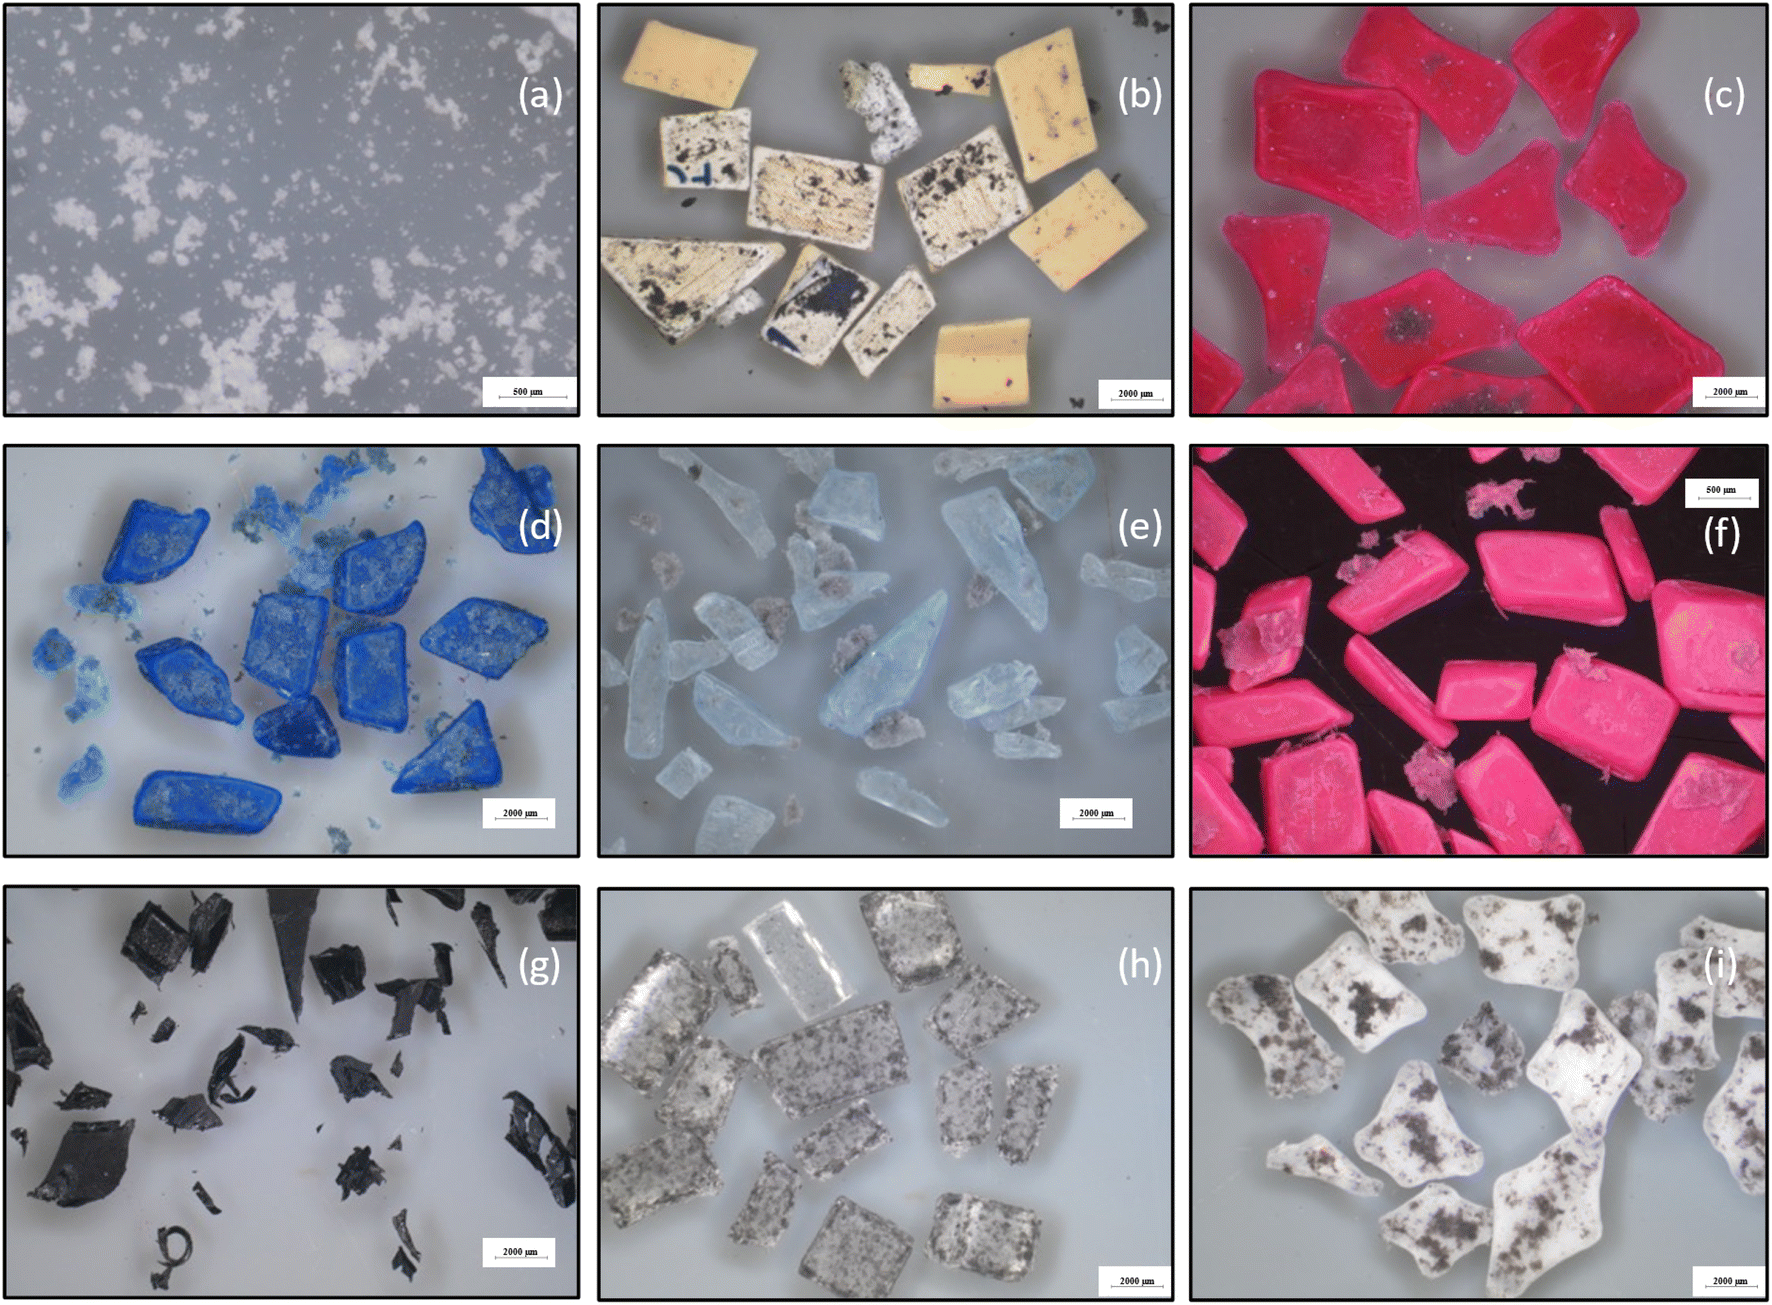 | ||
| Fig. 2 Micrographs for the prepared microplastics using a ball miller: plastic takeaway cup (a), margarine (stock) container (b), ice cream cup (c), body lotion Nivea (d), micropipette tip (e), plastic bowl (f), plastic spoon (g), ice tea plastic bottle (h) and peanut butter container (i). | ||
| Polymer standard | Absorption bands (cm−1) |
|---|---|
| Polyamide (PA) |
ν –NH– (3298), ν –CH– (2930), O –NC![[double bond, length as m-dash]](https://www.rsc.org/images/entities/char_e001.gif) O– (1635) O– (1635) |
| Polystyrene (PS) | ν –CH2– (2919), aromatic ringmono (750) |
| Polyethylene (PET) | ν –CH2– (2963) |
| Polyvinyl sulfate (PVS) |
ν –CH2– (2912), –O(OSO)O– (1327) |
| Polyvinyl chloride (PVC) | ν –CH2– (2912), –CHCl – (607) |
| Polyvinylpyrrolidone (PVP) |
ν –CH2– (3438), –NCO– (1650), –CN– (1284) |
| Polyethersulfone (PES) |
ν –CH2– (3069), –(OSO)R2– (1405), –COaromatic ring– (1319), –(OSO)aromatic ring – (1071) |
| Polypropylene (PPE)38 | ν –CH3 (2950 and 2867), –CH2– (2917 and 2838), C–H (–CH3) (1455 and 1375), C–C (1166 and 972) |
The ATR-FTIR spectra for the analyzed polymer standards are shown in Fig. 3, with their respective absorption bands.
 | ||
| Fig. 3 IR absorption spectrum for PA (a), PS (b), PET (c), PVS (d), PVC (e), and PES (f). | ||
The prepared microplastics from plastic waste were correlated with the polymer standards using the IR bands and the present polymers were confirmed as shown in Table 2.
| Plastic waste name | Microplastic standard | |
|---|---|---|
| Polymer | Absorption bands (cm−1) | |
| Plastic takeaway cup | Polystyrene | ν –CH2– (2920), aromatic ringmono (752) |
| Margarine (stock) container | Polypropylene | ν –CH3– (2949), ν –CH2– (2916), ν –CH– (2867) |
| Ice cream cup | Polypropylene | ν –CH3– (2949), ν –CH2– (2916), ν –CH– (2867) |
| Body lotion (Nivea) | Polypropylene | ν –CH3– (2949), ν –CH2– (2916), ν –CH– (2867) |
| Micropipette tip | Polypropylene | ν –CH3– (2949), ν –CH2– (2916), ν –CH– (2867) |
| Plastic bowl | Low-density polyethylene | ν –CH2– (2915) and –CH (2848) |
| Plastic spoon | Polystyrene | ν monosubstituted aromatic ring (750), –CH2– (2917), alkene (3025) |
| Ice tea plastic bottle | Polyethylene | ν –CH2– (2963) |
| Peanut butter container | Polypropylene | ν –CH3 (2950 and 2868), –CH2– (2916 and 2838), C–H (–CH3) (1451 and 1375), C–C (1166 and 972) |
The microplastics were prepared from commonly used plastic products daily in the informal settlement. The polymer standards were employed to confirm the polymer structures present in microplastics. The margarine (stock) spectrum (Fig. 4a) shows bands: –CH3 (2949 and 2867 cm−1), –CH2– (2916 and 2838 cm−1), C–H (–CH3) (1458 and 1376 cm−1), and C–C (1167 and 973 cm−1). These features show the properties of PPE. The ice cream cup spectrum (Fig. 4b) was similar to that of PPE as it consisted of the band: –CH3 (2951 and 2875 cm−1), –CH2– (2917 and 2838 cm−1), C–H (–CH3) (1455 and 1376 cm−1) and C–C (1166 and 973 cm−1). The ice tea bottle spectrum (Fig. 4c) had a band: aliphatic group, –CH2– (2963 cm−1), which indicated the presence of PET polymer. A PS polymer spectrum was similar to a plastic spoon spectrum (Fig. 4d) as it shows a band: monosubstituted aromatic ring (750 cm−1), –CH2– (2917 cm−1), and an alkene (3025 cm−1). The peanut butter container spectrum (Fig. 4e) possesses bands: –CH3 (2950 and 2868 cm−1), –CH2– (2916 and 2838 cm−1), C–H (–CH3) (1451 and 1375 cm−1), and C–C (1166 and 972 cm−1), and this shows the functional groups of PPE. The plastic takeaway cup (Fig. 4f) and PS had similar spectra and the microplastic band confirms this: monosubstituted aromatic ring (752 cm−1), –CH2– (2920 cm−1), and an alkene (3025 cm−1). The micropipette tip spectrum (Fig. 4g) consisted of PPE functional group bands such as: –CH3 (2951 and 2875 cm−1), –CH2– (2917 and 2838 cm−1), C–H (–CH3) (1455 and 1376 cm−1) and C–C (1166 and 973 cm−1). The plastic bowl spectrum was correlated with the low-density PET as it consists of bands: –CH2– (2915 cm−1) and C–H (2848 cm−1). Lastly, the body lotion (Nivea) spectrum (Fig. 4h) had a band: –CH3 (2949 and 2875 cm−1), –CH2– (2916 and 2837 cm−1), C–H (–CH3) (1456 and 1376 cm−1) and C–C (1166 and 973 cm−1), which is similar to PPE.
 | ||
| Fig. 4 IR absorption spectrum for a plastic takeaway cup (a), margarine (stock) container (b), ice cream cup (c), body lotion Nivea (d), micropipette tip (e), plastic bowl (f), plastic spoon (g), ice tea plastic bottle (h) and peanut butter container (i). | ||
 | ||
| Fig. 5 Stereomicroscope micrographs for the spiked microplastics (a) with the histogram of the recoveries of microplastics (b). | ||
3.2 Application to environmental samples
Plastic pollution has increased drastically in the marine environment due to recent floods in KwaZulu-Natal, South Africa. This research demonstrates that informal settlements are a contributor of microplastics to the ocean. Stereomicroscopy and ATR-FTIR were used to confirm the occurrence of different microplastics in sediments. In the informal settlement, three samples were taken and were made into a composite sample, and this sampling area shows the presence of different sizes of microplastics with a size of 0.96–5 mm (Fig. 6b), with the uMgeni River showing the least amount of microplastics with size between 1 and 5 mm (Fig. 6a). This shows that most of the plastics were not found in the uMgeni River before informal settlement, but other streams passing through the informal settlement might be the source. The joining point had microplastic size from 0.91 to 5 mm (Fig. 6c); the presence of microplastics less than 1 mm shows years of pollution as microplastics slowly break in the environmental matrices rather by the current of the fast-moving river during the floods.39,40 The Umgeni Estuary had a high volume of microplastics with size ranging from 0.98 to 5 mm (Fig. 6d); this is due to microplastics being transported from the informal settlement to the sea. The microplastics were washed down during the flood that occurred recently in the studied area, and most of the microplastics were found at the beach with a size of 0.90–5 mm (Fig. 6e); this point was found to be the most polluted by microplastics. Most of the microplastic fragments found at the sea were similar in polymer type to those in the informal settlement. | ||
| Fig. 6 Micrographs for environmental samples from the Mgeni River before joining (a), informal settlement (Palmiet River) (b), joining Palmiet/Mgeni River (c), uMgeni Estuary (d) and ocean (e) with the histogram for microplastic size (f). | ||
The microplastics found on different points were analyzed using ATR-FTIR. Polymeric types for example PET, PS, PA, PVC, and PPE were found on microplastics in all sampling points except for the uMgeni River. At the uMgeni River, only three polymers were found, polypropylene, polystyrene, and polyethylene. These three polymers were the most abundant in microplastics obtained in the studied area (Fig. 7a); this is a result of many plastic products used in households being made of similar polymers.
 | ||
| Fig. 7 Histogram for environmental samples from the Mgeni River (a) and spectra for (b) polystyrene, (c) polyethylene, and (d) polypropylene. | ||
This is an indication that many plastic products used in households are made of these similar polymers. The IR spectra and the micrographs of the most abundant polymers are shown in Fig. 7b (PS), 7c (PET), and 7d (PPE). All microplastic polymers found at the informal settlement point were also present at the sea; this may be due to the washdown during the floods.
3.3 Comparison of the current study with the literature
A comparison of MPs found in informal settlements in this present study with some reported in previous studies is presented in Table 3. In comparison to previous studies conducted in informal settlements, the microplastics identified exhibited a variation in characteristics. These microplastics were observed with a diverse array of colors, types, and shapes, indicating a broader range of sources and potential pathways for contamination. Furthermore, the abundance of microplastics in both sediments and water samples differed significantly, suggesting a potentially more complex and pervasive presence of these pollutants in the environment of informal settlements. This variability underscores the need for comprehensive and targeted strategies to address the multifaceted challenges posed by microplastic pollution in such areas.| Sample type | Location | MP abundance | Shape | Dominant colour | MP type | Reference |
|---|---|---|---|---|---|---|
| Sediments | Western Cape, South Africa | 185 | Fragment, filament, sphere, film, foam | White, black/grey, blue/green, yellow, transparent | PET, PE, PS, PAA, PP, SSR | D. Julius et al.41 (2023) |
| Sediments | South China | 103![[thin space (1/6-em)]](https://www.rsc.org/images/entities/char_2009.gif) 080 080 |
Fiber | Transparent | PE, PP, PET | Y. Wan et al.42 (2022) |
| Surface water | Kenya | 1473 | Films, fiber, fragments | White, blue and green, black, red, transparent, blue, multicolor | PP, HDPE, LDPE | Kosore et al.43 (2022) |
| Sediments | Eastern Cape, South Africa | 213 | Fiber, fragment | Yellow, pink-red, black, transparent, blue, green, black | PP, PE, PS | Current |
4 Conclusion
In the present study, microplastic standards matching the study area were successfully prepared using ball milling. These standards contained particles ranging between 0.74 and 5 mm, as confirmed by stereomicroscopy. The method employed did not alter the chemical or structural properties of polymers present in plastic waste. The identified polymers in various products included polystyrene, polypropylene, polyethylene, and low-density polyethylene, all confirmed by FTIR. The prepared microplastic standards were then utilized to optimize a density separation method for sediments. The percentage recoveries were consistently above 60% for the selected parameters, specifically when using 250 mL of 1 M sodium chloride as the separation solution in 50 g of sediments. This optimized method was further employed to investigate the occurrence of microplastics in environmental samples. The recent floods revealed a significant impact on marine plastic pollution originating from informal settlements. This was evident through the recovery of microplastics from the sea, attributed to the informal settlement. The size range of the detected microplastics on the environmental samples was 0.90–5 mm. Furthermore, the ATR-FTIR analysis confirmed the presence of the most common polymers in the studied area, namely polystyrene, polyethylene, and polypropylene.Author contributions
Nokwanda Hendricks: conceptualization, methodology, formal analysis, writing – original draft, and investigation. Olatunde S. Olatunji: writing – review and editing and supervision. Bhekumuzi Prince Gumbi: conceptualization, resources, visualization, supervision, funding acquisition, and writing – original draft. All authors have read and agreed to the published version of the manuscript.Conflicts of interest
The authors declare herewith that they do not have any conflict of interest with any organization or individual.Acknowledgements
The authors thank the University of KwaZulu Natal for hosting the research. N. Hendricks would like to thank the National Research Foundation (122021) and Water Research Commision of South Africa (K5/2807) for the grant to conduct the research. The authors would also like to acknowledge Thembelani Heidi Dlamini for assisting with the construction of the map used in this study.References
- S. S. Ali, T. Elsamahy, R. Al-Tohamy, D. Zhu, Y. A. G. Mahmoud, E. Koutra, M. A. Metwally, M. Kornaros and J. Sun, Sci. Total Environ., 2021, 780, 146590 CrossRef CAS PubMed.
- A.-U.-R. Bacha, I. Nabi and L. Zhang, ACS ES&T Eng., 2021, 1, 1481–1501 Search PubMed.
- H. d. M. Back, D. Pottmaier, C. Kneubl Andreusi and O. E. Alarcon, Environ. Sci.: Adv., 2023, 2, 1629–1640 CAS.
- G. Biale, J. La Nasa, L. Fiorentini, A. Ceccarini, D. Carnaroglio, M. Mattonai and F. Modugno, Environ. Sci.: Adv., 2024, 3, 76–84 CAS.
- S. Klein, I. K. Dimzon, J. Eubeler and T. P. Knepper, Freshwater Microplastics: Emerging Environmental Contaminants?, 2018, pp. 51–67 Search PubMed.
- S. Chahal, P. Wang, V. Bueno, H. Anand, S. Bayen, S. Ghoshal, V. Gravel and N. Tufenkji, Environ. Sci.: Adv., 2023, 2, 629–644 CAS.
- J. Martín, J. L. Santos, I. Aparicio and E. Alonso, Trends Environ. Anal. Chem., 2022, 35, e00170 CrossRef.
- Y. Vieira, E. C. Lima, E. L. Foletto and G. L. Dotto, Sci. Total Environ., 2021, 753, 141981 CrossRef CAS PubMed.
- J. N. Hanun, F. Hassan and J.-J. Jiang, J. Environ. Chem. Eng., 2021, 9, 106290 CrossRef CAS.
- T. S. M. Amelia, W. M. A. W. M. Khalik, M. C. Ong, Y. T. Shao, H.-J. Pan and K. Bhubalan, Prog. Earth Planet. Sci., 2021, 8, 1–26 CrossRef.
- H. C. Ferreira and G. Lôbo-Hajdu, Mar. Environ. Res., 2023, 106021 CrossRef PubMed.
- S. Coffin, Environ. Sci.: Adv., 2023, 2, 356–367 Search PubMed.
- G. Peng, P. Xu, B. Zhu, M. Bai and D. Li, Environ. Pollut., 2018, 234, 448–456 CrossRef CAS PubMed.
- P. Roy, A. K. Mohanty and M. Misra, Environ. Sci.: Adv., 2022, 1, 9–29 CAS.
- R. C. Hale, M. E. Seeley, M. J. La Guardia, L. Mai and E. Y. Zeng, J. Geophys. Res.: Oceans, 2020, 125, e2018JC014719 CrossRef.
- H. Leslie, IVM Institute for Environmental Studies, 2014, vol. 476, pp. 1–33 Search PubMed.
- A. Lusher, P. Hollman and J. Mendoza-Hill, Microplastics in Fisheries and Aquaculture: Status of Knowledge on Their Occurrence and Implications for Aquatic Organisms and Food Safety, FAO, 2017 Search PubMed.
- A. Gallagher, A. Rees, R. Rowe, J. Stevens and P. Wright, Mar. Pollut. Bull., 2016, 102, 243–249 CrossRef CAS PubMed.
- J. S. Choi, Y.-J. Jung, N.-H. Hong, S. H. Hong and J.-W. Park, Mar. Pollut. Bull., 2018, 129, 231–240 CrossRef CAS PubMed.
- G. Hariharan, R. Purvaja, I. Anandavelu, R. S. Robin and R. Ramesh, Ecotoxicol. Environ. Saf., 2021, 208, 111765 CrossRef CAS PubMed.
- H. Ma, S. Pu, S. Liu, Y. Bai, S. Mandal and B. Xing, Environ. Pollut., 2020, 261, 114089 CrossRef CAS PubMed.
- H. Wang, Q. Wang, M. Lv, J. Li, X. Zhao, Z. Song, X. Wang, J. You, Y. Wang and L. Chen, TrAC, Trends Anal. Chem., 2023, 168, 117332 CrossRef CAS.
- C. Gambardella, S. Morgana, S. Ferrando, M. Bramini, V. Piazza, E. Costa, F. Garaventa and M. Faimali, Ecotoxicol. Environ. Saf., 2017, 145, 250–257 CrossRef CAS PubMed.
- W. J. Veneman, H. P. Spaink, N. R. Brun, T. Bosker and M. G. Vijver, Aquat. Toxicol., 2017, 190, 112–120 CrossRef CAS PubMed.
- B. Jovanović, Integr. Environ. Assess. Manage., 2017, 13, 510–515 CrossRef PubMed.
- A. Gomiero, P. Strafella and G. Fabi, in Plastics in the Environment, IntechOpen, 2018 Search PubMed.
- D. P. Mesquita, C. Quintelas and E. C. Ferreira, Environ. Sci.: Adv., 2023, 2, 1616–1628 CAS.
- M. Willans, E. Szczecinski, C. Roocke, S. Williams, S. Timalsina, J. Vongsvivut, J. McIlwain, G. Naderi, K. L. Linge and M. J. Hackett, Environ. Sci.: Adv., 2023, 2, 663–674 CAS.
- T. Maes, R. Jessop, N. Wellner, K. Haupt and A. G. Mayes, Sci. Rep., 2017, 7, 44501 CrossRef CAS PubMed.
- J. S. Hanvey, P. J. Lewis, J. L. Lavers, N. D. Crosbie, K. Pozo and B. O. Clarke, Anal. Methods, 2017, 9, 1369–1383 RSC.
- L. Cutroneo, A. Reboa, I. Geneselli and M. Capello, Mar. Pollut. Bull., 2021, 166, 112216 CrossRef CAS PubMed.
- B. Quinn, F. Murphy and C. Ewins, Anal. Methods, 2017, 9, 1491–1498 RSC.
- B. Nayebi, P. Khurana, R. Pulicharla, S. Karimpour and S. K. Brar, Environ. Sci.: Adv., 2023, 2, 1060–1081 CAS.
- A. Käppler, D. Fischer, S. Oberbeckmann, G. Schernewski, M. Labrenz, K.-J. Eichhorn and B. Voit, Anal. Bioanal. Chem., 2016, 408, 8377–8391 CrossRef PubMed.
- H. Margenat, H. A. Nel, S. H. Stonedahl, S. Krause, F. Sabater and J. D. Drummond, Environ. Res. Lett., 2021, 16, 115012 CrossRef CAS.
- S. A. Mason, D. Garneau, R. Sutton, Y. Chu, K. Ehmann, J. Barnes, P. Fink, D. Papazissimos and D. L. Rogers, Environ. Pollut., 2016, 218, 1045–1054 CrossRef CAS PubMed.
- A. R. de Carvalho, F. Garcia, L. Riem-Galliano, L. Tudesque, M. Albignac, A. Ter Halle and J. Cucherousset, Sci. Total Environ., 2021, 769, 144479 CrossRef CAS PubMed.
- R. Chércoles Asensio, M. San Andrés Moya, J. M. de la Roja and M. Gómez, Anal. Bioanal. Chem., 2009, 395, 2081–2096 CrossRef PubMed.
- G. Kale, R. Auras and S. P. Singh, J. Polym. Environ., 2006, 14, 317–334 CrossRef CAS.
- A. Chamas, H. Moon, J. Zheng, Y. Qiu, T. Tabassum, J. H. Jang, M. Abu-Omar, S. L. Scott and S. Suh, ACS Sustain. Chem. Eng., 2020, 8, 3494–3511 CrossRef CAS.
- D. Julius, A. Awe and C. Sparks, Heliyon, 2023, 9, e18559 CrossRef CAS PubMed.
- Y. Wan, X. Chen, Q. Liu, H. Hu, C. Wu and Q. Xue, Environ. Pollut., 2022, 293, 118586 CrossRef CAS PubMed.
- C. M. Kosore, L. Ojwang, J. Maghanga, J. Kamau, D. Shilla, G. Everaert, F. R. Khan and Y. Shashoua, Mar. Pollut. Bull., 2022, 179, 113710 CrossRef CAS PubMed.
| This journal is © The Royal Society of Chemistry 2024 |