DOI:
10.1039/D4TC02691H
(Paper)
J. Mater. Chem. C, 2024,
12, 18481-18492
Water-dispersed bismuth-doped strontium pyrovanadate phosphor particles with sub-degree celsius thermal resolution†
Received
26th June 2024
, Accepted 30th September 2024
First published on 16th October 2024
Abstract
Particle-liquid dispersion technique entails a principle analogous to that of an optically thin arrangement of particles, which is applicable in lab-on-a-chip technology, thin coatings for lighting, solar cell sensitization, medical bioimaging, and temperature measurements in fluids. Sr2V2O7:Bi3+ phosphor particles demonstrated the ability to luminesce when dispersed in distilled water. X-ray powder diffraction patterns confirmed that the phosphor crystallised in the triclinic phase. Its morphologies and chemical compositions were analysed using field emission scanning electron microscopy and energy-dispersive X-ray spectroscopy. The luminescence intensity of the phosphor was optimised via annealing at different temperatures and doping with different Bi3+ concentrations. The luminescence intensity of water-dispersed phosphor particles exhibited strong thermal quenching in the temperature range of 22 to 60 °C, and the band maximum showed a significant blue-shift. Relative temperature sensitivity determined from the temperature dependence of luminescence lifetime exhibited a high value around ambient temperatures, with a maximum value of 2.56%/°C at 20 °C and 2.13%/°C at 25 °C. These values were highly comparable to lifetime-based relative temperature sensitivities reported in the literature under similar temperature ranges, demonstrating this material's potential for sensitive thermometry applications around ambient temperatures.
1. Introduction
Luminescence thermometry (LT) is a non-intrusive optical technique that applies the temperature dependence of luminescence to remotely measure the temperature of a system.1–7 By introducing luminescent tracers into transparent fluids or solids or coating them onto surfaces and exciting them with a laser, LT exploits spectral and temporal/spatial approaches for remote sensing with high resolution and can operate in highly luminous environments, which are crucial advantages over infrared thermography and conventional intrusive probes.8–11 For these reasons, LT has numerous potential applications in cooling and heating processes, such as in automotive, chemical, and industrial energy processes, e.g., for the design of reactors or heat exchangers;12 rapidly varying processes, e.g., in fluid flows,13 or rotating parts;14 nanothermometry, e.g., biomedicine,10,15 lab-on-a-chip,16 microelectronics;17 and temperature measurements in harsh environments with robust luminosity, e.g., on combustible materials or in internal combustion engines.18 LT is based on optically active tracers, including quantum dots, metal–ligand complexes, organic compounds (e.g., dyes), and phosphors.19 Phosphor thermometry is based on inorganic compounds doped with lanthanides (e.g., Eu3+,20 Ce3+,21 Pr3+,22,23 Nd3+,24,25 and Dy3+,26 transition metals (e.g., Mn3+, Mn4+,27 Cr3+28 or post-transition metals (e.g., Sn2+,29 Bi3+.30,31 In most cases, the temperature-dependence of luminescence intensity or lifetime of a phosphor is thermally insensitive over an extensive temperature range and shows a steep decrease over a narrow temperature range. It is said to be thermally sensitive in this steep region.
Each of these applications operates in different temperature ranges and therefore requires probes that are thermally sensitive in these ranges. For example, in a high-temperature application such as in combustion engines, for which there are numerous phosphors,32 a hot jet engine blade spins at ∼10![[thin space (1/6-em)]](https://www.rsc.org/images/entities/char_2009.gif) 000 rpm at ∼1000 K (727 °C);18 this implies that a temperature probe required to measure the temperature of this system should be thermally sensitive in this range. For low-temperature applications, e.g., in live cell imaging,10,15,33 in which temperatures lie in the ambient range, the suitable physiological temperature, only few phosphors possess decent thermal sensitivity.32 Thus, this study aims to improve measurement precision in the sub-°C temperature range. This can be achieved by developing a phosphor with inherently high thermal sensitivity in the ambient temperature regions, and using changes in the lifetime and luminescence intensity driven by thermal quenching.
000 rpm at ∼1000 K (727 °C);18 this implies that a temperature probe required to measure the temperature of this system should be thermally sensitive in this range. For low-temperature applications, e.g., in live cell imaging,10,15,33 in which temperatures lie in the ambient range, the suitable physiological temperature, only few phosphors possess decent thermal sensitivity.32 Thus, this study aims to improve measurement precision in the sub-°C temperature range. This can be achieved by developing a phosphor with inherently high thermal sensitivity in the ambient temperature regions, and using changes in the lifetime and luminescence intensity driven by thermal quenching.
In fluid thermometry, phosphor particles are seeded into a liquid or gas as a tracer, with the reasoning that they absolutely assume the temperature (and velocity) of the surrounding fluid. The temperature of the particles is determined by measuring the temperature dependence of the luminescence intensity or the lifetime of the flow via laser excitation. For a quality result, low concentrations of phosphor particles should be used to avoid altering the properties of the fluid and multiple scattering. A low particle concentration is also essential for applications such as the production of miniature devices,34 thin coatings for lighting, solar cell sensitization, temperature measurements in gases and fluids, and medical imaging.29,31 Among the post-transition metals, Bi3+-doped vanadates have shown exceptional thermal sensitivity around ambient temperatures.30,31 Bi3+ also possesses an intrinsic ability to emit in different ranges of the electromagnetic spectrum, depending on the crystal field strength of the host compound35 (e.g., Y3Al5O12:Bi3+ emits at 303 nm,36 while ScVO4:Bi3+ emits at 635 nm).37 In general, Bi3+ can emit from the ultraviolet to near-infrared spectrum in different hosts.31,35–46
In Bi3+-doped vanadates, the onset of thermal quenching and therefore the temperature-sensitive range can also be adjusted by choosing a different host compound. For example, Bi3+-doped Y, Gd, or Lu vanadates, quench at higher temperatures (∼100 °C) compared to ScVO4, which quenches around room temperature.31,47,48 Another vanadate that has exhibited modest luminescence quenching around room temperature is strontium pyrovanadate (Sr2V2O7).49 Sr2V2O7 is a stable compound with interesting crystal chemistry and optical properties.50 The decay time of this phosphor is in the microsecond range, which is ideal for fast-flow imaging and for time-gated imaging in applications where fluorescence is not suitable.51 The luminescence emission spectrum of the phosphor covers almost the entire visible spectrum and the near-infrared region (the first biological window), making it suitable for biological applications. Therefore, this research intends to produce a Sr2V2O7:Bi3+ phosphor using the modified Pechini method. To maintain the charge balance in the Sr2V2O7:Bi3+ matrix (Sr is divalent, and Bi is a trivalent ion), three Sr2+ were replaced by two Bi3+ to create Sr2−1.5xBi2xV2O7. The luminescence intensity of the phosphor was enhanced by doping with different concentrations of Bi3+ and annealing at different temperatures. In our previous report,31 we demonstrated that ScVO4:Bi3+ has exceptional thermometric properties at ambient temperatures, so the luminescence intensity and the quantum efficiency of this phosphor were compared to those of Sr2V2O7:Bi3+. The temperature dependence of the luminescence intensity and lifetime were measured by dispersing 40 mg L−1 of the powder in distilled water, and exploring the potential application of this phosphor for remote thermometry using the temperature dependence of the luminescence lifetime.
2. Experimental
2.1. Synthesis
Sr2−1.5xBi2xV2O7 (x = 0, 0.0005, 0.001, 0.003, 0.005, and 0.01) phosphors were prepared by the modified Pechini method. The starting precursors are strontium nitrate (Sr(NO3)2, 99.9%), ammonium metavanadate (NH4VO3, 99.8%), bismuth(III) oxide (Bi2O3, 99.9%), citric acid (C6H8O7, 99.5%), polyethylene glycol (H(OCH2CH2)nOH, (PEG-4000)) and nitric acid. Stoichiometric amounts of Sr(NO3)2, NH4VO3, and Bi2O3 were dissolved in 10 ml of nitric acid in one glass beaker. C6H8O7 and PEG-4000 were also dissolved in 40 ml of deionized water in another beaker. Both mixtures were then stirred in a magnetic hot plate set at 150 and 70 °C, respectively, for 30 min. The two solutions were mixed and stirred for about 4 h. Afterwards, the solution was dried in an oven at 100 °C for 24 h until a resin was formed. The molar ratio of C6H8O7 to all metals is 3:1, and that of PEG-4000 to C6H8O7 is 10:1. The resin was ground into powder and annealed at 1000 °C for 4 h. Subsequently, the sample doped with 0.1 mol%Bi3+ was annealed at 600, 800, 1100 and 1200 °C. For ScVO4 doped with 1 mol%Bi3+, the same procedure was followed using Sc2O3 (99.9%) as the source of Sc, and the sample was annealed at 600, 800, and 1000 °C.
2.2. Characterization
A Bruker D8 Advance X-ray diffractometer was used for the structure analysis. A Jeol JSM-7800F field emission scanning electron microscope (FE-SEM) fitted with an Oxford X-MaxN 80 energy-dispersive X-ray spectroscopy (EDS) apparatus was used for the morphology and the elemental analysis. An FLS980 fluorescence spectrometer (Edinburgh Instruments) equipped with a 450 W xenon lamp as a steady-state excitation source was used to measure the photoluminescence, and a 340 nm pulsed light-emitting diode incorporated into an FLS980 fluorescence spectrometer was used for the lifetime measurements at room temperature. An integrating sphere incorporated in the FLS980 spectrometer was used for the quantum efficiency (QE) measurement. The temperature dependence of the luminescence intensity was measured with a system consisting of a 325 nm He–Cd gas laser as excitation source, a spectrometer, a photomultiplier tube detector, and a lock-in amplifier. The temperature dependence of the lifetime was measured by exciting the sample with the third harmonic (355 nm) of an Nd–YAG laser and using a Thorlabs – PDA8A2 Si fixed gain detector, 320–1000 nm, amplified photodiode connected to and oscilloscope to measure the lifetime.
3. Results and discussion
3.1. Structure
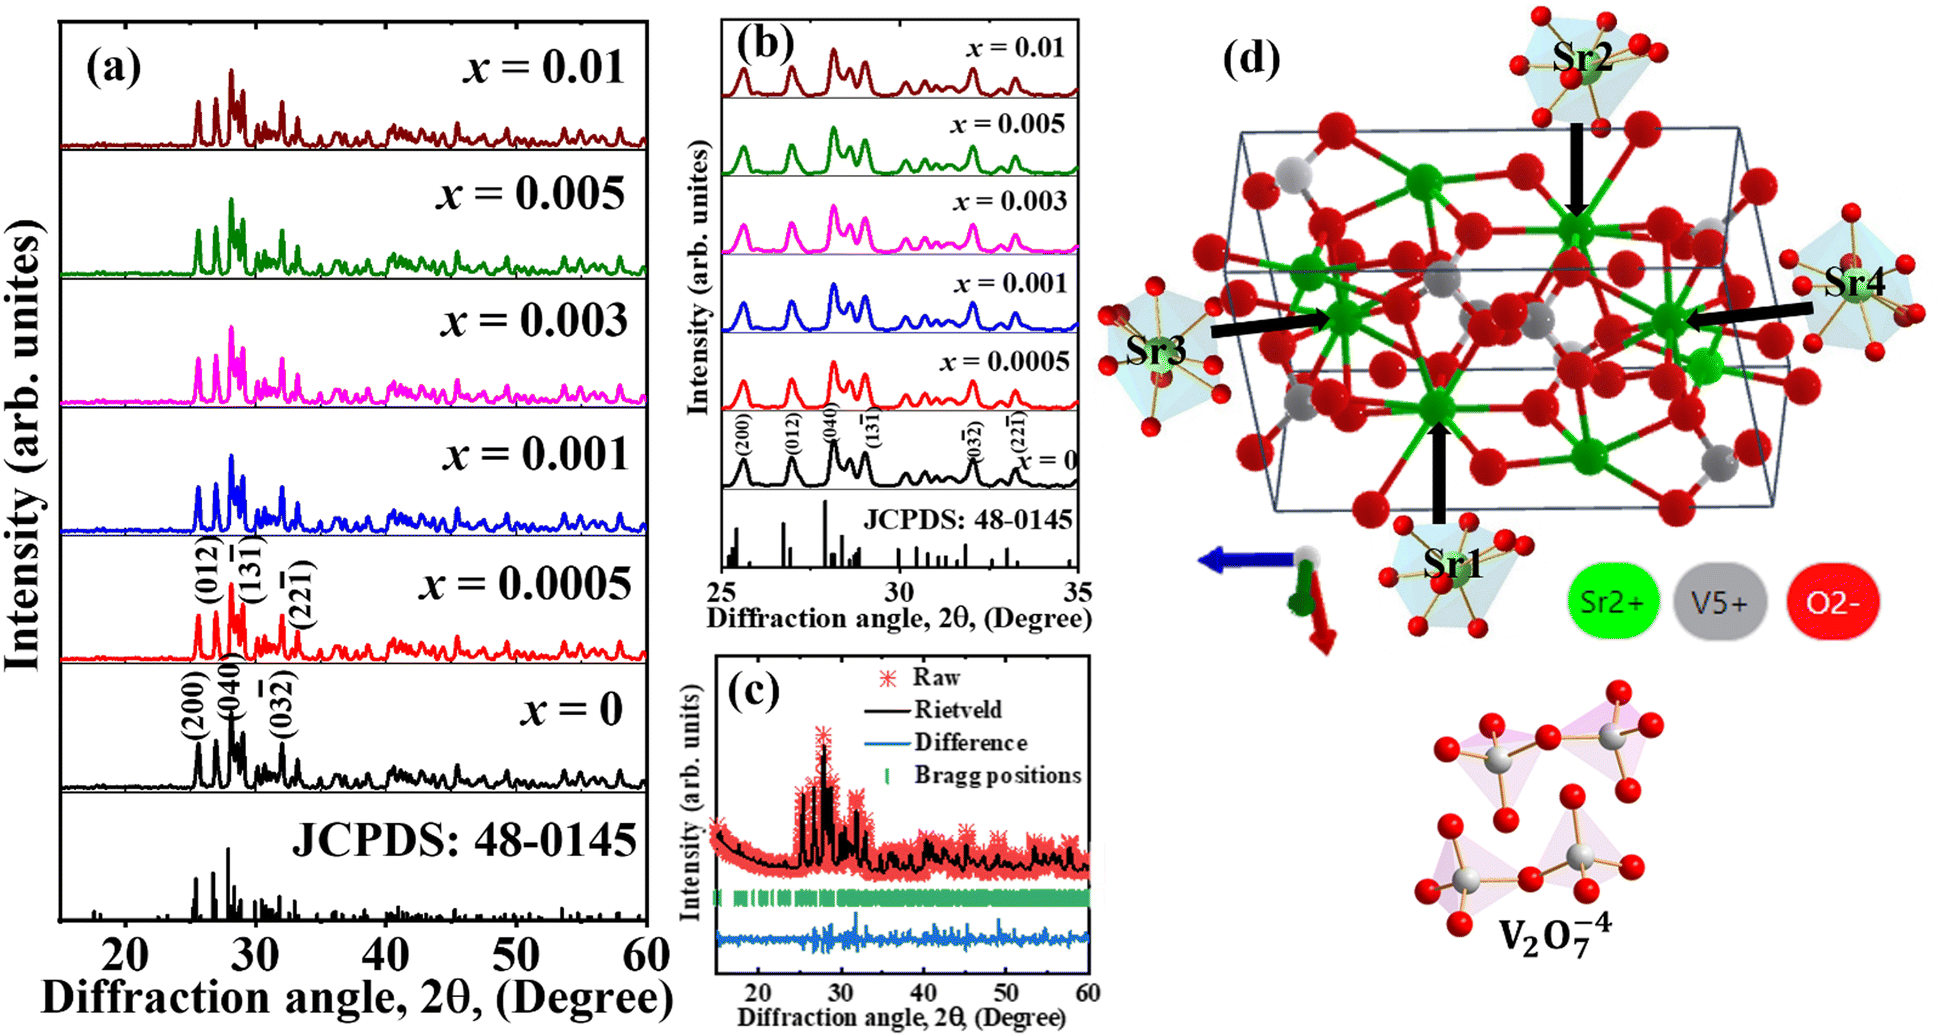
The X-ray powder diffraction (XRPD) patterns of Sr2−1.5xBi2xV2O7 (x = 0, 0.0005, 0.001, 0.003, 0.005, and 0.01) annealed at 1000 °C are shown in Fig. 1a and b shows the enlarged XRPD patterns in the diffraction angle range of 25° to 35°. The phosphors crystallized in the triclinic phase belonging to the P![[1 with combining macron]](https://www.rsc.org/images/entities/char_0031_0304.gif) space group, and matched with the Joint Committee on Powder Diffraction Standards (JCPDS) file no. 48-0145. The Rietveld refined results of the sample doped with x = 0.001Bi3+ is shown in Fig. 1c. The Rietveld refined cell parameters (a = 7.0571 Å, b = 7.1033, c = 12.9932 Å, and V = 641.25 Å3) agreed well with the standard cell parameters (a = 7.0574, b = 7.1032, c = 13.0070 Å, and V = 641.93 Å3). Generally viewed as the “stacking of four layers of heavy atoms,” each layer in the structure of Sr2V2O7 contains four inequivalent strontium (Sr1, Sr2, Sr3 and Sr4) and four inequivalent vanadium (V1, V2, V3 and V4) sites, giving rise to eight Sr2+ and eight V5+ sites within the unit cell (Fig. 1d).50,52 Eight atoms of oxygen coordinated the Sr1 and Sr2 sites with dissimilar Sr–O bond lengths, whereas 9-atoms of oxygen coordinated the Sr3 and Sr4 sites with differing Sr–O bond lengths. The four V5+ sites are contained in two different V2O7 clusters (Fig. 1d), consisting of two VO4 tetrahedra clusters linked by an oxygen apex.53 The ionic radii of Sr2+ in 8 and 9 coordination are 1.26 and 1.31 Å, respectively, while that of Bi3+ in 8 coordination is 1.17 Å. Considering the ionic radii, Bi3+ can easily substitute the Sr3+ sites in the host.
space group, and matched with the Joint Committee on Powder Diffraction Standards (JCPDS) file no. 48-0145. The Rietveld refined results of the sample doped with x = 0.001Bi3+ is shown in Fig. 1c. The Rietveld refined cell parameters (a = 7.0571 Å, b = 7.1033, c = 12.9932 Å, and V = 641.25 Å3) agreed well with the standard cell parameters (a = 7.0574, b = 7.1032, c = 13.0070 Å, and V = 641.93 Å3). Generally viewed as the “stacking of four layers of heavy atoms,” each layer in the structure of Sr2V2O7 contains four inequivalent strontium (Sr1, Sr2, Sr3 and Sr4) and four inequivalent vanadium (V1, V2, V3 and V4) sites, giving rise to eight Sr2+ and eight V5+ sites within the unit cell (Fig. 1d).50,52 Eight atoms of oxygen coordinated the Sr1 and Sr2 sites with dissimilar Sr–O bond lengths, whereas 9-atoms of oxygen coordinated the Sr3 and Sr4 sites with differing Sr–O bond lengths. The four V5+ sites are contained in two different V2O7 clusters (Fig. 1d), consisting of two VO4 tetrahedra clusters linked by an oxygen apex.53 The ionic radii of Sr2+ in 8 and 9 coordination are 1.26 and 1.31 Å, respectively, while that of Bi3+ in 8 coordination is 1.17 Å. Considering the ionic radii, Bi3+ can easily substitute the Sr3+ sites in the host.
 |
| | Fig. 1 (a) The XRPD patterns of Sr2−1.5xBi2xV2O7 (x = 0, 0.0005, 0.001, 0.003, 0.005, and 0.01) annealed at 1000 °C. (b) Enlarged XRPD patterns in the 2θ range of 25° to 35°. (c) The Rietveld refinement of the sample doped with x = 0.001Bi3+. (d) The unit cell of Sr2V2O7, showing the various Sr2+ and V5+ sites. | |
3.2. Morphology and elemental composition
The FE-SEM image (Fig. 2a) of the sample doped with x = 0.1 mol%Bi3+ (henceforth, denoted as x = 0.001Bi3+) contains agglomerates of spherical particles of different sizes with an average size of 0.4 μm, as shown in the particle size distribution plot in Fig. 2b. The inset of Fig. 2a shows the 2.5× enlarged image. The EDS spectrum taken from x = 0.001Bi3+ (Fig. 2c) shows peaks from Sr, V, O, and Bi as expected, as well as Ir and C peaks, which emerge from the iridium used to coat the powder to prevent charging and carbon tape used to mount the sample and the environmental hydrocarbon.
 |
| | Fig. 2 (a) The FE-SEM image of x = 0.001Bi3+ (inset of (a) is the 2.5× enlargement of the FE-SEM image). (b) The particle size distribution taken from the FE-SEM image, and (c) the EDS spectrum. | |
3.3. Optimization of the luminescence intensity by doping
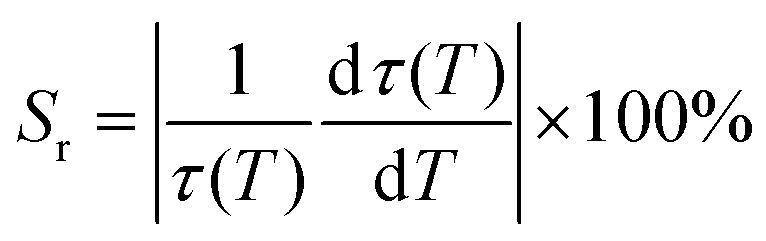
Fig. 3a shows the photoluminescence (PL) excitation spectra of Sr2−1.5xBi2xV2O7 (x = 0, 0.0005, 0.001, 0.003, 0.005, and 0.01) obtained by monitoring the emission at 550 nm. The spectra exhibited a broad band spanning from the ultraviolet to the near-visible range, which broadened toward blue for the Bi3+-doped samples. The spectra consist of a peak at 265 nm and a maximum peak around 335 nm for the undoped Sr2V2O7 (x = 0). The second band, observed around 335 nm for the undoped Sr2V2O7, shifted to ∼340 nm and broadened towards the longer wavelength for the doped samples (Fig. 3c). The bands at 265 and 335 nm are due to the absorption from the 1A1 ground state of VO43− to its 3T2 and 3T1 excited states, respectively (see Fig. 4c).54,55 The shift in the peak maximum position and broadening observed in the doped sample is associated with two transitions; (i) the absorption of Bi3+ ions originating from the 1S0 → 3P1 (around 340 nm) transition, and (ii) the metal-to-metal charge-transfer (MMCT) absorption (the little bump around 362 nm in the doped samples) corresponding to a transition from the Bi3+ ground state to the host conduction band states. The MMCT state originates from the interaction between the Bi3+(6s2)–V5+(3d0) configuration. The values of the MMCT transitions can be calculated using the empirical equations proposed by Philippe Boutinaud56 presented in eqn (1) for the 4-coordinated V5+:| |  | (1) |
and in eqn (2) for the 8-coordinated Sr2+| |  | (2) |
where| |  | (3) |
In eqn (1) and (2), χ4(Mn+) and χCN>4(Mn+) which in this case are χ4(V5+) and χ8(Sr2+), refer to the optical electronegativity of the 4-coordinated V5+ and 8-coordinated Sr2+, respectively. In eqn (3), dhost = d(Bi3+–V5+) or d(Bi3+–Sr2+) are the shortest distances between Bi3+–V5+ and Bi3+–Sr2+, respectively; r(Bi3+) and r(host) are the ionic radii of 8-coordinated Bi3+ and 8-coordinated Sr2+ ions or 4-coordinated V5+, respectively. The values of d(Bi3+–Sr2+), 3.92 Å, and d(Bi3+–V5+), 3.28 Å, were obtained by determining the distances between Sr0–Sr5 and Sr7–V13, respectively, from CIF data57 using Diamond software.58 It should be noted that Bi3+ will substitute Sr sites in the host. Therefore, the shortest Sr–Sr and Sr–V bond lengths were used for the calculation. Using the values of the parameters listed in Table 1, the value of the Bi3+–Sr2+ MMCT transition was calculated to be 41358 cm−1 (242 nm), and it is not observed in the spectra. This makes sense since Sr2+ does not have a d0 or d10 configuration. The value of the Bi3+–V5+ MMCT was calculated to be 27934 cm−1 (358 nm), which is very close to the small shoulder observed around 360 nm in Fig. 3a, suggesting that the Bi3+–V5+ MMCT transition could be the origin of the luminescence emission. In addition, Boutinaud and Cavalli,59,60 claimed that the ratio of the electronegativity to the Bi3+–V5+ distance, χ4(Mn+)/dcoor.(Bi3+–V5+), appears to be a decent way to predict the trends in Bi-activated phosphors. Back et al.61 suggested that for a χ4(Mn+)/dcoor.(Bi3+–V5+) ratio ≤0.52, the 3P1,0 → 1S0 transition dominates the PL emission spectrum. For the ratio ≥0.53, the MMCT is the emitting state. The calculated ratio in this material is 0.67, suggesting that the emission is dominated by the MMCT state.
 |
| | Fig. 3 (a) The PL excitation spectra measured when monitoring the emission at 550 nm, and (b) the emission spectra excited at 340 nm for Sr2−1.5xBi2xV2O7 (x = 0, 0.0005, 0.001, 0.003, 0.005, and 0.01) phosphors; (c) normalized excitation spectra; (d) normalized emission spectra; (e) the graph of the integral emission intensity versus Bi3+ doping concentrations; the inset of (e) is the emission spectra of the undoped Sr2V2O7 and x = 0.001Bi3+-doped sample excited at 380 nm, and (f) CIE coordinates of the phosphors. The fitted line is only used to help guide the eye. | |
 |
| | Fig. 4 Fitted PL emission spectra of (a) undoped Sr2V2O7 and (b) x = 0.001Bi3+ excited at 340 and 380 nm, respectively; (c) photoluminescence mechanism. | |
Table 1 Values of the parameters used to calculate MMCT values
| Parameter |
Value |
Ref. |
|
χ
8(Sr2+) |
1.12 |
62
|
|
χ
4(V5+) |
2.47 |
62
|
|
r(Bi3+) (Å) |
1.17 |
63
|
|
r(Sr2+) (Å) |
1.26 |
63
|
|
r(V5+) (Å) |
0.36 |
63
|
|
d(Bi3+–Sr2+) (Å) |
3.92 |
|
|
d(Bi3+–V5+) (Å) |
3.28 |
|
|
d
coor.(Bi3+–V5+) (Å) |
3.69 |
|
|
d
coor.(Bi3+–Sr2+) (Å) |
3.87 |
|
When excited at 340 nm, the PL emission of the phosphors exhibited a broad spectrum covering almost the entire visible wavelength range (Fig. 3b). The band maxima of the emission spectra shifted from 550 nm for the undoped Sr2V2O7 to 540 nm for the doped samples. The normalized emission spectra also showed that the emission bands broadened slightly to a shorter wavelength with Bi3+ doping (Fig. 3d). The broad band observed in the undoped Sr2V2O7 is common in many vanadate hosts, and it comprises two bands from the VO4 clusters emerging from the electronic transitions from 3T2 → 1A1 and 3T1 → 1A1 (see Fig. 4a).55,64,65 Gupta et al.66 reported two emission bands at 450 and 600 nm from undoped Sr2V2O7, which merged to a single broadband with maxima at 540 nm and a reduced bandwidth following Bi3+ doping. However, no significant change was observed in the luminescence intensity with Bi3+ doping. They assigned these effects to a reduced energy difference between the 3T and 1A levels of VO43−, resulting from the distortion of the VO4 tetrahedra structure by the Bi3+ ions doping. Matsushima et al.65 also reported multiple emission bands from an undoped Sr2V2O7. Other authors, on the contrary, have reported a single broad emission band with a maxima around 550 nm from undoped Sr2V2O7.65,67–71 A notable difference from the above reports is the purity of the starting vanadate precursors. Although Gupta et al.66 did not state the purity of the vanadate precursors, Matsushima et al. used 99% purity precursors, while other authors used 99.9% purity. Therefore, the reported double emission bands from Sr2V2O7 by Gupta et al. and Matsushima et al. could originate from luminescence centers from other impurities in the material, and not VO4. Gupta et al.66 also concluded that Bi3+ doping into Sr2V2O7 caused quenching of the luminescence intensity, and attributed the emission band in the Bi3+ doped sample to the host transitions. However, their lowest Bi3+ doping concentration was 0.5 mol%, at which the luminescence intensity has already started quenching, according to the findings herein (Fig. 3e). According to Fig. 3e, the luminescence intensity of the phosphors increased with a Bi3+ doping concentration up to 0.1 mol%, and started to quench upon further doping due to concentration quenching.54 Therefore, we believe that the change in the shape of the emission spectra observed by Gupta et al.66 could be due to the bands taking the shape of the Bi3+ emission spectrum with increasing Bi3+ doping concentration, which is rational considering that the band maximum (540 nm) agrees with what is reported herein.
The shift in emission wavelength (from 550 to 540 nm) observed in Fig. 3b after Bi3+ doping suggests that the emission from the Bi3+ transitions overlaps with the host emission. To further confirm this, the emission of the undoped Sr2V2O7 and the x = 0.001Bi3+-doped samples were measured using 380 nm excitation (in this region, the excitation of the undoped sample is flat). From these spectra shown in the inset of Fig. 3e, the emission from the undoped Sr2V2O7 was flat, but the doped sample exhibited a broad band with features similar to those excited at 340 nm in Fig. 3b. The ground state of Bi3+ is 1S0, having electronic configuration [Xe] 4f14 5d10 6s2, and the excited states in increasing order of energy are 3P0, 3P1, 3P2 and 1P1, with 6s6p configuration.54 Due to the nature of the electronic configuration, the position and width of the luminescence emission band of the Bi3+ ions highly depend on the crystal field strength of the host matrix.72,73 These shifts in band positions usually observed in the Bi3+-doped matrices are due to the outer 6p shell having lone pair electrons which can be influenced by its environment.74 Thus, as the crystal field experienced by the Bi3+ ions in the host increases, the position of the emission band maximum shifts to a longer wavelength.75,76 For example, in the SrO, LuVO4 and ScVO4 hosts, the emission maximum of Bi3+ was observed at 444, 576 and 635 nm,43,47,77 respectively. Hence, the crystal field strength of these hosts compared to that of Sr2V2O7 is presumably in the order: ScVO4 > LuVO4 > Sr2V2O7 > SrO. The CIE coordinates of the phosphors (Fig. 4f) exhibited coordinates of warm white light without significant variation with the doping concentration.
The fitted PL emission spectra of the undoped Sr2V2O7 (excited at 340 nm) and the x = 0.001Bi3+ doped sample (excited at 380 nm) shown in Fig. 4a and b, respectively, consist of two bands each, belonging to the 3T1 → 1A1 (2.20 eV) and 3T2 → 1A1 (2.35) transitions of VO4, and the MMCT (2.09 and 2.30 eV) transitions.65,78 Since there are four Sr sites in Sr2V2O7, there could be up to four bands for Bi3+ MMCT emission.
However, in the present case, the experimental data could be fitted well by only two bands, which could mean that Bi3+ either preferentially occupies only certain sites or that their MMCT emission energies are too similar to easily resolve. The MMCT energy levels lies slightly below the 3P0,1 → 1S0 transitions of Bi3+. The existence of two emission bands in the MMCT states has been reported by Cavalli et al.78 The evidence of the existence of more than one emission band in the MMCT state can be seen in the temperature-dependent luminescence spectra in Fig. 8a. It is evident from Fig. 8a that the luminescent intensity in the long wavelength is more responsive to the change in temperature than the short wavelength region. Another evidence of the existence of two emission bands in the MMCT state is the double exponential nature of the decay curve (see Fig. 10a and b). The energy diagram describing the luminescence mechanism of the undoped and Bi3+-doped Sr2V2O7 excited at 340 nm and the Bi3+-doped Sr2V2O7 excited at 380 nm are shown in Fig. 4c. Soon after electrons are excited from the ground state (1A1) of the VO43− group to one of the V 3d levels (3T2) using a 340 nm lamp (this energy is not enough to promote an electron to the 1T2 level), the excited electrons exhibit emission from the 3T1 → 1A1 and 3T2 → 1A1 levels of VO43− group for the undoped sample. Meanwhile, for the Bi3+-doped samples, the host emission is reabsorbed by the 3P0,1 state of Bi3+. Instead of giving out emission, the electrons from the 3P0,1 state of Bi3+ undergo a nonradiative transition and move to the lower-lying Bi3+–V5+ MMCT level, leading to emission from the MMCT → 1S0 transition. Furthermore, when the Bi3+-doped sample was excited at 380 nm, electrons moved from the 1S0 ground state to the 3P0,1 excited state of Bi3+, undergo nonradiative transition to the MMCT state, and emission was observed from the MMCT → 1S0 transition.
3.4. Optimization of the luminescence intensity by annealing
The effect of annealing temperatures on the luminescence properties of the samples doped with x = 0.001Bi3+ was studied in the temperature range of 600–1200 °C (Fig. 5). The excitation spectra (Fig. 5a) shared common characteristics with those shown in Fig. 3a and c, except for the change in the excitation peak maximum observed with the change in the annealing temperatures. At the lower annealing temperatures (600, 800, and 1000 °C), the excitation maximum shifted to the longer wavelength (328, 334, and 340 nm, respectively) with increasing temperature. For higher annealing temperatures (1100 and 1200 °C), the excitation maximum shifted to shorter wavelengths (337 and 334 nm, respectively). This effect is due to a change in the covalency between the anion (O2−) and the cations (V5+ and Bi3+ ions).79–82 Conventionally, the electronic interaction decreases with increasing covalency, hence decreasing the energy level of the excited state of the metal ion83 – a phenomenon known as the nephelauxetic effect.84 Thus, the initial shift towards a longer wavelength (lower energy) at low annealing temperatures (600–1000 °C) is due to an increase in the covalency, while the subsequent shift to a shorter wavelength (higher energy) at higher annealing temperatures (1100–1200 °C) implies a decrease in the covalency. Also, the crystal field strength increases with covalency and decreases with increasing coordination number.85–88 In ref. 79–93, it was shown that oxygen vacancies have the propensity to increase with temperature at low annealing temperatures, and subsequently decrease at higher annealing temperatures in different materials. Hence, the initial increase in oxygen vacancy at lower annealing temperatures (600–1000 °C) will decrease the coordination number, and hence increase the crystal field, leading to a decrease in the energy level of the excited state. Meanwhile, the later decrease in oxygen vacancy at higher annealing temperatures (1100–1200 °C) will increase the coordination number, causing the crystal field to decrease and increasing the energy level of the excited state. The luminescence emission spectra (Fig. 5b) have similar features to those shown in Fig. 3b, but the emission maxima shifted from lower to higher wavelengths (543, 546, and 550 nm) for the samples annealed at 600, 800 and 1000 °C, respectively, and then to lower wavelengths (548 and 545 nm) for the samples annealed at 1100 and 1200 °C, respectively. These shifts in the wavelength maximum are concurrent with those observed in the excitation spectra (Fig. 5a). The plot of the integrated emission intensity versus annealing temperature (Fig. 5c) shows that the best luminescence intensity was attained from the samples annealed at 1000 °C. The decrease in luminescence intensity at high annealing temperatures is likely to be related to the evaporation of Bi3+ ions from the surface of the material.94
 |
| | Fig. 5 The luminescence (a) normalized excitation and (b) emission spectra of the sample doped with x = 0.001Bi3+ annealed at 600, 800, 1000, 1100 and 1200 °C, and (c) the plot of the integrated luminescence intensity versus annealing temperature. The fitted line is only used to help guide the eye. | |
The luminescence of orthovanadates doped with Bi3+ has been widely studied. Among these orthovanadates, YVO4, LuVO4, ScVO4 and GdVO4 doped with Bi3+ have shown high quantum efficiencies (QE) with internal quantum efficiencies (IQE) of 75%, 68%, 35%36 and 80%,45 respectively. Ref. 77 reported a higher IQE of 56% for ScVO4:Bi3+. Generally, the onset of the thermal quenching, and hence the temperature-sensitivity range, is a function of the intrinsic properties of the host material.95 In the orthovanadate-doped Bi3+, although YVO4, GdVO4, and LuVO4 have better QE, they quenched at higher temperatures (∼100 °C) compared to ScVO4, which quenched at around room temperature.31,47,48
Abram et al.31 and Kang et al.77 reported the luminescence of ScVO4:Bi3+, and both obtained the optimum luminescence intensity at 1 mol%. To rank the QE of Sr2−1.5xV2O7 doped with Bi3+ among the aforementioned materials, we compared the luminescence intensities of Sr2−1.5xV2O7 doped with x = 0.001Bi3+ (the spectra shown in Fig. 5) and ScVO4:0.01Bi3+ annealed at different temperatures. The QE of the best sample among the two materials was also compared. From the XRPD of both materials annealed at different temperatures, the FE-SEM image, particle size distribution, and EDS of ScVO4:0.01Bi3+ annealed at 800 °C are shown in S1a and b, and S2a–c (ESI†), respectively. The PL excitation and emission spectra of ScVO4:0.01Bi3+ annealed at different temperatures are shown in S3a and b (ESI†). Fig. 6 compares the luminescence intensities of Sr2−1.5xV2O7 doped with x = 0.001Bi3+ and ScVO4:0.01Bi3+ annealed at different temperatures. The luminescence intensity of ScVO4:0.01Bi3+ attained its maximum from the sample annealed at 800 °C, with the intensity slightly lower than that of Sr2−1.5xV2O7 doped with x = 0.001Bi3+ annealed at 1000 °C. The IQE of x = 0.001Bi3+ and ScVO4:0.01Bi3+ annealed at 1000 and 800 °C were measured to be 14% and 12%, respectively, which ranked the two materials in a close bracket of brightness. The difference in the values of the reported QE of ScVO4:0.01Bi3+ reported in ref. 36 and 77 and the value measured herein could be due to the difference in the synthesis method, suggesting that solid-state synthesis is a better method in terms of brightness.
 |
| | Fig. 6 The integrated luminescence intensities versus annealing temperature for Sr2−1.5xV2O7 doped with x = 0.001Bi3+ and ScVO4:0.01Bi3+. The fitted line is only used to help guide the eye. | |
3.5. Luminescence by particle dispersion
The particle dispersion method is essential since it has a similar mechanism to the behaviour of phosphor particles in optically thin arrangements of particles, for example, in applications such as thin coatings for lighting, solar cell sensitization, temperature measurements in fluids, and medical imaging.29 This method allows for the temperature control (10–70 °C) of the particle dispersion to extract the temperature dependence of the luminescence and lifetime, which are the critical parameters. For comparison, the normalized luminescence excitation and emission spectra of powder and the phosphor particle–water dispersion (40 mg L−1) of the x = 0.001Bi3+ are shown in Fig. 7a and b. The luminescence of the dispersed material and the powder material have similar features. According to ref. 29, the particle–water dispersion allows for quantitative determination of the signal per mass of phosphor particles, which enables the comparison of the absolute luminescence signal of different phosphors. For ScVO4:0.01Bi3+, as high as 7 × 10¹³ photons per mg was reported in ref. 31, which is comparable with some of the best phosphors used in flow temperature imaging.29 The small quantity of powder required for the particle–water dispersion suggests that excessively high mass concentrations are not required in experiments.
 |
| | Fig. 7 The luminescence (a) excitation and (b) emission spectra of x = 0.001Bi3+ measured from powder and phosphor particles–water dispersion. | |
3.6. Temperature dependence of the luminescence intensity
The temperature dependence of the luminescence intensity of Sr2−1.5xV2O7 doped with x = 0.001Bi3+ was measured in the temperature range of 22 to 60 °C by dispersing 40 mg of the phosphor particles in a liter of distilled water, and using a 325 nm He–Cd laser as the excitation source (Fig. 8a). The luminescence intensity exhibited strong thermal quenching in the measured temperature range, and the position of the peak maximum displayed a blue-shift from 555 nm at 22 °C to 545 nm at 60 °C. Fig. 8b shows how the luminescence emission intensity and the peak maximum position behave with an increase in temperature. The temperature dependence of the luminescence intensity (I) was fitted using a quadratic equation given by eqn (4).where T is the temperature, and A, B and C are the fitting parameters. The peak maximum showed a linear regression with increasing temperature. The colour responses (Fig. 8c) showed a pronounced colour change, shifting from yellow towards white, confirming the blue-shift of the spectra maximum. The inset of Fig. 8c is the yellow light observed from the dispersed particles measured at 22 °C.
 |
| | Fig. 8 (a) Temperature dependence of the luminescence intensity of water-dispersed Sr2V2O7 doped with x = 0.001Bi3+; (b) luminescence intensity and peak position versus temperature; (c) CIE coordinates showing the colour response of the phosphor; inset of (c) is an image of the dispersed particles under 325 nm He–Cd laser as the excitation, and (d) ln(I0/IT − 1) versus inverse temperature. | |
The thermal quenching observed in Fig. 8a resulted from increased electron–phonon interaction as the temperature was increased. The excited electrons could gain adequate phonon energy to overcome the energy barrier, leading to a non-radiative transition, and hence thermal quenching. This energy barrier is the activation energy (ΔE). The activation energy can be calculated using the Arrhenius equation,96eqn (5):
| |  | (5) |
where
kB is the Boltzmann constant (8.629 × 10
−5 eV K
−1),
I0 is the initial emission intensity (in this case, at
T = 22 °C) and
IT is the emission intensities at higher temperatures. From
eqn (5), Δ
E is inversely related to the
T; hence, the bigger the activation energy, the weaker the thermal quenching. The value of the Δ
E was determined by plotting the ln(
I0/
IT − 1)
versus 1/
T, taking the best fit (
Fig. 8d) and equating Δ
E/
kB to the slope of the graph. The value of the Δ
E is about 0.28 eV, which is similar to the value reported by Li
et al.49
3.7. Temperature dependence of the lifetime
The temperature dependence of the lifetime of the x = 0.001Bi3+ sample dispersed in distilled water was measured between 20 °C and 70 °C using the third harmonic of a pulsed Nd:YAG laser (355 nm, 8 ns, 30 Hz), laser fluence of 10 mJ cm−2, an amplified photodetector, and oscilloscope (Fig. 9). A 550 nm long pass filter was used to block the 355 and 532 nm lines of the laser from entering the photodetector.
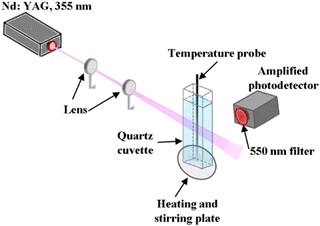 |
| | Fig. 9 Experimental set-up for the temperature-dependence of lifetime measurement. | |
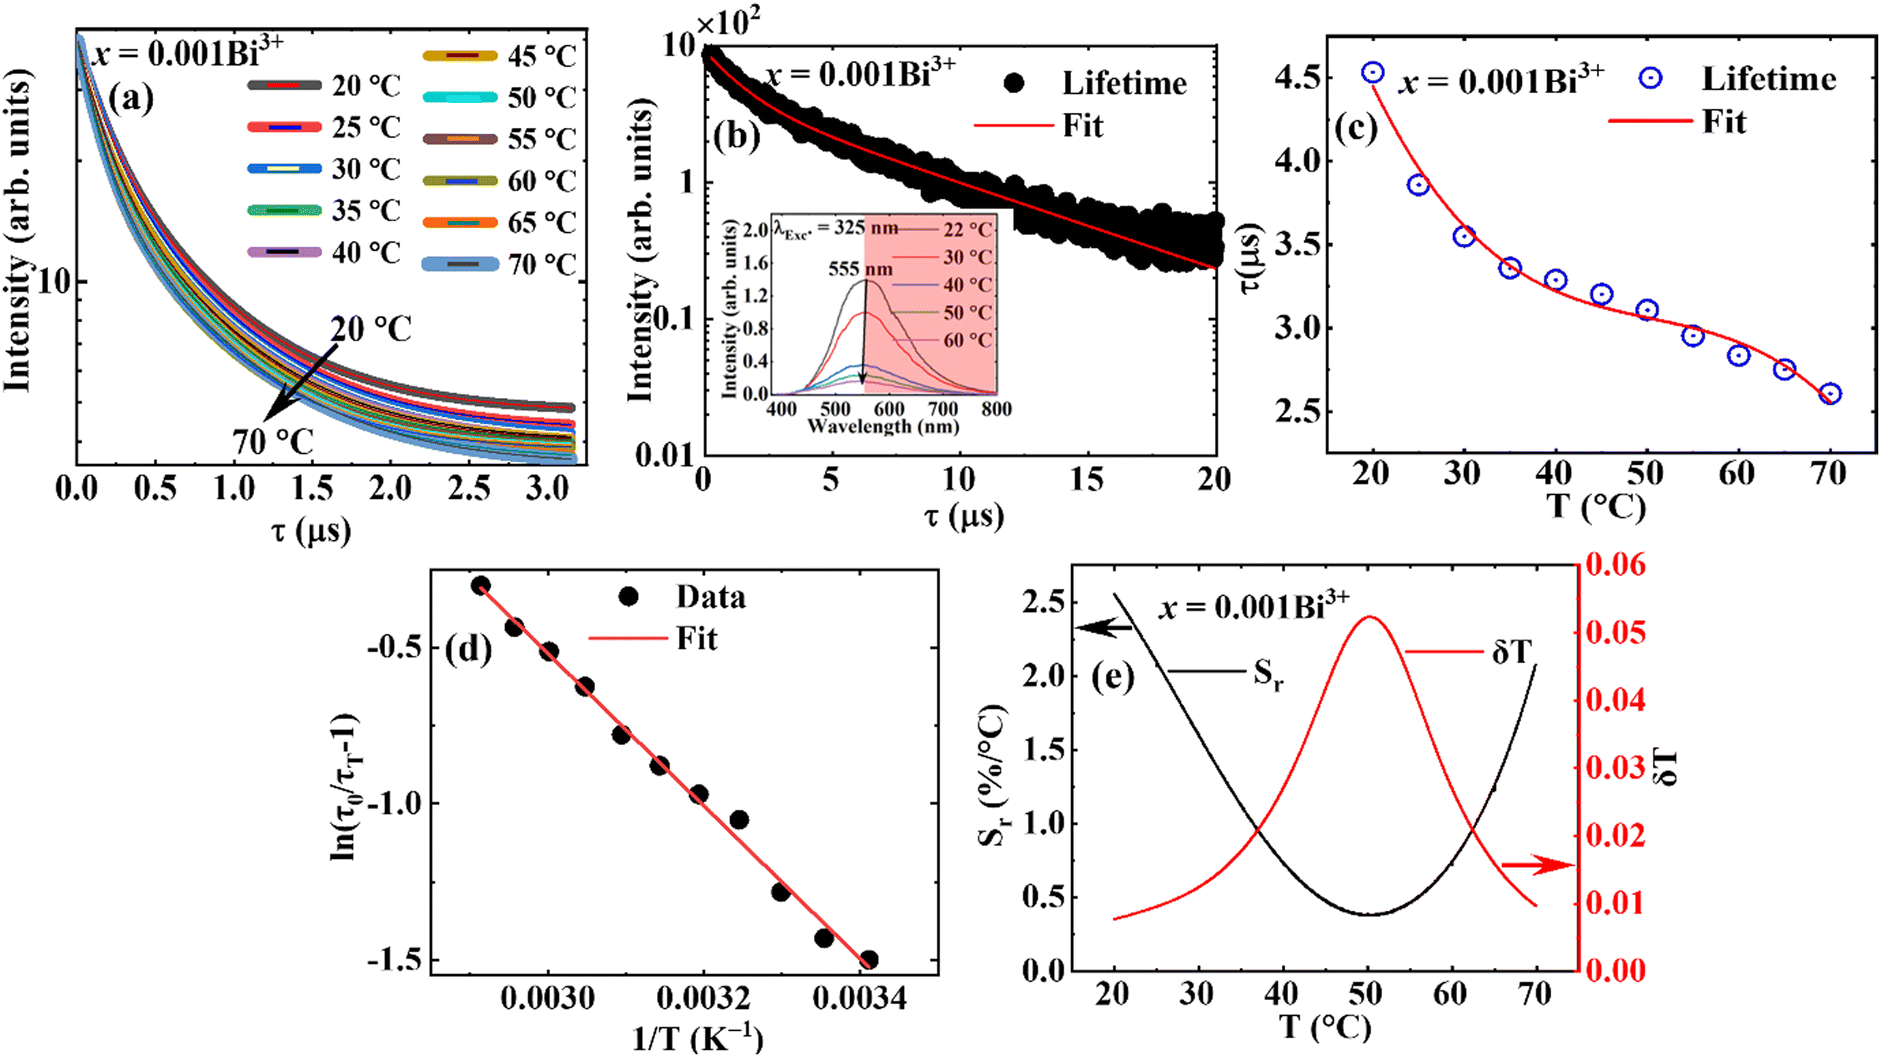
Fig. 10a shows the decay curves of the dispersed phosphors. For the sake of comparison, the lifetime of the same sample was measured at room temperature (shown in Fig. 10b), by monitoring the emission at 550 nm, and excited using an EPLED 340 nm incorporated in the FLS980 fluorescence spectrometer. The decay curves were fitted using a double-exponential function given by eqn (6):
| |  | (6) |
where
I(
t) is the luminescence intensity at time ‘
t’, and
τ1 and
τ2 are the first and second-order lifetime components corresponding to decay constants
A and
B, respectively.
97 The double-exponential decay curve suggests the presence of at least two types of decay pathways in the phosphor,
98 which is evident in the presence of two MMCT emission bands, as shown in
Fig. 4b and c. The average decay time
τ for a double exponential curve, defined by
eqn (7),
| |  | (7) |
was calculated to be 4.6 and 5.6 μs for the dispersed phosphor measure at 20 °C and the powder sample measured using a fluorescence spectrometer, respectively. The lifetime obtained using fluorescence spectroscopy is 1 μs longer, presumably because it was measured at a fixed emission wavelength (550 nm). Meanwhile, for the dispersed particles, the lifetime was measured for a long spectral range (551–800 nm) (the spectral region displayed in blush red in the inset of
Fig. 10b). The lifetime
versus temperature plot was fitted using a cubic polynomial function given by
eqn (8):
| | | τ = A + BT + CT2 + DT3 | (8) |
where
A,
B,
C and
D are fitting parameters of the polynomial, and
T is the temperature, and the plot is shown in
Fig. 10c. It is apparent from
Fig. 10c that the lifetime strongly decreases in the 20–40 °C temperature range, showing a tenuous decrease with temperature in the 45–60 °C range and a steep drop at the lower tail of the graph. The lifetime and the temperature maintain a similar relationship with the luminescence intensity, defined by
eqn (9), from which the Δ
E can also be determined.
99,100| |  | (9) |
Here,
τ0 is the initial lifetime (at
T = 20 °C in this case), and
τT are the lifetimes at the subsequent temperatures. From the best fit of the graph of ln(
τ0/
τT − 1)
vs. 1/
T (
Fig. 10d), the Δ
E was calculated to be 0.24 eV, which is in good agreement with the value obtained from the luminescence data.
 |
| | Fig. 10 (a) The temperature-dependence decay curve of the dispersed particles; (b) the decay curve of the powder sample measured at room temperature; the inset of (b) shows the spectral region (displayed in blush red) the temperature dependence of the lifetime was measured; (c) the plot of the lifetime of the dispersed particles versus temperature, (d) the plot of ln(τ0/τT − 1) versus 1/T, and (e) the relative sensitivity and temperature resolution. | |
The relative sensitivity Sr can be calculated from the temperature dependence of the lifetime data using eqn (10):101
| |  | (10) |
where
τ(
T) is the luminescence lifetime of the phosphor at temperature
T, and d
τ(
T)/d
T is the temperature derivative of
τ(
T).
From Fig. 10e, the Sr exhibited a parabolic form with a maximum value of 2.56%/°C at 20 °C, and decreased with an increase in temperature to the lowest value of 0.34%/°C at 50 °C, and started to increase. Table 2 compares the maximum value of the lifetime-based Sr (Sr max), the Sr value at 25 °C, and the lifetime at 25 °C of x = 0.001Bi3+ to different phosphors in the literature. The Sr max of Sr2−1.5xV2O7 doped x = 0.001Bi3+ compared very well with the best-reported values, except for La2MgGeO6:Bi3+,Eu3+. However, in the temperature region of interest (∼25 °C), the Sr value is among the best. Materials with a very long decay time, >100 μs, or a very short decay time, <10 ns, are either very slow or very fast for imaging applications. The decay time of the Sr2−1.5xV2O7 doped with x = 0.001Bi3+ is in the microsecond range, which can be detected using cameras with a short interframe time, making it suitable for rapid imaging such as in liquid and gas flows, where phosphors can be used as tracer particles.31,51
Table 2 Lifetime-based relative sensitivities of different phosphors and their lifetime at 25 °C
| Phosphor |
S
r, max%/°C |
T (Sr, max) °C |
S
r@25 °C |
Tau@25 °C |
λ
Exc. (nm) |
λ
Emi. (nm) |
Ref. |
| Ba3LuGa2O7.5:Bi3+ |
2.21 |
50 |
1.64 |
335.43 (ns) |
351 |
500 |
100
|
| Ca4(PO4)2O:Eu2+,Eu3+ |
2.07 |
20 |
2.00 |
0.80 (μs) |
355 |
700 |
102
|
| InTaO4:Cr3+ |
2.27 |
42 |
1.42 |
4.58 (μs) |
500 |
880 |
103
|
| Sr4Al14O25:Mn4+ |
1.50 |
147 |
0.21 |
1.55 (ms) |
400 |
651 |
104
|
| Nd0.5Y0.43+Yb0.1PO4 |
1.22 |
82 |
1.14 |
0.11 (ms) |
808 |
980 |
105
|
| Nd0.5Lu0.43+Yb0.1PO4 |
0.85 |
127 |
0.71 |
0.12 (ms) |
808 |
980 |
105
|
| Nd0.5La0.43+Yb0.1PO4 |
1.05 |
147 |
0.84 |
0.16 (ms) |
808 |
980 |
105
|
| Nd0.5Gd0.43+Yb0.1PO4 |
0.74 |
172 |
0.45 |
0.09 (ms) |
808 |
980 |
105
|
| Zn0.9Mn0.1Al2O4:Cr3+ |
0.80 |
−13 |
0.78 |
0.04 (ms) |
427 |
512 |
106
|
| ZnGa2O4:Cr0.5%3+,Bi0.5%3+@SiO2 |
1.93 |
200 |
0.41 |
2.00 (ms) |
430 |
692 |
107
|
| SrZrO3:Eu3+ |
0.30 |
187 |
0.01 |
0.45 (ms) |
237 |
616 |
108
|
| ZnGa2O4:Cr3+ |
0.58 |
147 |
0.20 |
4.17 (ms) |
406 |
684 |
109
|
| LiGa5O8:Cr3+ |
0.76 |
22 |
0.74 |
2.50 (ms) |
406 |
684 |
109
|
| Ga2O3:Cr3+ |
0.46 |
97 |
0.35 |
1.11 (ms) |
406 |
684 |
109
|
| La2MgGeO6:Bi3+,Eu3+ |
4.09 |
110 |
1.12 |
0.33 (μs) |
333 |
402 |
110
|
| Ba2LaNbO6:Mn4+ |
2.77 |
134 |
0.25@27 °C |
0.22 (ms) |
332 |
681 |
111
|
| Ca2SiO4:Mn2+ |
4.25 |
102 |
1.55 |
16.00 (ms) |
365 |
550 |
112
|
| Mg2TiO4:Cr3+ |
0.75 |
157 |
0.41 |
1.38 (ms) |
473 |
712 |
113
|
| Bi2Ga4O9:Cr3+ |
1.60 |
450 |
0.42 |
20 (μs) |
355 |
775 |
114
|
| ScVO4:1%Bi3+ |
2.83 |
49 |
2.52 |
2.12 (μs) |
355 |
600 |
115
|
| YVO4:1%Bi3+ |
2.34 |
191 |
0.00 |
3.92 (μs) |
355 |
545 |
115
|
| Sr2V2O7:0.001Bi3+ |
2.56 |
20 |
2.13 |
3.85 (μs) |
355 |
540 |
This work |
Since the relative temperature sensitivity is continuous at a particular temperature, it yields thermometer with a continuous temperature resolution, δT, which is a crucial performance criterion in the performance of a thermometer.116 The temperature resolution or uncertainty defines the modest temperature variation that produces an obvious change in the measured parameter,117 and it is given by eqn (11).116
| |  | (11) |
δ
τ/
τ is the relative standard error in determining the lifetime,
105,118,119 and was determined to be 0.020% in our previous study.
102 The best temperature resolution (0.008 °C,
Fig. 10d) was obtained at 20 °C and became poorer with the increase in temperature up to 50 °C, and started to improve again.
4. Conclusions
Sr2V2O7 doped Bi3+ phosphors were synthesised by the modified Pechini method. The optimal emission intensity was obtained from the sample doped with 0.1 mol%Bi3+ annealed at 1000 °C. Different annealing temperatures did not cause significant changes in the structure, but the luminescence intensity varied with annealing, with the optimal emission intensity obtained from the sample annealed at 1000 °C. The luminescence intensity and quantum efficiency (QE) of this phosphor are slightly better than those of ScVO4:Bi3+. However, the value of the QE of ScVO4:Bi3+ measured herein is below the reported values of the same materials synthesised by solid-state method,36,77 suggesting that solid-state is a better synthesis method.
The phosphor particles dispersed in distilled water demonstrated high relative sensitivity around ambient temperatures. The temperature-dependent luminescence intensity of the dispersed particles showed strong quenching in the 22 to 60 °C temperature range and blue-shifted from 555 to 545 nm. The temperature-dependence of the lifetime of the dispersed particles demonstrated high relative temperature sensitivity, with a maximum value of 2.56%/°C at 20 °C and a value of 2.13%/°C at 25 °C, and corresponding temperature resolutions of 0.008 and 0.009 °C, respectively. This value is among the best values reported for lifetime-based relative temperature sensitivities in these temperature ranges with a lifetime of a few microseconds.
Author contributions
Hendrik C. Swart: funding acquisition, supervision, resources and writing – review & editing. Robin E. Kroon: supervision, resources and writing – review & editing. Lucas J. B. Erasmus: writing – review & editing. Simon N. Ogugua: writing – original draft, conceptualization, investigation, methodology and validation, visualization.
Data availability
The authors confirm that the data supporting the findings of this study are available within the article and its ESI.†
Conflicts of interest
There are no conflicts to declare.
Acknowledgements
We are grateful to the South African Research Chairs Initiative of the Department of Science and Technology and the National Research Foundation of South Africa (84415). The National Research Foundation of South Africa (Grant Number 93214, R. E. Kroon) is gratefully acknowledged for the photoluminescence measurements.
References
- W. Piotrowski, K. Trejgis, K. Maciejewska, K. Ledwa, B. Fond and L. Marciniak, ACS Appl. Mater. Interfaces, 2020, 12, 44039–44048 CrossRef CAS PubMed.
-
P. R. N. Childs, Nanoscale thermometry and temperature measurement, in Thermometry at the nanoscale: Techniques and selected applications, ed. L. D. Carlos and F. Palacio, Nanoscience & Nanotechnology Series, RSC, 2015, pp. 3–22 Search PubMed.
- D. Jaque and F. Vetrone, Nanoscale, 2012, 4, 4301 RSC.
- X. Qiu, Q. Zhou, X. Zhu, Z. Wu, W. Feng and F. Li, Nat. Commun., 2020, 11, 4 CrossRef CAS PubMed.
- M. Xu, X. Zou, Q. Su, W. Yuan, C. Cao, Q. Wang, X. Zhu, W. Feng and F. Li, Nat. Commun., 2018, 9, 2698 CrossRef PubMed.
- G. Bao, K.-L. Wong, D. Jin and P. A. Tanner, Light: Sci. Appl., 2018, 7, 96 CrossRef PubMed.
- M. Runowski, P. Woźny, S. Lis, V. Lavín and I. R. Martín, Adv. Mater. Technol., 2020, 5, 1901091 CrossRef CAS.
- A. D. Pickel, A. Teitelboim, E. M. Chan, N. J. Borys, P. J. Schuck and C. Dames, Nat. Commun., 2018, 9, 4907 CrossRef PubMed.
- S. Yakunin, B. M. Benin, Y. Shynkarenko, O. Nazarenko, M. I. Bodnarchuk, D. N. Dirin, C. Hofer, S. Cattaneo and M. V. Kovalenko, Nat. Mater., 2019, 18, 846–852 CrossRef CAS PubMed.
- X. Zhu, W. Feng, J. Chang, Y.-W. Tan, J. Li, M. Chen, Y. Sun and F. Li, Nat. Commun., 2016, 7, 10437 CrossRef CAS PubMed.
- C. D. Brites, X. Xie, M. L. Debasu, X. Qin, R. Chen, W. Huang, J. Rocha, X. Liu and L. D. Carlos, Nat. Nanotechnol., 2016, 11, 851–856 CrossRef CAS PubMed.
- P. R. N. Childs, J. R. Greenwood and C. A. Long, Rev. Sci. Instrum., 2000, 71, 2959–2978 CrossRef CAS.
- C. Abram, B. Fond and F. Beyrau, Prog. Energy Combust. Sci., 2018, 64, 93–156 CrossRef.
- K. W. Tobin, S. W. Allison, M. R. Gates, G. J. Capps, D. L. Beshears, M. Cyr and B. W. Noel, AIAA J., 1990, 28, 1485–1490 CrossRef.
- K. Okabe, N. Inada, C. Gota, Y. Harada, T. Funatsu and S. Uchiyama, Nat. Commun., 2012, 3, 705–709 CrossRef PubMed.
- R. G. Geitenbeek, J. C. Vollenbroek, H. M. H. Weijgertze, C. B. M. Tregouet, A.-E. Nieuwelink, C. L. Kennedy, B. M. Weckhuysen, D. Lohse, A. van Blaaderen, A. van den Berg, M. Odijk and A. Meijerink, Lab Chip, 2019, 19, 1236–1246 RSC.
- P. Löw, B. Kim, N. Takama and C. Bergaud, Small, 2008, 4, 908–914 CrossRef PubMed.
- J. W. Kenney and J. J. Lee, Chemosensors, 2021, 9, 109 CrossRef.
- X. Wang, O. S. Wolfbeis and R. J. Meier, Chem. Soc. Rev., 2013, 42, 7834–7869 RSC.
- S. N. Ogugua and H. C. Swart, Phys. B, 2023, 669, 415320 CrossRef CAS.
- R. Zhou, L. Lin, H. Zhao, T. Deng and J. Li, Mater. Chem. Front., 2021, 55, 6071–6081 RSC.
- D. Witkowski and D. A. Rothamer, Proc. Combust. Inst., 2019, 37, 1393–1400 CrossRef CAS.
- Y. Gao, Y. Cheng, T. Hu, Z. Ji, H. Lin, J. Xu and Y. Wang, J. Mater. Chem. C, 2018, 6, 11178–11183 RSC.
- M. Back, J. Xu, J. Ueda and S. Tanabe, J. Ceram. Soc. Jpn., 2023, 131, 57–61 CrossRef CAS.
- M. Back, J. Xu, J. Ueda, A. Benedetti and S. Tanabe, Chem. Mater., 2022, 34, 8198–8206 CrossRef CAS.
- I. E. Kolesnikov, A. A. Kalinichev, M. A. Kurochkin, E. V. Golyeva, A. S. Terentyeva, E. Yu Kolesnikov and E. Lähderanta, Sci. Rep., 2019, 9, 2043 CrossRef CAS PubMed.
- L. Marciniak and K. Trejgis, J. Mater. Chem. C, 2018, 6, 7092–7100 RSC.
- A. Ćirić, Z. Ristić, J. Periša, Ž. Antić and M. D. Dramićanin, Ceram. Int., 2021, 47, 27151–27156 CrossRef.
- B. Fond, C. Abram, M. Pougin and F. Beyrau, Opt. Mater., 2019, 89, 615–622 CrossRef CAS.
- D. E. Martin, A. O. Ojo and B. Peterson, Opt. Lett, 2022, 47, 13–16 CrossRef PubMed.
- C. Abram, I. W. Panjikkaran, S. N. Ogugua and B. Fond, Opt. Lett., 2020, 45, 3893–3896 CrossRef PubMed.
- M. Aldén, A. Omrane, M. Richter and G. Särner, Prog. Energy Combust. Sci., 2011, 37, 422–461 CrossRef.
- F. Vetrone, R. Naccache, A. Zamarrón, A. J. de la Fuente, F. Sanz-Rodríguez, L. M. Maestro, E. M. Rodriguez, D. Jaque, J. G. Solé and J. A. Capobianco, ACS Nano, 2010, 4, 3254–3258 CrossRef CAS PubMed.
- N. Xia, G. Zhu, X. Wang, Y. Dong and L. Zhang, Soft Matter, 2022, 18, 7464–7485 RSC.
- H. C. Swart and R. E. Kroon, Opt. Mater.: X, 2019, 2, 100025 CAS.
- H. Sun, Q. Gao, A. Wang, Y. Liu, X.-J. Wang and F. Liu, Opt. Mater. Express, 2020, 10, 1296–1302 CrossRef CAS.
- F. Kang, M. Peng, X. Yang, G. Dong, G. Nie, W. Liang, S. Xu and J. Qiu, J. Mater. Chem. C, 2014, 2, 6068–6076 RSC.
- J. Liu, Y. Liang, S. Yan, D. Chen, S. Miao, W. Wang and J. Bi, J. Mater. Chem. C, 2021, 9, 9692–9701 RSC.
- Y. Zhang, D. Chen, W. Wang, S. Yan, J. Liua and Y. Liang, Inorg. Chem. Front., 2020, 7, 3063–3071 RSC.
- A. Yousif, R. M. Jafer, S. Som and H. C. Swart, Appl. Surf. Sci., 2018, 433, 155–159 CrossRef CAS.
- E. Lee, J. J. Terblans and H. C. Swart, Vacuum, 2018, 157, 237–242 CrossRef CAS.
- T. Xie, L. Zhang, Y. Wang, C. He, J. Zhang, X. Wang and Z. Liu, J. Mater. Sci.: Mater. Electron., 2018, 29, 19130–19136 CrossRef CAS.
- M. H. M. Abdelrehman, R. E. Kroon, A. Yousif, H. A. A. S. Ahmed and H. C. Swart, J. Vac. Sci. Technol., B, 2019, 37, 011206 CrossRef.
- F. Kang, H. Zhang, L. Wondraczek, X. Yang, Y. Zhang, D. Y. Lei and M. Peng, Chem. Mater., 2016, 28, 2692–2703 CrossRef CAS.
- M. Anitha, P. Ramakrishnan, A. Chatterjee, G. Alexander and H. Singh, Appl. Phys. A: Mater. Sci. Process., 2002, 74, 153–162 CrossRef CAS.
- Y. Li, P. Xiong, G. Liu, M. Peng and Z. Ma, Inorg. Chem., 2021, 60, 13510–13516 CrossRef CAS PubMed.
- F. Kang, M. Peng, Q. Zhang and J. Qiu, Chem. – Eur. J., 2014, 20, 11522–11530 CrossRef CAS PubMed.
- G. Boulon, J. Phys., 1971, 32, 333 CrossRef CAS.
- H. Li, L. Li, L. Mei, W. Zhao, X. Zhou and Y. Hua, Mater. Today Chem., 2023, 32, 101661 CrossRef CAS.
- J. Huang and A. W. Sleight, Mater. Res. Bull., 1992, 27, 581–590 CrossRef CAS.
- A. Mendieta, B. Fond, P. Dragomirov and F. Beyrau, Meas. Sci. Technol., 2019, 30, 074002 CrossRef CAS.
-
A. Jain, S. P. Ong, G. Hautier, W. Chen, W. D. Richards, S. Dacek, S. Cholia, D. Gunter, D. Skinner, G. Ceder and K. A. Persson, The Materials Project: Materials Data on Sr2V2O7 by Materials Project, United States: N. p., 2019 DOI:10.17188/1194375.
- R. Schira and C. Latouche, New J. Chem., 2020, 44, 11602–11607 RSC.
- J. Fu, R. Pang, L. Jiang, Y. Jia, W. Sun, S. Zhang and C. Li, Dalton Trans., 2016, 45, 13317–13323 RSC.
- L. A. Jacob, S. Sisira, K. P. Mani, K. Thomas, D. Alexander, P. R. Biju, N. V. Unnikrishnan and C. Joseph, SN Appl. Sci., 2020, 2, 1076 CrossRef CAS.
- P. Boutinaud, Inorg. Chem., 2013, 52, 6028–6038 CrossRef CAS PubMed.
- A. Jain, S. P. Ong, G. Hautier, W. Chen, W. D. Richards, S. Dacek, S. Cholia, D. Gunter, D. Skinner, G. Ceder and K. A. Persson, APL Mater., 2013, 1, 011002 CrossRef.
-
H. Putz and K. Brandenburg, Diamond – crystal and molecular structure visualization, Kreuzherrenstr. 102, 53227 Bonn, Germany, https://www.crystalimpact.de/diamond Search PubMed.
- P. Boutinaud, Inorg. Chem., 2013, 52, 6028–6038 CrossRef CAS PubMed.
- P. Boutinaud and E. Cavalli, Chem. Phys. Lett., 2011, 503, 239–243 CrossRef CAS.
- M. Back, J. Ueda, J. Xu, K. Asami, L. Amidani, E. Trave and S. Tanabe, J. Phys. Chem. C, 2019, 123, 14677–14688 CrossRef CAS.
- K. Li and D. Xue, J. Phys. Chem. A, 2006, 110, 11332–11337 CrossRef CAS PubMed.
- R. D. Shannon, Acta Crystallogr., Sect. A: Cryst. Phys., Diffr., Theor. Gen. Crystallogr., 1976, 32, 751–767 CrossRef.
- T. Nakajima, M. Isobe, T. Tsuchiya, Y. Ueda and T. Manabe, Opt. Mater., 2010, 32, 1618–1621 CrossRef CAS.
- Y. Matsushima, T. Koide, M. Hiro-Oka, M. Shida, A. Sato, S. Sugiyama and M. Ito, J. Am. Ceram. Soc., 2015, 98, 1236–1244 CrossRef CAS.
- S. K. Gupta, K. Sudarshan and R. M. Kadam, Mater. Des., 2017, 130, 208–214 CrossRef CAS.
- W. Yang, Z. Liu, J. Chen, L. Huang, L. Zhang, H. Pan, B. Wu and Y. Lin, Sci. Rep., 2015, 5, 10460 CrossRef CAS PubMed.
- T. Nakajima, M. Isobe, T. Tsuchiya, Y. Ueda and T. Manabe, J. Phys. Chem., 2010, 114, 5160–5167 CAS.
- Z. Zhou, N. Wang, N. Zhou, Z. He, S. Liu, Y. Liu, Z. Tian, Z. Mao and H. T. Hintzen, J. Phys. D: Appl. Phys., 2013, 46, 035104 CrossRef.
- W.-Q. Yang, H.-G. Liu, M. Gao, Y. Bai, J.-T. Zhao, X.-D. Xu, B. Wua, W.-C. Zheng, G.-K. Liu and Y. Lin, Acta Mater., 2013, 61, 5096–5104 CrossRef CAS.
- L. Li, W. Wang, Y. Pan, Y. Zhu, X. Liu, H. M. Noh, B. K. Moon, B. C. Choi and J. H. Jeong, RSC Adv., 2018, 8, 1191–1202 RSC.
- Z. Gao, F. Fu, L. Niu, M. Jin and X. Wang, J. Rare Earths, 2022, 40, 1819–1826 CrossRef CAS.
- J. Han, F. Pan, M. S. Molokeev, J. Dai, M. Peng, W. Zhou and J. Wang, ACS Appl. Mater. Interfaces, 2018, 10, 13660–13668 CrossRef CAS PubMed.
- Y. Gao, P. Jiang, R. Cong and T. Yang, J. Lumin., 2022, 251, 119161 CrossRef CAS.
- T. Kang, S. Lee, T. Kim and J. Kim, Sci. Rep., 2020, 10, 1475 CrossRef CAS PubMed.
- G. A. Kumar, D.-X. Liu, Y. Tian, M. G. Brik and D. K. Sardar, Opt. Mater., 2015, 50, 199–203 CrossRef CAS.
- F. Kang, X. Yang, M. Peng, L. Wondraczek, Z. Ma, Q. Zhang and J. Qiu, J. Phys. Chem. C, 2014, 118, 7515–7522 CrossRef CAS.
- E. Cavalli, F. Angiuli, F. Mezzadri, M. Trevisani, M. Bettinelli, P. Boutinaud and M. G. Brik, J. Phys.: Condens. Matter, 2014, 26, 385503 CrossRef PubMed.
- Q. Dai, H. Song, X. Bai, G. Pan, S. Lu, T. Wang, X. Ren and H. Zhao, J. Phys. Chem. C, 2007, 111, 7586–7592 CrossRef CAS.
- N. P. Singh, N. R. Singh, Y. R. Devi, B. S. Sh, Th. D. Singh, N. R. Singh and N. M. Singh, Solid State Sci., 2020, 102, 106172 CrossRef CAS.
- N. ShantaSingh, R. S. Ningthoujam, S. D. Singh, B. Viswanadh, N. Manoj and R. K. Vatsa, J. Lumin., 2010, 130, 2452–2459 CrossRef CAS.
- N. P. Singha, N. R. Singh and N. M. Singh, Optik, 2018, 156, 365–373 CrossRef.
-
Y.-C. Lin, M. Karlsson and M. Bettinelli, Inorganic phosphor materials for lighting, in Photoluminescent materials and electroluminescent devices, ed. N. Armaroli and H. J. Bolink, Springer, Cham., 2017, pp. 309–355 Search PubMed.
- S. P. Sinha and H.-H. Schmidtke, Mol. Phys., 1965, 10, 7–11 CrossRef CAS.
- G. C. Aumuller, W. Kostler, B. C. Grabmailer and R. Frey, J. Phys. Chem. Solids, 1994, 55, 767–772 CrossRef.
- Y. A. Tanko, S. K. Ghoshal and M. R. Sahar, J. Mol. Struct., 2016, 1117, 64–68 CrossRef CAS.
- S. N. Ogugua, H. C. Swart and O. M. Ntwaeaborwa, Sens. Actuators, B, 2017, 250, 285–299 CrossRef CAS.
- S. Wang, Z. Song, Y. Kong, Z. Xia and Q. Liu, J. Lumin., 2018, 194, 461–466 CrossRef CAS.
- K. Vanheusden, W. L. Warren, C. H. Seager, D. R. Tallant, J. Caruso, M. J. Hampden-Smith and T. T. Kodas, MRS Online Proc. Libr., 1996, 424, 433–438 CrossRef.
- B. Choudhury, P. Chetri and A. Choudhury, J. Exp. Nanosci., 2015, 10, 103–114 CrossRef CAS.
- L. Liao, S. Li, Y. Jin, F. Cai and Q. Zhang, Phys. Scr., 2023, 98, 125981 CrossRef CAS.
- C. Ke, W. Zhu, J. S. Pan and Z. Yang, Curr. Appl. Phys., 2011, 11, S306–S309 CrossRef.
- H. T. Ali, U. Rehman, K. Mahmood, M. Yusuf, S. Ikram, A. Ali, N. Amin, A. Ashfaq, Y. Ali and M. A. Sajjad, J. Ovonic Res., 2021, 17, 367–372 CrossRef CAS.
- R. M. Jafer, H. C. Swart, A. Yousif, V. Kumar and E. Coetsee, J. Lumin., 2016, 180, 198–203 CrossRef CAS.
- J. Ueda, A. Meijerink, P. Dorenbos, A. J. J. Bos and S. Tanabe, Phys. Rev. B, 2017, 95, 014303 CrossRef.
- S. N. Ogugua, C. Abram, B. Fond, R. E. Kroon, F. Beyraud and H. C. Swart, Dalton Trans., 2024, 53, 4551–4563 RSC.
- S. N. Ogugua, O. M. Ntwaeaborwa and H. C. Swart, Bol. Soc. Esp. Ceram. Vidrio, 2021, 60, 147–162 CrossRef CAS.
- X. Y. Liu, H. Guo, S. Ye, M. Y. Peng and Q. Y. Zhang, J. Mater. Chem. C, 2015, 3, 5183–5191 RSC.
- T. Senden, R. J. A. van Dijk-Moes and A. Meijerink, Light: Sci. Appl., 2018, 7, 8 CrossRef PubMed.
- R. Liu, H. Wu, S. Wang, W. Yuan, S. Zhang, R. Pang, L. Jiang, D. Li, C. Li and H. Zhang, J. Mater. Chem. C, 2023, 11, 2653–2663 RSC.
- H. D. A. Santos, D. Ruiz, G. Lifante, C. Jacinto, B. H. Juarez and D. Jaque, Nanoscale, 2017, 9, 2505–2513 RSC.
- S. N. Ogugua, L. J. B. Erasmus and H. C. Swart, Mater. Res. Bull., 2023, 164, 112256 CrossRef CAS.
- L. Qiu, P. Wang, J. Mao, Z. Liao, F. Chi, Y. Chen, X. Wei and M. Yin, Inorg. Chem. Front., 2022, 9, 3187–3199 RSC.
- M. Pieprz, W. Piotrowski, P. Wózny, M. Runowski and L. Marciniak, Adv. Opt. Mater., 2024, 12, 2301316 CrossRef CAS.
- K. Maciejewska, A. Bednarkiewicz and L. Marciniak, Nanoscale Adv., 2021, 3, 4918–4925 RSC.
- S. Ren, Y. Wu, Q. Wang, B. Yang, Q. Shi, S. Li and D. Zhang, J. Lumin., 2022, 251, 119264 CrossRef CAS.
- E. Glais, M. Pellerin, V. Castaing, D. Alloyeau, N. Touati, B. Viana and C. Chanéac, RSC Adv., 2018, 8, 41767–41774 RSC.
- S. Das, S. Som, C.-Y. Yang, S. Chavhan and C.-H. Lu, Sci. Rep., 2016, 6, 25787 CrossRef CAS PubMed.
- D. Chen, Z. Wan, Y. Zhou and Z. Ji, J. Eur. Ceram. Soc., 2015, 35, 4211–4216 CrossRef CAS.
- Y. Chen, Y. Shen, L. Zhou, J. Lin, J. Fu, Q. Fang, R. Ye, Y. Shen, S. Xu, L. Lei and D. Deng, J. Lumin., 2022, 249, 118995 CrossRef CAS.
- W. Wang, Q. Li, L. Chen, Y. Wang, R. Zhong, H. Dong, Y. Qiu, Y. Hu and X. Zhang, J. Lumin., 2023, 257, 119683 CrossRef CAS.
- X. Fan, W. Zhang, F. Lü, Y. Sui, J. Wang and Z. Xu, Sensors, 2021, 12, 2788 CrossRef PubMed.
- Z. Ristić, V. Đorđević, M. Medić, S. Kuzman, M. G. Brik, Ž. Antić and M. D. Dramićanin, Opt. Mater., 2021, 120, 111468 CrossRef.
- M. Back, J. Ueda, M. G. Brik, T. Lesniewski, M. Grinberg and S. Tanabe, ACS Appl. Mater. Interfaces, 2018, 10, 41512–41524 CrossRef CAS PubMed.
-
M. Elashry, A. Rashed, L. Dalipi, U. Betke, C. Abram and B. Fond, Bismuth-doped rare-earth orthovanadates as tunable luminescence decay-time thermometers, Optica Open Preprint, 2023 DOI:10.1364/opticaopen.24470422.v1.
-
C. D. S. Brites, A. Millán and L. D. Carlos, Lanthanides in luminescent thermometry, in Handbook on the physics and chemistry of rare earths, ed. J.-C. Bünzli and V. K. Pecharsky, Elsevier, Amsterdam, 2016, vol. 49, p. 281 Search PubMed.
- M. D. Dramićanin, Methods Appl. Fluoresc., 2016, 4, 42001 CrossRef PubMed.
- N. Katumo, G. Gao, F. Laufer, B. S. Richards and I. A. Howard, Adv. Opt. Mater., 2020, 8, 2000507 CrossRef CAS.
- K. Tsuchiya, K. Sako, N. Ishiwada and T. Yokomori, Meas. Sci. Technol., 2020, 31, 065005 CrossRef CAS.
|
| This journal is © The Royal Society of Chemistry 2024 |
Click here to see how this site uses Cookies. View our privacy policy here. 
 Open Access Article
 This Open Access Article is licensed under a
  *,
Lucas J. B.
Erasmus
,
Robin E.
Kroon
*,
Lucas J. B.
Erasmus
,
Robin E.
Kroon