
 Open Access Article
 This Open Access Article is licensed under a
 Creative Commons Attribution 3.0 Unported Licence
Effects of the nature of donor substituents on the photophysical and electroluminescence properties of derivatives of perfluorobiphenyl: donor–acceptor versus donor–acceptor–donor type AIEE/TADF emitters†
Iryna
Danyliv
 a,
Yan
Danyliv
a,
Mariia
Stanitska
bc,
Oleksandr
Bezvikonnyi
bd,
Dmytro
Volyniuk
b,
Roman
Lytvyn
c,
Yuriy
Horak
c,
Vitaly
Matulis
e,
Dmitry
Lyakhov
e,
Dominik
Michels
e,
Pavlo
Stakhira
a and
Juozas Vidas
Grazulevicius
*b
a,
Yan
Danyliv
a,
Mariia
Stanitska
bc,
Oleksandr
Bezvikonnyi
bd,
Dmytro
Volyniuk
b,
Roman
Lytvyn
c,
Yuriy
Horak
c,
Vitaly
Matulis
e,
Dmitry
Lyakhov
e,
Dominik
Michels
e,
Pavlo
Stakhira
a and
Juozas Vidas
Grazulevicius
*b
aDepartment of Electronic Engineering, Lviv Polytechnic National University, Stepan Bandera 12, 79013, Lviv, Ukraine
bDepartment of Polymer Chemistry and Technology, Faculty of Chemical Technology, Kaunas University of Technology, Barsausko 59, LT-51423, Kaunas, Lithuania. E-mail: juozas.grazulevicius@ktu.lt
cDepartment of Organic Chemistry, Ivan Franko National University of Lviv, Kyryla i Mefodia St. 6, 79005 Lviv, Ukraine
dDepartment of Physics, Faculty of Mathematics and Natural Science, Kaunas University of Technology, Studentų g. 50, LT-51368, Kaunas, Lithuania
eComputer, Electrical and Mathematical Science and Engineering Division, 4700 King Abdullah University of Science and Technology, Thuwal 23955-6900, Saudi Arabia
First published on 24th January 2024
Abstract
The synthesis and properties of a group of organic electroactive compounds based on electron-deficient perfluorobiphenyl (PFBP) are described. The influence of electron-donating substituents on the properties of PFBF is analyzed. A comparative study of the derivatives with donor–acceptor versus donor–acceptor–donor molecular architectures is reported. The geometry and electronic characteristics of compounds in the ground and the excited states were studied within density functional theory. It is shown that for all the studied compounds S0 → S1 excitations are characterized by intramolecular charge transfer from electron-donating phenothiazine, phenoxazine and furoindole moieties to the electron-accepting PFBP moiety. The differences and similarities in the absorption and emission spectra of the compounds and aggregation-induced emission enhancement are explained in terms of their geometrical and electronic structures. The compounds are characterized by the relatively high values of temperature of 5% weight loss reaching 333 °C. The synthesized perfluorobiphenyl derivatives exhibit photoluminescence in the full visible spectrum covering from deep-blue to red colors. The compounds containing phenothiazine or phenoxazine fragments are characterised by the combination of thermally activated delayed fluorescence and aggregation-induced emission enhancement. The ionization potentials of the solid films of the compounds estimated by photoelectron emission spectroscopy range from 5.67 to 5.95 eV. Phenoxazine-based compounds exhibit a time-of-flight hole mobility of 8.78 × 10⁻⁵ cm2 V−1 s−1 at an electric field of 7.22 × 10⁵ V cm−1. A green organic light emitting diode based on the derivative with two phenoxazine donor units shows an external quantum efficiency of 11.5%.
1. Introduction
The technology of organic light emitting diodes (OLEDs)1 has been rapidly improving recently.2 The advantages of OLED illumination are lower time response and energy consumption, better color quality, and possibility of usage of flexible or transparent displays when compared to predecessor technologies.3 However, increasing the efficiency of these devices remains one of the major challenges. Singlet (25%) and triplet (75%) excitons are formed in the recombination zone of an OLED upon excitation by an electric field.4 The T1–S0 transition is spin-forbidden, and therefore, triplet excited states do not contribute to the luminescence of fluorescent OLEDs. This is the reason for the limit of 25% for the internal quantum efficiency (IQE) of prompt fluorescent OLEDs.5 The utilization of triplet excitons in electroluminescence is considered to be the main possibility of the increase of efficiency of OLEDs.6 While fabrication of efficient organic electrophosphorescent devices requires the use of expensive noble metal-containing complexes, the phenomenon of thermally activated delayed fluorescence (TADF) allows achieving an IQE of 100% using purely organic emitters.5 TADF is the delayed fluorescence of up-converted triplet excitons via reverse intersystem crossing (RISC), which occurs due to thermal motions of atoms.7 The energy levels of the first singlet and triplet excited states must be reasonably close for up-conversion of triplet excitons to the singlet states.7 The reduction of energy barrier between the first singlet and first triplet excited states is generally achieved by spatial separation of the highest occupied and lowest unoccupied molecular orbitals, the HOMO and LUMO, respectively.8,9 One of the design strategies for TADF materials is the development of donor–acceptor or donor–acceptor–donor structures, which can guarantee the formation of intramolecular charge transfer states.10 Restriction of intramolecular rotational and vibrational motions can lead to aggregation induced emission enhancement (AIEE).11–14 We previously reported that the derivatives of perfluorobiphenyl and 9,9-dimethyl-9,10-dihydro-acridine (DMAC) depending on the structural design exhibited sky-blue TADF, polymorphism and aggregation-induced enhancement of delayed fluorescence.15 An OLED containing perfluorobiphenyl and DMAC-based TADF emitters was characterized by a low turn-on voltage of 3 V and moderate maximum current, power, and external quantum efficiencies of 22.7 cd A−1, 30.8 lm W−1, and 15.9%, respectively.15 In addition, multifunctional compounds with perfluorobiphenyl as the acceptor and diphenylamino or carbazolyl electron-donating units were developed and used as OLED hosts and active materials of optical sensors of oxygen.15 Perfluorobiphenyl derivatives with diphenylamino or carbazolyl fragments were characterized by AIEE and TADF, also appearing blue in colour.15 The aim of the current work is to obtain perfluorobiphenyl derivatives with AIEE and TADF properties emitting in the full visible spectrum for optoelectronic applications.In this work we present a series of newly designed and synthesized compounds with the perfluorobiphenyl acceptor and one or two donors i.e., phenothiazine, phenoxazine or furoindole attached as TADF emitters exhibiting the AIEE phenomenon. Phenothiazine and phenoxazine are widely reported as donor moieties for organic compounds including TADF emitters, which are used to achieve high hole mobility, thermal stability, and appropriate aggregation characteristics.16 To the best of our knowledge, the furoindole moiety was not previously reported as an electron donating unit of TADF emitters. The synthesized perfluorobiphenyl derivatives, depending on the molecular structure, electron-donating substituents and environment, emit light in the range from deep-blue to red. Using density functional theory (DFT), the differences and similarities in the absorption and emission spectra of the compounds and aggregation-induced emission enhancement were explained in terms of their geometrical and electronic structures. One of the developed materials, a green AIEE/TADF emitter, demonstrated good performance in an OLED, showing a maximum external quantum efficiency of 11.5%. This value was achieved for the device of simple structure without outcoupling and precise optimization.
2. Results and discussion
2.1. Synthesis and theoretical calculations
Perfluorobiphenyl-based (PFBP) derivatives were synthesized via a single step catalyst-free aromatic nucleophilic substitution reaction17 between decafluorobiphenyl and phenothiazine, phenoxazine or furoindole (Scheme 1). The synthesized compounds were used to investigate the influence of electron-donating moieties on the thermal, photophysical and electrochemical properties of PFBP derivatives. Depending on stoichiometry and reaction conditions mono-substituted perfluorobiphenyl derivatives (PTZ–PFBP, PXZ–PFBP and FurInd–PFBP) and di-substituted (2PTZ–PFBP, 2PXZ–PFBP and 2FurInd–PFBP) compounds with D–A and D–A–D molecular architectures were synthesized. The 1H, 13C and 19F NMR spectroscopies, mass spectrometry and elemental analysis were used to confirm the chemical structures of the synthesized compounds.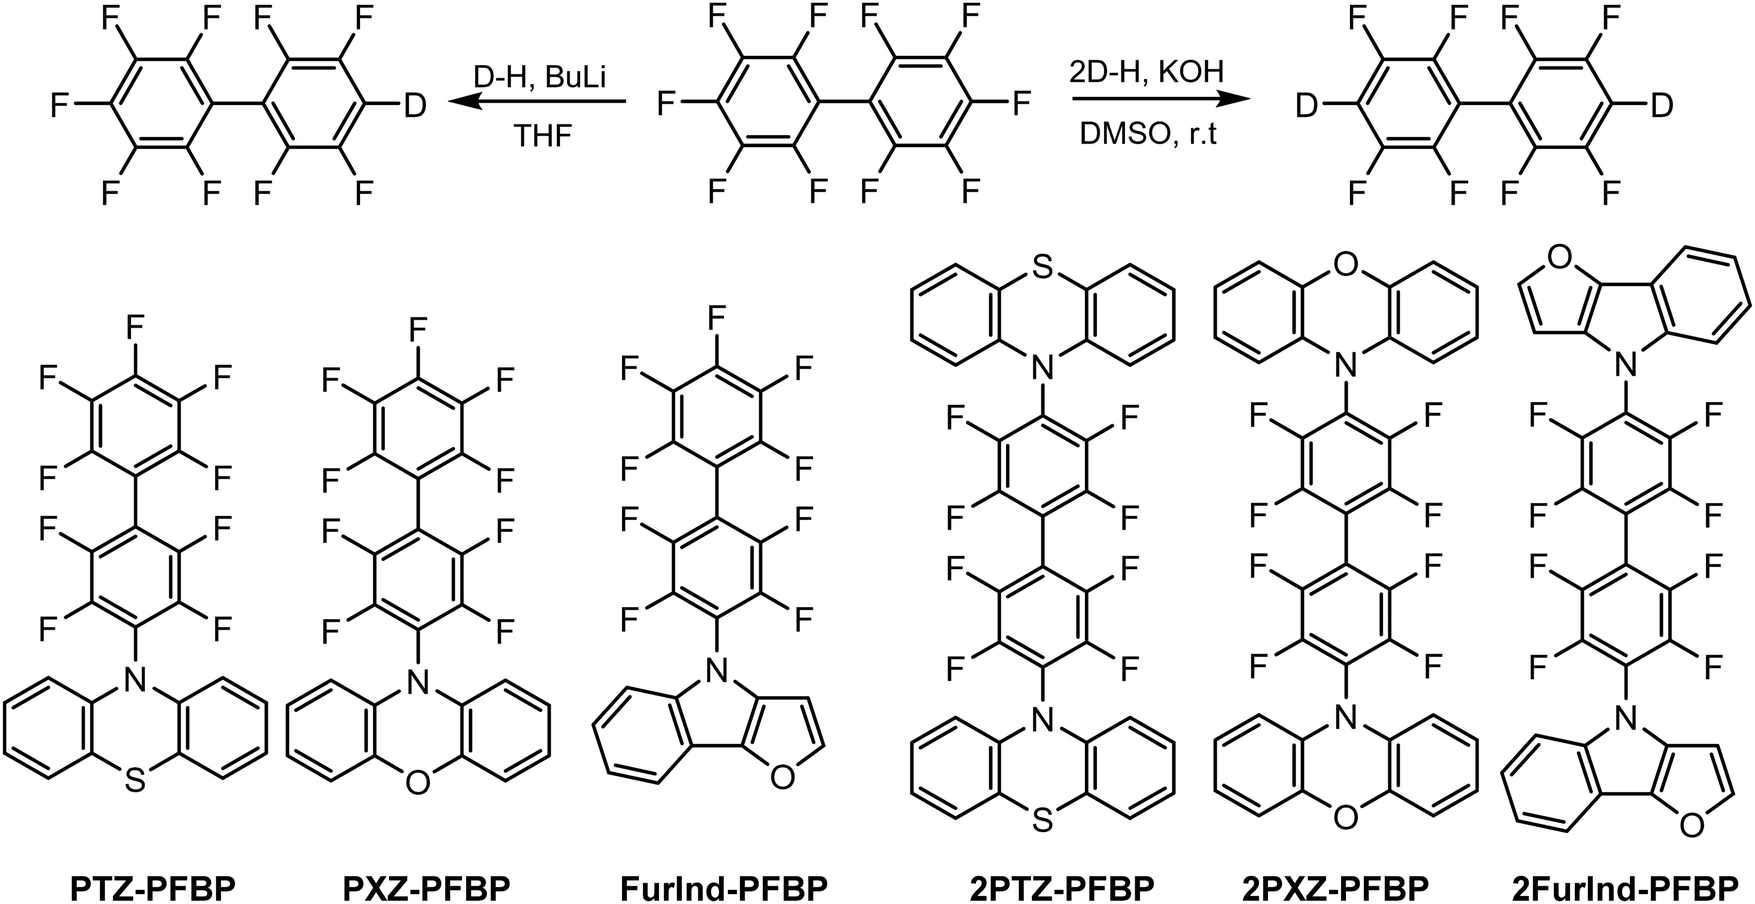 | ||
| Scheme 1 Synthetic pathways and chemical structures of the target compounds. | ||
The geometries and electronic structures of all compounds in ground and excited states were investigated within density functional theory using the M062X functional with the 6-31+G(d) basis set.18 The calculations were carried out in a solution of tetrahydrofuran (THF). Solvation effects were considered using the SMD model19 in terms of the linear response scheme.20 For the calculations of the absorption spectra, the geometries of the ground states (S0) of the compounds were fully optimized (except for the cases of quasi-axial conformers of PTZ and PXZ moieties) in solution within the DFT approach with the subsequent calculation of the spectra within TD-DFT. For the calculations of photoluminescence spectra, the geometry of the first singlet excited state (S1) was fully optimized in solution within TD-DFT. The energy gap between the singlet and triplet states (ΔES–T) was calculated as the energy difference between S1 and T1 excited states having the ground state geometry in THF. Previously we have shown that the described approach allows the accurate reproduction of the electronic structures in the ground and excited states of BODIPY dyes,21 derivatives of quinoxaline with dimethylacridine, carbazole and phenothiazine as donor moieties22 and molecular glasses based on 1,8-naphthalimide and triphenylamine moieties.23 All of the calculations were carried out using the Gaussian 16 program.24 The analysis of electron density was performed using the Multiwfn software.25
It is known that PTZ- and PXZ-containing molecules can exist as two distinct conformers: quasi-equatorial and quasi-axial (Fig. 1, this work).26–28 However, in the case of PTZ or PXZ linked with the perfluorobiphenyl moiety, the quasi-axial conformer should be destabilized due to the repulsion of the π-electrons of the donor moiety (PTZ or PXZ) from the negatively charged fluorine atoms in ortho-positions of the benzene ring (see Fig. 1). Indeed, we could not find stable structures corresponding to quasi-axial conformers for both PTZ–PFBP and PXZ–PFBP even in relatively polar media such as THF, whereas there was no problem in finding minima on the potential energy surface of the corresponding compounds in which fluorine atoms were replaced by hydrogen. It should be noted, however, that we used the continuum solvation model in this work. This model does not take into account specific interactions between the solute and the solvent. Such specific interactions can stabilize quasi-axial conformers and they may be present in solution. Therefore, to study the electronic properties of quasi-axial conformers we did the following calculations. Firstly, we fully optimized the geometry of quasi-axial forms of the corresponding structures, wherein fluorine atoms were substituted by hydrogen. Furthermore, the optimized structures were used to create the starting structures of quasi-axial PTZ–PFBP and PXZ–PFBP by inverse replacement of hydrogen atoms by fluorine. Finally, the obtained structures were subjected to constrained optimization with a fixed dihedral angle between PTZ or PZT and PFBP. The optimized structures of quasi-equatorial and quasi-axial conformers of PTZ–PFBP and PXZ–PFBP as well as their relative energies are given in Fig. 1. It can be seen from Fig. 1 that quasi-equatorial conformers are much more stable than the quasi-axial ones in the case of both PTZ–PFBP and PXZ–PFBP. Nevertheless, the difference between total energies of quasi-equatorial and quasi-axial forms is less for PTZ–PFBP. In view of the fact that the quasi-equatorial conformers of all considered compounds are more stable than the quasi-axial ones, further in the text, tables and figures, the abbreviations PTZ–PFBP and PXZ–PFBP will refer to quasi-equatorial forms until otherwise mentioned.
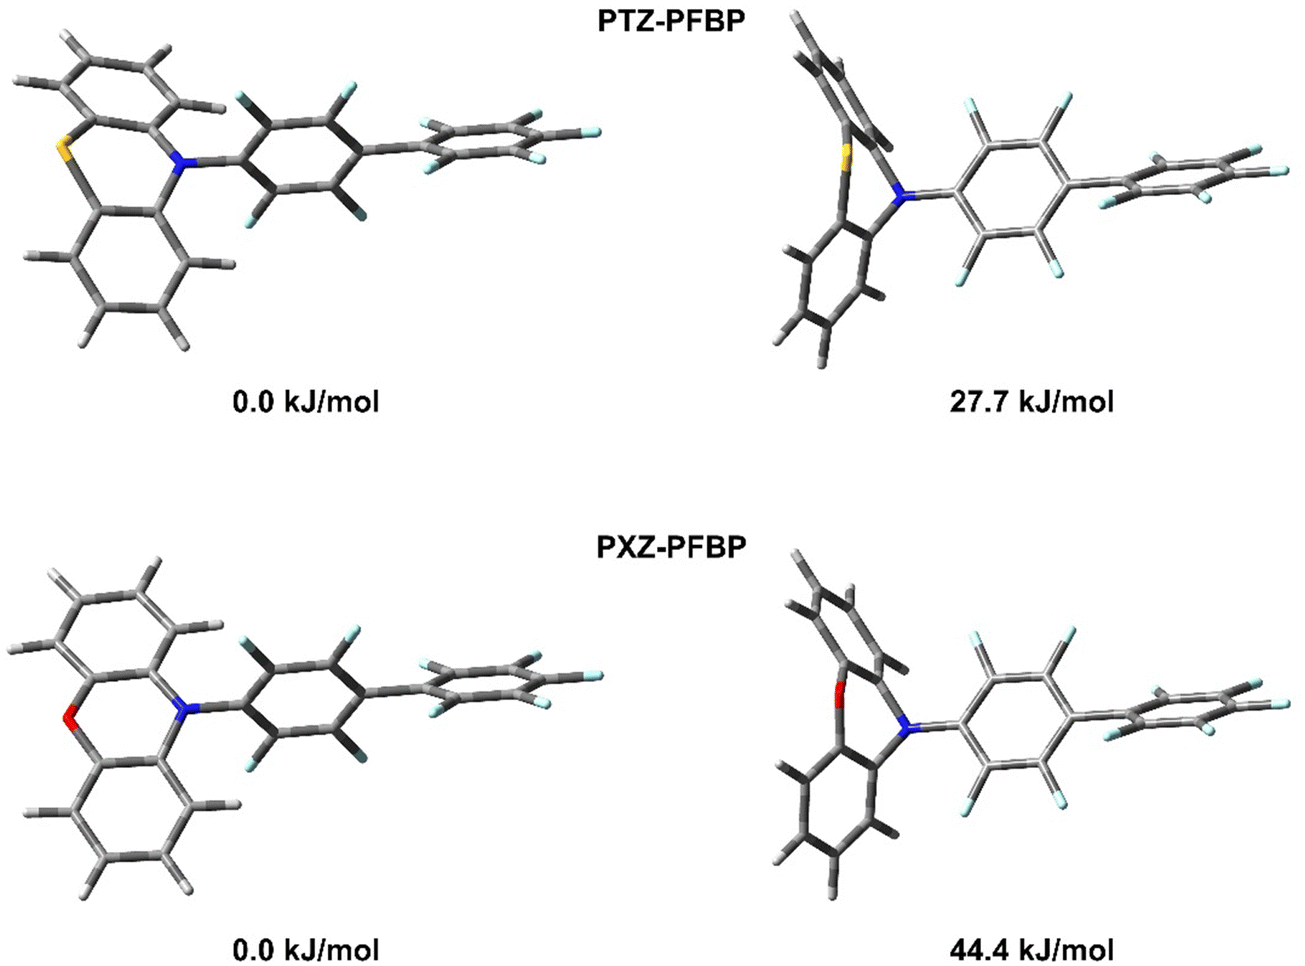 | ||
| Fig. 1 M062X/6-31+G(d) optimized geometries of quasi-equatorial (left) and quasi-axial (right) conformers of PTZ–PFBP and PXZ–PFBP in THF and their relative energies. | ||
For all the compounds, M062X/6-31+G(d) calculated wavelengths corresponding to the first absorption maxima (λABS1), wavelengths corresponding to the transition S1 → S0 in photoluminescence spectra (λPL), dihedral angles between donor (phenothiazine, phenoxazine or 8H-furo[2,3-b]indole) and acceptor (perfluorobiphenyl) moieties (α), values of the largest coefficients in the CI expansion (c), oscillator strengths (f), energy gaps between the singlet and triplet states (ΔES–T), dipole moments in the ground state (μ(S0)), dipole moment variation caused by electronic transitions (Δμ), separation degree of positive (ρ+) and negative (ρ−) parts of electron density (τ-indexes) and overlap between functions C+ and C− (S+−-indexes) are given in Table 1. The calculated absorption spectra of the compounds and shapes of natural transition orbitals (NTOs) for S0 → SN transitions are presented in Fig. 2.
| Parameter | Compound | |||||
|---|---|---|---|---|---|---|
| PTZ–PFBP | PXZ–PFBP | FurInd–PFBP | 2PTZ–PFBP | 2PXZ–PFBP | 2FurInd–PFBP | |
| λ ABS 1, nm | 318.96 | 339.77 | 296.83 | 322.00 | 346.30 | 303.12 |
| α, ° | 82.99 | 88.16 | 50.62 | 80.73 | 87.93 | 52.10 |
| c | 0.61672 HOMO → LUMO | 0.65649 HOMO → LUMO | 0.61764 HOMO → LUMO | 0.61088 HOMO → LUMO | 0.64384 HOMO → LUMO | 0.56359 HOMO → LUMO |
| f | 0.0045 | 0.0262 | 0.5084 | 0.0021 | 0.0550 | 1.0054 |
| ΔES–T, eV | 0.321 | 0.149 | 0.771 | 0.281 | 0.088 | 0.687 |
| μ(S0), Debye | 1.501 | 0.642 | 0.857 | 1.387 | 0.719 | 0.376 |
| Δμ, Debye | 16.771 | 18.779 | 15.367 | 0.063 | 0.648 | 0.025 |
| τ-Index | 0.662 | 0.749 | 0.760 | −2.563 | −1.485 | −2.187 |
| S +−-Index | 0.766 | 0.734 | 0.774 | 0.896 | 0.885 | 0.876 |
| λ PL, nm | 526.98 | 555.40 | 462.23 | 519.14 | 551.7 | 461.18 |
| f | 0.0104 | 0.0004 | 0.0004 | 0.0186 | 0.0014 | 0.0004 |
| Δμ, Debye | 17.980 | 16.939 | 18.779 | 19.175 | 18.007 | 19.850 |
| τ-Index | 0.627 | 0.472 | 0.713 | 0.335 | 0.213 | 0.467 |
| S +−-Index | 0.771 | 0.777 | 0.778 | 0.798 | 0.811 | 0.777 |
 | ||
| Fig. 2 M062X/6-31+G(d) calculated absorption spectra of compounds in THF, as well as plots of HONTO → LUNTO for S0 → S1 transitions. Plots of HONTO → LUNTO for S0 → S3 and S0 → S10 transitions of PXZ–PFBP are also given. | ||
The calculated shapes of the spectra (Fig. 2) are in excellent agreement with the experimental ones (see Fig. 1). Thus, for compounds containing PTZ and PXZ donor moieties the first absorption band has a very weak intensity, whereas the intensity of the first band in the spectra of the compound containing FurInd is high. For all the compounds the first absorption peak can be attributed to the ICT state formed between the electron-donating moiety (PTZ, PXZ or FurInd) and electron-accepting PFBP moiety (see the plots of NTOs in Fig. 2). The bands in the range of 260–280 nm are related to mostly π–π* local excitation (LE) in PTZ and PXZ moieties (see the plots of NTOs for S0 → S3 transition in Fig. 2), whereas for compounds containing FurInd substituents the second band can be attributed to moderate ICT (Fig. 2). Such a difference can be explained by a smaller dihedral angle between the donor substituent and the perfluorobiphenyl moiety in the case of FurInd-PFBP and 2FurInd-PFBP (Table 1), which leads to the overlap of π-electron densities of FurInd and PFBP in the excited state (see the plot of LUNTO for S0 → S3 transition). The third absorption band around 225 nm for all the compounds is assigned to local excitation in the perfluorobiphenyl moiety (see the plots of NTOs for S0 → S10 transition in Fig. 2). It should be noted that the calculated values of λABS are underestimated by ca. 30–60 nm compared to the experimental data (see the section “Photophysical properties”). They are in agreement with the results of earlier investigation, which allowed us to conclude that despite M062X providing accurate reproduction of the absorption spectra in terms of both intensity and the relative peak position,16,25,26 this functional in most cases underestimates the wavelengths of absorption maxima.21–23,29,30
For a more detailed study of the S0 → S1 transition, we calculated some indexes of charge transfer and collected them in Table 1. The earlier conclusion that the first absorption peak can be attributed to ICT is confirmed by the data in Table 1. Thus, the S0 → S1 excitation for D–A types of structures is accompanied by the large variation of the dipole moment (more than 15 Debye) and it is characterized by the positive and nearly the same values of the τ-indexes. It should be noted that a larger positive τ-index value means a larger separation degree of ρ+ and ρ− and therefore a larger ICT. It should be noted however that ICT properties of compound 3 differ significantly from those observed for compound 1 and 2. To explain this observation, let us consider the geometrical structures of compounds 1, 2, and 3. The calculated values of overlap between functions C+ and C− (S+−-indexes) are far from 1.0 and also very close for all the compounds of D–A type. The smallest value of the S+--index corresponds to PXZ–PFBP and the largest one to FurInd–PFBP, which means that C+ and C− functions are less separated in the case of the latter (Table 1). These results are in agreement with the values of dihedral angles (α) between donor (phenothiazine, phenoxazine or 8H-furo[2,3-b]indole) and acceptor (perfluorobiphenyl) moieties (Table 1). Thus for PXZ-PFBPα is 88.16° and for FurInd-PFBP it is 50.62°. The significant decrease in the dihedral angle between donating and accepting moieties in FurInd–PFBP almost does not change the values of Δμ, τ- and S+−-indexes compared with those of PTZ–PFBP and PXZ–PFBP. However, for compounds containing the FurInd moiety the calculated values of oscillator strength and energy gap between the singlet and triplet states differ significantly from those estimated for PTZ and PXZ containing compounds (Table 1). According to our calculations, compounds PTZ–PFBP, 2PTZ–PFBP, PXZ–PFBP and 2PXZ–PFBP are characterized by much smaller singlet–triplet energy splitting values than compounds FurInd–PFBP and 2FurInd–PFBP. These data are in agreement with the experimental results (see section “Photophysical properties”). It should be noted that the compounds of D–A–D type all have C2 symmetry in the ground state. Therefore, they are characterized by the symmetric electron density distribution in the ground and exited states. In such a case Δμ, τ- and S+--indexes cannot characterise the degree of ICT. However, the degree of charge transfer can be qualitatively evaluated based on the plots of NTOs (Fig. 2). According to the calculations the largest coefficients in the CI expansion for S0 → S1 excitation correspond to HOMO → LUMO transitions for all compounds (Table 1). M062X/6-31+G(d) calculated plots of the HOMO and the LUMO with their energies are given in Fig. 3. For all the compounds, the main contribution to the LUMO is made by the π-orbitals of the acceptor PFBP moiety. Due to the presence of identical electron-accepting fragments, all the compounds have nearly the same energy of LUMO, especially within the series of compounds of D–A and D–A–D types. The compounds of D–A–D type have slightly lower energies of LUMO in comparison to the corresponding values of the compounds of D–A type. Therefore, the former should have larger values of electron affinity (EA). These results are in agreement with the experimental data for EACV (see Table 3), which indicate that the values of EA are quite close for all the compounds and slightly larger for the compounds of D–A–D type. The calculated energies of the HOMOs of the compounds differ more significantly, due to the main contribution to the HOMO made by the π-orbitals of the donor moieties, which are different. Therefore, the values of ionization potentials (IP) should differ more significantly compared to EA values. This observation is in agreement with experimental IPCV (see Table 3). The compounds containing the FurInd moiety have the lowest values of HOMO energies and should have the largest values of IP, which are also in agreement with experimental data.
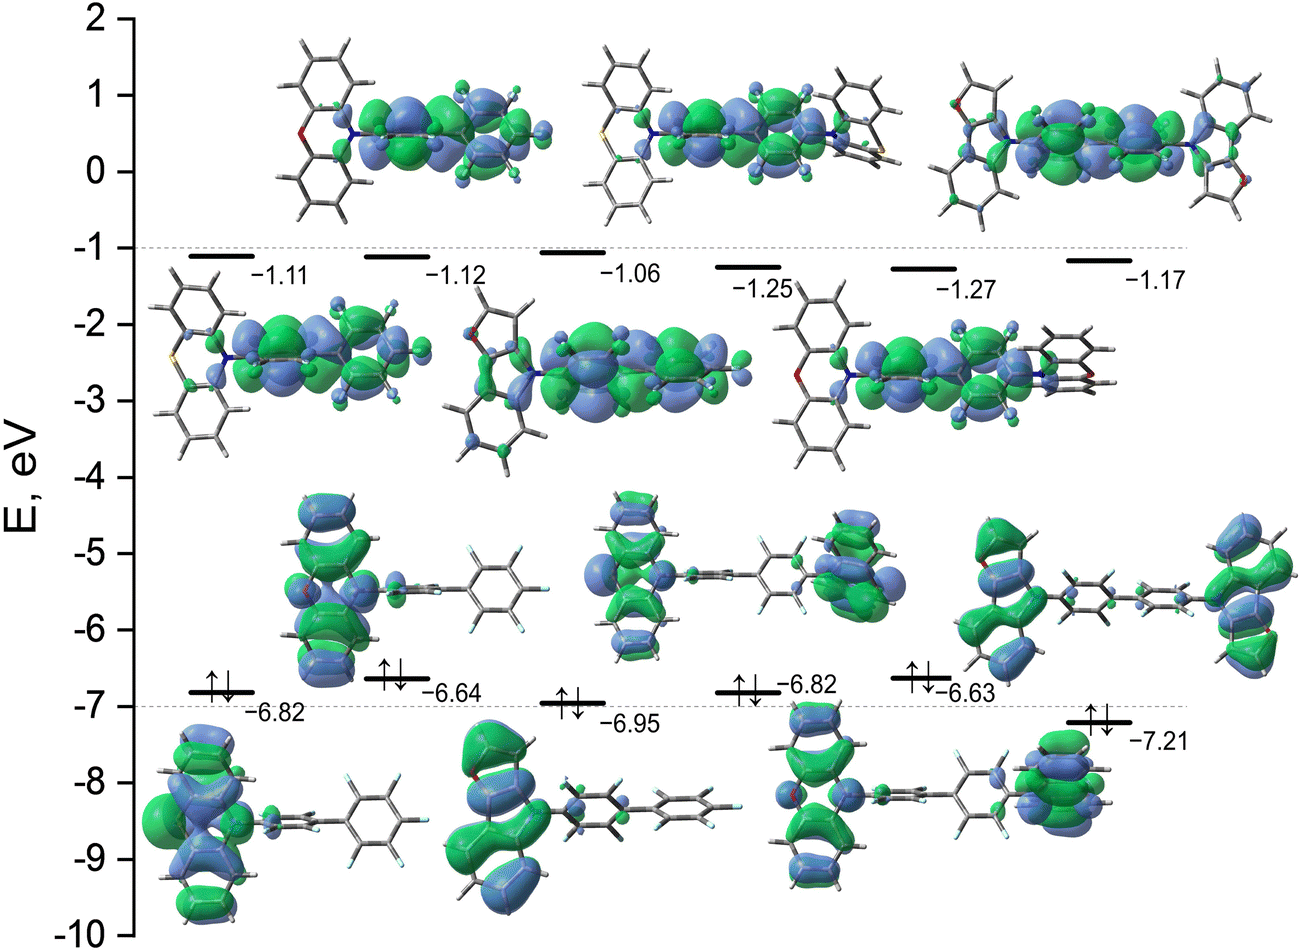 | ||
| Fig. 3 M062X/6-31+G(d) calculated energies and plots of the HOMO and LUMO in THF. | ||
It should be noted that the values of the dihedral angle between the donor and acceptor fragments together with oscillator strength (f) are the indexes defining aggregation-induced emission enhancement (AIEE).31 The AIEE compounds should exhibit ICT absorption (small f) and a close to 90° dihedral angle between donating and accepting moieties, which facilitates the spatial isolation of the HOMO and the LUMO, thus weakening the twisted intramolecular charge transfer effect and minimizing fluorescence reabsorption in the aggregated states.32 According to our calculations (Table 1), the AIEE effect should be more pronounced for compounds containing PTZ and PXZ donating moieties. This result is in agreement with the experimental data (see below).
M062X/6-31+G(d) calculated energies relative to quasi-equatorial forms (ΔE), λABS1, values of the largest coefficients in the CI expansion, oscillator strengths, energy gaps between the singlet and triplet states, μ(S0), Δμ, τ- and S+--indexes of compounds containing PTZ and PXZ moieties in the quasi-axial conformation are summarized in Table 2. The calculated plots of NTOs for the corresponding compounds are given in Fig. 4.
| Parameter | Compound | |||||
|---|---|---|---|---|---|---|
| PTZ–PFBP (q-a) | PXZ–PFBP (q-a) | 2PTZ–PFBP (q-e, q-a) | 2PXZ–PFBP (q-e, q-a) | 2PTZ–PFBP (q-a, q-a) | 2PXZ–PFBP (q-a, q-a) | |
| ΔE, kJ mol−1 | 27.7 | 44.4 | 27.9 | 44.3 | 57.8 | 90.6 |
| λ ABS 1, nm | 261.26 | 267.25 | 311.15 | 333.07 | 270.12 | 275.31 |
| c | 0.50895 HOMO → LUMO | 0.61393 HOMO → LUMO | 0.59007 HOMO → LUMO | 0.66076 HOMO → LUMO | 0.61357 HOMO → LUMO | 0.64795 HOMO → LUMO |
| f | 1.1404 | 1.1670 | 0.0019 | 0.0272 | 1.820 | 1.866 |
| ΔES–T, eV | 1.109 | 1.019 | 0.398 | 0.256 | 1.053 | 0.978 |
| μ(S0), Debye | 5.562 | 4.980 | 5.639 | 5.145 | 0.515 | 0.307 |
| Δμ, Debye | 9.169 | 8.763 | 14.621 | 19.236 | 0.257 | 0.270 |
| τ-index | 0.138 | 0.012 | −0.003 | 0.325 | −1.264 | −1.302 |
| S +−-index | 0.846 | 0.860 | 0.851 | 0.811 | 0.958 | 0.963 |
 | ||
| Fig. 4 M062X/6-31+G(d) calculated plots of NTOs for compounds containing PTZ and PXZ donating moieties in THF in quasi-axial conformation. | ||
The data in Table 2 show that for PTZ–PFBP and PXZ–PFBP containing donor moieties in quasi-axial forms S0 → S1 transition is not accompanied by such significant charge transfer, as observed for quasi-equatorial conformers. Indeed, in the case of the former, the S0 → S1 transition is characterized by much lower values of Δμ and τ-indexes and higher values of f and ΔES–T. The analysis of NTOs (Fig. 4) indicates that in contrast to the quasi-equatorial forms for quasi-axial conformers of PTZ–PFBP and PXZ–PFBP, atomic orbitals of the PFBP moiety contribute significantly to the HONTO. Therefore, S0 → S1 transition of the latter should be considered as the mixed ICT from the donor to the PFBP moiety and π–π* LE in the PFBP moiety. The calculated values of λABS1 for quasi-axial conformers of PTZ–PFBP and PXZ–PFBP are significantly lower than those for the quasi-equatorial ones (Table 2). The same picture is observed for 2PTZ–PFBP and 2PXZ–PFBP containing two donor moieties in quasi-axial forms (Table 2 and Fig. 4). However, taking into account that the latter has small dipole moments and large relative energy, their presence in solution seems unreal even in polar media. Different behaviour is observed for compounds 2PTZ–PFBP and 2PXZ–PFBP containing one of the donor moieties in the quasi-equatorial form. The S0 → S1 transition for these compounds is characterized by large Δμ and small values of f and ΔES–T. The analysis of NTOs (Fig. 4) shows that in this case S0 → S1 transition can be considered as ICT between the electron-donating moiety (PTZ or PXZ in the quasi-equatorial form) and the electron-accepting PFBP moiety. In the case of 2PTZ–PFBP, the contribution of the quasi-equatorial PTZ moiety to the LUNTO is also large, which leads to less charge transfer (small negative values of τ-index).
M062X/6-31+G(d) calculated values of wavelengths corresponding to maxima in the photoluminescence spectra (λPL) of the compounds are presented in Table 1. Although the calculated values of λPL are significantly underestimated compared to the experimental ones, the qualitative dependence of the wavelength on the nature of the donor moiety is generally in agreement with the experimental data (Table 2) with the exception of PZX-PFBP. Thus for PTZ and FurInd substituents the value of λPL changes slightly when going from D–A to D–A–D type of compounds. The compounds containing FurInd donating moieties are characterised by the smallest values of λPL. The experimentally observed dual emission for PTZ–PFBP in polar media (THF and DCM) can be explained by the presence of quasi-axial conformers, which are stabilized by polar solvents (cf. the calculated values of μ(S0) in Tables 1 and 2 for PTZ–PFBP). Unfortunately, we cannot confidently explain the very large difference between the calculated and experimental photoluminescence spectra of PXZ–PFBP. It is possible that the experimentally observed hypsochromic shift with increasing solvent polarity and the discrepancy between the calculated and experimental data are due to the fact that in polar media we observe the emission from the quasi-axial conformer. However, this assumption is in poor agreement with the high value of the relative energy of this conformer. As for compounds 2PTZ–PFBP and 2PXZ–PFBP containing both donating moieties in the quasi-axial form, due to the high relative energies and small dipole moments, they cannot exist even in polar media and contribute to PL spectra. Compounds containing one of the donating groups in the quasi-axial form have very similar spectral characteristics to those of the most stable structures of 2PTZ–PFBP and 2PXZ–PFBP, and therefore they cannot affect the observed PL spectra, even if they are present in the solution. In general, the reverse ICT from PFBP to PTZ, PXZ or FurInd moieties occurs during the emission (Fig. S1 in ESI†). The only difference in the case of absorption is that S1 electronic states of compounds of D–A–D type have distorted geometry (C1 symmetry group), which leads to asymmetrical electron density distribution. Therefore, the calculated ICT indexes for S1 → S0 transition are very close for compounds of D–A and D–A–D types (Table 1).
2.2. Thermal characterization
The thermal stability of the studied PFBP derivatives was estimated by thermogravimetric analysis (TGA) (Fig. S1a, ESI†). The results are summarized in Table 3. The moderate values of temperature of 5% weight loss (TD) were found for all compounds (215–333 °C). The derivatives with D–A–D structures (2PTZ–PFBP, 2PXZ–PFBP, and 2FurInd–PFBP) showed higher values of TD than their counterparts with D–A architecture (PTZ–PFBP, PXZ–PFBP, and FurInd–PFBP). This observation can be explained by the higher molecular weights of disubstituted perfluorobiphenyls and by the influence of the highly reactive fluorine atom at the C-10′ position of the PFBP unit in monosubstituted perfluorobiphenyls.| Compounds | λ PL , nm | Φ PL | E S , eV | E T , eV | ΔES–Tde | T D , °C | T m, °C | T g , °C | T c , °C |
|---|---|---|---|---|---|---|---|---|---|
| a Hexane solution. b Toluene solution. c DCM solution. d THF solution. e Solid state. λPL is the wavelength of photoluminescence emission maximum. ΦPL is the photoluminescence quantum yield. ES and ET are the energies of singlet and triplet energy levels, respectively. f Determined from TGA. g Determined from DSC in the second heating scan. | |||||||||
| PTZ–PFBP | 534/584/610/620/539 | <0.01/0.03 | 2.73/3.04 | 2.70/2.96 | 0.03/0.08 | 316 | 251 | 103 | — |
| 2PTZ–PFBP | 534/586/610/632/534 | <0.01/0.06 | 2.71/3.05 | 2.69/2.99 | 0.02/0.06 | 333 | 253 | — | 206 |
| PXZ–PFBP | 538/494/462/456/479 | <0.01/0.09 | 2.94/3.06 | 2.89/2.95 | 0.05/0.11 | 215 | 220 | — | 180 |
| 2PXZ–PFBP | 528/562/596/614/522 | <0.01/0.07 | 3.02/3.09 | 2.96/2.94 | 0.06/0.15 | 306 | 283 | — | 230 |
| FurInd–PFBP | 463/499/503/537/387 | 0.02/0.18 | 3.32/– | 2.77/– | 0.55/– | 223 | 228 | — | 132 |
| 2FurInd–PFBP | 429/485/510/541/432 | 0.05/0.07 | 3.21/– | 2.77/– | 0.44/– | 298 | 293 | 78 | — |
Differential scanning calorimetry (DSC) was used to investigate the morphological transitions of the synthesized compounds. All the obtained derivatives were isolated after the synthesis and purification as crystalline substances, as confirmed by DSC (Fig. S1b, ESI†). The endothermal melting signals (Tm) were observed in the first heating scans in the region of 220–293 °C (Table 3). The disubstituted perfluorobiphenyls (2PTZ–PFBP, 2PXZ–PFBP and 2FurInd–PFBP) were characterized by higher Tm values (253, 283 and 293 °C) than the monosubstituted ones (PTZ–PFBP, PXZ–PFBP and FurInd–PFBP) (251, 220 and 228 °C). This observation can be explained by the symmetrical structure of the disubstituted perfluorobiphenyls, which resulted in the close packing of the molecules.33 However, in the following cooling scans no crystallization peaks were observed for compounds PTZ–PFBP and 2FurInd–PFBP. They formed molecular glasses, with glass transition temperatures of 103 and 78 °C, respectively (Table 1). The samples of derivatives 2PTZ–PFBP, PXZ–PFBP, 2PXZ–PFBP and FurInd–PFBP crystallized upon cooling at 206, 180, 230 and 132 °C, respectively.
2.3. Photophysical properties
The absorption and photoluminescence (PL) spectra of the compounds dissolved in the solvents with different polarities and of solid films are presented in Fig. 5 and Fig. S2a (ESI†). Their photophysical data are collected in Table 3. All the derivatives were characterized by absorption bands at 240 nm mostly independent of the solvent polarity. The band is assigned to perfluorobiphenyl.34 The absorption peaks around 310 nm are related to the π–π* transitions of electron-donating moieties for phenothiazine and phenoxazine-based compounds.16 The lowest energy absorption bands of the solutions and films in the range of 318–389 nm can be attributed to the intramolecular charge-transfer (ICT). Phenothiazine and phenoxazine are strong electron donors.35,36 The lowest energy absorption bands of furoindole containing compounds FurInd–PFBP and 2FurInd–PFBP are hypsochromically shifted when compared to those of PTZ–PFBP, 2PTZ–PFBP, PXZ–PFBP and 2PXZ–PFBP.37 The number of donating moieties present in the structures of the compounds has a small impact on the absorption spectra. The low energy absorption tails observed in the spectra of the films were apparently caused by the enhancement of intramolecular interactions in the solid state.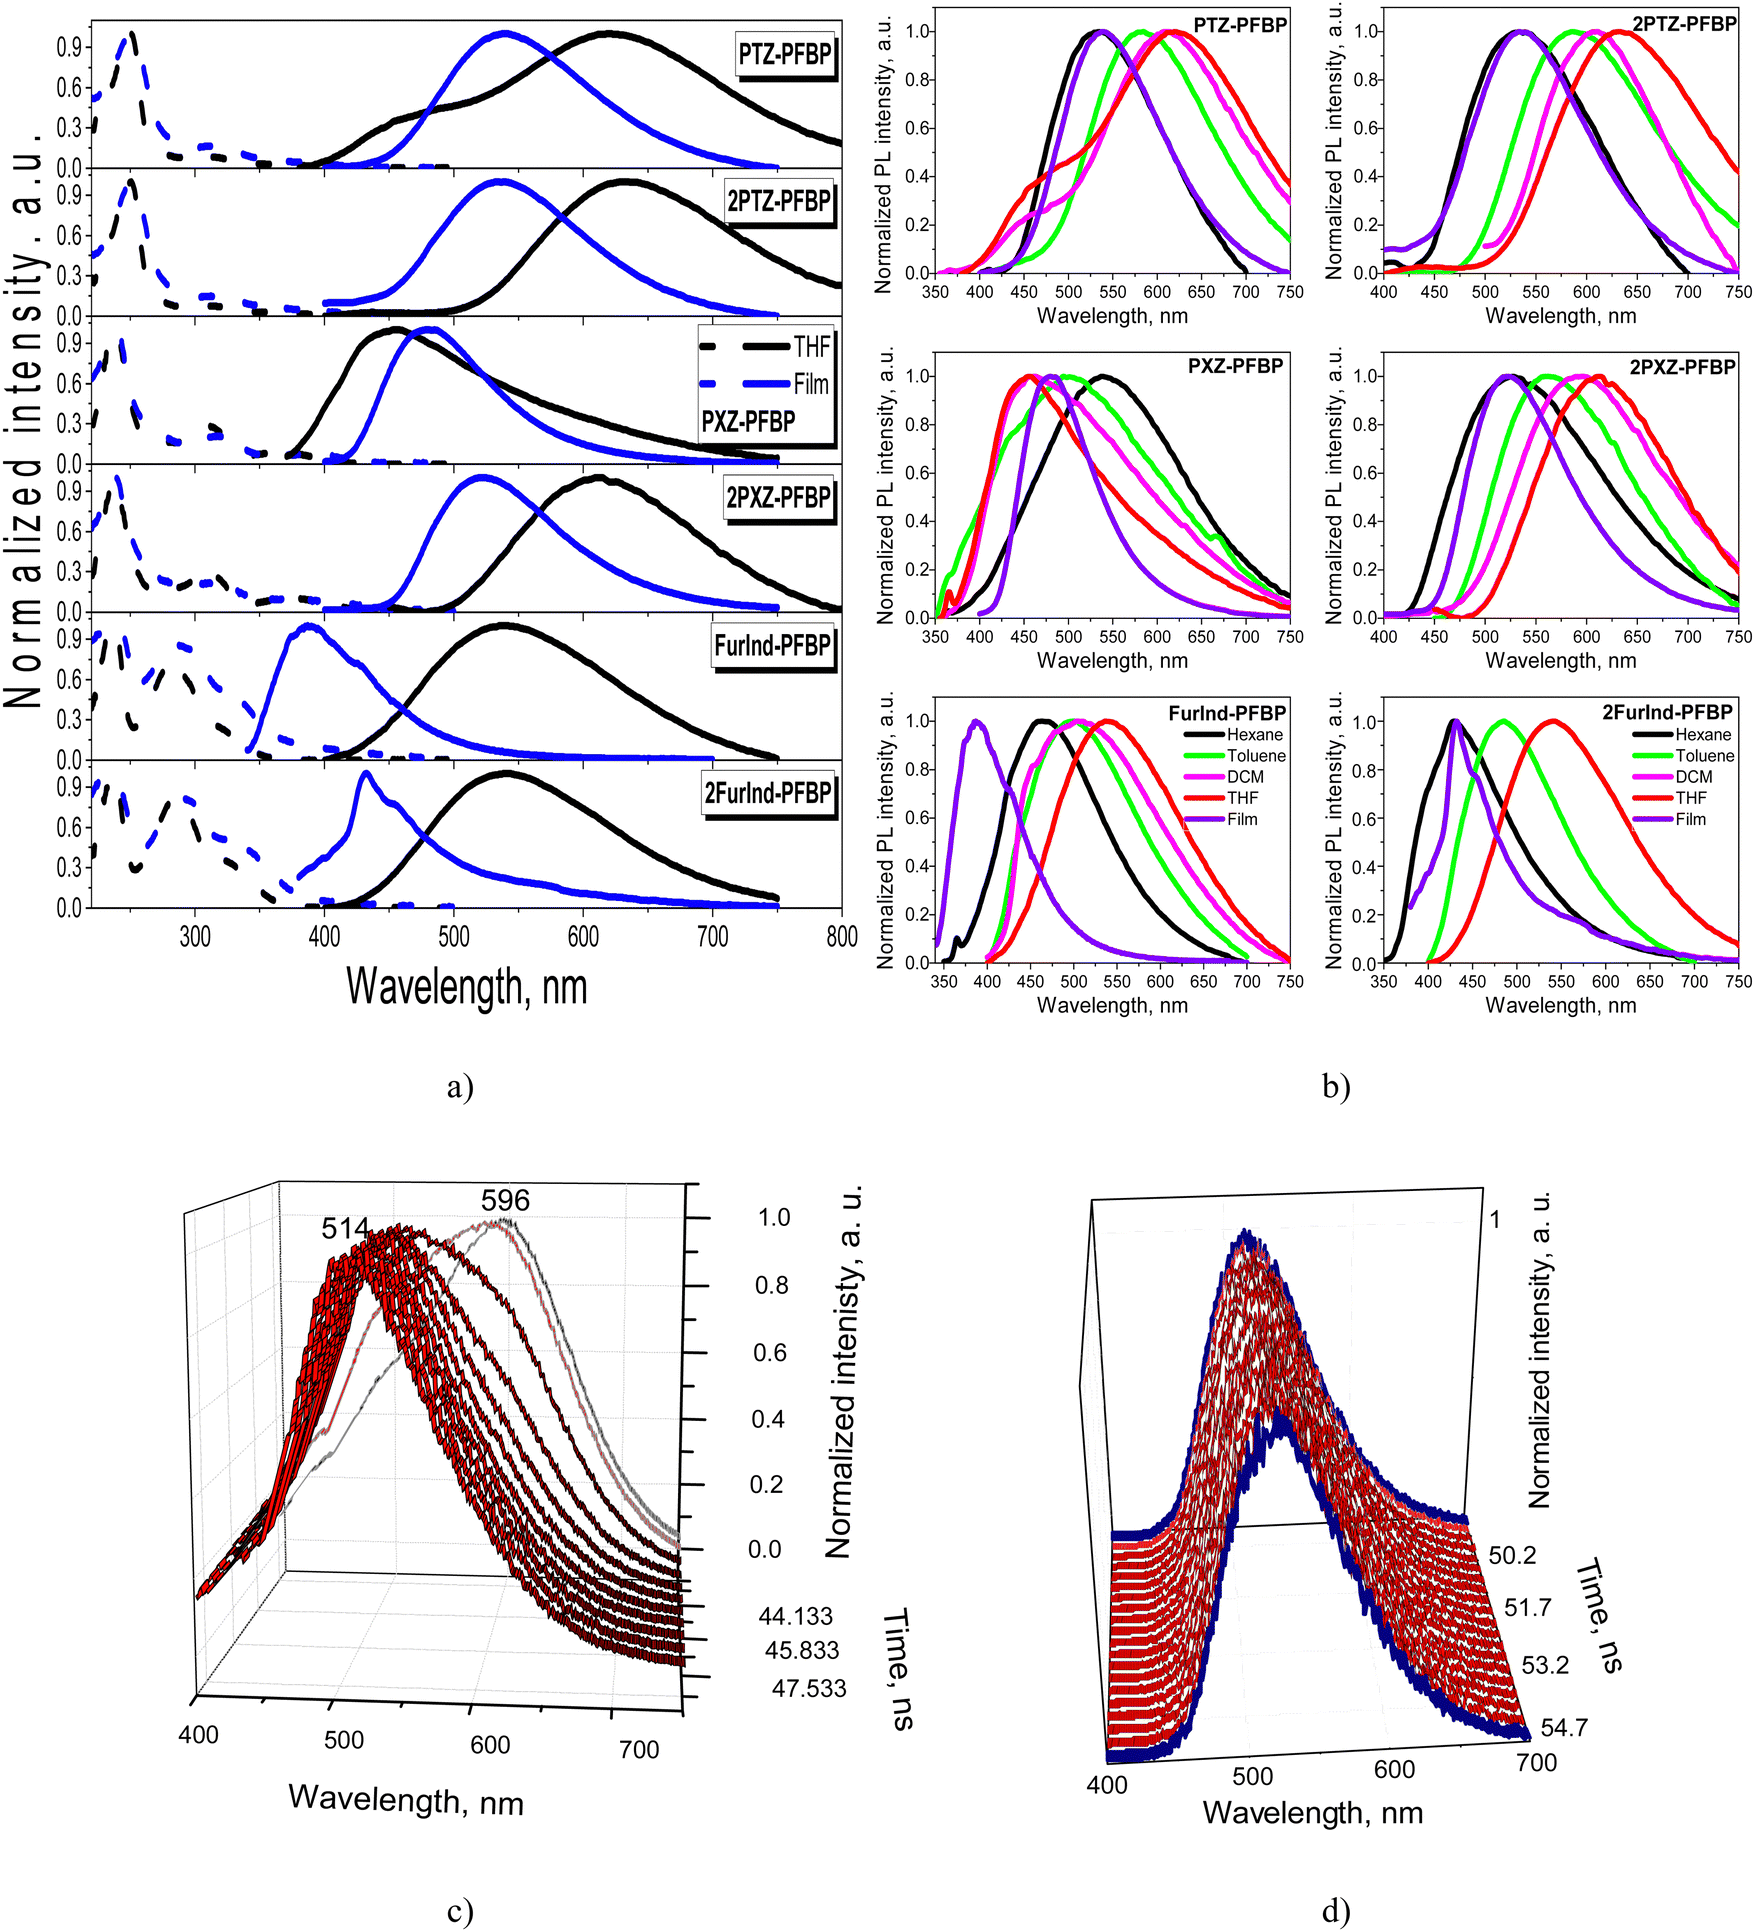 | ||
| Fig. 5 Absorption and PL spectra (a) of dilute THF solutions and solid films of PFBP derivatives and PL spectra (b) of dilute solutions and solid films of the compounds. Normalized sliced PL spectra of the THF solution (c) and neat film (d) of PTZ–PFBP recorded at different times after excitation. | ||
The dilute solutions and the solid films of almost all the studied perfluorobiphenyl derivatives are characterized by single emission bands. The dual emission of the solutions of DCM and THF was observed for the phenothiazine-containing compound PTZ–PFBP (Fig. 5a and b). As discussed above in more detail (Section 2.1 Synthesis and theoretical calculations), there is a probability for compound PTZ–PFBP to exist as two types of conformers i.e., quasi-axial and quasi-equatorial. The quasi-axial conformer is characterized by higher energy and is expected to emit light in the shorter-wavelength region in comparison to the quasi-equatorial one. Indeed, the absorption maxima were calculated to be at 318.95 nm and 261.26 nm for quasi-equatorial and quasi-axial conformers of PTZ-PFBP, respectively. This allows us to predict the appearance of emission of the quasi-axial conformer in the spectral region with shorter wavelengths relative to the emission of the quasi-equatorial conformer. Therefore, the emission band peaking at ca. 480 nm is attributed to the quasi-axial conformer of PTZ-PFBP and the band centered at ca. 620 nm is assigned to the quasi-equatorial one.26 We should note that the formation of conformers of PTZ-containing compounds was previously observed.38
To support the above statements, we recorded the time-resolved emission spectra (TRES) of the THF solution and neat film of PTZ–PFBP. The emissions of two conformers should be characterized by the different decays. Therefore, TRES measurements allow the separation of individual spectra of quasi-equatorial and quasi-axial conformers of PTZ–PFBP. The photoluminescence decay curves of the THF solution of PTZ–PFBP at various wavelengths ranging from 400 to 800 nm with a 1 nm step were recorded during the fixed period of 3 minutes (Fig. S2b, ESI†). Delayed PL spectra of PTZ–PFBP can be plotted at different times after excitation (Fig. 5c, d and Fig. S2c, ESI†). Indeed, time-resolved PL spectra of the solutions of PTZ–PFBP in THF allowed us to define emissions of two quasi-equatorial and quasi-axial conformers. In THF solutions, the high-energy conformer showed emission peaking at 514 nm, while the low-energy conformer showed emission peaking at 596 nm. Interestingly, one conformer of PTZ–PFBP was formed as its drop-cast neat film. This was confirmed by its time-resolved PL spectra at practically the same wavelengths (Fig. 5d). The small shifts of the time-resolved PL spectra of the PTZ–PFBP film are explained by the adjustment of one conformer.
A positive solvatochromic effect with the bathochromic shift of the PL intensity maxima was observed for most of the studied derivatives with the change of the solvents from non-polar hexane to polar DCM and THF. This was a manifestation of the ICT state of emission. However, the totally opposite behavior, i.e., the negative solvatochromic effect with hypsochromic shift of emission bands was observed for PXZ–PFBP (Fig. 5b). The emission maxima of compound PXZ–PFBP dissolved in THF and DCM were found to be blue-shifted with respect to that of the neat film. This observation could be explained by the higher polarity of compound PXZ-PFBP in the aggregated state compared to the dilute solution. In addition, the conformers of PXZ–PFBP exhibiting high-energy emission can be predominant in the solutions of THF and DCM in contrast to the neat films.
The experiment carried out to verify the aggregation-induced emission enhancement (discussed below) supports this statement. At low water fractions, the PL maxima of the dispersions of compound PXZ–PFBP in THF–water mixtures are slightly blue shifted, whereas upon raising water volume fractions to above 50%, the PL maxima are bathochromically shifted, which indicates that emission originates from aggregates of PXZ–PFBP whose polarity is close to that of the neat film.
The photoluminescence quantum yields (ΦPL) were found to be negligible for the solutions of the perfluorobiphenyl derivatives in toluene (<0.01–0.05) and slightly higher for the solid films (0.03–0.18). Among all the investigated luminophores, the furoindole-containing compound FurInd–PFBP demonstrated the highest ΦPL of 0.18. Therefore, the effect of AIEE was investigated by the measurement of PL intensity of the dispersions in THF/water mixtures with the different ratios of water (Fig. 6 and Fig. S3, ESI†). Almost all the studied PFBP derivatives showed AIEE. The bathochromic shift of emission maxima and the decrease of PL intensity were observed with increasing water content up to 40–50% (Fig. S3, ESI†) due to increase of solvent polarity. Meanwhile, hypsochromic shifts of PL maxima and enhancement of the fluorescence intensity were observed with the further increase of water fraction as a result of formation of molecular aggregates. The significant increase of emission intensity was observed when the water fraction reached 70–80%. This is attributed to aggregation of the molecules due to poor solubility of the PFBP derivatives in water, proving the effect of AIEE.
 | ||
| Fig. 6 PL (a) and normalized PL spectra (b) and PL intensity profiles (c) of the PTZ–PFBP and PXZ–PFBP derivatives dispersed in THF/water mixtures with different water fractions. | ||
A different behaviour was observed for compounds PTZ–PFBP and PXZ–PFBF (Fig. 6). At low water fractions, we witnessed the luminescence of two conformers of compound PTZ–PFBF. The band peaking at ca. 480 nm was attributed to the quasi-axial conformer. The band peaking at ca. 620 nm was assigned to the quasi-equatorial conformer. As demonstrated in Fig. 6c, only a quasi-equatorial conformer is AIEE-active. The PL intensity of the quasi-axial conformer was not found to be significantly dependent on the water/THF ratio. Upon raising the volume fraction of water to 70%, the emission of the quasi-equatorial conformer became overwhelmingly intensive due to the formation of aggregates. Meanwhile, the PL intensity of the quasi-axial conformer was completely suppressed. Therefore, the emission profile of PTZ–PFBF was determined by the emission of the AIEE-active quasi-equatorial conformer and only a single peak was observed. In contrast, for compound PXZ–PFBF, a hypsochromic shift of the PL maximum was observed with the increase of water content up to 50%. The further increase of water fraction resulted in the bathochromic shift of emission maxima. The obtained results are in good correlation with the results of PL measurements of the solutions in the solvents of different polarities.
To estimate the energies of the first singlet (ES) and triplet (ET) excited states and singlet–triplet energy gaps (ΔES–T) of the PFBP derivatives the PL and phosphorescence (Ph) spectra of the THF solutions and solid films at 77 K were recorded (Fig. 7a and Fig. S4, ESI†). The ES and ET values were estimated from the onsets of PL and Ph spectra appropriately and were found to be in the ranges of 2.71–3.02 eV and 2.69–2.96 eV for the THF solutions and in the ranges of 3.04–3.09 eV and 2.94–2.99 eV for the solid films, respectively (Table 3). The THF solutions of compounds PTZ–PFBP, 2PTZ–PFBP, PXZ–PFBP and 2PXZ–PFBP were characterized by negligible singlet–triplet energy splittings. The ΔES–T values were found to be 0.03, 0.02, 0.05 and 0.06 eV, respectively (Table 3). Meanwhile, for compounds FurInd–PFBP and 2FurInd–PFBP the relatively big ΔES-T values of 0.55 and 0.44 eV were found. In addition, negligible singlet–triplet energy splitting was observed for the films of compounds PTZ–PFBP, 2PTZ–PFBP, PXZ–PFBP and 2PXZ–PFBP with ΔES–T values of 0.08, 0.06, 0.11 and 0.15 eV, respectively.
 | ||
| Fig. 7 PL and Ph spectra (a) of the solutions of the derivatives of PFBP in THF recorded at 77 K; PL decay curves of the film of PTZ–PFBP recorded at room temperature (b) and at different (c) temperatures (λem = 534 nm). | ||
Taking into account the small differences between singlet and triplet excited state energies of the derivatives containing PTZ and PXZ moieties PL decay curves of the films were recorded for deeper understanding of the origin of DF (Fig. 7b and Fig. S5a, ESI†). PL decay curves of the films of the PFBP derivatives revealed the prompt and delayed fluorescence and their lifetime values were found to be in the range of 9.17–19.48 ns and 481.04–1042.10 ns respectively (Table 4).
| Compounds | τ 1, ns | τ 2, ns | χ 2 |
E
ox![[thin space (1/6-em)]](https://www.rsc.org/images/entities/char_2009.gif) vs. vs.![[thin space (1/6-em)]](https://www.rsc.org/images/entities/i_char_2009.gif) Fc
+
/Fconset Fc
+
/Fconset
|
E
redvs.Fc
+
/Fconset
|
IPCV, eV | EACV, eV | E g opt, eV | IPPE, eV | EASS, eV |
|---|---|---|---|---|---|---|---|---|---|---|
|
τ
1 and τ2 – the photoluminescence lifetimes of prompt and delayed components respectively; χ2 – weighted sum of squares of deviations extracted from the multiexponential PL decay curve fit; Eoxvs.Fc+/Fconset, Eredvs.Fc+/Fconset – onsets of oxidation and reduction potentials respectively; IPCV – the ionization potential; EACV – the electron affinity, Egopt – the optical bandgap estimated from the onsets of absorption spectra of thin films; IPPE – the ionization potentials of solid films obtained by photoelectron emission spectroscopy; and EASS – electron affinities of solid-state films estimated using the equation EASS = Egopt − IPPE. |
||||||||||
| PTZ–PFBP | 19.48 | 566.09 | 1.282 | 0.55 | −2.05 | 5.35 | 2.75 | 3.32 | 5.78 | 2.46 |
| 2PTZ–PFBP | 18.59 | 1042.10 | 1.291 | 0.52 | −2.04 | 5.32 | 2.76 | 3.32 | 5.67 | 2.35 |
| PXZ–PFBP | 9.17 | 481.04 | 1.102 | 0.58 | −2.19 | 5.38 | 2.61 | 3.45 | 5.70 | 2.25 |
| 2PXZ–PFBP | 11.51 | 633.92 | 1.112 | 0.53 | −2.03 | 5.33 | 2.77 | 3.39 | 5.77 | 2.38 |
| FurInd–PFBP | — | — | — | 0.85 | −2.17 | 5.65 | 2.63 | 3.34 | 5.95 | 2.61 |
| 2FurInd–PFBP | — | — | — | 0.82 | −2.08 | 5.62 | 2.72 | 3.22 | 5.86 | 2.64 |
For understanding the DF mechanism, the PL decay curves of the films of the compounds containing PTZ and PXZ fragments were recorded at different temperatures (from 77 to 300 K) in an inert atmosphere (Fig. 3c and Fig. S5b, ESI†). The increase of delayed components with the increase of temperature was observed for the films. This observation revealed that the TADF effect is characteristic of the studied derivatives.7 In addition, the similar shapes and locations of PL spectra recorded at different temperatures were observed for the films of the compounds (Fig. 7c inset).
2.4. Electrochemical and photoelectrical properties
Cyclic voltammetry (CV) measurements were performed to determine electronic energy levels and redox behavior of the studied compounds by applying positive and negative voltages (Fig. 8a). Also, the ionization potential (IPCV) and electron affinity (EACV) values were determined. They are collected in Table 4. All the CV measurements were done for the solutions in dry and deaerated DMF. The derivatives containing phenothiazine moieties (PTZ–PFBP and 2PTZ–PFBP) and phenoxazine fragments (PXZ–PFBP and 2PXZ–PFBP) were characterized by reversible oxidation peaks detected at 0.55, 0.52, 0.58 and 0.53 V, respectively. Meanwhile, the compounds with furoindole units (FurInd–PFBP and 2FurInd–PFBP) were characterized by irreversible oxidation. The oxidation peaks were observed at 0.85 and 0.82 V, respectively. The non-reversible reduction processes with similar shapes of CV curves were observed for all the compounds due to the presence of identical electron-accepting fragments. The reduction peaks appeared in the region of −2.03 to −2.19 V. The values of IPCV and EACV were estimated from the onset of oxidation and reduction potentials using the equations IPCV = Eoxonset + 4.8 and EACV = 4.8 + Eredonset. They are summarized in Table 3. Depending on the electron-donating units the calculated IPCV values varied from 5.32 to 5.65 eV. The EACV values were found to be quite close (2.61–2.77 eV) because of the presence the same electron-withdrawing PFBP fragment. | ||
| Fig. 8 CV curves (a) and photoelectron emission spectra (b) of PFBP derivatives. | ||
In addition, ionization potentials of the solid films (IPPE) of PFBP derivatives were measured by photoelectron emission spectroscopy of their vacuum deposited layers (Fig. 8b). The IPPE values of the compounds were found to be in the range from 5.67 to 5.95 eV (Table 4). The differences between the values of IPPE and IPCV are apparently related to the different electrostatic interactions with their environment (polarization energy vs. solvation energy).31 Based on the data obtained by photoelectron emission spectroscopy, the electron affinities (EAPE) of the solid films were calculated using optical band gaps (Eg) estimated from the onset of the absorption spectra of thin films using the equation EAPE = IPPE − Eg. The values were found to be in the range of 2.25–2.64 eV (Table 4).
2.5. Charge-transport properties
Time-of-flight (TOF) measurements were performed aiming to study the charge-transport properties of the developed compounds. Current transients for holes recorded for compounds 2PTZ–PFBP and 2PXZ–PFBP at the positive voltage on the ITO electrode and at different external voltages are plotted in Fig. 5a and b on log–log scales. The transit times (ttr) were fixed at different electric fields from the interceptions of two lines drawn for the corresponding current transients, as shown in Fig. 9a and b. In the case of PFBP derivatives with one donating unit (PTZ–PFBP, PXZ–PFBP and FurInd–PFBP) as well as in the case of compound 2FurInd–PFBP with two furoindole moieties, transit times for holes were not observed. The hole transport was apparently limited due to the low donating abilities of the donor moieties. Because of the strong dispersity, transit times for electrons were not observed either. | ||
| Fig. 9 TOF current transients for holes (a) and (b) observed for vacuum-deposited films of compounds 2PTZ–PFBP and 2PXZ–PFBP at different electric fields. Electric field dependence of hole mobilities presented according the Poole–Frenkel law (μ = μ0expβE1/239) and the corresponding fitting lines (c). | ||
Taking transit times for holes of 2PTZ–PFBP and 2PXZ–PFBP (Fig. 5a and b), their hole mobilities were estimated at different electric fields (E) using the known equation μTOF = d/ttr × E,40 where d is the thickness of the tested layers. The dependence of hole mobilities on the electric field is plotted in Fig. 5c. From the Poole–Frenkel fitting, the zero-field mobilities (μ0) of 3.93 × 10⁻⁷ and 0.58 × 10⁻⁷ cm2 V−1 s−1 and Poole–Frenkel electric field dependences (β) of 6.4 × 10⁻³ and 6 × 10⁻³ (cm V−1)0.5 were obtained for the films of compounds 2PTZ–PFBP and 2PXZ–PFBP, respectively. Relatively high β values are typically observed for compounds with very dispersive charge transport, which is also evident from the shapes of TOF current transients (Fig. 9a and b). Hole mobility values reached 8.78 × 10⁻⁵ and 8.79 × 10⁻⁶ cm2 V−1 s−1 for 2PTZ–PFBP and 2PXZ–PFBP at a high electric field of 7.22 × 10⁵ V cm−1, respectively (Fig. 5c). Thus, by ca. one magnitude higher hole mobility can be obtained for derivatives of PFBP with two donor units when phenoxazine moieties are replaced by phenothiazine units at the same positions.
2.6. Performance in OLEDs
Taking into account the obtained data for charge mobility, 2PXZ–PFBP was tested as the TADF emitter in OLEDs based on doping-free (device A) emitting layers (EML) and guest:host systems (device B). The OLEDs with optimized structures were fabricated by a thermal vacuum evaporation technique. The main plots characterizing the OLEDs are presented in Fig. 10 and Fig. S7, S8 (ESI†), and the characteristics of OLEDs are summarized in Table 5. N,N′-Di(1-naphthyl)-N,N′-diphenyl-(1,1′-biphenyl)-4,4′-diamine (NPB) and tris(4-carbazoyl-9-ylphenyl)amine (TCTA) were utilized as hole-transporting materials. The layers of 1,4,5,8,9,11-hexaaza-triphenylenehexacarbonitrile (HAT-CN) or CuI and Ca or LiF were used as hole and electron injecting layers, respectively. The layers of diphenyl[4-(triphenylsilyl)phenyl]-phosphine oxide (TSPO1) and 2,2′,2′′-(1,3,5-benzenetriyl)-tris(1-phenyl-1H-benzimidazole) (TPBi) were deposited for hole blocking and electron transport, respectively. | ||
| Fig. 10 EL spectra (a) and CIE 1931 color space coordinates (b) of OLEDs A and B. | ||
| Devices | V on, V | η c max, cd A−1 | η p max, lm W−1 | EQEmax, % | λ max EL,nm | CIE1931, (x, y) |
|---|---|---|---|---|---|---|
| V on – turn-on voltage, ηcmax – maximum current efficiency, ηpmax – maximum power efficiency, EQEmax – maximum external quantum efficiency, λmaxEL – wavelength of electroluminescence maxima, CIE1931 – Commission Internationale l’Eclairage colour coordinates. | ||||||
| A: ITO/CuI/TCTA/2PXZ–PFBP/TSPO1/TPBi/Ca/Al | 5 | 6.3 | 2.6 | 2.3 | 523 | (0.26, 0.54) |
| B: ITO/HAT-CN/NPB/2PXZ–PFBP:mCP/TSPO1/TPBi/LiF/Al | 5.4 | 32 | 28.5 | 11.5 | 511 | (0.26, 0.47) |
Electroluminescence (EL) spectra and CIE 1931 color space coordinates of OLEDs A and B are shown in Fig. 10a and b. The EL spectra of the fabricated devices (Fig. 10a) correspond to the PL spectra of the respective solid films (Fig. 10a and Fig. S2, ESI†). This points to the absence of radiative deactivation of excitons on transport layers and contributions of materials other than 2PXZ–PFBP to EL. The maxima of EL intensity were found to be at 523 and 519 nm for host-free and host-containing devices, respectively. The solid-state solvation and polarity of the host material are responsible for the slight variation of energy levels resulting in the spectral shift of the EL peak of device B compared to that of device A. The EL spectra of OLED B exhibit the emission of 2PXZ–PFBP, with only slightly increased turn-on voltage Von (Table 5). This observation confirms the complete transfer of electronic excitation energy from the host to the guest. The charge balance γ is not suppressed on recombination sites.
Utilization of mCP as a host resulted in the dramatic increase of efficiency (Fig. 5c and d) breaking the limit of EQE of 5% for OLEDs based on prompt fluorescent emitters (Table 5). OLED B exhibited a maximum EQE of 11.5%. The film of 10% wt. of solid solution of 2PXZ–PFBP in 1,3-bis(N-carbazolyl)benzene (mCP) showed the highest Φ value of 27% (Table S1, ESI†). The ηout is an out-coupling factor, the measure of the ability of the photons generated by the OLED to pass through the glass substrate and layers, and usually is up to 30%. It can be higher depending on the dipole orientation within the EML in the absence of upgraded ITO/glass substrates.41 According to the equation EQE = γ·Φ·χ·ηout, where χ stands for the fraction of excitons utilized in emission, limited by the IQE, the obtained experimental maximum EQE outperformed the expected value for OLED B and was close to the theoretical value for OLED A.41 Consequently, maximum EQEs of both devices A and B manifest the occurrence of TADF, as the efficiency would be four times lower in the case of prompt fluorescence.
3. Conclusion
New donor–acceptor and donor–acceptor–donor type derivatives of perfluorobiphenyl containing different donor moieties were synthesized, and their properties were investigated. The influence of donor nature and the number of donor units on the properties of the compounds was studied. The derivatives with donor–acceptor–donor molecular structures were characterized by higher melting points and 5% weight loss temperatures than their analogues with donor–acceptor structures. The relatively high triplet energy levels (up to 2.99 eV) were observed for the synthesized derivatives. All the investigated compounds demonstrated aggregation-induced emission enhancement. Compounds containing phenothiazine and phenoxazine moieties demonstrated E-type fluorescence. The organic light emitting diode utilizing the guest:host emitting layer of the derivative of perfluorobiphenyl with two phenoxazine moieties achieved a maximum external quantum efficiency of 11.5%.Author contributions
Conceptualization – Iryna Danyliv, Yan Danyliv, Roman Lytvyn; methodology and investigation – Iryna Danyliv, Mariia Stanitska, Oleksandr Bezvikonnyi, Dmytro Volyniuk, Roman Lytvyn, Yuriy Horak, Vitaly Matulis, Dmitry Lyakhov; validation and data curation – Dominik Michels, Pavlo Stakhira, Juozas Vidas Grazulevicius; formal analysis and writing – original draft – Iryna Danyliv, Vitaly Matulis; writing – reviewing and editing - Dmytro Volyniuk, Juozas Vidas Grazulevicius; and supervision and funding acquisition – Juozas. V. Grazulevicius.Conflicts of interest
The authors declare that there is no conflict of interest regarding the publication of this paper.Acknowledgements
This project has received funding from the Research Council of Lithuania (LMTLT), agreement No S-MIP-22-78. This work was supported by the Simons Foundation (Award Number: 1037973) and the Ministry of Education and Science of Ukraine. All Gaussian16 computations were performed on KAUST's Ibex HPC. The authors thank the KAUST Supercomputing Core Lab team for assistance with execution tasks on Skylake nodes. I. D. and P. S. thank the European Union’s Horizon 2020 Research and Innovation Programme under the Marie Skłodowska-Curie grant agreement No. 823720.References
- C. W. Tang and S. A. Vanslyke, Appl. Phys. Lett., 1987, 51, 913–915 CrossRef CAS.
- R. Young, Inf. Disp, 1975, 36, 41–45 Search PubMed.
- H. Uoyama, K. Goushi, K. Shizu, H. Nomura and C. Adachi, Nature, 2012, 492, 234–238 CrossRef CAS PubMed.
- T. Tsutsui, MRS Bull., 1997, 22, 39–45 CrossRef CAS.
- Y. Tao, K. Yuan, T. Chen, P. Xu, H. Li, R. Chen, C. Zheng, L. Zhang and W. Huang, Adv. Mater., 2014, 26, 7931–7958 CrossRef CAS PubMed.
- C. Adachi, M. A. Baldo, M. E. Thompson and S. R. Forrest, J. Appl. Phys., 2001, 90, 5048–5051 CrossRef CAS.
- H. Uoyama, K. Goushi, K. Shizu, H. Nomura and C. Adachi, Nature, 2012, 492, 234–238 CrossRef CAS PubMed.
- Y. Im, M. Kim, Y. J. Cho, J. A. Seo, K. S. Yook and J. Y. Lee, Chem. Mater., 2017, 29, 1946–1963 CrossRef CAS.
- J. Wang, Y. Yang, F. Gu, X. Zhai, C. Yao, J. Zhang, C. Jiang and X. Xi, ACS Appl. Mater. Interfaces, 2023, 15, 59643–59654 CrossRef CAS PubMed.
- Y. Liu, C. Li, Z. Ren, S. Yan and M. R. Bryce, Nat. Rev. Mater., 2018, 3, 1–20 CrossRef.
- Y. Chen, J. W. Y. Lam, R. T. K. Kwok, B. Liu and B. Z. Tang, Mater. Horizons, 2019, 6, 428–433 RSC.
- J. Wang, Y. Yang, C. Jiang, M. He, C. Yao and J. Zhang, J. Mater. Chem. C, 2022, 10, 3163–3171 RSC.
- J. Wang, Y. Yang, C. Yao, J. Zhang, P. Xu and X. Xi, J. Lumin., 2023, 259, 119829 CrossRef CAS.
- J. Wang, J. Zhang, C. Jiang, C. Yao and X. Xi, ACS Appl. Mater. Interfaces, 2021, 13, 57713–57724 CrossRef CAS PubMed.
- I. Hladka, D. Volyniuk, O. Bezvikonnyi, V. Kinzhybalo, T. J. Bednarchuk, Y. Danyliv, R. Lytvyn, A. Lazauskas and J. V. Grazulevicius, J. Mater. Chem. C, 2018, 6, 13179–13189 RSC.
- I. J. Al-Busaidi, A. Haque, N. K. Al Rasbi and M. S. Khan, Synth. Met., 2019, 257, 116189 CrossRef CAS.
- J. F. Bunnett and R. E. Zahler, Chem. Rev., 1951, 49, 273–412 CrossRef CAS.
- Y. Zhao and D. G. Truhlar, Theor. Chem. Acc., 2008, 120, 215–241 Search PubMed.
- A. V. Marenich, C. J. Cramer and D. G. Truhlar, J. Phys. Chem. B, 2009, 113, 6378–6396 CrossRef CAS PubMed.
- R. Cammi and B. Mennucci, J. Chem. Phys., 1999, 110, 9877–9886 CrossRef CAS.
- V. E. Matulis, E. G. Ragoyja and O. A. Ivashkevich, Int. J. Quantum Chem., 2020, 120, e26159 CrossRef CAS.
- R. Keruckiene, M. Guzauskas, D. Volyniuk, V. E. Matulis, D. A. Lyakhov and J. V. Grazulevicius, New J. Chem., 2022, 46, 20768–20776 RSC.
- N. Masimukku, M. Mahmoudi, D. Volyniuk, A. Dabuliene, S. Macionis, V. Matulis, D. Lyakhov and J. V. Grazulevicius, Spectrochim. Acta. A. Mol. Biomol. Spectrosc., 2023, 288, 122185 CrossRef CAS PubMed.
- Gaussian 16 Rev. C.01/C.02 Release Notes, Gaussian.com, https://gaussian.com/relnotes/, (accessed 8 December 2023) Search PubMed.
- T. Lu and F. Chen, J. Comput. Chem., 2012, 33, 580–592 CrossRef CAS PubMed.
- G. Sych, R. Pashazadeh, Y. Danyliv, O. Bezvikonnyi, D. Volyniuk, A. Lazauskas and J. V. Grazulevicius, Chem. – A Eur. J., 2021, 27, 2826–2836 CrossRef CAS PubMed.
- M. Okazaki, Y. Takeda, P. Data, P. Pander, H. Higginbotham, A. P. Monkman and S. Minakata, Chem. Sci., 2017, 8, 2677–2686 RSC.
- Z. Cheng, J. Liang, Z. Li, T. Yang, C. Lin, X. Mu and Y. Wang, J. Mater. Chem. C, 2019, 7, 14255–14263 RSC.
- M. Isegawa, R. Peverati and D. G. Truhlar, J. Chem. Phys., 2012, 137, 244104 CrossRef PubMed.
- Z. Zara, J. Iqbal, K. Ayub, M. Irfan, A. Mahmood, R. A. Khera and B. Eliasson, J. Mol. Struct., 2017, 1149, 282–298 CrossRef CAS.
- J. Sworakowski, Synth. Met., 2018, 235, 125–130 CrossRef CAS.
- J. Wang, X. Zhai, C. Ji, M. Zhang, C. Yao, G. Xie, J. Zhang and X. Xi, Dye. Pigment., 2023, 219, 111586 CrossRef CAS.
- R. J. C. Brown and R. F. C. Brown, J. Chem. Educ., 2000, 77, 724–731 CrossRef CAS.
- H. M. Rosenberg and S. D. Carson, J. Phys. Chem., 1968, 72, 3531–3534 CrossRef CAS.
- F. Khan and R. Misra, J. Mater. Chem. C, 2023, 11, 2786–2825 RSC.
- T. Bianconi, A. Cesaretti, P. Mancini, N. Montegiove, E. Calzoni, A. Ekbote, R. Misra and B. Carlotti, J. Phys. Chem. B, 2023, 127, 1385–1398 CrossRef CAS PubMed.
- H. Do Hoang, J. Janke, A. Amirjanyan, T. Ghochikyan, A. Flader, A. Villinger, P. Ehlers, S. Lochbrunner, A. E. Surkus and P. Langer, Org. Biomol. Chem., 2018, 16, 6543–6551 RSC.
- M. Okazaki, Y. Takeda, P. Data, P. Pander, H. Higginbotham, A. P. Monkman and S. Minakata, Chem. Sci., 2017, 8, 2677–2686 RSC.
- G. A. N. Connelld, D. L. Camphausen and W. Paul, Philos. Mag., 1972, 26, 541–551 CrossRef.
- K. Yang, Y. Wang, A. Jain, L. Samulson and J. Kumar, J. Macromol. Sci. Part A, 2007, 44, 1261–1264 CrossRef CAS.
- M. Kovačič, Opto-Electronics Rev., 2022, 30, e141542 Search PubMed.
Footnote |
| † Electronic supplementary information (ESI) available. See DOI: https://doi.org/10.1039/d3tc04633h |
| This journal is © The Royal Society of Chemistry 2024 |