 Open Access Article
Self-assembled D–π–A multifunctional systems with tunable stimuli-responsive emission and optical waveguiding behaviour†
R.
Martín‡
ab,
A.
Sánchez-Oliva‡
b,
A.
Benito
a,
I.
Torres-Moya
bc,
A. M.
Garcia
 b,
J.
Álvarez-Conde
d,
J.
Cabanillas-González
 *d,
P.
Prieto
 *b and
B.
Gómez-Lor
 *a
*a
aInstitute of Materials Science of Madrid (ICMM-CSIC), Sor Juana Inés de la Cruz 3, Cantoblanco 28049, Madrid, Spain. E-mail: bgl@icmm.csic.es
bFaculty of Chemical Science and Technology, University of Castilla-La Mancha, Instituto Regional de Investigación Científica Aplicada (IRICA), University of Castilla-La Mancha, 13071 Ciudad Real, Spain. E-mail: Mariapilar.Prieto@uclm.es
cDepartment of Organic Chemistry, Faculty of Chemical Sciences, Campus of Espinardo, University of Murcia, 30100 Murcia, Spain
dMadrid Institute for Advanced Studies, IMDEA Nanociencia, Calle Faraday 9, Cantoblanco, 28049, Madrid, Spain. E-mail: juan.cabanillas@imdea.org
First published on 16th January 2024
Abstract
Smart materials with stimuli-responsiveness are a subject of great attention nowadays. In this work, we describe two D–π–A naphthalenimide (NI) derivatives, with different N-functionalization prepared by an environmentally benign process. They self-assemble into fluorescent crystals that display optical waveguiding behaviour with low optical loss coefficients. In addition, they present thermal/mechanical stimuli-responsiveness, which is tuned upon substitution at the molecular main core as a result of changes in crystal packing. A cold-crystallization process, as confirmed by DSC and power X-ray analysis, was identified as the underlying cause of the colour change upon heating, which can be reverted due to an amorphization process upon shearing. The combination of the reversible coloured amorphous-crystalline phase transition, together with the light guiding, holds significant promise for practical applications including use in security inks, rewritable materials or modern optics.
Introduction
Optoelectronic devices play an essential role in modern technology, enabling a wide range of applications in various fields. In this technology, light confinement and light in- or out-coupling is important for the development of lasers, optical amplifiers or photodetectors.1,2Organic crystals possess interesting features for optoelectronic applications in comparison with their inorganic counterparts.3 They are lighter, present different morphologies and very importantly, their properties can be tuned at the molecular level thanks to the opportunities offered by organic synthesis.4 Focusing on their emissive properties, some organic crystals combine high fluorescence quantum yields with notable light waveguiding properties, arising from low optical losses and refractive indexes in the 1.8–2.2 range, and a good photoluminescence efficiency. Up to now, a great number of organic crystals with excellent performance as optical waveguiding materials have been reported,5–7 although recently, additional features have been put into play. This implies the development of more complex materials as doped structures,8 core/shell structures9 or heterostructures,10 and the incorporation of features such as flexibility,11–13 anisotropy,14 chiral elements15 or stimuli-responsiveness.16,17
The combination in a single material of optical waveguiding properties and stimuli-responsiveness arouses much interest due to the potential applications in the optoelectronics and sensors fields. In this sense, Yawen et al. described five cyano-functionalized 1,4-bis((E)-2-(1H-indol-3-yl)vinyl)benzene derivatives, substituted with alkyl chains of variable length. Interestingly, while compounds with short side chains displayed optical waveguiding properties, those with long ones showed thermochromism.18 In another example, Jia and coworkers reported a single organic crystal of a derivative that connects a pyrene unit and a rhodamine B moiety through a CN group. This crystal possessed multiple properties including optical waveguiding and mechanochromism.19
The use of physical stimulation, such as pressure or temperature, to induce changes in the absorption or emission spectra20,21 arouses much interest to develop tuneable optoelectronic devices. These types of switchable material are attractive candidates in fields as varied as sensors,22 recording technologies,23 security inks24 or rewritable paper.25 The extent of the colour changes can vary, ranging from subtle changes to complete colour loss/gain in response to stimuli-induced modifications on molecular conformation, intermolecular interactions, and crystal packing.26–30 A combination of both types of stimulation, i.e., preparation of organic crystals able to offer a response to both mechanical and thermal stimuli in different directions, is even more interesting in the quest for multi-responsive, smart materials.31,32
Although in the last few years impressive advances have been achieved in the development of crystalline organic waveguides and stimuli responsive materials, more detailed studies are required to advance the ad hoc design of smart materials with desired functions, whereby optical properties and response to stimuli are rationalized from the chemical structure of the molecules. Bearing this in mind, we here report a study of two D–π–A systems featuring a triphenylamine derivative joined to two differently substituted 1,8-naphthalimide (NI) acceptors via an ethynyl bridge. Both derivatives lead to the formation of multifunctional structures that exhibit thermochromism, mechanochromism and optical waveguide behaviour. The response to various stimuli depends on the specific substitution of the NI core present in the molecules. Additionally, XRD analysis aids to establish a correlation between the observed structural features and the mechanochromic and waveguiding behaviour.
Experimental
Synthesis of NI derivatives
1H-NMR (CDCl3, 500 MHz) (δ, ppm): 8.73 (d, J = 7.9 Hz, 1H, HNI), 8.71 (d, 1H, J = 7.8 Hz, HNI), 8.49 (d, 1H, J = 7.9 Hz, HNI), 8.14 (d, 1H, J = 7.9 Hz, HNI), 8.00 (s, 1H, Hp-phenyl), 7.93 (t, 1H, J = 7.9 Hz, HNI), 7.83 (s, 2H, Ho-phenyl).
1H-NMR (CDCl3, 500 MHz) (δ, ppm): 8.67 (d, J = 7.8 Hz, 1H, HNI), 8.58 (d, 1H, J = 7.8 Hz, HNI), 8.42 (d, 1H, J = 7.8 Hz, HNI), 8.05 (d, 1H, J = 7.8 Hz, HNI), 7.85 (t, 1H, J = 7.8 Hz, HNI), 4.16 (t, 2H, J = 6.6 Hz, N–CH2–), 1.73 (m, 2H, –CH2–), 1.40 (m, 2H, –CH2–), 1.35 (m, 2H, –CH2–), 1.29 (m, 6H, –CH2–), 0.87 (t, 3H, –CH3).
M.p.: 239–240 °C. 1H-NMR (CDCl3, 500 MHz) (δ, ppm): 8.88 (d, J = 8.4 Hz, 1H, HNI), 8.73 (d, 1H, J = 8.4 Hz, HNI), 8.64 (d, 1H, J = 8.4 Hz, HNI), 8.02 (s, 1H, p-Ph-CF3), 7.99 (d, 1H, J = 8.4 Hz, HNI), 7.92 (t, 1H, J = 8.4 Hz, HNI), 7.86 (s, 2H, o-Ph-CF3), 7.54 (d, 2H, J = 8.8 Hz, m-N-PhC-≡), 7.35 (t, 4H, m-N-Ph), 7.19 (d, 2H, J = 8.8 Hz o-N-PhC-≡), 7.18 (d, 4H, J = 8.8 Hz, o-N-Ph), 7.13 (t, 2H, J = 8.8 Hz, p-N-Ph). 13C-NMR (δ, ppm): 164.1, 163.8, 148.9, 147.1, 143.0, 136.9, 135.8, 132.8, 132.6, 132.0, 131.1, 129.9, 129.5, 128.2, 126.8, 125.1, 124.0, 123.5, 120.8, 120.2, 100.0. MS (MALDI TOF/TOF, m/z) 676.463, required for C40H22F6N2O2, 676.159.
Crystallization of NI derivatives
NI1 and NI2 crystals were obtained employing the slow diffusion technique. Briefly, a vial with 1 mL of a 1 mg/mL solution in THF of the corresponding NI derivative was introduced into a bigger vial, containing 3 mL of the poor solvent, hexane and methanol for NI1 and NI2, respectively. The whole system was closed, and crystals appeared after a period of 1–2 weeks.Results and discussion
Design, synthesis and characterization of the molecules
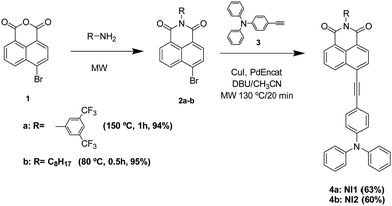
The NI core was selected in view of its acceptor character and its easy chemical modulation to build D–π–A conjugated systems, as well as for its ability to form fluorescent supramolecular aggregates.35–37 On the other hand, the triphenylamine group is a good donor that favours red-shifting and contributes to a good packing,38 while the triple bond enables the formation of good crystal structures thanks to the existence of CH–π interactions.39 The N-substitution of the naphthalimide group with either a diCF3-phenyl group (NI1) or an alkyl chain (NI2) has a profound impact on self-assembly and packing, and therefore on the properties of the supramolecular materials obtained.The synthesis of compound NI2 has been previously reported by some of the authors,34 while compound NI1 was synthesized for the first time in this work, following a similar procedure that involves a two-step process according to the principles of sustainable chemistry.40,41 First, the imide was formed using 4-bromo-1,8-naphthalic anhydride and the corresponding amine followed by a Sonogashira coupling reaction with the alkynyl donor fragment.34 Microwave radiation was used as the energy source, which results in a significant decrease in reaction time and a large increase in yield, and it is carried out with a minimum amount of solvent and using a reusable catalyst (Pd-Encat TPP30) (Scheme 1, see ESI,† Section S2 for NMR and MS details).
Spectroscopic measurements (UV-vis, fluorescence)
The absorption and photoluminescence (PL) spectra of NI derivatives in solution were recorded in CHCl3 at a concentration of 10−5 M upon photoexciting the samples at the absorption maxima of the lowest energy band. The most relevant data are summarized in Fig. 1 and Table 1.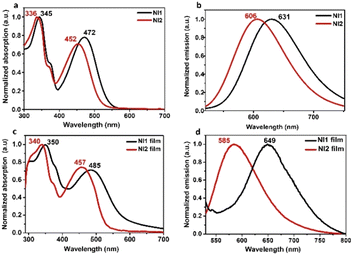 | ||
| Fig. 1 Absorption and emission spectra of the NI compound solution (CHCl3, 1 × 10⁻⁵ M) (a) and (b) and in thin films (c) and (d). | ||
| Compound | Solution | Films | ||||
|---|---|---|---|---|---|---|
| λ abs (nm) |
ε (M−1 cm−1) × 104![[thin space (1/6-em)]](https://www.rsc.org/images/entities/char_2009.gif) b b |
λ em (nm) | ϕ | λ abs (nm) | λ em (nm) | |
| a Maximum absorption wavelengths measured in 10−5 M CHCl3 solution. b ε stands for molar extinction coefficient at the first and second λabs values, respectively. c Maximum emission wavelength measured in 10−5 M CHCl3 solution (λexc (NI1) = 472 nm and λexc (NI2) = 452 nm). d PL quantum yield measured in CHCl3 using cresyl violet in ethanol (Φ = 0.56) for NI1 and quinine sulphate in 0.1 M H2SO4 (Φ = 0.54) and fluorescein in 0.1 M NaOH (Φ = 0.79) for NI2. e Maximum absorption wavelengths measured in the film. f Maximum emission wavelengths measured in the film (λexc (NI1) = 485 nm and λexc (NI2) = 457 nm). | ||||||
| NI1 | 345/472 | 3.3/2.7 | 631 | 0.95 | 350/485 | 649 |
| NI2 | 336/452 | 3.1/2.4 | 606 | 0.94 | 340/457 | 585 |
The absorption spectra of both NI derivatives in CHCl3 are similar except for a slight redshift of NI1 with respect to NI2. They are characterized by a band centred at 330–350 nm, which corresponds to a π–π* transition, and another band at longer wavelength (lower energy) that it is indicative of an ICT process from the triphenylamine donor to the NI acceptor core. The presence of two –CF3 groups in the NI1 groups enhances the electron scavenging nature of the NI core, increases the ICT character of this derivative and gives rise to a bathochromic shift (Fig. 1a). A similar trend can be observed in the fluorescence spectra in solution, with the maximum emission wavelength of NI1 red-shifted compared to NI2 (631 vs. 606 nm) (Fig. 1b), when excited at the ICT band (note that excitation at the π–π* energy band does not produce changes in the emission wavelengths, see Fig. S9, ESI†). Remarkably, both compounds exhibited highly emissive properties in solution, with fluorescence quantum yields of 0.94 and 0.95 for NI1 and NI2, respectively (Table 1).
The absorption spectra of the two compounds in the film resemble those in solution (Fig. 1c), but important differences emerge from the fluorescence spectra (Fig. 1d). Whereas the introduction of –CF3 groups at the NI core (NI1) leads to a slight bathochromic shift in the solid state with respect to solution (649 vs. 631 nm) ascribed to a change in the dielectric medium, the emission spectra of NI2 films are significantly blue shifted compared to solution (585 vs. 606 nm). These differences in solid state fluorescence denote a likely change in crystal packing modulated by the side substituents, as will be demonstrated (vide infra). Curiously, when comparing the fluorescence spectra of solutions and films, NI1 shows a notable redshift, indicating a strong electronic coupling of the constituent molecular units. Conversely, the emission spectra of NI2 films are blue shifted when compared to its solution state. Probably, in this particular case, the steric hindrance introduced by the flexible alkyl chains impedes the emergence of close π-interactions between molecules in the solid state, which would favour the electronic delocalization.
Optical waveguide properties of NI crystals
Crystals from the reported D–π–A 1,8-naphthalimides were obtained using the slow diffusion technique (see Experimental).NI1 showed needle-like crystals between 0.5-1 mm length, appropriate for the study of the optical waveguiding behaviour, when THF is used as a good solvent and hexane as a poor solvent (Fig. S6, ESI†). On the other hand, NI2 formed rectangular slabs appropriate for optical waveguiding studies in THF as a good solvent and methanol as a poor solvent, although they are slightly smaller than the ones for NI1 (Fig. S7, ESI†).
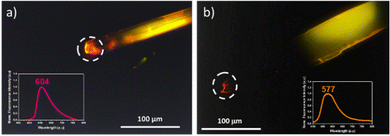
PL microscopy images and spectra were recorded for crystals of NI derivatives to qualitatively evaluate their optical waveguiding behaviour (Fig. 2). Both microscopy images depict bright orange fluorescence from crystals of both NI compounds upon photoexcitation at 355 nm as well as emission from the tips, although slightly weaker than from the bulk, evidencing active optical waveguiding capability.
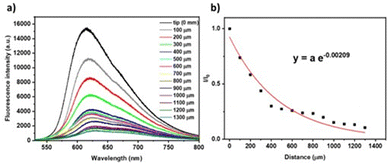
In addition, in order to evaluate the efficiency of the optical waveguides obtained from NI crystals, the optical loss coefficients were measured upon moving the photoexcitation (355 nm) spot along the length of the crystal while detecting the emission at one of the tips (Fig. 3a). A schematic representation of the set-up used for the measurements can be found in Fig. S8 (ESI†). The fluorescence intensity (Iout) upon moving the pump a distance x with respect to the initial position (Iin) is given by the Lambert–Beer law Iout = Iine−αx, where Iout and Iin are the PL intensities at the output and input, respectively, x is the propagation distance, and α is the absorption coefficient in μm−1, which is related to the optical loss coefficient α′ (dB μm−1) through the equation α′ (dB μm−1) ≈ 4.34α (μm−1). The α and α′ values obtained for NI1 were 2.1 × 10⁻³ μm−1 and 9.1 × 10⁻³ dB μm−1, respectively (Fig. 3b). The α′ value is lower than some recently reported in optical waveguiding organic crystals42–44 and on the order of the best derivatives reported recently by our research group45 and by others.46 It is known that the excellent crystallinity improves the exciton-photon coupling and the migration of excitons, favouring the light transmission process.47 In the case of NI2, it was not possible to determine the α′ value because the crystals obtained were not large enough to be studied with our experimental setup.
The outcomes indicate that the presence of diCF3-phenyl substituents contributes to the formation of better quality and larger crystals when compared to the alkyl chains.
Stimuli-responsive fluorochromism
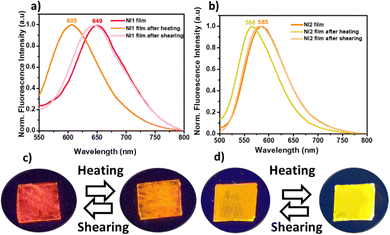
We have found that the solid-state emission properties of both compounds can be modulated in response to temperature. Specifically, the fluorescence of thin films prepared by blade-coating of NI1 and NI2 (with thicknesses of 280 and 380 nm respectively as determined by optical profilometry) varied when they were heated above 140 °C and 100 °C, respectively. Fig. 4c and d show photographs of the as-prepared thin films of NI1 and NI2, respectively, visualized under a UV lamp (365 nm) before and after annealing showing the heat-induced colour switch. Interestingly the original emission colour can be restored in both films upon grinding with a spatula. Fluorescence spectra of the emissive layers after thermal treatment confirmed that in both cases the PL spectrum blueshifts from 649 nm to 605 nm in NI1 and from 585 to 566 nm in NI2 (Fig. 4a and b), and confirmed that in both cases, upon subsequent shearing at the emission wavelength it is recovered, returning to the starting point. Absorption and excitation spectra of the samples before and after heating do not show significant changes in the two cases (Fig. S10, ESI†).Powder X-ray diffraction was conducted to understand the phase transitions leading to the colour change. For both compounds, initial amorphous thin layers were observed (Fig. 5). After heating, a crystallization phase transition is evidenced by the presence of sharp and intense reflection peaks in the X-ray diffractogram, suggesting that the colour change observed corresponds to a change between an amorphous-phase and a crystalline phase. Upon shear-induced amorphization, molecules may experience an increase in rotational freedom facilitating their rearrangement to form new intermolecular charge-transfer species or excimers.48 Note that flat NI moieties have a strong tendency to form excimers due to associative interactions between excited and ground state molecules, which could be responsible for the emission red shift in amorphous NI1 and NI2.49,50
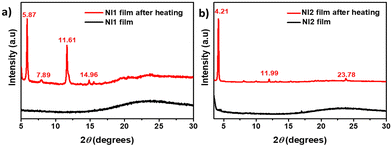 | ||
| Fig. 5 Powder X-ray diffraction pattern for (a) NI1 and (b) NI2 in pristine films and after heating. | ||
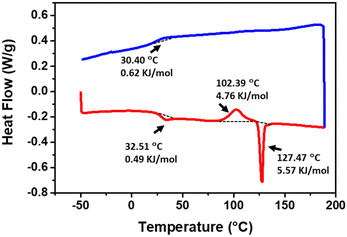
Differential scanning calorimetry (DSC) results further confirmed that a cold-crystallization is taking place when both compounds are heated (Fig. 6 and Fig. S13, ESI†).51,52 As illustrated in Fig. 6, in the first heating cycle, NI2 shows a glass transition at 32.5 °C, followed by a cold-crystallization transition peak at 102.4 °C (4.76 kJ mol−1). The sharp endothermic peak at 127.5 °C corresponds to the melting of the crystalline phase. In the cooling cycle, we only observed a glass transition. NI1 also shows a cold-crystallization at 137.3 °C (1.15 kJ mol−1) before melting at 174.6 °C (Fig. S13, ESI†). A similar thermal behaviour is observed in the second DSC cycle highlighting the reversibility of the process (Fig. S14, ESI†). Thermogravimetric analysis (TGA) shows good thermal stability of both compounds in the range of the phase transition (Fig. S15, ESI†).
X-Ray structure determination
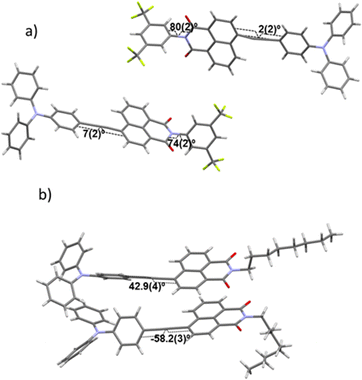
In order to shed light on how crystallization influences the colour emission of these two compounds, we determined the structural packing in the crystals by single crystal X-ray analysis (see ESI,† Section S7). Compound NI1 crystallized in the P21 space group with two independent molecules in the asymmetric unit (Fig. 7a). The needle-shaped crystals were extremely small in two of the three dimensions and formed sheaf-like aggregates. Many attempts were made to grow better crystals, and ultimately the best available fragment (among numerous crystals tested) was selected for the diffraction experiment; however, the resulting diffraction pattern shows the existence of peaks belonging to small domains that could not be segregated at the integration phase. The two NI1 molecules that form the dimer differ in the torsion angle between the phenyl ring of the triphenylamine on one side of the alkyne and the naphthalimide moiety which are nearly coplanar (2(2)° and 7(2)°) as well as in the torsion of the attached diCF3-phenyl groups (80(2)° and 74(2)°) (Fig. 8a).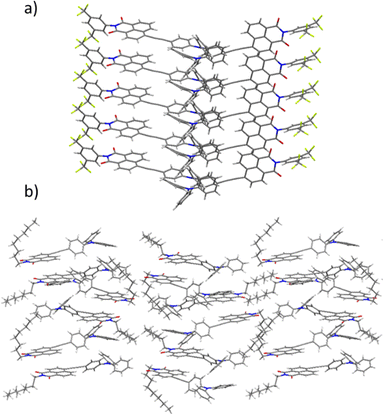 | ||
| Fig. 7 Lateral view of the dimers and columns that emerge as a result of the crystallographic packing of molecules of (a) NI1 and (b) NI2. | ||
On the other hand, compound NI2 crystallizes in the P21/n space group with two independent molecules in the asymmetric unit (Fig. 7b). In this case, we again observe differences in the torsion angle of the phenyl ring of the triphenylamine and the naphthalimide moiety (which exhibit values much larger than in the previous case, 58.2(3)° and 42.9(4)°), as well as in the disposition of the long alkyl chains, one of them nearly orthogonal to the NI moiety, introducing a high steric hindrance (Fig. 8b).
An analysis of the crystallographic packing shows that the two independent molecules of NI1 organize into two different columns that grow along the b axis. Such an arrangement results in extended stacks of the NI moieties, which are laterally shifted by approximately 43°. This type of aggregate is highly desirable for light transport and photonic applications.53 In contrast, the two crystallographically independent molecules of NI2 organize to form dimers with the NI moieties laterally shifted by around 38° giving rise to an arrangement in which lateral alkyl chains remain interdigitated along the whole structure. Examining the close contacts between adjacent molecules reveals that both structures are stabilized by multiple CH–π and π–π interactions involving the triphenylamine, alkyne groups and NI moiety of neighbouring molecules. Significantly shorter contact distances are observed between NI2 molecules when compared to NI1, pointing to stronger intermolecular interactions, thus explaining the higher transition phase enthalpies recorded for NI2 (4.76 kJ mol−1vs. 1.07 kJ mol−1).
Interestingly, in both cases the powder X-ray diffractograms simulated from the single-crystal data coincide with those obtained from the crystallized films (Fig. S21, ESI†). Note that meniscus-guided processing techniques, such as blade-coating, favour highly aligned films, and therefore, only the most intense peaks are observed.54 This good match allowed us to investigate the origin of the colour changes between the two interconverted phases induced by a thermal or mechanical stimulus. Presumably, during shear-induced amorphization, the distance between the highly emissive NI molecules is reduced, thus promoting intermolecular electronic delocalization. In the case of NI1, the presence of more extended stacks together with the possible planarization of the highly distorted diCF3-phenyl substituents (thus resulting also in an intramolecular contribution to the colour change) is probably responsible for the larger bathochromic shift in this particular case. In contrast, in NI2, where a dimeric packing arrangement is induced due to steric hindrance introduced by the flexible chains, the colour change is notably less pronounced.
Conclusions
In this work, we have synthetized two D–π–A NI derivatives, with different functionalities in the NI core (diCF3-phenyl or octyl chains) following the principles of sustainable chemistry by employing microwave irradiation as the energy source, a minimal amount of solvent and a reusable catalyst. Both compounds self-assemble by slow diffusion and led to the formation of single crystals suitable for XRD analysis. The presence of a diCF3-phenyl group is beneficial to obtain larger crystals when compared to the alkyl chains. The waveguiding behaviour of both compounds was confirmed by PL microscopy and the optical loss coefficient for NI1 was measured, being lower than previously reported ones.Both compounds are strongly fluorescent and present a reversible stimuli-responsive behaviour under thermal and mechanical action. An amorphous-to-crystalline phase transition is induced by heating (cold crystallization), giving rise to a blue shift of the emission colour that can be reverted due to an amorphization process upon shearing.
X-ray analysis of the crystalline packing shows different arrangements for these compounds in which N-substitution plays a crucial role in the final structure.
The combination of the properties of these crystalline organic waveguides with the thermal/mechanical reversible stimuli-responsiveness, may lead to broad applications such as in tunable optics, security inks or rewritable materials.
We hope that these findings will provide important structural clues for the ad hoc design of smart materials with desired properties and functions.
Author contributions
R. Martín: investigation, methodology, data curation, interpretation, writing – review and editing. A. Sánchez-Oliva: investigation, methodology, data curation. A. Benito: investigation, methodology, data curation, analysis and interpretation of results. I Torres-Moya: investigation, supervision, data curation. A. M. García: methodology, data curation, writing the original draft. J. Álvarez-Conde: investigation, data curation. J. Cabanillas-González: investigation, data curation, funding acquisition, supervision. P. Prieto: conceptualization, supervision; funding acquisition, writing – review and editing. B. Gómez-Lor: conceptualization, supervision; interpretation, funding acquisition, writing – review and editing. All authors reviewed the results and approved the final version of the manuscript.Conflicts of interest
There are no conflicts to declare.Acknowledgements
This research was funded by MCIN/AEI/10.13039/501100011033 (Projects PID2019-104125RB-I00, PID2020-119636GB-I00, PDC2021-121002-I00 and PID2021-128313OB-I00), by FEDER and Junta de Comunidades de Castilla-La Mancha (JCCM-FEDER) (Project SBPLY/21/180501/000114) and by the Regional Government of Madrid (NMAT2D-CM). A. Sánchez-Oliva acknowledges the Universidad de Castilla-La Mancha (UCLM) for a predoctoral grant for Personal Investigador en Formación (2021-UNIVERS-10626), funded by the Fondo Social Europeo Plus (FSE +). I. Torres-Moya acknowledges the Agencia Estatal de Investigación for a post-doctoral grant Juan de la Cierva Formación 2020 FJC2020-043684-I funded by MCIN/AEI/10.13039/501100011033 and European Union NextGeneration EU/PRTR. A. M. Garcia acknowledges the María Zambrano program under the grant agreement UNI/551/2021. R. Martín acknowledges the Spanish Ministry of Universities for a Margarita Salas postdoctoral fellowship under the agreement UNI/551/2021. J. Cabanillas-González also acknowledges a Research Consolidation Grant (CNS2022-136191) from the Spanish Ministry of Science and Innovation. IMDEA Nanociencia acknowledges support from the 'Severo Ochoa' Programme for Centres of Excellence in R&D of the Spanish Ministry of Science and Innovation (CEX2020-001039-S). We also thank J. Perles, M. Ramirez and P. Martínez for their collaboration in solving the crystal structure of NIs.References
- L. Tong, R. R. Gattass, J. B. Ashcom, S. He, J. Lou, M. Shen, I. Maxwell and E. Mazur, Nature, 2003, 426, 816–819 CrossRef CAS PubMed.
- Q. H. Cui, Y. S. Zhao and J. Yao, J. Mater. Chem., 2012, 22, 4136–4140 RSC.
- H. Jiang and W. Hu, Angew. Chem., Int. Ed., 2020, 59, 1408–1428 CrossRef CAS PubMed.
- D. Tian and Y. Chen, Adv. Opt. Mater., 2021, 2002264 CrossRef CAS.
- S. Wu, B. Zhou and D. Yan, Adv. Opt. Mater., 2021, 2001768 CrossRef CAS.
- S. Chen, M.-P. Zhuo, X.-D. Wang, G.-Q. Wei and L.-S. Liao, PhotoniX, 2021, 2, 2 CrossRef.
- Y. Shi and X. Wang, Adv. Funct. Mater., 2021, 31, 2008149 CrossRef CAS.
- C. Zhang, J. Y. Zheng, Y. S. Zhao and J. Yao, Adv. Mater., 2011, 23, 1380–1384 CrossRef CAS PubMed.
- M. Zhuo, Y. Su, Y. Qu, S. Chen, G. He, Y. Yuan, H. Liu, Y. Tao, X. Wang and L. Liao, Adv. Mater., 2021, 33, 2102719 CrossRef CAS PubMed.
- Q. Di, L. Li, X. Miao, L. Lan, X. Yu, B. Liu, Y. Yi, P. Naumov and H. Zhang, Nat. Commun., 2022, 13, 5280 CrossRef CAS PubMed.
- R. Chandrasekar, Chem. Commun., 2022, 58, 3415–3428 RSC.
- X. Yang, L. Lan, X. Pan, X. Liu, Y. Song, X. Yang, Q. Dong, L. Li, P. Naumov and H. Zhang, Nat. Commun., 2022, 13, 7874 CrossRef CAS PubMed.
- M. Annadhasan, S. Basak, N. Chandrasekhar and R. Chandrasekar, Adv. Opt. Mater., 2020, 8, 2000959 CrossRef CAS.
- Z. Ding, H. Shang, Y. Geng, S.-T. Zhang, Z. Huo, Z. Yang, B. Li, W. Xu and S. Jiang, J. Phys. Chem. Lett., 2021, 12, 4585–4592 CrossRef CAS PubMed.
- N. Mitetelo, D. Venkatakrishnarao, J. Ravi, M. Popov, E. Mamonov, T. V. Murzina and R. Chandrasekar, Adv. Opt. Mater., 2019, 7, 1801775 CrossRef.
- J. Mahmoud Halabi, E. Ahmed, S. Sofela and P. Naumov, Proc. Natl. Acad. Sci. U. S. A., 2021, 118, e2020604118 CrossRef PubMed.
- S. Yousuf, J. Mahmoud Halabi, I. Tahir, E. Ahmed, R. Rezgui, L. Li, P. Laws, M. Daqaq and P. Naumov, Angew. Chem., Int. Ed., 2023, 62, e202217329 CrossRef CAS PubMed.
- Y. Ma, Y. Li, L. Chen, Y. Xiong and G. Yin, Dyes Pigm., 2016, 126, 194–201 CrossRef CAS.
- Y. Li, Z. Ma, A. Li, W. Xu, Y. Wang, H. Jiang, K. Wang, Y. Zhao and X. Jia, ACS Appl. Mater. Interfaces, 2017, 9, 8910–8918 CrossRef CAS PubMed.
- C. Feng, K. Wang, Y. Xu, L. Liu, B. Zou and P. Lu, Chem. Commun., 2016, 52, 3836–3839 RSC.
- P. Galer, R. C. Korošec, M. Vidmar and B. Šket, J. Am. Chem. Soc., 2014, 136, 7383–7394 CrossRef CAS PubMed.
- J. Feng, K. Tian, D. Hu, S. Wang, S. Li, Y. Zeng, Y. Li and G. Yang, Angew. Chem., Int. Ed., 2011, 50, 8072–8076 CrossRef CAS PubMed.
- D. Genovese, A. Aliprandi, E. A. Prasetyanto, M. Mauro, M. Hirtz, H. Fuchs, Y. Fujita, H. Uji-I, S. Lebedkin, M. Kappes and L. De Cola, Adv. Funct. Mater., 2016, 26, 5271–5278 CrossRef CAS.
- X. Wang, W. Li, W. Li, C. Gu, H. Zheng, Y. Wang, Y.-M. Zhang, M. Li and S. Xiao-An Zhang, Chem. Commun., 2017, 53, 11209–11212 RSC.
- M. I. Khazi, W. Jeong and J. Kim, Adv. Mater., 2018, 30, 1705310 CrossRef PubMed.
- M.-J. Teng, X.-R. Jia, S. Yang, X.-F. Chen and Y. Wei, Adv. Mater., 2012, 24, 1255–1261 CrossRef CAS PubMed.
- C. Wang and Z. Li, Mater. Chem. Front., 2017, 1, 2174–2194 RSC.
- D. Wang, X. Zhang, X. Han, Y. Zhou, Y. Lei, W. Gao, M. Liu, X. Huang and H. Wu, J. Mater. Chem. C, 2021, 9, 12868–12876 RSC.
- M. Echeverri, C. Ruiz, S. Gámez-Valenzuela, I. Martín, M. C. Ruiz Delgado, E. Gutiérrez-Puebla, M. Á. Monge, L. M. Aguirre-Díaz and B. Gómez-Lor, J. Am. Chem. Soc., 2020, 142, 17147–17155 CrossRef CAS PubMed.
- Z.-D. Yu, X.-X. Dong, J.-Y. Cao, W.-X. Zhao, G.-H. Bi, C.-Z. Wang, T. Zhang, S. Rahman, P. E. Georghiou, J.-B. Lin and T. Yamato, J. Mater. Chem. C, 2022, 10, 9310–9318 RSC.
- B. Prusti, P. Sarkar, S. K. Pati and M. Chakravarty, J. Mater. Chem. C, 2021, 9, 9555–9570 RSC.
- M. Echeverri, C. Ruiz, S. Gámez-Valenzuela, M. Alonso-Navarro, E. Gutierrez-Puebla, J. L. Serrano, M. C. Ruiz Delgado and B. Gómez-Lor, ACS Appl. Mater. Interfaces, 2020, 12, 10929–10937 CrossRef CAS PubMed.
- H. Park, I. E. Serdiuk and S. Y. Park, ChemPhotoChem, 2023, 7, e202200267 CrossRef CAS.
- I. Torres-Moya, J. R. Carrillo, M. V. Gómez, A. H. Velders, B. Donoso, A. M. Rodríguez, Á. Díaz-Ortiz, J. T. López Navarrete, R. P. Ortiz and P. Prieto, Dyes Pigm., 2021, 191, 109358 CrossRef CAS.
- M. Poddar, G. Sivakumar and R. Misra, J. Mater. Chem. C, 2019, 7, 14798–14815 RSC.
- D. Wu, A. C. Sedgwick, T. Gunnlaugsson, E. U. Akkaya, J. Yoon and T. D. James, Chem. Soc. Rev., 2017, 46, 7105–7123 RSC.
- S. Banerjee, E. B. Veale, C. M. Phelan, S. A. Murphy, G. M. Tocci, L. J. Gillespie, D. O. Frimannsson, J. M. Kelly and T. Gunnlaugsson, Chem. Soc. Rev., 2013, 42, 1601 RSC.
- R. Martín, P. Prieto, J. R. Carrillo, A. M. Rodríguez, A. de Cozar, P. G. Boj, M. A. Díaz-García and M. G. Ramírez, J. Mater. Chem. C, 2019, 7, 9996–10007 RSC.
- J. W. Chung, Y. You, H. S. Huh, B.-K. An, S.-J. Yoon, S. H. Kim, S. W. Lee and S. Y. Park, J. Am. Chem. Soc., 2009, 131, 8163–8172 CrossRef CAS PubMed.
- K. Kümmerer, Angew. Chem., Int. Ed., 2017, 56, 16420–16421 CrossRef PubMed.
- P. T. Anastas and J. C. Warner, Green Chemistry: Theory and Practice, Oxford University Press, 1998 Search PubMed.
- Z. Lu, Y. Zhang, H. Liu, K. Ye, W. Liu and H. Zhang, Angew. Chem., Int. Ed., 2020, 59, 4299–4303 CrossRef CAS PubMed.
- V. Vinay Pradeep, C. Tardío, I. Torres-Moya, A. M. Rodríguez, A. Vinod Kumar, M. Annadhasan, A. Hoz, P. Prieto and R. Chandrasekar, Small, 2021, 17, 2006795 CrossRef CAS PubMed.
- H. Liu, Z. Lu, Z. Zhang, Y. Wang and H. Zhang, Angew. Chem., Int. Ed., 2018, 57, 8448–8452 CrossRef CAS PubMed.
- C. Tardío, J. Álvarez-Conde, I. Torres-Moya, A. M. Rodríguez, A. De La Hoz, J. Cabanillas-González and P. Prieto, J. Mater. Chem. C, 2022, 10, 6411–6418 RSC.
- M. Annadhasan, D. P. Karothu, R. Chinnasamy, L. Catalano, E. Ahmed, S. Ghosh, P. Naumov and R. Chandrasekar, Angew. Chem., Int. Ed., 2020, 59, 13821–13830 CrossRef CAS PubMed.
- C. Zhang, C.-L. Zou, Y. Yan, R. Hao, F.-W. Sun, Z.-F. Han, Y. S. Zhao and J. Yao, J. Am. Chem. Soc., 2011, 133, 7276–7279 CrossRef CAS PubMed.
- S. Varughese, J. Mater. Chem. C, 2014, 2, 3499 RSC.
- D. W. Cho and D. W. Cho, New J. Chem., 2014, 38, 2233–2236 RSC.
- D. W. Cho, M. Fujitsuka, K. H. Choi, M. J. Park, U. C. Yoon and T. Majima, J. Phys. Chem. B, 2006, 110, 4576–4582 CrossRef CAS PubMed.
- Y. Tsujimoto, T. Sakurai, Y. Ono, S. Nagano and S. Seki, J. Phys. Chem. B, 2019, 123, 8325–8332 CrossRef CAS PubMed.
- W. R. Bodlos, S. Mattiello, A. Perinot, L. Gigli, N. Demitri, L. Beverina, M. Caironi and R. Resel, Cryst. Growth Des., 2021, 21, 325–332 CrossRef CAS PubMed.
- P. Lova, V. Grande, G. Manfredi, M. Patrini, S. Herbst, F. Würthner and D. Comoretto, Adv. Opt. Mater., 2017, 5, 1700523 CrossRef.
- X. Gu, L. Shaw, K. Gu, M. F. Toney and Z. Bao, Nat. Commun., 2018, 9, 534 CrossRef PubMed.
Footnotes |
| † Electronic supplementary information (ESI) available. CCDC 2306088 and 2306089. For ESI and crystallographic data in CIF or other electronic format see DOI: https://doi.org/10.1039/d3tc04100j |
| ‡ These authors contributed equally to this work. |
| This journal is © The Royal Society of Chemistry 2024 |

