
 Open Access Article
 This Open Access Article is licensed under a
 Creative Commons Attribution 3.0 Unported Licence
An investigation into the effects of ink formulations of semi-solid extrusion 3D printing on the performance of printed solid dosage forms†
Bin
Zhang
 *ab,
Peter
Belton
c,
Xin Yi
Teoh
ad,
Andrew
Gleadall
e,
Richard
Bibb
f and
Sheng
Qi
*a
*ab,
Peter
Belton
c,
Xin Yi
Teoh
ad,
Andrew
Gleadall
e,
Richard
Bibb
f and
Sheng
Qi
*a
aSchool of Pharmacy, University of East Anglia, Norwich, UK. E-mail: sheng.qi@uea.ac.uk
bDepartment of Mechanical and Aerospace Engineering, Brunel University London, London, UK. E-mail: bin.zhang@brunel.ac.uk
cSchool of Chemistry, University of East Anglia, Norwich, UK
dSchool of Pharmacy, University College London, London, UK
eWolfson School of Mechanical, Electrical and Manufacturing Engineering, Loughborough University, Loughborough, UK
fNottingham School of Art & Design, Nottingham Trent University, UK
First published on 27th November 2023
Abstract
Semi-solid extrusion (SSE) 3D printing has recently attracted increased attention for its pharmaceutical application as a potential method for small-batch manufacturing of personalised solid dosage forms. It has the advantage of allowing ambient temperature printing, which is especially beneficial for the 3D printing of thermosensitive drugs. In this study, the effects of polymeric compositions (single hydroxypropyl methylcellulose (HPMC) system and binary HPMC + polyvinylpyrrolidone (PVP) system), disintegrant (silicon oxide (SiO2)), and active pharmaceutical ingredients (tranexamic acid (TXA) and paracetamol (PAC)) on the printability of semisolid inks and the qualities of SSE printed drug-loaded tablets were investigated. Printability is defined by the suitability of the material for the process in terms of its physical properties during extrusions and post-extrusion, including rheology, solidification time, avoiding slumping, etc. The rheological properties of the inks were investigated as a function of polymeric compositions and drug concentrations and further correlated with the printability of the inks. The SSE 3D printed tablets were subjected to a series of physicochemical properties characterisations and in vitro drug release performance evaluations. The results indicated that an addition of SiO2 would improve 3D printing shape fidelity (e.g., pore area and porosity) by altering the ink rheology. The pores of HPMC + PVP + 5PAC prints completely disappeared after 12 hours of drying (pore area = 0 mm2). An addition of SiO2 significantly improved the pore area of the prints which are 3.5 ± 0.1 mm2. It was noted that the drug release profile of PAC significantly increased (p < 0.05) when additive SiO2 was incorporated in the formulation. This could be due to a significantly higher porosity of HPMC + PVP + SiO2 + PAC (70.3 ± 0.2%) compared to HPMC + PVP + PAC (47.6 ± 2.1%). It was also likely that SiO2 acted as a disintegrant speeding up the drug release process. Besides, the incorporation of APIs with different aqueous solubilities, as well as levels of interaction with the polymeric system showed significant impacts on the structural fidelity and subsequently the drug release performance of 3D printed tablets.
1. Introduction
3D printing is attracting increasing attention in the pharmaceutical science community due to its flexibility and customizability potential for personalised medicine when compared to traditional pharmaceutical mass manufacturing techniques.1,2 In recent years, several 3D printing techniques have been investigated for their potential pharmaceutical applications, including stereolithography,3,4 selective laser sintering,5 inkjet printing,6,7 and material-extrusion 3D printing.8–11 Among these, thermal-based 3D printing processes, including fused deposition modelling (FDM), direct powder extrusion and droplet deposition-based 3D printing,12–16 are widely researched. However, thermal-based 3D printing requires the active pharmaceutical ingredient (API) to go through at least one (and two for FDM) thermal processes (heating above melting point to create the material filament by extrusion and subsequent reheating during printing), which could cause drug thermal degradation and is not suitable for thermosensitive drugs. Several modifications have been attempted to reduce the thermal stress associated with thermal-based 3D printing methods, such as adding plasticisers to the formula to lower the melting/glass transition temperature of the bulk polymers, thus lowering the printing temperature required to process the material,8,17–21 but none of these can completely eliminate the effects of heat during printing.Semi-solid extrusion (SSE) 3D printing is a 3D printing technology which extrudes semi-solid materials such as pastes and gels through a defined size nozzle to create a new structure after solidification (e.g., tablets). Compared to thermal-based 3D printing methods, SSE 3D printing can operate under a heat-free condition as the printing solely relies on the extrusion of viscoelastic semi-solid inks through a nozzle with a displacement-controlled driving mechanism.22–25 The rheological and mechanical properties of the ink formulas are critical for successful SSE 3D printing.26–28 The formulated ink is technically a slurry (with solid contents) or a gel (soluble ingredients with hydrated polymer network).23,29–32 It is commonly recognised in the literature that in order to achieve high geometrical fidelity using SSE 3D printing, meaning accurately reproducing the original CAD design, certain characteristics are required. These are that the ink needs to exhibit non-Newtonian properties and shear-thinning behaviour (i.e. reduction in viscosity with applied shear stress) to generate continuous flow during extrusion.24,33,34 If the ink viscosity is too low, discontinuous droplets or overflooding and deformation of filaments would occur, while nozzle clogging happens, if the ink viscosity is too high.35–37 Thickening additives often have to be used to adjust the ink viscosity.38–40
A wide range of pharmaceutical applications of SSE 3D printing have been demonstrated in the literature, including chewable and fast-disintegrating dosage forms as well as polypills,41,42 which have been developed for paediatric patients, patients with dysphagia and patients with high pill burdens. These published works highlighted the potential of SSE as a manufacturing method to produce personalised medicines for targeted patient groups. Whilst SSE 3D printing has advantages, it still remains in the research and development stage, and there are presently the limitations of1 suitable ink formulation for 3D printing,2 lack of understanding of the influences of ingredients in the ink formula on drug release. Thus, in order to translate the technology to clinical practice, a fundamental understanding of the key principles of optimising the printability of SSE inks is needed to guide new product development.22,27,43
Commonly used excipient/additive of pharmaceutical products i.e. HPMC, PVP and SiO244–46 were selected in this study. As a ramification of our previous study where HPMC-PVP was identified as an ideal excipient combination in semisolid extrusion-based 3D printing,22 therefore, this study aims to investigate the effect of additive and APIs incorporation on the printability and drug release performance of 3D printed tablets. In this study, additive SiO2 as the disintegrant and two APIs with different levels of water solubilities (i.e., tranexamic acid (TXA) and paracetamol (PAC)) were incorporated into the ink to observe the changes in ink properties. Subsequently, an attempt to establish the relationship between ink properties, shape fidelity of printed tablets and in vitro drug release behaviours was conducted.
2. Materials and methods
2.1 Materials
Hydroxypropyl methylcellulose (HPMC) (METOLOSE® SR 90SH-4000, Mw 270![[thin space (1/6-em)]](https://www.rsc.org/images/entities/char_2009.gif) 000 g mol−1) was donated by Shin-Etsu Chemical Co. Ltd (Tokyo, Japan). Polyvinylpyrrolidone (PVP, Mw 50000 g mol−1) and silicon oxide (SiO2, 50 μm) were received as generous gifts from BASF (Ludwigshafen, Germany) and Evonik (Darmstadt, Germany) respectively. Tranexamic acid (TXA, Mw 157.21 g mol−1) and paracetamol (PAC, Mw 151 g mol−1) were purchased from Molekula (Darlington, UK). Salicylaldehyde (SA), used as an agent for UV detection of the TXA, was purchased from Sigma-Aldrich (St. Louis, Missouri, United States). The chemical structures of polymers and drugs are shown in Fig. 1.
000 g mol−1) was donated by Shin-Etsu Chemical Co. Ltd (Tokyo, Japan). Polyvinylpyrrolidone (PVP, Mw 50000 g mol−1) and silicon oxide (SiO2, 50 μm) were received as generous gifts from BASF (Ludwigshafen, Germany) and Evonik (Darmstadt, Germany) respectively. Tranexamic acid (TXA, Mw 157.21 g mol−1) and paracetamol (PAC, Mw 151 g mol−1) were purchased from Molekula (Darlington, UK). Salicylaldehyde (SA), used as an agent for UV detection of the TXA, was purchased from Sigma-Aldrich (St. Louis, Missouri, United States). The chemical structures of polymers and drugs are shown in Fig. 1.
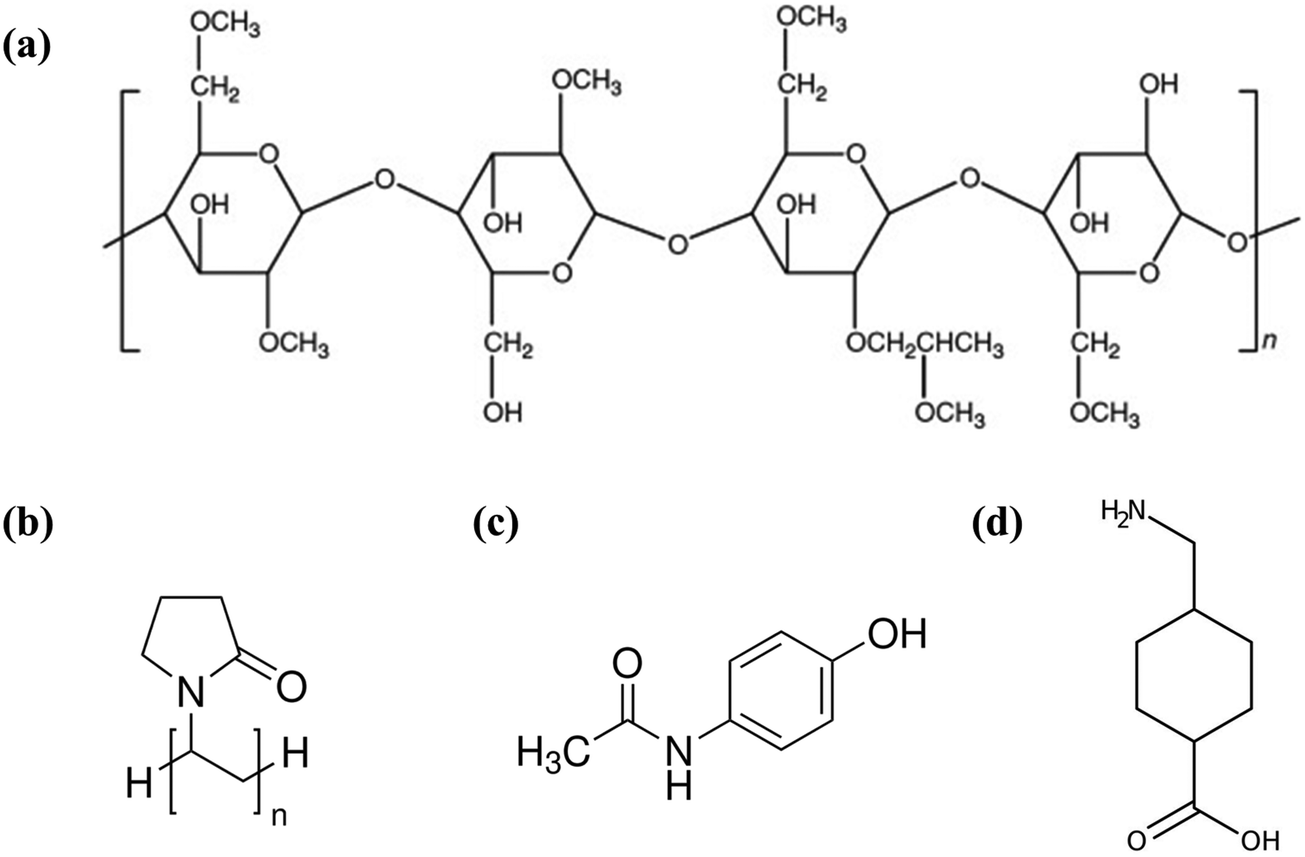 | ||
| Fig. 1 Chemical structures of polymers and drugs (a) HPMC, (b) PVP, (c) PAC and (d) TXA. | ||
2.2 Ink formulation
Both TXA- and PAC-loaded inks were prepared by dissolving the drug (at drug concentrations of TXA 5–30% w/w, and 5% w/w PAC) in 20 g deionised water at ambient temperature (circa 21 °C). Subsequently, HPMC and PVP were respectively added at 15–20% w/w to be dispersed to form a homogenous semi-solid mass under mechanical stirring. SiO2 powder (with a mean particle size of 50 μm) was added to the HPMC/PVP drug-loaded inks as a disintegrant additive. The ink preparation protocol is described in Fig. S1 (ESI†), and the compositions of the ink formulated are listed in Table 1.| Ink name | Polymer | Additive | API | ||
|---|---|---|---|---|---|
| HPMC (%w/w) | PVP (%w/w) | SiO2 (%w/w) | TXA (%w/w) | PAC (%w/w) | |
| a All % w/w is calculated by the weight of each ingredient to the weight of deionised water. | |||||
| Influence of additive/excipient | |||||
| 15HPMC | 15 | — | — | — | — |
| 30HPMC | 30 | — | — | — | — |
| 35HPMC | 35 | — | — | — | — |
| PVP | — | 20 | — | — | — |
| HPMC + PVP | 15 | 20 | — | — | — |
| HPMC + PVP + SiO2 | 15 | 20 | 8 | — | — |
| Influence of API | |||||
| HPMC + 15TXA | 15 | — | — | 15 | — |
| HPMC + PVP + 15TXA | 15 | 20 | — | 15 | — |
| HPMC + PVP + SiO2 + 15TXA | 15 | 20 | 8 | 15 | — |
| HPMC + 5PAC | 15 | — | — | — | 5 |
| HPMC + PVP + 5PAC | 15 | 20 | — | — | 5 |
| HPMC + PVP + SiO2 + 5PAC | 15 | 20 | 8 | — | 5 |
| Influence of API concentration | |||||
| HPMC + PVP | 15 | 20 | — | — | — |
| HPMC + PVP + 5TXA | 15 | 20 | — | 5 | — |
| HPMC + PVP + 15TXA | 15 | 20 | — | 15 | — |
| HPMC + PVP + 30TXA | 15 | 20 | — | 30 | — |
2.3 Design 3D constructs
3D constructs of the drug-loaded prints with different layer thicknesses and infill were designed to examine the geometry effect on drug release. The detailed design parameters of the constructs are summarised in Table 2. The designs can be divided into two approaches:1 3D tablet lattice with two options for the number of layers (4 and 14) whilst the pore width and filament width were kept constant;2 3D constructs with a fixed number of layers14 but with various infill densities by varying the pore width at 1 mm or 2 mm.| Tablet width (mm) | Tablet length (mm) | Tablet thickness (mm) | Filament width (mm) | Pore width (mm) | |
|---|---|---|---|---|---|
| Influence of layer number | |||||
| HPMC + PVP + 5TXA_4layer | 20 | 20 | 1 | 0.4 | 2 |
| HPMC + PVP + 15TXA_4layer | 20 | 20 | 1 | 0.4 | 2 |
| HPMC + PVP + 5TXA_14layer | 20 | 20 | 3 | 0.4 | 2 |
| HPMC + PVP + 15TXA_14layer | 20 | 20 | 3 | 0.4 | 2 |
| Influence of infill (%) | |||||
| HPMC + PVP + 5TXA_25%infill | 20 | 20 | 3 | 0.4 | 2 |
| HPMC + PVP + 15TXA_25%infill | 20 | 20 | 3 | 0.4 | 2 |
| HPMC + PVP + 5TXA_50%infill | 20 | 20 | 3 | 0.4 | 1 |
| HPMC + PVP + 15TXA_50%infill | 20 | 20 | 3 | 0.4 | 1 |
2.4 SSE 3D printing
An SSE 3D printer (BioX, Cellink Life Sciences, Gothenburg, Sweden) was used to fabricate the drug-free and drug-loaded 3D constructs. The G-code of the design was generated in accordance with the predesigned CAD model. All prints were performed at ambient temperature (circa 21 °C), and the printing nozzle and printing platform were not heated. The ink materials were extruded from a 22 Gauge nozzle, which is equivalent to an internal diameter (ID) of 413 μm. The extrusion rate (1–5 μL s−1) and printing speed (5–20 mm s−1) were optimised to obtain a filament diameter close to the nozzle diameter upon printing. Each layer was comprised of parallel filaments with an average width of circa 413 μm.2.5 Rheological measurements
Rheological measurements of the inks were conducted at ambient temperature using a rheometer (Discovery HR30, TA Instruments, New Castle, Delaware, USA) with a cone-plate geometry. Continuous flow ramps were performed by varying the shear rate from 0.1 to 100 s−1. Three replicates were measured for each ink formula.2.6 Shape fidelity and surface morphology analysis of the prints
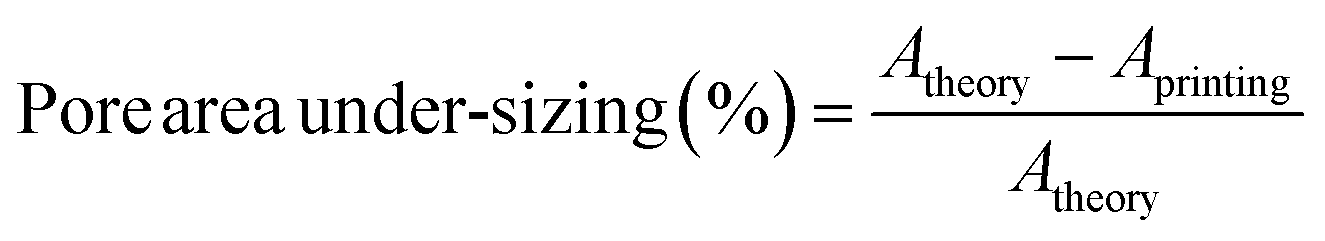
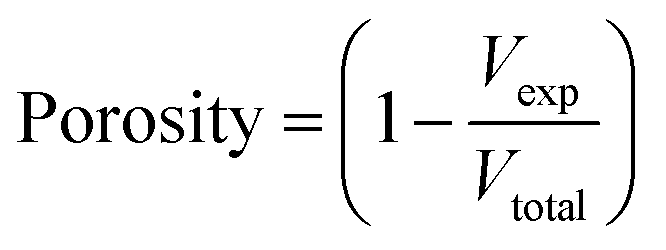
A FDSC196 polarised light microscope (PLM) (Linkam Scientific, Surrey, UK) was used to detect drug crystals through birefringent observation as an indication of the changes in drug solubility limit in the inks after the addition of HPMC and PVP (as the addition of HPMC and PVP may affect the aqueous solubility of the drug).The microscope was used to inspect the printed constructs. The pore areas of the printed structures were measured using Image J software (Version 1.8.0, Bethesda, Maryland, USA). The measurements were repeated at three different prints and three pores were measured for each print. The dimensional data were plotted using Origin software (Version 2018, Northampton, Massachusetts, USA). Error bars represent the mean ± standard deviation. The pore area of 3D printed tablets was later compared with the theoretical value. A theoretical value of pore area at 4 mm2 was identified as expressed as the square of pore width. Thus, the pore area under-sizing (%) is calculated in eqn (1).
 | (1) |
 | (2) |
Considering the samples were printed with HPMC, PVP and SiO2 mixed with API (i.e., TXA or PAC), the density of SSE 3D printed samples was calculated using eqn (3).
| ρexp = ρ1 × R1 + ρ2 × R2 + ρ3 × R3 + ρ4 × R4 | (3) |
| Vtotal = W × L × T | (4) |
 | (5) |
The surface morphology of the printed samples was evaluated using scanning electron microscopy (SEM) technique with a Zeiss Gemini 300 (Carl Zeiss AG, Oberkochen, Germany). The samples were sputter-coated with gold prior to scanning. The images were taken at magnifications from 25 to 200× with an acceleration voltage of 10 kV.
2.7 Physicochemical properties characterisation
A Fourier transform infrared (FTIR) spectrophotometer (VERTEX 70, Bruker Optics, Ettlingen, Germany), equipped with a Golden Gate, Attenuated Total Reflectance (ATR) accessory (Specac Ltd, Orpington, United Kingdom) fitted with a diamond internal reflection element, was used to examine the raw materials, physical mixtures and printed tablets. The spectra were collected over a wavenumber range of 600–4500 cm−1 with a resolution of 2 cm−1 at ambient temperature. As the SSE 3D printed samples were dried at ambient temperature (21 °C) for 72 h, thermogravimetric analysis (TGA) was conducted using TGA 5500 discovery series (TA Instruments, Newcastle, USA) to identify the moisture content of the dried 3D printed samples. 5–7 mg of sample was loaded into the instrument and subjected to a temperature program of 10 °C min−1 from 25 °C to 700 °C under a nitrogen atmosphere (20 mL min−1). Trios (TA Instruments, Newcastle, USA) software was used to analyse the acquired results. All measurements were performed in triplicate on three different tablets.2.8 Mechanical strength analysis
To evaluate the mechanical strength of the prints, puncture tests were performed on the printed tablets with a TA-XT Plus Texture analyser (Stable Micro Systems), using a spherical probe (diameter 5 mm). The puncture tests were performed on the centre of the fully dried 3D printed samples (20 × 20 × 3 mm cuboid). Force and displacement data were recorded using Texture Expert from Stable Micro Systems Ltd software. The speed of the probe was set at 1.0 mm s−1 during compression. Triplicate measurements on three different tablets were performed.2.9 In vitro drug release study
The in vitro drug release behaviours of the drug-loaded constructs were tested in 25 mL of pH 7.4 phosphate-buffered saline (PBS) with 100 rpm agitation at 37 °C in a shaking incubator (IKA, Staufen, Germany). A sink condition was maintained throughout the drug release period. Three millilitres samples were extracted and replenished with an equal volume of fresh medium at predetermined time intervals. Salicylaldehyde (SA) was used as the reagent for the UV spectrophotometry detection of TXA.52 One millilitre of TXA drug solution was added to 1 mL of 1% w/v SA solution. The complete reaction was attained after 12 hours. The UV detection was carried out at 422 nm for TXA and 243 nm for PAC. TXA and PAC samples were placed in a 96-well quartz microplate for UV detection using a CLARIO star microplate reader (BMG Labtech, Ortenberg, Germany). The drug release experiments were performed in triplicate for each construct design.2.10 Statistical analysis
Numerical data were expressed as the mean ± standard deviation and analysed via Student's t test to determine the differences among the groups. Statistical significance is indicated when p ≤ 0.05, while no significance when p > 0.05.3. Results and discussion
3.1 Ink development
The effect of the incorporation of API on the inks was studied using TXA and PAC. TXA is a low molecular weight (157.21 g mol−1) zwitterionic compound with an aqueous solubility of 167 mg mL−153 while PAC has an aqueous solubility of 14 mg mL−1.54 Owing to the limit of aqueous solubility, only 5% and 15% w/w TXA were fully dissolved in the water, whereas 5% w/w PAC and 30% w/w TXA formed a suspension and crystalline PAC and TXA can be seen by PLM. PAC particulates in the 5% w/w PAC suspension remained observed upon the addition of 15% w/w HPMC dry powders. However, the amount of PAC particulates decreased after the addition of 20% PVP as evident in Fig. 2(a) and (b). On the other hand, an addition of 15% w/w HPMC and 20% w/w PVP dry powders to the TXA solutions (5 and 15% w/w) and TXA suspension (30% w/w) revealed particulates birefringence in all PLM captures (Fig. 2(c)–(f)). The PLM images of HPMC + PVP with 5% w/w TXA and the blank were noted as extremely similar, as shown in Fig. 2(c) and (d), proving that some particulates may be the presence of undissolved polymers. No birefringence associated with crystalline TXA particles was observed, indicating a full dissolution of 5% w/w TXA in HPMC + PVP ink. Unexpectedly, the addition of HPMC and PVP to 15% w/w TXA solution resulted in the recrystallisation of TXA particles, where birefringence of TXA was observed as shown in Fig. 2(e). This observation shows the addition of HPMC and PVP has reduced the aqueous solubility of the TXA drug. As TXA content increased, more crystalline TXA was observed in the PLM images of HPMC + PVP + 30TXA ink (Fig. 2(f)).
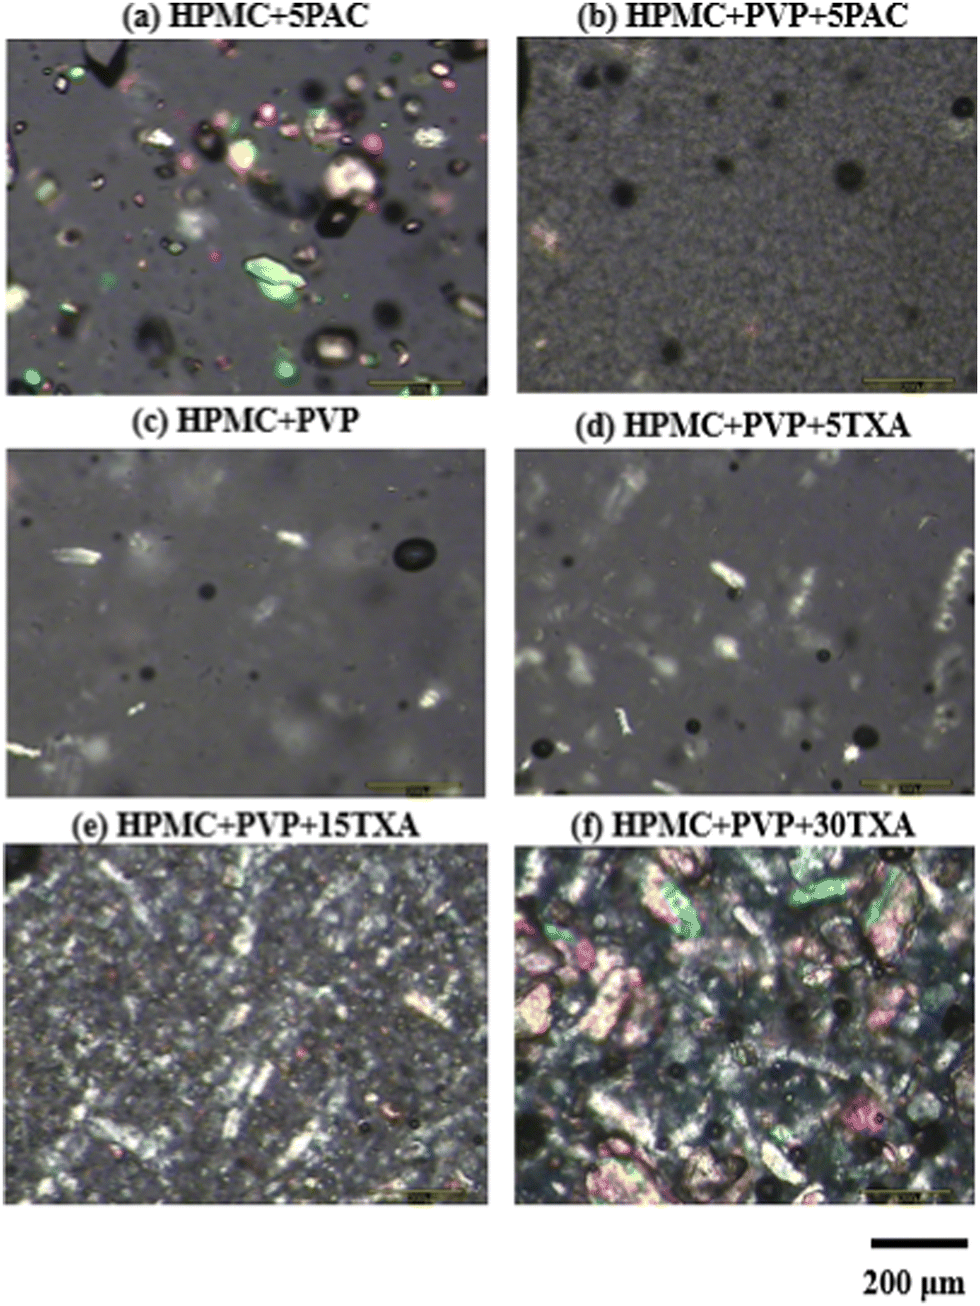 | ||
| Fig. 2 The polarized light microscopy images of the inks with (a) HPMC + 5PAC, (b) HPMC + PVP + 5PAC, (c) HPMC + PVP, (d) HPMC + PVP + 5TXA, (e) HPMC + PVP + 15TXA and (f) HPMC + PVP + 30TXA. | ||
The rheological properties of all formulated inks were evaluated at steady-state shear viscosity measurements. PVP solution behaves as a Newtonian fluid and shows the lowest viscosity that does not change with shear rate increment (Fig. 3(a)). In contrast, HPMC-based inks exhibited non-Newtonian fluid shear thinning behaviour (i.e., the viscosity decreases when the shear rate increases). The low-shear viscosities of inks increased with increasing HPMC concentrations. The addition of PVP to 15HPMC ink did not change the shear-thinning behaviour of the ink. Interestingly, the addition of 20PVP to 15HPMC showed a significant decrease (p ≤ 0.05) in the low-shear viscosity of the ink (HPMC + PVP) as compared to 30HPMC despite containing a higher percentage weight of solute. This could be due to a possible plasticizing effect by PVP due to hydrogen bond formation.55 Additional PVP also significantly decreases (p ≤ 0.05) the low-shear viscosity of both PAC and TXA-loaded HPMC-based inks, as shown in Fig. 3(b) and (c). On the other hand, SiO2 significantly increased (p ≤ 0.05) the low-shear viscosity of both PAC and TXA-loaded HPMC + PVP-based inks. Suspension of silica particles in polymer solutions is thixotropic, displaying a gradual increase in their low-shear viscosity. This has been attributed to the formation of a network between polymer chains and the contiguous silica particles.56
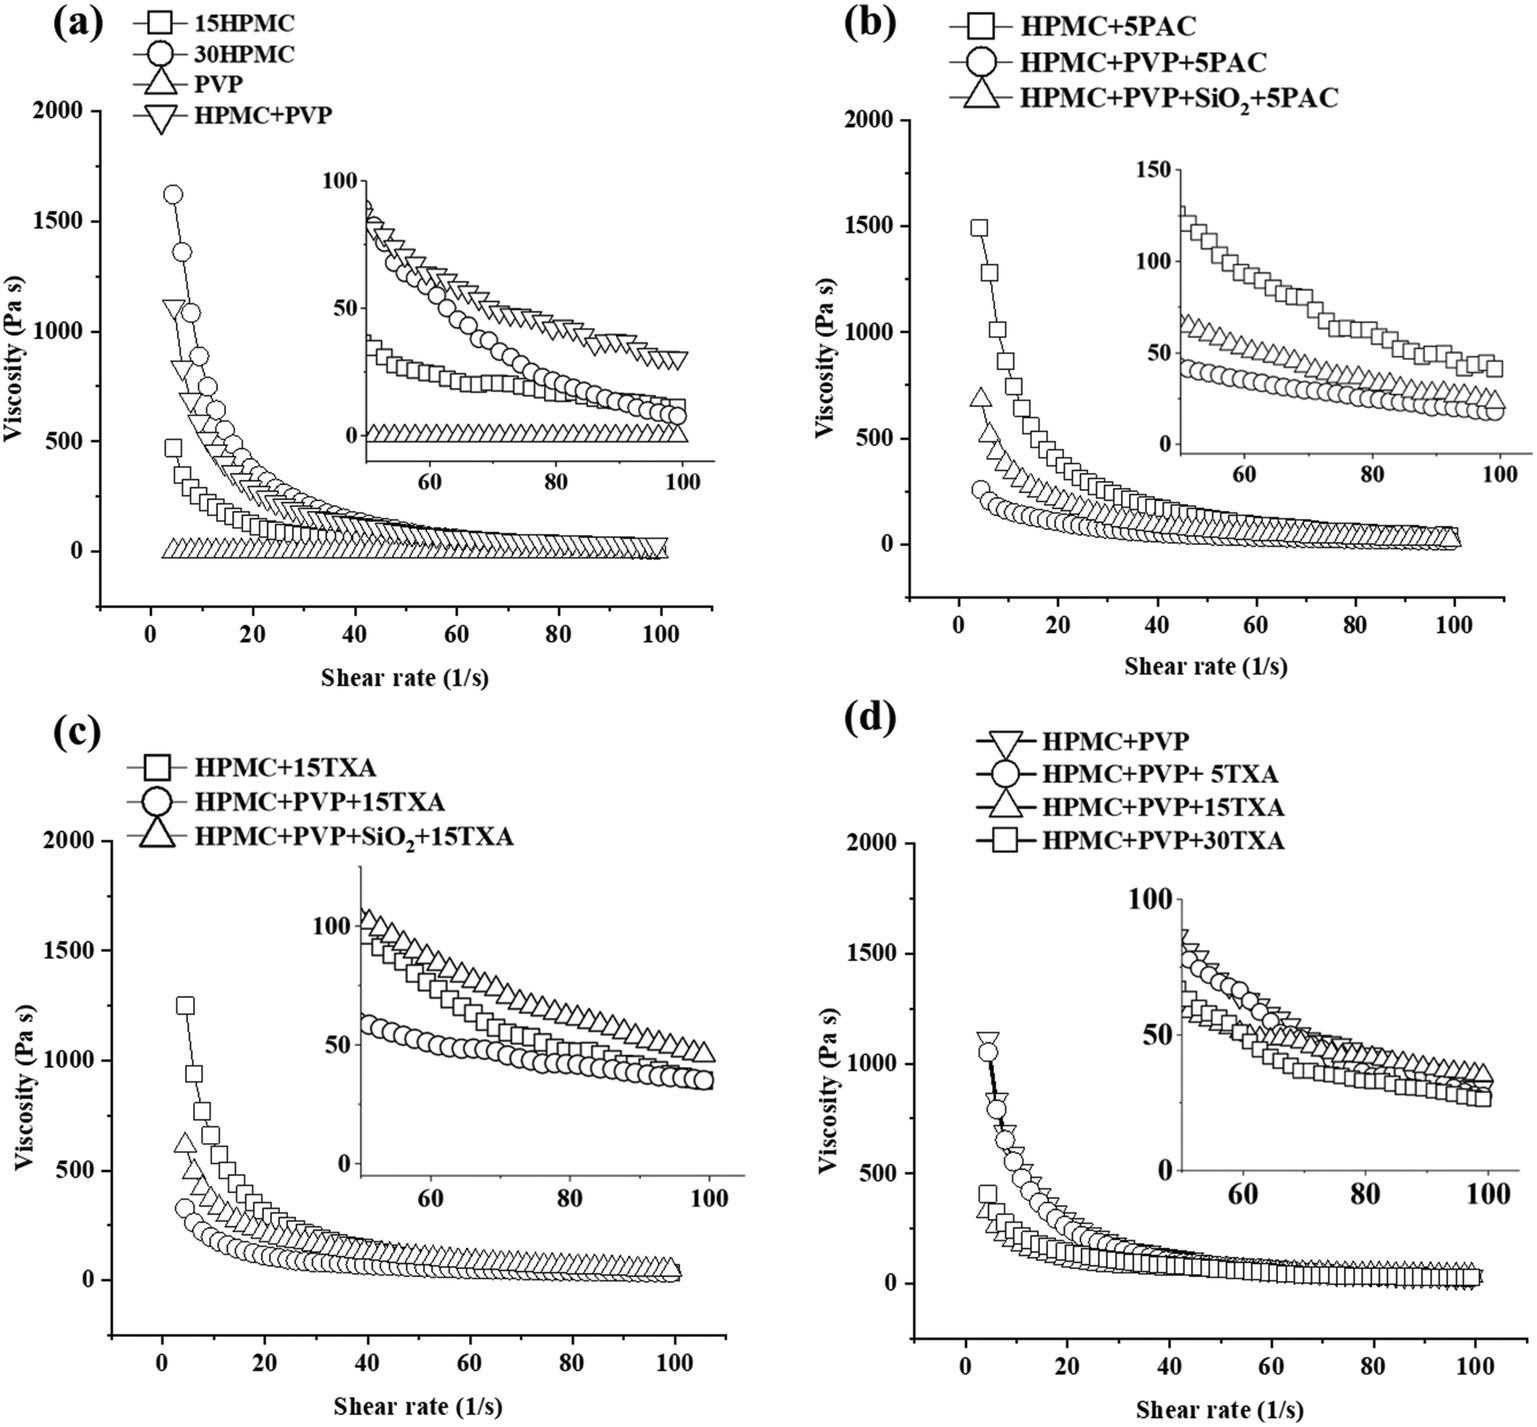 | ||
| Fig. 3 Viscosity shear rate flow curves of the inks. The influences of (a) additive, (b) incorporation of PAC and (c) TXA, and (d) TXA concentration on the ink viscosities. (Detailed ink formulation compositions are presented in Table 1.) | ||
The influence of TXA concentration on the rheological properties of the inks is shown in Fig. 3(d). The addition of 5% w/w TXA showed no effect on the low-shear viscosity of HPMC + PVP ink. A decrease in low-shear viscosity of inks was noted when TXA concentration increased from 5% to 15% w/w, but no difference was observed from 15% to 30% w/w TXA. This is because TXA has fully dissolved in HPMC + PVP ink at 5% w/w, as described in the PLM images in Fig. 2(c) and (d) but not at 15% and 30% w/w.
3.2 Correlation of ink properties and printed shape fidelity
As the ink contains a large amount of solvent (water for this study), solvent evaporation during drying often leads to the shrinkage of the 3D printed constructs and subsequently poor shape fidelity. Fig. 4 shows the physical appearances of 3D printed tablets of HPMC + PVP + 15TXA (15% w/w drug loading) and HPMC + PVP + 5PAC (5% w/w drug loading) immediately upon complete deposition of all designed layers and 12 hours post-drying at ambient temperature. A thermogravimetric analysis (TGA) of dried HPMC + PVP + 15TXA and HPMC + PVP + 5PAC samples showed a loss of weight up to 100 °C (i.e., water content evaporation) by 1.45 ± 0.10% and 0.94 ± 0.31%, respectively, as presented in the ESI† (Fig. S2).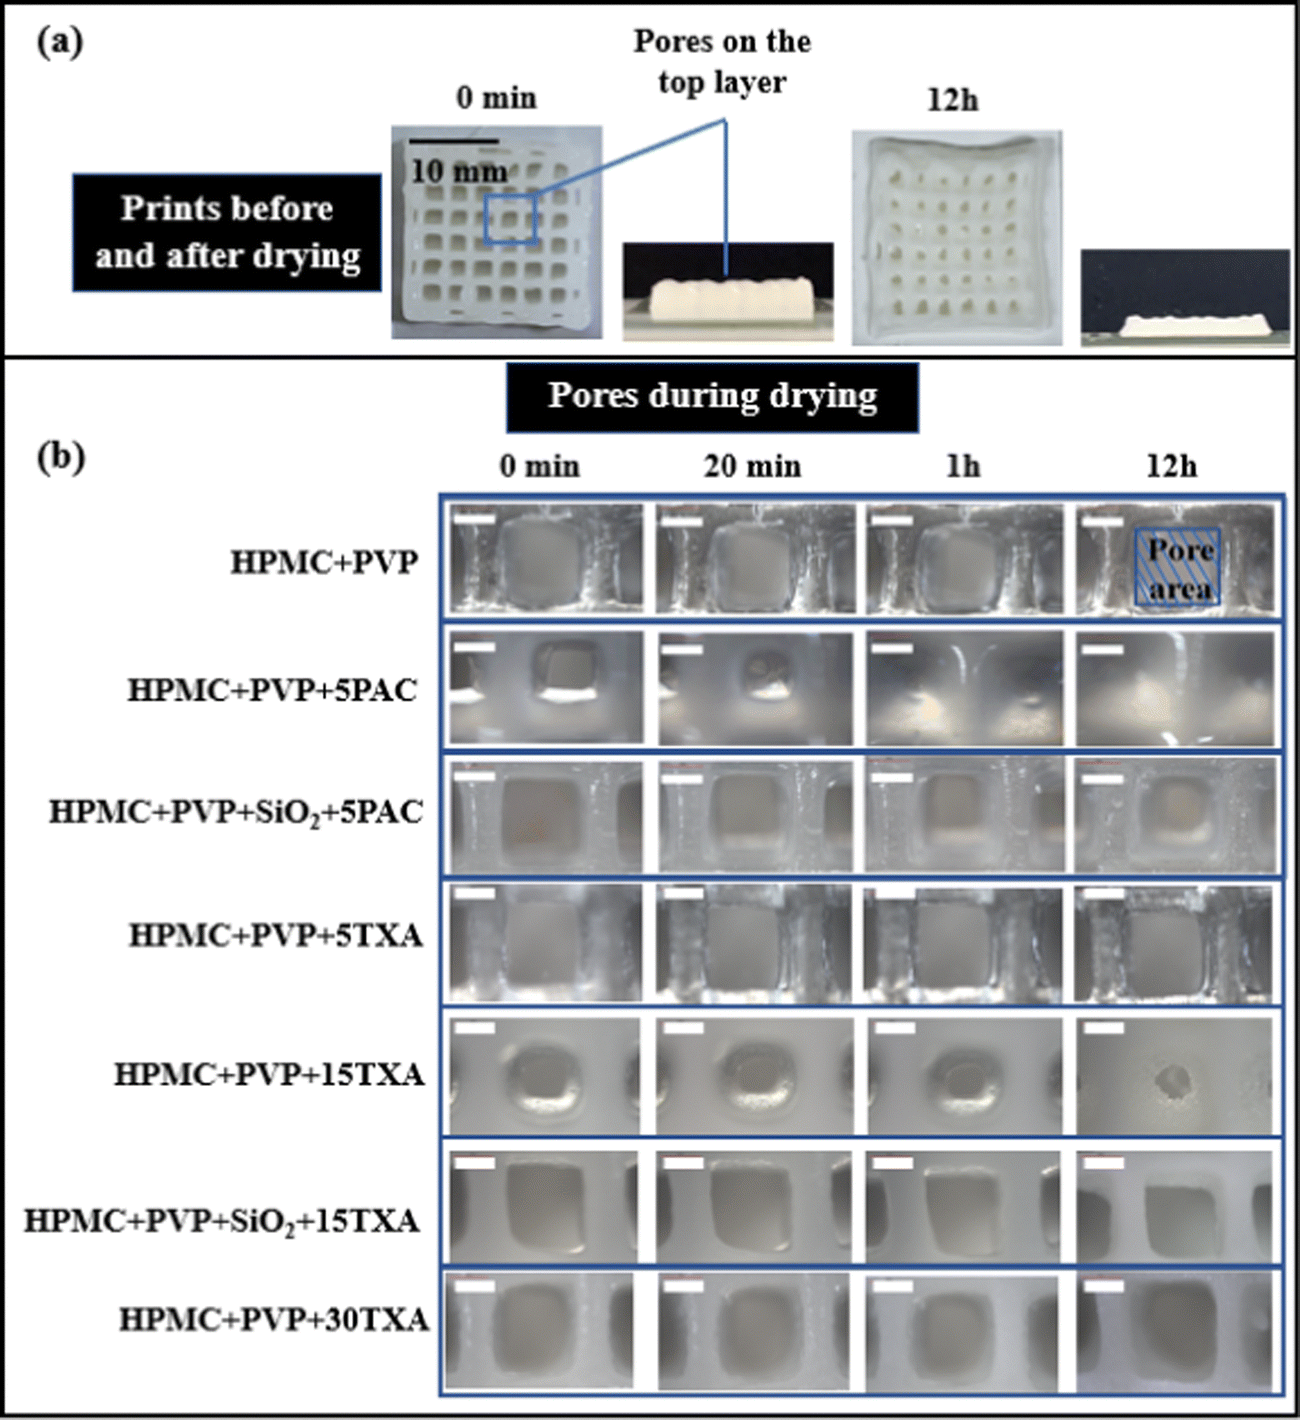 | ||
| Fig. 4 (a) 3D printed HPMC + PVP + 15TXA tablet immediately after printing (0 min) and 12 h post-drying at ambient temperature (21 °C); (b) the top pore area changes were observed at the time intervals (0 min, 20 min, 1 h and 12 h) for HPMC + PVP, HPMC + PVP + 5PAC, HPMC + PVP + SiO2 + 5PAC, HPMC + PVP + 5TXA, and HPMC + PVP + 15TXA, HPMC + PVP + SiO2 + 15TXA, and HPMC + PVP + 30TXA (scale bar in (b) represents 900 μm). | ||
As shown in Fig. 4(a), a great shrinkage in the thickness of all 3D printed tablets was identified. This shrinkage is due to the water loss of SSE 3D printed tablets during the drying process. Pore area changes (defined as the empty void between filaments, as shown in Fig. 4(b)) of the top layer of the prints were monitored for 12 hours during drying.
To evaluate the effect of API concentration on shape fidelity, a range of inks with different TXA concentrations (5, 15 and 30% w/w) were studied. As shown in Fig. 4, the shape fidelities of drug-loaded prints were compared to the blank ink base by utilising the pore structures as the key indicator. TXA was fully dissolved in ink when 5% w/w was loaded but partially dissolved at 15% and 30% w/w. This indicates that HPMC + PVP and HPMC + PVP + 5TXA inks initially had no solid contents. In contrast, HPMC + PVP + 15TXA ink contains an amount of solid crystalline drug particles and worse in HPMC + PVP + 30TXA.
As depicted in Fig. 4(b), HPMC + PVP, HPMC + PVP + 5TXA and HPMC + PVP + 30TXA prints showed small change in pore areas during drying, whereas HPMC + PVP + 15TXA print showed nearly 50.5 ± 1.1% pore area under-sizing during the 12 hours drying. This seems to contradict the observation in PAC where solid content increment would improve shape fidelity. The viscosity data shown in Fig. 3(d) revealed nearly identical viscosities of HPMC + PVP and HPMC + PVP + 5TXA inks, which are significantly higher than the viscosities of the inks with 15% and 30% w/w drug loading. It is clear at this point that the fully dissolved 5% w/w TXA showed no impact on the viscosity of the HPMC-PVP solution. This may explain the good shape fidelities of the HPMC + PVP and HPMC + PVP + 5TXA inks after printing and drying.
In 30% w/w TXA drug-loaded ink, consistent nozzle blockage was observed during 3D printing which impeded the replication of sample printing. This could be due to the accumulation of undissolved TXA and subsequent nozzle blockage (diameter of 413 μm) during the extrusion process of 3D printing. Therefore, only HPMC + PVP + 5TXA and HPMC + PVP + 15TXA 3D printed tablets were subjected to further investigation the effect of drug concentration on drug release. As the concentration of TXA increased, it was noted that the low-shear viscosity of HPMC + PVP + 15TXA and HPMC + PVP + 30TXA inks significantly reduced (p ≤ 0.05). Based on the observation of the rheological behaviour of 5% w/w drug-loaded ink against the blank, dissolved TXA within the ink did not affect the low-shear viscosity (p ≥ 0.05). This indicates the undissolved TXA particles have led to a viscosity reduction, particularly when high drug concentrations were loaded. For HPMC + PVP + 30TXA ink, the high amount of particulate contents could pack together during drying and subsequently inhibit the ink flow which resulted in the observed lack of pore area changes.26
The corresponding pore area under-sizing percentage with the time is shown in Fig. 5. The pores of HPMC + PVP + 5PAC prints were completely closed and disappeared after 12 hours of drying. HPMC + PVP + 15TXA showed a significant under-sizing in pore areas (p ≤ 0.05), but not a complete pore closure. The pore area of HPMC + PVP + 15TXA decreased by 50.5 ± 1.1% after 12 hours. The addition of SiO2 (which is an insoluble and structuring additive for both ink formulations) significantly improved (p ≤ 0.05) the shape fidelities of the prints after drying and avoided pore closures. HPMC + PVP+ SiO2 + 15TXA ink maintained the shape fidelity much better than HPMC + PVP + 15TXA during drying. This could be attributed to the high solid contents in the HPMC + PVP +SiO2 + 15TXA ink formula.
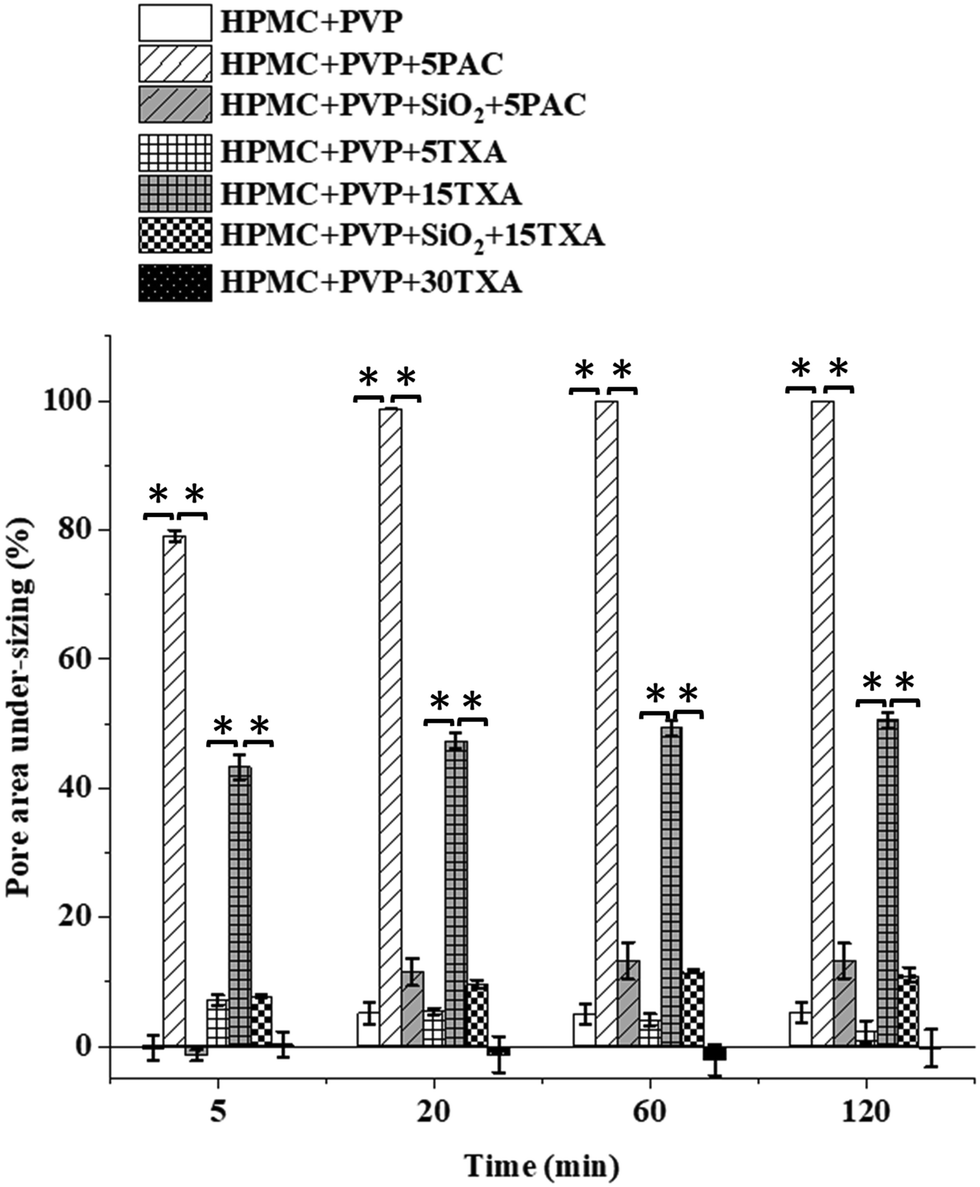 | ||
| Fig. 5 Pore area under-sizing (%) over time for the 3D printed tablets of HPMC + PVP, HPMC + PVP + 5PAC, HPMC + PVP + SiO2 + 5PAC, HPMC + PVP + 5TXA, and HPMC + PVP + 15TXA, HPMC + PVP + SiO2 + 15TXA and HPMC + PVP + 30TXA (* indicating p ≤ 0.05). | ||
The physical appearances and SEM images of post-drying 3D printed HPMC + PVP inks loaded with TXA and PAC are shown in Fig. 6. A greater pore area reduction occurred in the tablets printed using inks without SiO2, and the pores were completely sealed in the samples printed using the PAC-loaded ink. This is likely to be due to the decrease in the low-shear viscosity of ink (as shown in Fig. 3(d)). The addition of SiO2 to the inks increased the solid content of the inks. This led to a significant increase in the low-shear viscosities of inks (p ≤ 0.05) with both drugs in comparison to the inks without SiO2. The higher solid content translated into a lower solvent content and in turn shortened the drying. The higher viscosity led to weaker spreading and flow of the ink during drying. The combination of both high solid content and high viscosity led to the improvement in shape fidelity.
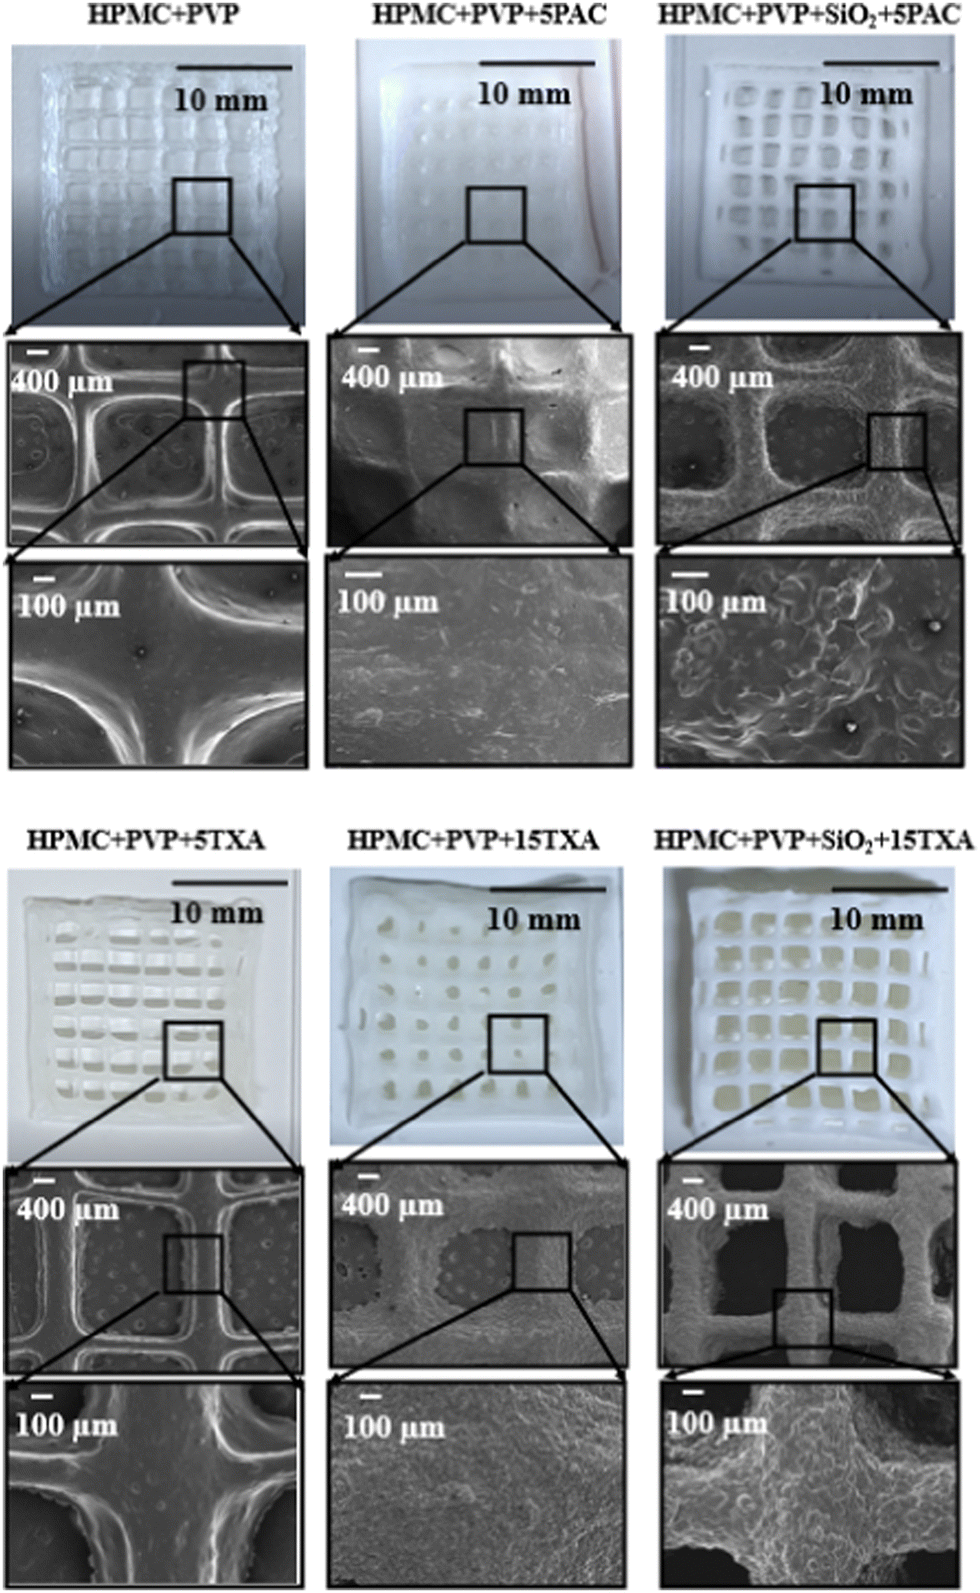 | ||
| Fig. 6 Physical appearances and SEM images of dried 3D printed tablets of HPMC + PVP, HPMC + PVP + 5PAC, HPMC + PVP + SiO2 + 5PAC, HPMC + PVP + 5TXA, and HPMC + PVP + 15TXA, HPMC + PVP + SiO2 + 15TXA. | ||
ATR-FTIR was carried out to investigate any possible molecular interactions between the polymer, additive, and API. The ATR-FTIR spectra of HPMC, PVP, PAC, TXA, physical mixture and dried SSE 3D printed tablets are shown in Fig. 7(a) and (b). The spectrum of HPMC shows an absorption band at 3445 cm−1 assigned to the stretching frequency of the hydroxyl (–OH) group. Other stretching vibration bands related to C–H and C–O were observed at 2929 cm−1 and 1056 cm−1, respectively. The peaks of pure HPMC were similar to the literature.57 The FTIR spectrum of PVP displays a peak at 3424 cm−1, assigned to O–H stretching. The peaks at 2950 cm−1 and 1652 cm−1 were assigned to asymmetric stretching of CH2 and stretching of C–O, respectively.58 As seen in Fig. 7(a), the spectrum of PAC shows a characteristic vibrational peak for NH stretching at 3326 cm−1 due to the presence of crystalline material.59,60
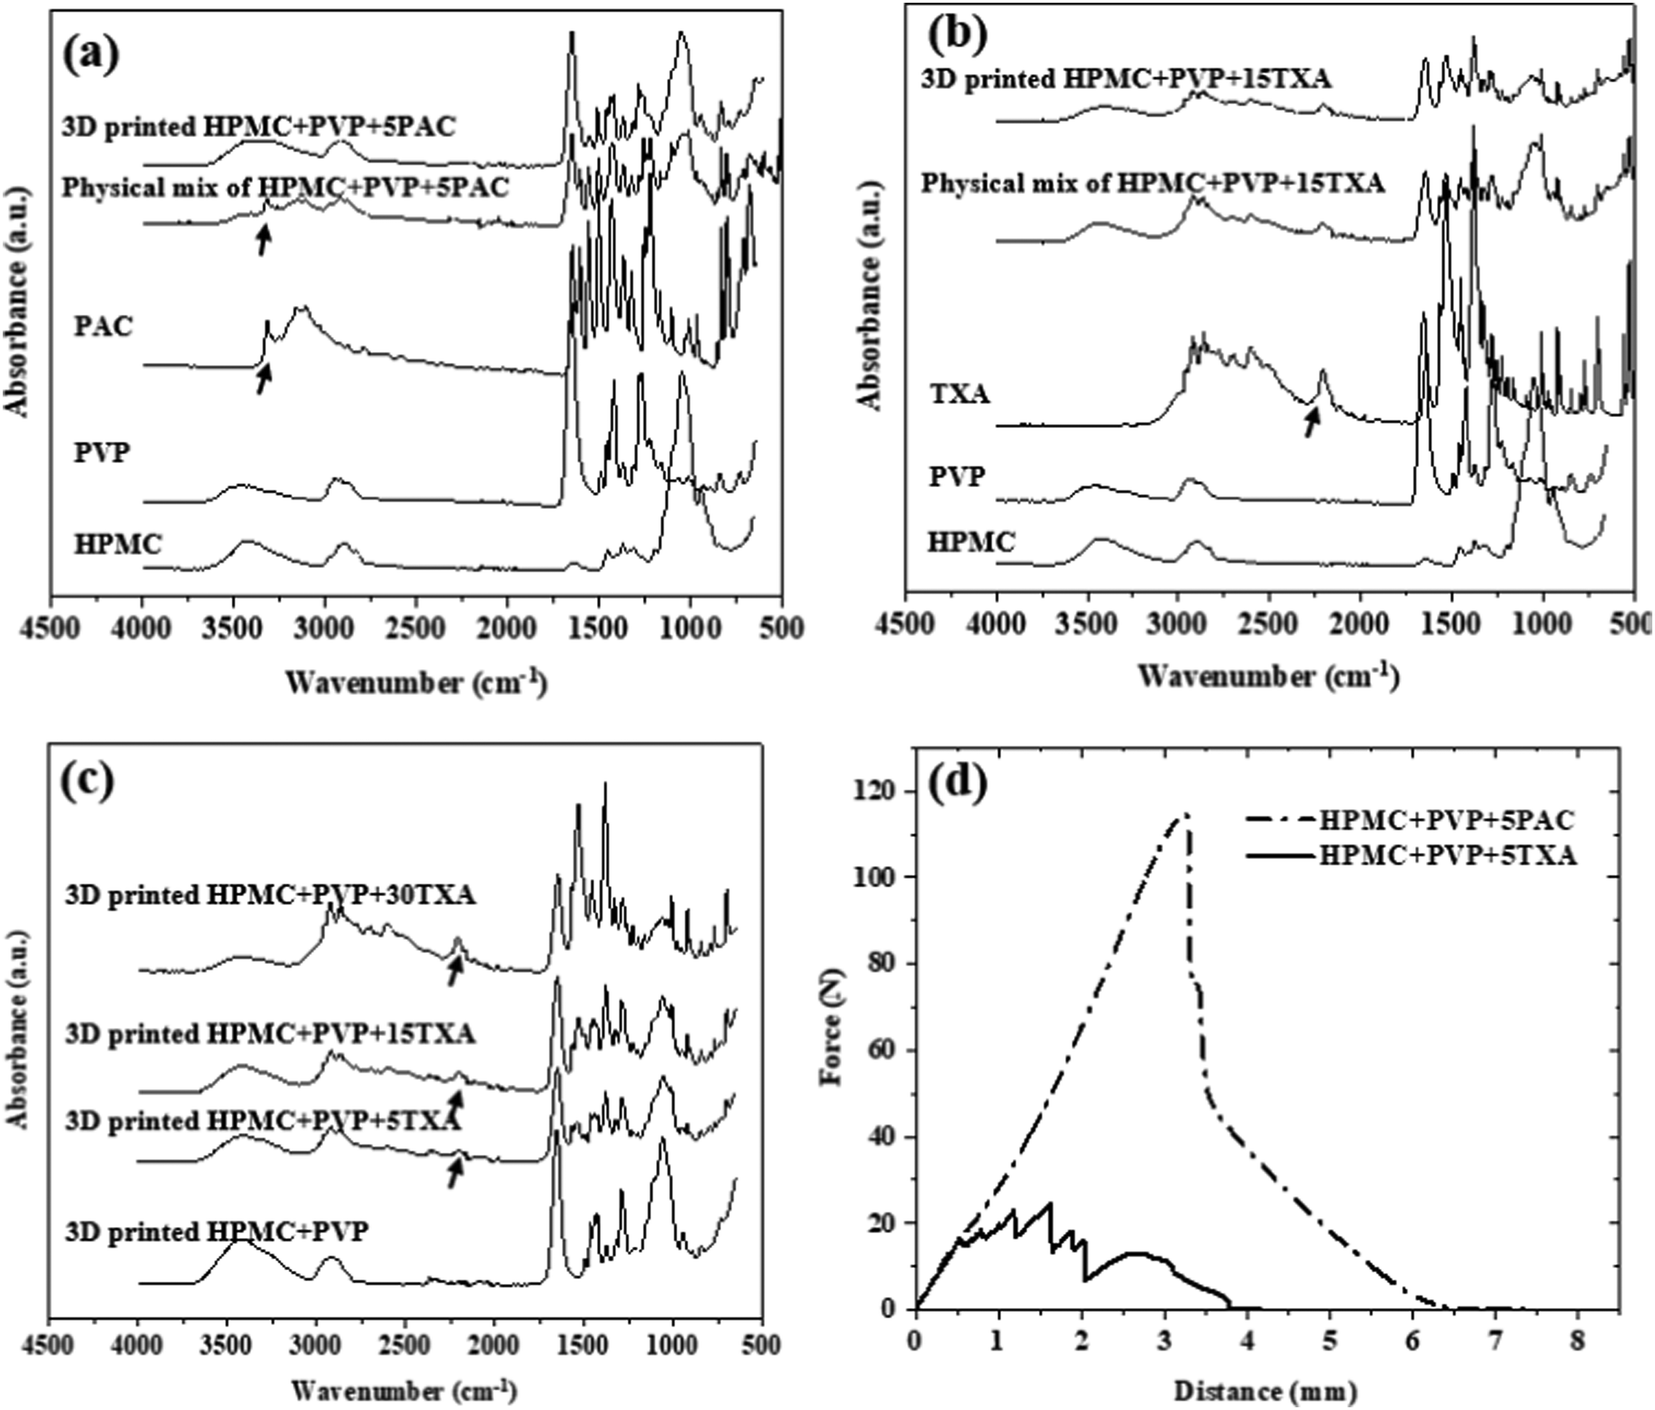 | ||
| Fig. 7 FTIR results of PAC-loaded HPMC + PVP 3D printed tablet (a), TXA-loaded HPMC + PVP 3D printed tablet (b), HPMC + PVP + TXA tablets with various TXA concentrations (c), and the mechanical properties of HPMC + PVP + 5PAC and HPMC + PVP + 5TXA tablets obtained from puncture tests. The curves displayed for the puncture test were plotted with average values from three replicates. | ||
In contrast to the pure PAC and physical mixture HPMC + PVP + PAC, the sharp peak of N–H stretching at 3326 cm−1 (as the arrow indicated in Fig. 7(a)) has disappeared in 3D printed HPMC + PVP + PAC. This is likely due to PVP interacting with PAC via hydrogen bonding and potentially reducing the crystallinity of PAC. This is also supported by the preliminary DSC data as shown in Fig. S3 (ESI†). The thermogram depicted a melting peak of PAC (159.50 ± 2.15 °C) in the physical mixture HPMC + PVP + PAC, but an absence in the dried SSE printed HPMC + PVP + PAC.
As seen in Fig. 7(b), the spectrum of TXA shows a strong cluster of peaks in the region 3000 to 2500 cm−1, representing both NH3+ and CH vibrational modes of TXA.22 There was no significant shift or new peak formation/disappearance in comparison to the physical mixture HPMC + PVP + TXA and 3D printed HPMC + PVP + TXA. FTIR spectra of HPMC + PVP + TXA tablets with various TXA concentrations as shown in Fig. 7(c) reported as the concentration increased from 5% to 30% w/w, the intensity of the characteristic peak in 2250 cm−1 increased as expected.
| Width (mm) | Length (mm) | Thickness (mm) | Pore area (mm2) | Tablet weight (mg) | Porosity (%) | |
|---|---|---|---|---|---|---|
| a The pores were fully merged during drying. | ||||||
| Influence of additive & API | ||||||
| HPMC + PVP | 19.9 ± 0.1 | 19.9 ± 0.1 | 1.3 ± 0.1 | 3.8 ± 0.1 | 203.8 ± 21.8 | 69.8 ± 1.9 |
| HPMC + PVP + 5TXA | 19.6 ± 0.4 | 19.4 ± 0.4 | 1.8 ± 0.1 | 3.9 ± 0.1 | 252.7 ± 16.3 | 72.0 ± 1.0 |
| HPMC + 15TXA | 18.5 ± 0.0 | 18.5 ± 0.1 | 1.8 ± 0.2 | 3.9 ± 0.1 | 144.2 ± 4.2 | 82.9 ± 1.3 |
| HPMC + PVP + 15TXA | 18.9 ± 0.1 | 18.7 ± 0.2 | 20.0 ± 0.0 | 2.0 ± 0.0 | 286.2 ± 1.3 | 67.7 ± 1.0 |
| HPMC + PVP + SiO2 + 15TXA | 17.7 ± 0.4 | 17.9 ± 0.3 | 2.4 ± 0.1 | 3.6 ± 0.1 | 312.7 ± 4.9 | 69.1 ± 2.6 |
| HPMC + PAC | 19.9 ± 0.2 | 20.0 ± 0.1 | 0.6 ± 0.0 | 1.8 ± 0.2 | 73.7 ± 11.1 | 76.4 ± 2.3 |
| HPMC + PVP + 5PAC | 19.6 ± 0.4 | 19.8 ± 0.2 | 0.9 ± 0.0 | 0a | 223.4 ± 3.3 | 47.6 ± 2.1 |
| HPMC + PVP + SiO2 + 5PAC | 19.8 ± 0.3 | 19.8 ± 0.3 | 1.5 ± 0.0 | 3.5 ± 0.1 | 231.4 ± 6.1 | 70.3 ± 0.2 |
| Influence of structural design | ||||||
| HPMC + PVP + 5TXA_4layer | 19.7 ± 0.1 | 19.6 ± 0.9 | 0.6 ± 0.1 | 3.9 ± 0.1 | 84.6 ± 11.3 | 70.6 ± 0.7 |
| HPMC + PVP + 15TXA_4layer | 19.7 ± 0.1 | 19.6 ± 0.1 | 0.5 ± 0.0 | 2.5 ± 0.8 | 81.2 ± 0.6 | 67.9 ± 0.8 |
| HPMC + PVP + 5TXA_14layer | 19.6 ± 0.4 | 19.4 ± 0.4 | 1.8 ± 0.1 | 3.9 ± 0.1 | 252.7 ± 16.3 | 72.0 ± 1.0 |
| HPMC + PVP + 15TXA_14layer | 18.9 ± 0.1 | 18.7 ± 0.2 | 2.0 ± 0.0 | 2.0 ± 0.0 | 286.2 ± 1.3 | 67.7 ± 1.0 |
| HPMC + PVP + 5TXA_25%infill | 19.6 ± 0.4 | 19.4 ± 0.4 | 1.8 ± 0.1 | 3.9 ± 0.1 | 252.7 ± 16.3 | 72.0 ± 1.0 |
| HPMC + PVP + 15TXA_25%infill | 18.9 ± 0.1 | 18.7 ± 0.2 | 2.0 ± 0.0 | 2.0 ± 0.0 | 286.2 ± 1.3 | 67.7 ± 1.0 |
| HPMC + PVP + 5TXA_50%infill | 18.3 ± 0.1 | 18.6 ± 0.0 | 1.9 ± 0.1 | 0.4 ± 0.1 | 357.7 ± 14.8 | 57.1 ± 1.0 |
| HPMC + PVP + 15TXA_50%infill | 18.7 ± 0.2 | 18.5 ± 0.0 | 2.1 ± 0.1 | 0a | 463.3 ± 1.8 | 48.5 ± 2.8 |
As expected, the layer number affects tablet thickness and weight. For instance, the tablet thickness and weight for HPMC + PVP + 5TXA_14 layer are roughly 3 times of HPMC + PVP + 5TXA_4 layer. No significant difference in width, length and thickness among the 3D printed tablets with different drug loadings and infills (HPMC + PVP + 5TXA_25%infill, HPMC + PVP + 15TXA_25%infill, HPMC + PVP + 5TXA_50%infill and HPMC + PVP + 15TXA_50%infill) were noted, but a significant difference regarding the tablet weight were expected.
3.2 Drug release of 3D printed tablets
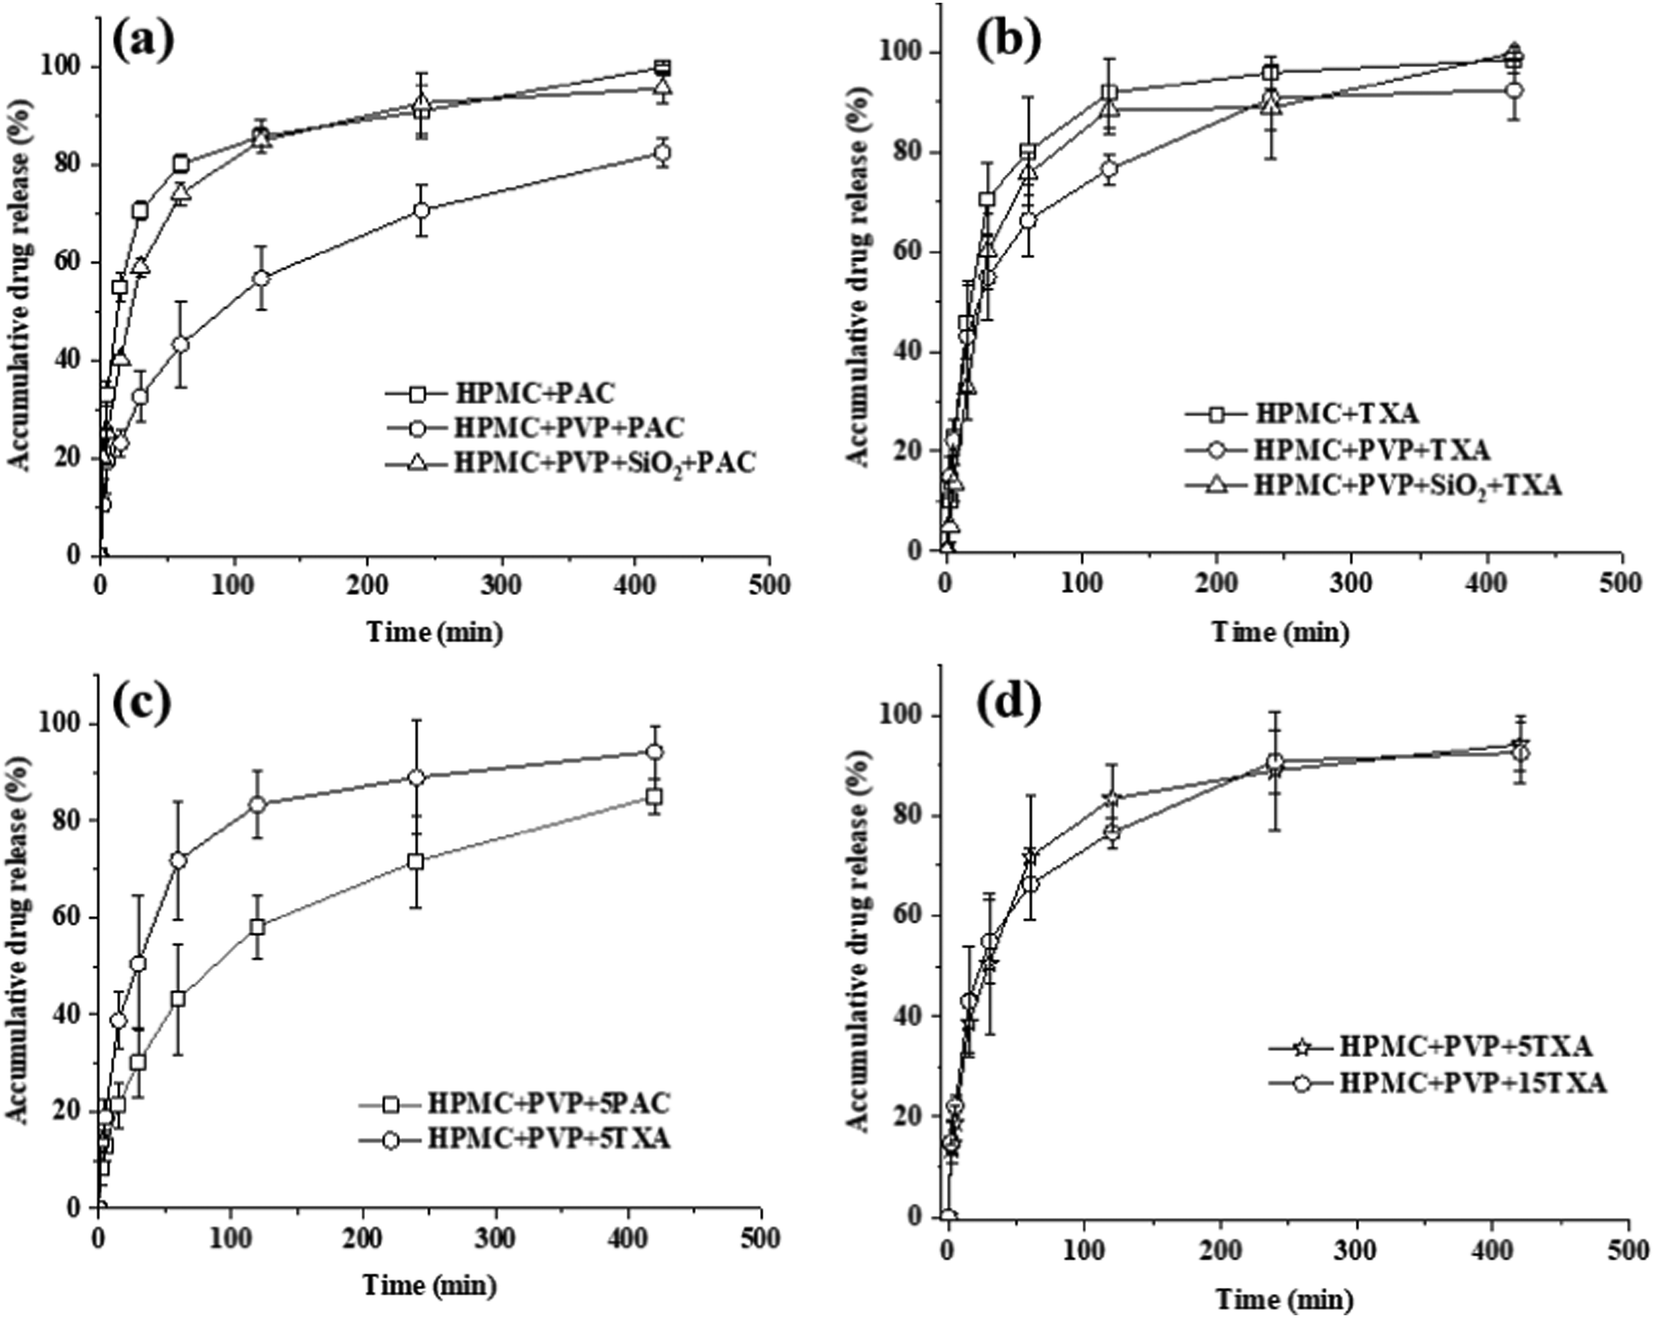 | ||
| Fig. 8 In vitro drug release data of SSE 3D printed tablets of (a) PAC-loaded tablets, (b) TXA-loaded tablets, (c) the influence of API type, and (d) the influence of API concentration. | ||
The influence of the additive on the in vitro drug release of the TXA-loaded 3D printed tablet is shown in Fig. 8(b). The addition of PVP and SiO2 showed no significant impacts on the drug release rate of HPMC + 15TXA, HPMC + PVP + 15TXA and HPMC + PVP + SiO2 + 15TXA tablets. As shown in Table 3, the pore area of HPMC + 15TXA, HPMC + PVP + 15TXA and HPMC + PVP + SiO2 + 15TXA are 3.9 ± 0.1, 2.0 ± 0.0 and 3.6 ± 0.1 mm2. Despite having the smallest pore area (67.7 ± 1.0%) within the dried prints, the porosity of HPMC + PVP + 15TXA is not significantly lower than HPMC + PVP + SiO2 + 15TXA (69.1 ± 2.6%). Thus, the drug release of HPMC + PVP + 15TXA was not significantly slower than the other two (i.e., HPMC + 15TXA and HPMC + PVP + SiO2 + 15TXA).
The influence of API type on the drug release rate is shown in Fig. 8(c). The drug release of PAC-loaded tablets was significantly lower than the one loaded with TXA, despite both having the same (5% w/w) drug loading in the ink. This is possibly due to the porosity of HPMC + PVP + 5TXA being significantly higher than HPMC + PVP + 5PAC, which are 72.0 ± 1.0% and 47.6 ± 2.1%, respectively. Another possible reason is TXA-based tablets can easily disintegrate during drug dissolution, which was proved by the puncture mechanical test where TXA tablets require much less force to puncture than PAC tablets. The influence of TXA concentration on drug release has been investigated and illustrated in Fig. 8(d). There was no significant difference between 5% and 15% w/w TXA drug loadings. Although the pore area of HPMC + PVP + 5TXA is higher than HPMC + PVP + 15TXA, yet, no significant difference (p > 0.05) was identified. This could be due to the limitation of measuring pore area by 2D-microscopy images, as porosity existed in three dimensions. Due to the advantage of 3D printing technique, it is possible to have voids in between the 3D printed HPMC + PVP + 15TXA_14layer despite a fully merged (pore area = 0 mm2) of the 2D pore area was observed.
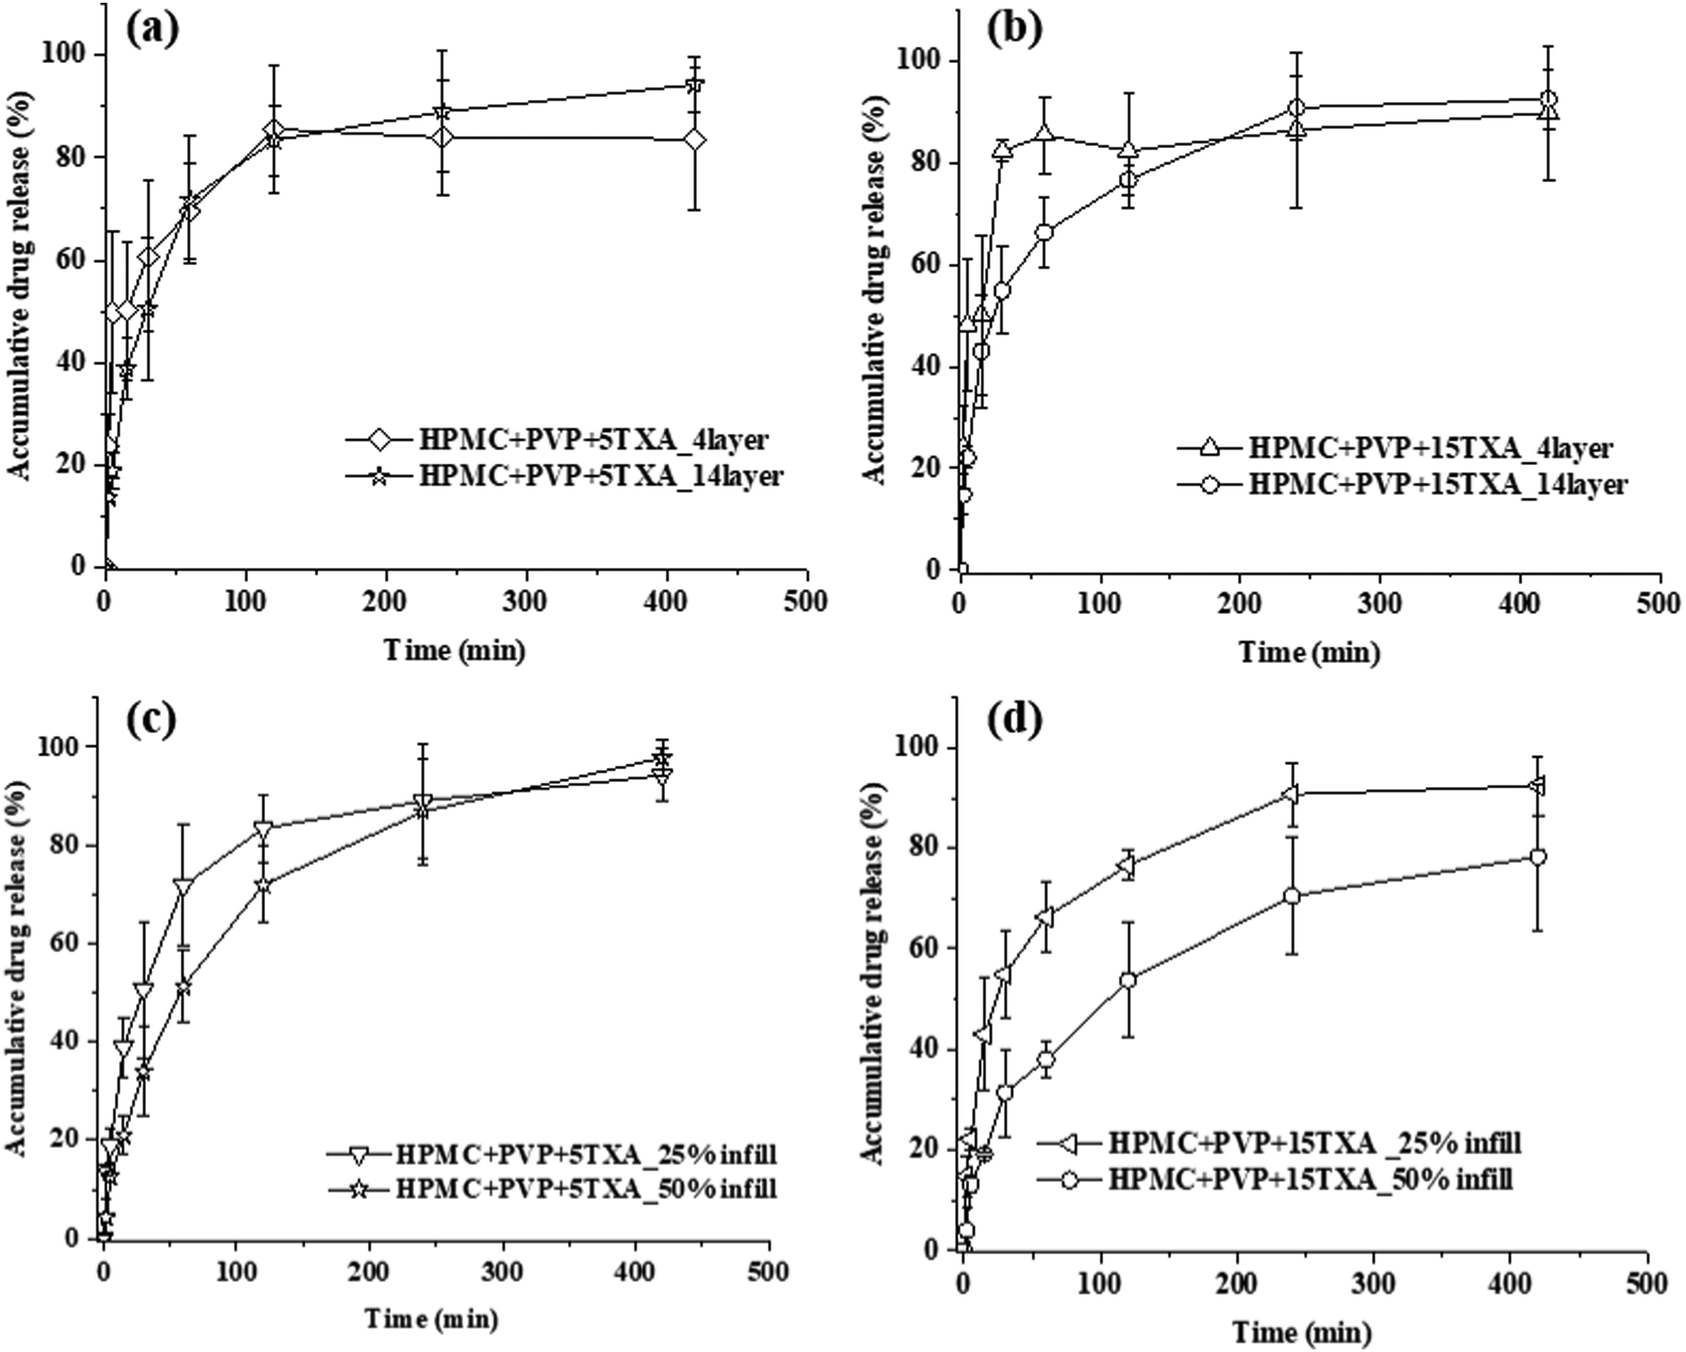 | ||
| Fig. 9 In vitro drug release profiles of (a) 5%TXA-loaded tablets and (b) 15%TXA-loaded tablets affected by layer number factor, and (c) 5%TXA-loaded tablets and (d) 15%TXA-loaded tablets affected by infill percentage. | ||
As shown in Fig. 9(b), when the loaded drug was increased to 15% w/w, where a significant amount of undissolved drug was present in the prints, the 4-layers drug release rate was significantly higher than the 14-layers between 60–120 minutes. This is possibly due to the higher pore area of 4-layers (2.0 ± 0.0 mm2) compared to 14-layer (2.5 ± 0.8 mm2).
The infill showed no effect on the drug release rate of the prints loaded with 5% w/w TXA (Fig. 9(c)) but significantly affected the prints loaded with 15% w/w TXA (Fig. 9(d)). This could be due to the significantly lower viscosity of 15% w/w TXA ink than the 5% w/w TXA ink and that resulted in an almost entirely merged of pores within the 3D printed HPMC + PVP + 15TXA tablets with 50% infill. The porosity of HPMC + PVP + 15TXA_50%infill and HPMC + PVP + 15TXA_25%infill were reported at 48.5 ± 2.8% and 57.1 ± 1.0%, respectively. In summary, the drug release rates of all TXA drug-loaded 3D printed tablets were lower than the pure TXA powder.
4. Conclusion
This study developed an understanding of the influence of additive and API on the prints of SSE 3D printing and their drug release performance. HPMC and binary polymeric system HPMC-PVP-based semisolid inks have been developed for SSE 3D tablet printing. The influence of additive (i.e., SiO2) and API (i.e., PAC and TXA) on ink rheology behaviour, 3D printing shape fidelity and drug release performance have been investigated and demonstrated. It was shown that the use of additive, API candidate selection and concentration could significantly affect the ink rheology behaviour and further change the shape fidelity of SSE 3D printed tablets. A clear relationship between the low shear viscosity of the semisolid ink and their printability was observed. The API (i.e., PAC and TXA) loaded inks for 3D printing showed more significant pore merging issues than the blank HPMC-PVP based inks. The addition of SiO2 proved to relieve the pore merging issue. This could be observed from the pore area improvement of HPMC + PVP + SiO2 + 5PAC prints at 3.5 ± 0.1 mm2 compared to the completely closed (0 mm2) HPMC + PVP + 5PAC prints after 12 hours of drying. HPMC + PVP + 15TXA formulation showed a significant under-sizing in pore areas (p ≤ 0.05) at 50.5 ± 1.1% after 12 hours of drying. The addition of SiO2 significantly improved the pore area of the prints to 41.0 ± 2.2%. The drug release study showed the drug release rate was affected by the selection of polymeric system and API. PVP showed a significant delay (p ≤ 0.05) in the drug release of PAC-loaded tablets, possibly due to the poor porosity. Besides, it was noted that the structural properties of 3D printed tablets also affected drug release. Investigation into the layer numbers and infill density showed the layer number had little effect but the infill percentage of TXA tablets significantly influenced drug release, probably due to the effects of pore merging. The insights reported in this study could serve as practical guidance for ink development in fabricating a controlled performance SSE 3D printed porous formulation for personalised pharmaceuticals.Conflicts of interest
There are no conflicts to declare.Acknowledgements
This research was funded by the Redistributed Manufacturing in Healthcare Network (RiHN). RiHN was awarded a grant from the UK Engineering and Physical Sciences Research Council (EPSRC) (Ref. EP/T014970/1). The authors would like to thank Thomas McDonagh for his help with the mechanical testing.References
- W.-K. Hsiao, B. Lorber, H. Reitsamer and J. Khinast, 3D printing of oral drugs: a new reality or hype?, Expert Opin. Drug Delivery, 2018, 15(1), 1–4 CrossRef.
- K. Wening and J. Breitkreutz, Oral drug delivery in personalized medicine: unmet needs and novel approaches, Int. J. Pharm., 2011, 404(1–2), 1–9 CrossRef CAS.
- P. R. Martinez, A. Goyanes, A. W. Basit and S. Gaisford, Fabrication of drug-loaded hydrogels with stereolithographic 3D printing, Int. J. Pharm., 2017, 532(1), 313–317 CrossRef CAS PubMed.
- S. Asikainen, B. van Bochove and J. V. Seppälä, Drug-releasing biopolymeric structures manufactured via stereolithography, Biomed. Phys. Eng. Express, 2019, 5(2), 025008 CrossRef.
- F. Fina, A. Goyanes, C. M. Madla, A. Awad, S. J. Trenfield and J. M. Kuek, et al., 3D printing of drug-loaded gyroid lattices using selective laser sintering, Int. J. Pharm., 2018, 547(1–2), 44–52 CrossRef CAS PubMed.
- H. Wickström, E. Hilgert, J. O. Nyman, D. Desai, D. Şen Karaman, T. D. Beer, N. Sandler and J. M. Rosenholm, et al., Inkjet printing of drug-loaded mesoporous silica nanoparticles—A platform for drug development, Molecules, 2017, 22(11), 2020 CrossRef.
- R. D. Boehm, P. R. Miller, J. Daniels, S. Stafslien and R. J. Narayan, Inkjet printing for pharmaceutical applications, Mater. Today, 2014, 17(5), 247–252 CrossRef CAS.
- M. Alhijjaj, J. Nasereddin, P. Belton and S. Qi, Impact of processing parameters on the quality of pharmaceutical solid dosage forms produced by fused deposition modeling (FDM), Pharmaceutics, 2019, 11(12), 633 CrossRef CAS.
- H. E. Gültekin, S. Tort and F. Acartürk, An Effective Technology for the Development of Immediate Release Solid Dosage Forms Containing Low-Dose Drug: Fused Deposition Modeling 3D Printing, Pharm. Res., 2019, 36(9), 128 CrossRef PubMed.
- A. Goyanes, P. R. Martinez, A. Buanz, A. W. Basit and S. Gaisford, Effect of geometry on drug release from 3D printed tablets, Int. J. Pharm., 2015, 494(2), 657–663 CrossRef CAS PubMed.
- C. Korte and J. Quodbach, 3D-printed network structures as controlled-release drug delivery systems: dose adjustment, API release analysis and prediction, AAPS PharmSciTech, 2018, 19(8), 3333–3342 CrossRef CAS.
- A. Goyanes, N. Allahham, S. J. Trenfield, E. Stoyanov, S. Gaisford and A. W. Basit, Direct powder extrusion 3D printing: Fabrication of drug products using a novel single-step process, Int. J. Pharm., 2019, 567, 118471 CrossRef CAS.
- J. Boniatti, P. Januskaite, L. Bd Fonseca, A. L. Viçosa, F. C. Amendoeira and C. Tuleu, et al., Direct powder extrusion 3d printing of praziquantel to overcome neglected disease formulation challenges in paediatric populations, Pharmaceutics, 2021, 13(8), 1114 CrossRef CAS.
- S. A. Sánchez-Guirales, N. Jurado, A. Kara, A. Lalatsa and D. R. Serrano, Understanding direct powder extrusion for fabrication of 3D printed personalised medicines: A case study for nifedipine minitablets, Pharmaceutics, 2021, 13(10), 1583 CrossRef PubMed.
- T. Mcdonagh, P. Belton and S. Qi, An investigation into the effects of geometric scaling and pore structure on drug dose and release of 3D printed solid dosage forms, Eur. J. Pharm. Biopharm., 2022, 177, 113–125 CrossRef CAS.
- T. McDonagh, P. Belton and S. Qi, Direct granule feeding of thermal droplet deposition 3D printing of porous pharmaceutical solid dosage forms free of plasticisers, Pharm. Res., 2022, 39(3), 599–610 CrossRef CAS PubMed.
- B. Zhang, A. Gleadall, P. Belton, T. Mcdonagh, R. Bibb and S. Qi, New insights into the effects of porosity, pore length, pore shape and pore alignment on drug release from extrusionbased additive manufactured pharmaceuticals, Addit. Manuf., 2021, 46, 102196 CAS.
- J. M. Nasereddin, N. Wellner, M. Alhijjaj, P. Belton and S. Qi, Development of a simple mechanical screening method for predicting the feedability of a pharmaceutical FDM 3D printing filament, Pharm. Res., 2018, 35(8), 151 CrossRef.
- A. Goyanes, F. Fina, A. Martorana, D. Sedough, S. Gaisford and A. W. Basit, Development of modified release 3D printed tablets (printlets) with pharmaceutical excipients using additive manufacturing, Int. J. Pharm., 2017, 527(1–2), 21–30 CrossRef CAS.
- A. Isreb, K. Baj, M. Wojsz, M. Isreb, M. Peak and M. A. Alhnan, 3D printed oral theophylline doses with innovative ‘radiator-like’design: Impact of polyethylene oxide (PEO) molecular weight, Int. J. Pharm., 2019, 564, 98–105 CrossRef CAS.
- N. Dumpa, A. Butreddy, H. Wang, N. Komanduri, S. Bandari and M. A. Repka, 3D printing in personalized drug delivery: An overview of hot-melt extrusion-based fused deposition modeling, Int. J. Pharm., 2021, 600, 120501 CrossRef CAS PubMed.
- B. Zhang, X. Y. Teoh, J. Yan, A. Gleadall, P. Belton and R. Bibb, et al., Development of combi-pills using the coupling of semi-solid syringe extrusion 3D printing with fused deposition modelling, Int. J. Pharm., 2022, 625, 122140 CrossRef CAS PubMed.
- R. L. Truby and J. A. Lewis, Printing soft matter in three dimensions, Nature, 2016, 540(7633), 371–378 CrossRef CAS.
- J. L. Dávila and M. A. d’Ávila, Rheological evaluation of LAPONITE®/alginate inks for 3D extrusion-based printing, Int. J. Adv. Manuf. Technol., 2019, 101(1–4), 675–686 CrossRef.
- B. Zhang, R. Cristescu, D. B. Chrisey and R. J. Narayan, Solvent-based Extrusion 3D Printing for the Fabrication of Tissue Engineering Scaffolds, Int. J. Bioprint., 2020, 6(1), 211, DOI:10.18063/ijb.v6i1.211.
- X.-Y. Teoh, B. Zhang, P. Belton, S.-Y. Chan and S. Qi, The effects of solid particle containing inks on the printing quality of porous pharmaceutical structures fabricated by 3D semi-solid extrusion printing, Pharm. Res., 2022, 39(6), 1267–1279 CrossRef CAS.
- I. Seoane-Viaño, P. Januskaite, C. Alvarez-Lorenzo, A. W. Basit and A. Goyanes, Semi-solid extrusion 3D printing in drug delivery and biomedicine: Personalised solutions for healthcare challenges, J. Controlled Release, 2021, 332, 367–389 CrossRef PubMed.
- Y. Cheng, H. Qin, N. C. Acevedo, X. Jiang and X. Shi, 3D Printing of Extended-Release Tablets of Theophylline Using Hydroxypropyl Methylcellulose (HPMC) Hydrogels, Int. J. Pharm., 2020, 119983 CrossRef CAS.
- B. G. Compton and J. A. Lewis, 3D-printing of lightweight cellular composites, Adv. Mater., 2014, 26(34), 5930–5935 CrossRef CAS.
- M. Cui, H. Pan, D. Fang, S. Qiao, S. Wang and W. Pan, Fabrication of high drug loading levetiracetam tablets using semi-solid extrusion 3D printing, J. Drug Delivery Sci. Technol., 2020, 57, 101683 CrossRef CAS.
- S. A. Khaled, M. R. Alexander, R. D. Wildman, M. J. Wallace, S. Sharpe and J. Yoo, et al., 3D extrusion printing of high drug loading immediate release paracetamol tablets, Int. J. Pharm., 2018, 538(1–2), 223–230 CrossRef CAS.
- S. A. Khaled, J. C. Burley, M. R. Alexander, J. Yang and C. J. Roberts, 3D printing of five-in-one dose combination polypill with defined immediate and sustained release profiles, J. Controlled Release, 2015, 217, 308–314 CrossRef CAS PubMed.
- B. Zhang, A. K. Nguyen, R. J. Narayan and J. Huang, Direct ink writing of vancomycin-loaded polycaprolactone/polyethylene oxide/hydroxyapatite 3D scaffolds, J. Am. Ceram. Soc., 2022, 105(3), 1821–1840 CrossRef CAS.
- S. A. Khaled, J. C. Burley, M. R. Alexander and C. J. Roberts, Desktop 3D printing of controlled release pharmaceutical bilayer tablets, Int. J. Pharm., 2014, 461(1–2), 105–111 CrossRef CAS PubMed.
- J. Firth, A. W. Basit and S. Gaisford, The role of semi-solid extrusion printing in clinical practice, 3D printing of pharmaceuticals, 2018, pp.133–51 Search PubMed.
- E. Sjöholm and N. Sandler, Additive manufacturing of personalized orodispersible warfarin films, Int. J. Pharm., 2019, 564, 117–123 CrossRef PubMed.
- T.-T. Yan, Z.-F. Lv, P. Tian, M.-M. Lin, W. Lin and S.-Y. Huang, et al., Semi-solid extrusion 3D printing ODFs: an individual drug delivery system for small scale pharmacy, Drug Dev. Ind. Pharm., 2020, 46(4), 531–538 CrossRef CAS.
- K. Rycerz, K. A. Stepien, M. Czapiewska, B. T. Arafat, R. Habashy and A. Isreb, et al., Embedded 3D printing of novel bespoke soft dosage form concept for pediatrics, Pharmaceutics, 2019, 11(12), 630 CrossRef CAS PubMed.
- T. Tagami, E. Ito, R. Kida, K. Hirose, T. Noda and T. Ozeki, 3D printing of gummy drug formulations composed of gelatin and an HPMC-based hydrogel for pediatric use, Int. J. Pharm., 2021, 594, 120118 CrossRef CAS PubMed.
- S. A. Khaled, J. C. Burley, M. R. Alexander, J. Yang and C. J. Roberts, 3D printing of tablets containing multiple drugs with defined release profiles, Int. J. Pharm., 2015, 494(2), 643–650 CrossRef CAS.
- E. Díaz-Torres, L. Rodríguez-Pombo, J. J. Ong, A. W. Basit, A. Santoveña-Estévez and J. B. Fariña, et al., Integrating pressure sensor control into semi-solid extrusion 3D printing to optimize medicine manufacturing, Int. J. Pharm.: X, 2022, 4, 100133 Search PubMed.
- A. Goyanes, C. M. Madla, A. Umerji, G. D. Piñeiro, J. M. G. Montero and M. J. L. Diaz, et al., Automated therapy preparation of isoleucine formulations using 3D printing for the treatment of MSUD: First single-centre, prospective, crossover study in patients, Int. J. Pharm., 2019, 567, 118497 CrossRef CAS.
- K. Vithani, A. Goyanes, V. Jannin, A. W. Basit, S. Gaisford and B. J. Boyd, An overview of 3D printing technologies for soft materials and potential opportunities for lipid-based drug delivery systems, Pharm. Res., 2019, 36(1), 1–20 CrossRef PubMed.
- K. Sung, P. R. Nixon, J. W. Skoug, T. R. Ju, P. Gao and E. Topp, et al., Effect of formulation variables on drug and polymer release from HPMC-based matrix tablets, Int. J. Pharm., 1996, 142(1), 53–60 CrossRef CAS.
- Y. Kaneda, Y. Tsutsumi, Y. Yoshioka, H. Kamada, Y. Yamamoto and H. Kodaira, et al., The use of PVP as a polymeric carrier to improve the plasma half-life of drugs, Biomaterials, 2004, 25(16), 3259–3266 CrossRef CAS PubMed.
- K. K. Qian and R. H. Bogner, Application of mesoporous silicon dioxide and silicate in oral amorphous drug delivery systems, J. Pharm. Sci., 2012, 101(2), 444–463 CrossRef CAS PubMed.
- D. T. Friesen, R. Shanker, M. Crew, D. T. Smithey, W. Curatolo and J. Nightingale, Hydroxypropyl methylcellulose acetate succinate-based spray-dried dispersions: an overview, Mol. Pharmaceutics, 2008, 5(6), 1003–1019 CrossRef CAS.
- H. Pertoft, T. C. Laurent, T. Låås and L. Kågedal, Density gradients prepared from colloidal silica particles coated by polyvinylpyrrolidone (Percoll), Anal. Biochem., 1978, 88(1), 271–282 CrossRef CAS.
- M. Haghi, W. van den Oetelaar, L. M. Moir, B. Zhu, G. Phillips and J. Crapper, et al., Inhalable tranexamic acid for haemoptysis treatment, Eur. J. Pharm. Biopharm., 2015, 93, 311–319 CrossRef CAS PubMed.
- S. Nekrashevich and V. Gritsenko, Electronic structure of silicon dioxide (a review), Phys. Solid State, 2014, 56, 207–222 CrossRef CAS.
- W. Kaialy, H. Larhrib, B. Chikwanha, S. Shojaee and A. Nokhodchi, An approach to engineer paracetamol crystals by antisolvent crystallization technique in presence of various additives for direct compression, Int. J. Pharm., 2014, 464(1–2), 53–64 CrossRef CAS PubMed.
- G. G. Mohamed, E. Y. Frag and A. A. Sedeek, Spectrophotometric methods for determination of tranexamic acid and etamsylate in pure form and pharmaceutical formulation, Insight Pharm. Sci., 2015, 5, 1–7 CrossRef.
- Z. Kane, R. Picetti, A. Wilby, J. F. Standing, S. Grassin-Delyle and I. Roberts, et al., Physiologically based modelling of tranexamic acid pharmacokinetics following intravenous, intramuscular, sub-cutaneous and oral administration in healthy volunteers, Eur. J. Pharm. Sci., 2021, 164, 105893 CrossRef CAS.
- F. S. Moghrabi and H. M. Fadda, Drug Physicochemical Properties and Capsule Fill Determine Extent of Premature Gastric Release from Enteric Capsules, Pharmaceutics, 2022, 14(11), 2505 CrossRef CAS PubMed.
- Y. A. Gueche, N. M. Sanchez-Ballester, B. Bataille, A. Aubert, J.-C. Rossi and I. Soulairol, Investigating the potential plasticizing effect of di-carboxylic acids for the manufacturing of solid oral forms with copovidone and ibuprofen by selective laser sintering, Polymers, 2021, 13(19), 3282 CrossRef CAS.
- Z. Lu and R. Fassihi, Influence of colloidal silicon dioxide on gel strength, robustness, and adhesive properties of diclofenac gel formulation for topical application, AAPS PharmSciTech, 2015, 16, 636–644 CrossRef CAS.
- F. M. Iqbal, M. Ahmad and U. R. Tulain, Microwave radiation induced synthesis of hydroxypropyl methylcellulose-graft-(polyvinylalcohal-co-acrylic acid) polymeric network and its in vitro evaluation, Acta Pol. Pharm., 2017, 74(2), 527–541 CAS.
- A. Rahma, M. M. Munir, A. Prasetyo, V. Suendo and H. Rachmawati, Intermolecular interactions and the release pattern of electrospun curcumin-polyvinyl (pyrrolidone) fiber, Biol. Pharm. Bull., 2016, 39(2), 163–173 CrossRef CAS PubMed.
- M. Zhao, S. A. Barker, P. S. Belton, C. McGregor and D. Q. Craig, Development of fully amorphous dispersions of a low Tg drug via co-spray drying with hydrophilic polymers, Eur. J. Pharm. Biopharm., 2012, 82(3), 572–579 CrossRef CAS PubMed.
- H. A. Moynihan and I. P. O'Hare, Spectroscopic characterisation of the monoclinic and orthorhombic forms of paracetamol, Int. J. Pharm., 2002, 247(1–2), 179–185 CrossRef CAS PubMed.
- I. El Aita, J. Breitkreutz and J. Quodbach, On-demand manufacturing of immediate release levetiracetam tablets using pressure-assisted microsyringe printing, Eur. J. Pharm. Biopharm., 2019, 134, 29–36 CrossRef CAS.
- S. Qi, B. Zhang and T. McDonagh, Three-dimensional Printed Implantable Products, Implantable Technologies, 2021. pp. 252–295 Search PubMed.
Footnote |
| † Electronic supplementary information (ESI) available. See DOI: https://doi.org/10.1039/d3tb01868g |
| This journal is © The Royal Society of Chemistry 2024 |