
 Open Access Article
 This Open Access Article is licensed under a
 Creative Commons Attribution 3.0 Unported Licence
Synergistic enhancement of photocatalytic hydrogen production in TiO2 nanosheets through light-induced defect formation and Pt single atoms†
Majid
Shahsanaei
 a,
Nastaran
Farahbakhsh
a,
Sadegh
Pour-Ali
bc,
Annika
Schardt
d,
Setareh
Orangpour
a,
Carsten
Engelhard
de,
Shiva
Mohajernia
b,
Manuela S.
Killian
*a and
Sina
Hejazi
*af
a,
Nastaran
Farahbakhsh
a,
Sadegh
Pour-Ali
bc,
Annika
Schardt
d,
Setareh
Orangpour
a,
Carsten
Engelhard
de,
Shiva
Mohajernia
b,
Manuela S.
Killian
*a and
Sina
Hejazi
*af
aChemistry and Structure of Novel Materials, Department of Chemistry and Biology, University of Siegen, Paul-Bonatz-Str. 9-11, 57076 Siegen, Germany. E-mail: manuela.killian@uni-siegen.de
bFaculty of Materials Engineering, Sahand University of Technology, Tabriz, 51335-1996, Iran
cDepartment of Chemical and Materials Engineering, NRGMATs, University of Alberta, Donadeo Innovation Centre for Engineering, Edmonton, Canada
dAnalytical Chemistry, Department of Chemistry and Biology, University of Siegen, Adolf-Reichwein-Str. 2, D-57076 Siegen, Germany
eFederal Institute for Materials Research and Testing (BAM), Richard-Willstätter Str. 11, D-12489 Berlin, Germany
fNational Research Council, Nanotechnology Research Centre, Edmonton, Alberta T6G 2M9, Canada. E-mail: hejazi.sina@ualberta.ca
First published on 20th June 2024
Abstract
In this investigation, we present a direct method employing UV-light radiation to induce point defects, specifically Ti3+ and VO, onto the surface of TiO2 nanosheets (TiO2-NSs) and efficiently decorate them with Pt particles. The addition of the Pt precursor is carried out during rest periods following UV-light cessation (light-induced samples, LI) and during UV-light exposure (photo-deposited samples, PD). The size and distribution of Pt particles on both LI and PD TiO2-NSs are systematically correlated with varying resting times, enabling precise control over Pt loading. The characterization of various TiO2-NSs is extensively conducted using microscopy techniques (FESEM, TEM, and HAADF-STEM) and spectroscopy (XPS). Gas chromatography is also employed for the evaluation of the H2 photocatalytic performance of various samples. Our findings reveal that Pt particles deposit on the TiO2-NSs surfaces as nanoparticles under illumination. After a 5 minutes resting time, a combination of Pt single atoms (SAs) and clusters, with a maximum loading of 0.37 at%, is formed. Extending the resting time to 60 minutes results in a gradual reduction in Pt SAs and clusters, leading to the deposition of Pt nanoparticles with lower loadings. Notably, Pt SAs and clusters exhibit superior performance in hydrogen evolution, showcasing a remarkable 4000-fold increase over pristine TiO2-NSs. Additionally, sustained UV radiation during Pt addition in the photo-deposited samples results in the formation of Pt nanoparticles with lower loading compared to LI samples, consequently diminishing photocatalytic hydrogen production. This study not only provides insights into the controlled manipulation of Pt SAs on TiO2-NSs but also highlights their exceptional efficacy in hydrogen evolution, offering valuable contributions to the design of efficient photocatalytic systems for sustainable hydrogen generation.
1. Introduction
Titanium dioxide (TiO2) is a versatile and multifunctional material that has gained significant attention in the context of clean energy technologies.1,2 Remarkable attributes, such as abundant availability, biocompatibility, environmental benignity, high chemical stability, and low cost, make it an appealing candidate for a variety of applications, particularly in the realm of energy conversion.3 One of its most promising features is its photocatalytic activity, which allows it to harness solar energy for the generation of clean and renewable energy sources.3–5 However, the material's inherent limitations, including a high recombination rate of photoexcited electron–hole pairs and sluggish kinetics for H2 evolution, have necessitated the use of metal cocatalysts to achieve high photocatalytic performance.4,6–8 Among a number of studied cocatalysts, Pt has consistently demonstrated superior performance and is often employed as a benchmark ref. 9 and 10. Up to now, the widespread adoption of Pt in large-scale applications is increasingly challenged by its high cost and limited availability.11–14Recent advancements in catalysis have introduced a transformative approach, the utilization of single atoms (SAs) of metal cocatalysts, representing a new frontier in the field this emerging paradigm is driven by the pursuit of maximum atom utilization and the augmentation of reactivity through the dispersion of uncoordinated metal ions on photocatalysts such as TiO2.15–18 By downsizing metal nanoparticles into the SAs, Pt utilization efficiency is significantly enhanced without compromising photocatalytic efficiency.19–26 Several strategies have been developed for decorating single-atom catalysts (SACs) onto TiO2 nanostructures, resulting in improved catalytic efficacy.27 However, a notable challenge arises when utilizing Pt SAs is their thermodynamic instability due to high surface energies, which predisposes them to agglomeration during reaction cycles.28–30 Consequently, it becomes imperative to pin SACs onto the TiO2.31 This necessitates the utilization of a high surface area support with sufficiently strong coordination sites to effectively anchor Pt SAs.32 Addressing this challenge is pivotal in harnessing the full potential of single atom catalysts on TiO2 for enhanced energy conversion.30 It's important to highlight that materials with reduced dimensions, such as one-dimensional TiO2 nanotubes and two-dimensional (2D) nanosheets characterized by their extensive surface areas, also enable short-distance diffusion of photoinduced charge carriers.9,33–38 This phenomenon serves to enhance the separation of these carriers, consequently leading to an increase in photocatalytic performance.6,36 In recent developments, 2D TiO2 nanosheets (TiO2-NSs) have found applications in rechargeable batteries.39,40 This is attributed to their unique structural features, namely open channels along the [010] direction, which assist the efficient transport of Li ions.41
The practice of point defect engineering, specifically the introduction of Ti3+ and oxygen vacancies (VO), has emerged as a highly effective strategy for enhancing the stability of SAs on TiO2 nanomaterials.42 These defects, critical for anchoring SAs, often form during thermal processes, necessitating specialized atmospheres and occasionally intricate conditions for their creation. However, in pursuit of more accessible and versatile defect introducing methods, there is a compelling need to explore alternative approaches that enable precise defect engineering at lower temperatures and in more straightforward reaction environments. The development of such techniques holds the potential to revolutionize the utilization of SAs on TiO2.8,43,44
In this study, we present a straightforward approach utilizing UV radiation for the introduction of point defects onto (001) TiO2-NSs. Moreover, an efficient decoration of Pt SAs is obtained by harnessing the capacity of UV light. We explore the intricacies of Pt SA decoration at different time intervals, both during light exposure (photo-deposited) and during rest periods after the cessation of light. By carefully manipulating the duration of these rest periods, we achieve precise control over the loading of Pt SAs onto the TiO2-NSs support. To thoroughly characterize the resulting TiO2-NSs, we employed a range of microscopy and spectroscopy techniques. Furthermore, we conducted comprehensive analysis using gas chromatography to evaluate the H2 photocatalytic performance of various samples.
2. Experimental section
2.1. Synthesis of TiO2-NSs
TiO2-NSs were prepared using a hydrothermal method as previously detailed in the literature.17 The nanosheets were synthesized by gradually adding 1.2 mL of hydrofluoric acid drop by drop to a solution containing 10 mL of tetrabutyl titanate while stirring at room temperature. Subsequently, the resulting mixture was sealed within an autoclave and heated at 200 °C for 24 h. After the reaction, the precipitate obtained was washed three times with distilled water and ethanol, followed by drying at 75 °C in a conventional oven overnight.2.2. Synthesis of defective TiO2-NSs
100 mg of TiO2-NSs powder was introduced to a mixture of 30 mL distilled water and methanol in a 1![[thin space (1/6-em)]](https://www.rsc.org/images/entities/char_2009.gif) :1 ratio. The pH of the solution was gradually adjusted to 12 by adding 1 M KOH droplets.45 The reaction mixture was then placed in a glass container for light radiation, and the solution was purged with Ar to remove oxygen. The experiment was carried out at room temperature. After 1 h of stirring, we used a UV-LED with a wavelength of 365 nm while continuing to stir the solution for 10 min. To prevent the recombination of generated defects with dissolved oxygen during the light-induced process, Ar purging was maintained at a rate of 0.5 mL min−1. Observing Fig. S1† illustrates the darkening phenomenon attributed to the formation of Ti3+ and VO.46 Importantly, Fig. S2† shows that the darkening is notably restrained in instances where Ar purging is absent, highlighting the significance of Ar purging in this process.
:1 ratio. The pH of the solution was gradually adjusted to 12 by adding 1 M KOH droplets.45 The reaction mixture was then placed in a glass container for light radiation, and the solution was purged with Ar to remove oxygen. The experiment was carried out at room temperature. After 1 h of stirring, we used a UV-LED with a wavelength of 365 nm while continuing to stir the solution for 10 min. To prevent the recombination of generated defects with dissolved oxygen during the light-induced process, Ar purging was maintained at a rate of 0.5 mL min−1. Observing Fig. S1† illustrates the darkening phenomenon attributed to the formation of Ti3+ and VO.46 Importantly, Fig. S2† shows that the darkening is notably restrained in instances where Ar purging is absent, highlighting the significance of Ar purging in this process.
2.3. Decoration of TiO2-NSs with Pt
Chemical bath deposition method was used to decorate Pt species on the TiO2-NSs. The starting solution was a 2.4 mM solution of H2PtCl6 that was prepared using dihydrogen hexachloroplatinate(IV)hydrate H2PtCl6·xH2O (99.9%; Sigma-Aldrich). This solution was diluted 10 times in a 100 mL container to obtain a 240 μM H2PtCl6 solution. This was done to ensure a more precise measurement of the weight value of H2PtCl6 powder. In the next step, the diluted H2PtCl6 solution was introduced dropwise into the individual solutions prepared in the previous stage. This precursor was added at various time intervals in each solution: 0, 5, 10, 20, and 60 min after turning off the UV-light as the resting times. Corresponding samples were denoted as the light-induced Pt decorated samples: LI0, LI5, LI10, LI20 and LI60. The solution was continuously stirred throughout this process. After adding the diluted H2PtCl6 solution and a 10 minutes interval, the supernatants were separated from the TiO2-NSs using a centrifuge apparatus at 4000 rpm. The separated solution was removed, and 200 mL of water were added to the centrifuge tube. The centrifugation and water washing was repeated three times. The resulting wet powder was transferred to an oven set at 40 °C and left overnight to remove all residual water. This procedure was replicated for the photo-deposited samples, i.e. PD5 and PD10, where UV-light radiation continued during the addition of H2PtCl6 for 5 and 10 minutes, respectively. Table S1† provides detailed explanations of each sample's conditions.2.4. Characterization
TiO2-NSs samples were examined utilizing high resolution field emission scanning electron microscopy (FESEM-Zeiss 55). The chemical state of various samples were assessed through X-ray photoelectron spectroscopy (XPS) using an SSX-100 Surface Science Instruments apparatus, with peak positions calibrated relative to the C 1s peak at 284.5 eV. The Pt content in the Pt loaded TiO2-NSs was determined using both quantitative XPS analysis and inductively coupled plasma mass spectrometry (ICP-MS, Thermo Fisher Scientific iCap Qc ICP-Q-MS). Moreover, time-of-flight secondary ion mass spectrometry (ToF-SIMS) analyses were conducted on a ToF-SIMS 4 instrument (IONTOF, Germany), using a Bi+ 25 keV liquid metal ion beam as source. SurfaceLab 7.3 software was used for the data analysis. Transmission electron microscopy (TEM) was performed using a Thermo Fischer Scientific FEI Talos F200X microscope equipped with a SuperX detector, operating at 200 kV. Additionally, energy dispersive X-ray spectroscopy (EDS) was conducted using a Thermofisher-Titan microscope (probe/image aberration corrected) (TEAM 1), operating at 300 kV. High-angle annular dark-field scanning transmission electron microscopy (HAADF-STEM) was also employed. For photocatalytic hydrogen generation experiments, 10 mg of powdered samples were suspended in a quartz photoreactor with a 50/50 volume percentage water–methanol solution. Prior to the experiment, the oxygen content was eliminated by Ar purging. The suspension was continuously stirred at a rate of 1000 rpm while being exposed to UV illumination at a wavelength of 365 nm. A 365 nm LED light source (680 mW cm−2, SPCM-0800, DUSA) was used. The hydrogen generation rate was subsequently determined using a gas chromatograph (SRI, Model 8610C, TCD-detector). The apparent quantum yield (AQY) was measured under the same reaction conditions. The AQY values were calculated using eqn (1). | (1) |
3. Results and discussion
Fig. 1 illustrates the STEM images of various TiO2-NSs samples. A considerable proportion of these nanosheets display a well-defined sheet-like configuration, demonstrating a rectangular shape. The lateral dimensions of these nanosheets range from around 30 to 70 nm, while the average thickness is approximately 6 nm. As can be seen from Fig. 1b–f, the size distribution of Pt particles in the light-induced samples undergoes significant changes with increasing the rest time. In the LI0 sample, expected to exhibit maximum Ti3+ and VO concentrations,47 a distribution of Pt nanoparticles on the surface of nanosheets is observed. As the rest time increases to 5 minutes, only indications of Pt SAs clusters on the nanosheets become noticeable. For the LI10 sample, Pt particles coarsen, revealing a mixture of both nanoparticles and clusters of Pt. In the LI20 and LI60 samples, a nearly similar distribution and size of Pt nanoparticles are observed, with no evidence of clusters. The trend in Pt particle size alteration suggests that, immediately after the removal of Ar gas and UV irradiation (LI0), the density of point defects is elevated, facilitating substantial Pt deposition and leads the formation of Pt nanoparticles. With an increase in rest time to 5 minutes, an optimal balance is achieved between defect annihilation and Pt deposition, predominantly resulting in the formation of Pt clusters. As the rest time increases, the density of point defects gradually decreases, diminishing the chances of Pt SAs and cluster formation. The noteworthy result, supporting the hypothesis of an increased likelihood of forming Pt nanoparticles rather than SAs or clusters when the point defect density is elevated, is evidenced by STEM images for the PD5 and PD10 samples (Fig. 1g and h). Despite the presence of the point defect inducer (UV irradiation) during the Pt addition in these samples, no discernible signs of the formation of Pt SAs or clusters are observed. Throughout the process, only Pt nanoparticles are evident across the entire surface of these nanosheets. These results indirectly emphasize the importance of Ti3+ or VO as potential sites for Pt adsorption. Additional support for these conditions is provided in Fig. S3.† The size distribution of Pt particles for various samples is also confirmed in the FESEM images shown in Fig. S4,† where a greater number of nanosheets are perceptible in each image, providing additional support to this finding.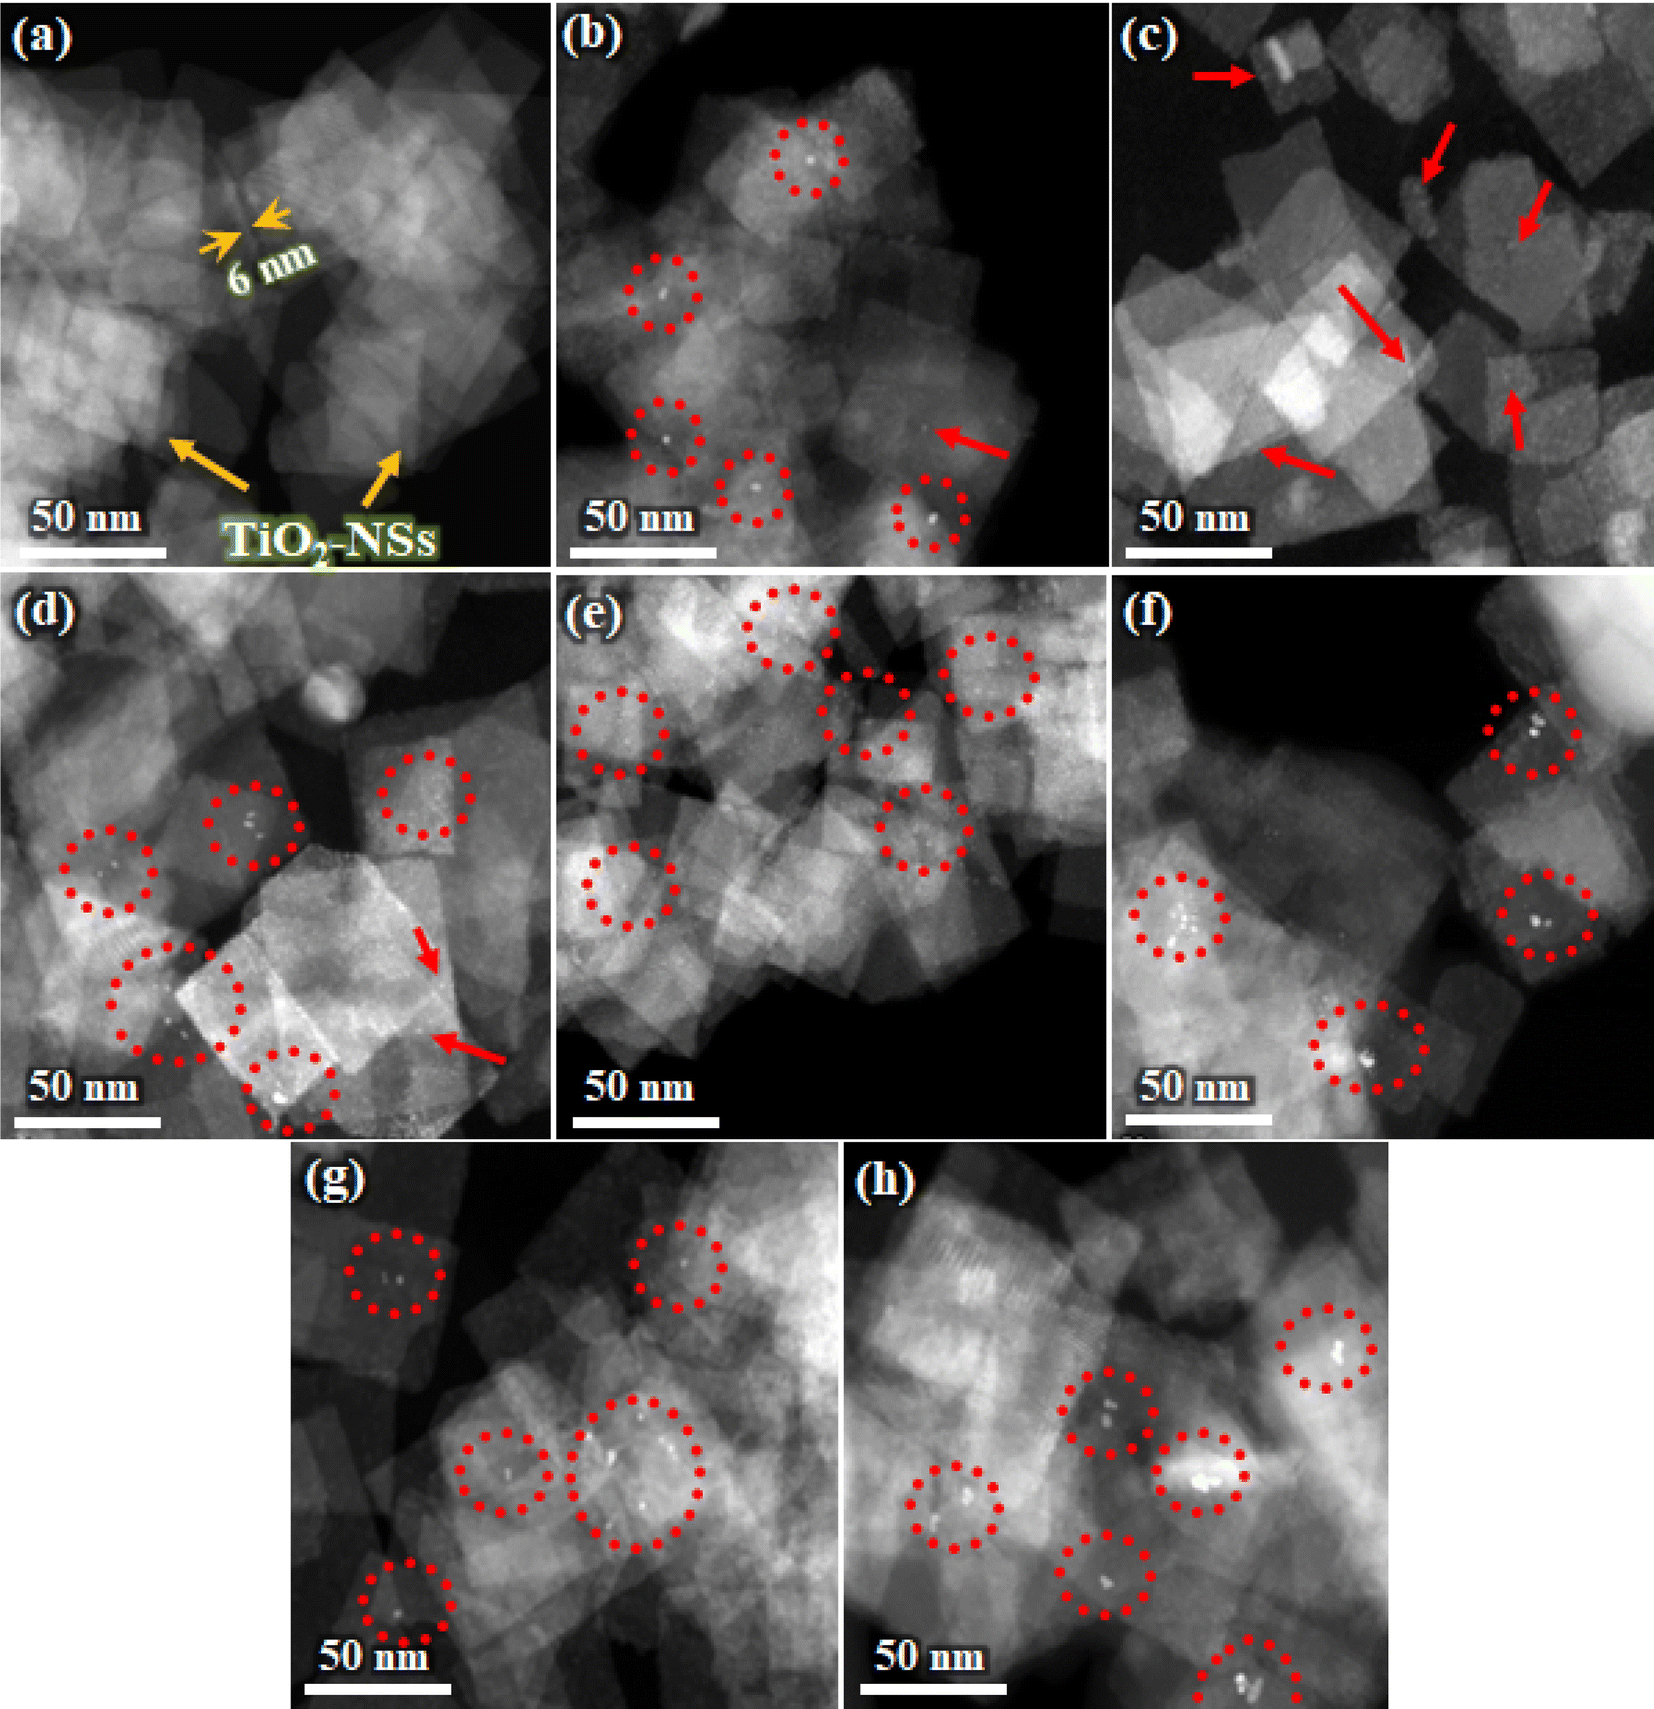 | ||
| Fig. 1 STEM images of various nanosheets. (a) Pristine TiO2-NSs, (b) LI0, (c) LI5, (d) LI10, (e) LI20, (f) LI60, (g) PD5, and (h) PD10. Red circles and arrows, respectively, represent Pt nanoparticles and single atoms/clusters. | ||
To conduct a more comprehensive investigation, the STEM and HAADF-STEM images in Fig. 2a–d of Pt-decorated TiO2-NSs validate the presence of Pt in the form of SAs, showcasing discernible and distinct isolated atomic species. The illustration highlights well-defined, individual bright dots (marked by red circles), that distinctly contrast with the surrounding lighter atoms of the TiO2-NS support. This observation signifies the presence of Pt atoms dispersed at the atomic level. The corresponding energy dispersive X-ray spectrum presented in Fig. 2e further verifies the presence of Pt species on the TiO2-NSs in the LI5 sample. The arrangement of Pt SAs in this manner can enhance charge utilization efficiency, utilizing the lowest feasible concentration of Pt.48
 | ||
| Fig. 2 (a) STEM image and (b–d) HAADF-STEM images of LI5 sample, along with (e) corresponding energy dispersive X-ray spectrum. | ||
XPS analysis was performed to investigate the chemical state of the Pt species and their atomic percentage on the surface of different TiO2-NSs samples. Fig. 3a depicts the typical XPS survey spectra of LI5 and PD10 samples. While other samples exhibit comparable XPS survey spectra, these two were selected due to their distinctive features—Pt SAs for LI5 and Pt nanoparticles decoration for PD10. The XPS survey results reveal that the Pt-decorated samples predominantly consist of Ti, Pt, O, and adventitious carbon. The absence of the Cl 2p peak in the samples confirms that the Pt signals originate solely from the trapped Pt and not from any remnants of the precursor solution, providing conclusive evidence of Pt's presence in the surface of TiO2-NSs. In Fig. 3b, the atomic Pt surface content is presented for various samples, revealing a higher concentration on TiO2-NSs decorated with Pt SAs, i.e. LI5, compared to those decorated with Pt nanoparticles. In line with the XPS findings, the ICP-MS results revealed that LI5 has the highest Pt loading, amounting to 19 ± 2 μg. Based on these results, it can be claimed that where TiO2-NSs have a higher density of Ti3+ or Vo (such as LI0, PD10, or PD20), not only does the tendency to form Pt SAs and clusters decrease, but the Pt concentration on the surface of TiO2-NSs also diminishes. According to the literature,49–51 this phenomenon can be attributed to the reversible nature of Pt deposition on nanosheets with higher surface energy. Fig. 3(c and d) presents the deconvoluted high-resolution XPS spectra of the Pt 4f region for the LI5 and PD10 samples. The shift in the chemical composition of Pt SAs from Pt0 is attributed to a change in coordination, specifically Pt binding to oxygen instead of Pt itself.52 In the Pt 4f peak of the LI5 sample, four discernible peaks are identified, signifying the Pt decoration with SAs and clusters. The peaks at 72.53 eV and 75.83 eV correspond to Pt2+ 4f7/2 and Pt2+ 4f5/2, respectively, while the peaks at 74.37 eV and 77.64 eV can be attributed to Pt4+ 4f7/2 and Pt4+ 4f5/2. Conversely, for the PD10 sample, Pt also exists in the metallic state, with peaks at 71.25 eV and 74.55 eV corresponding to Pt0 4f7/2 and Pt0 4f5/2, and peaks at 72.53 eV and 75.83 eV corresponding to Pt2+ 4f7/2 and Pt2+ 4f5/2. Additionally, peaks at 73.66 eV and 76.96 eV can be attributed to Ptδ+ 4f7/2 and Ptδ+ 4f5/, respectively. The XPS results affirm the atomic-scale deposition of Pt on the TiO2-NSs in LI5 sample. Consistent with the literature,53 in the Pt SAs state, Pt coordinates with its surroundings, primarily oxygen atoms on the oxide surface, forming Pt-oxide. Besides, the presence of high-valent Pt, such as Pt4+, indicates a robust interaction between Pt and TiO2, suggesting a covalent bonding interaction. This point can also be verified from the high-resolution XPS spectra for Ti and O shown in Fig. S5.† ToF-SIMS analysis was conducted to further verify the presence of PtO species on TiO2 and confirm the decoration of Pt SAs, particularly on LI5. The negative spectra from ToF-SIMS of pristine and LI5 samples are displayed in Fig. S6.† According to the PtO− isotope distribution pattern, the LI5 sample has four major PtO− peaks at m/z 209.96, 210.96, 211.96, and 213.97, respectively. The additional signal at m/z 209.09 indicates an organic origin, potentially due to atmospheric contamination, and may correspond to the fragment C8H17O6−. The PtO/Pt ratio for LI5 and PD10 is 1.66 and 1.23, respectively. This indicates a 32% higher amount of surface Pt in LI5 and a greater amount of metallic platinum in PD10, suggesting that platinum in LI5 is more likely bonded with oxygen, and thus, present in the SA state.
 | ||
| Fig. 3 (a) Survey XPS spectra of the LI5 and PD10 samples, (b) quantitative analysis of the Pt on various TiO2-NSs, and (c and d) high-resolution XPS spectra of Pt 4f for LI5 and PD10 samples. | ||
Fig. 4(a and b) depicts the photocatalytic H2 production performance for various samples, evaluated using a 365 nm LED. These results illustrate that TiO2-NSs, subjected to light-induced and photo-deposition processes, followed by Pt decoration using the H2PtCl6 solution, exhibit enhanced hydrogen evolution compared to pristine TiO2-NSs. Specifically, the LI5 sample demonstrates the highest photocatalytic hydrogen evolution rate of 1170.35 μmol h−1 g−1, which is approximately 4000 times higher than that of the pristine sample, which is 0.28 μmol h−1 g−1. With an increase in the rest time from 0 minutes (LI0) to 5 minutes (LI5), there is a noticeable enhancement in photocatalytic activity, reaching its peak. Conversely, as the rest time further extends to 10 minutes (LI10), 20 minutes (LI20), and 60 minutes (LI60), a decrease in photocatalytic activity is observed. As shown in Table S2,† a similar trend is observed for the AQY values, with LI5 reaching a maximum of 2.36%. Considering the data presented in Table S3,† LI5 exhibits significant photocatalytic performance.17,38,45,54–58 These variations in photocatalytic hydrogen production across different samples are clearly consistent with the microscopic observations. As the resting time increases from 0 to 5, the decoration of Pt as SAs and clusters on TiO2-NSs with the maximum atomic percentage, i.e. 0.37 at%, results in the most effective photocatalytic performance. With the prolonged resting time and the gradual stabilization of Pt nanoparticles instead of SAs and their clusters, along with a reduction in Pt loading on the surface of nanosheets, the amount of produced hydrogen decreases. This trend is exacerbated in the PD10 and PD20 samples, where the minimum amount of evolved hydrogen is achieved. It is evident that the photocatalytic efficiency is greatly affected by the amount of Pt loading. However, the H2 evolution rate normalized to Pt loading, as shown in Fig. S7,† indicates that the increased H2 production rate of LI5 sample is mainly due to the presence of Pt SAs and their clusters, rather than just a higher concentration of Pt. The reusability assessment was conducted on LI5, identified as the most efficient sample. As illustrated in Fig. 4c, the results indicate that the photocatalytic activity remained consistent across all four cycles of the reusability test. This observation suggests that TiO2-NSs decorated with Pt SAs and clusters exhibit satisfactory long-term performance. This fact can also be verified through the STEM and HAADF-STEM images shown in Fig. 5a–c, where Pt-SAs and their clusters are observed after the reusability test on the LI5 sample. Compared to the non-illuminated sample (Fig. 2), a rearrangement of the Pt species is observed, with a decrease in the amount of SAs and an increase in Pt clusters. Fig. 5d shows the deconvoluted high-resolution XPS spectra of the Pt 4f region for the LI5 after the reusability test. The Pt 4f peak after the UV illumination is similar to the Pt 4f peak of the non-illuminated LI5 sample (Fig. 3c), with four distinct peaks identified. The peaks at 72.62 eV and 75.92 eV correspond to Pt2+ 4f7/2 and Pt2+ 4f5/2, respectively, while the peaks at 74.23 eV and 77.53 eV can be attributed to Pt4+ 4f7/2 and Pt4+ 4f5/2. These peaks indicate the presence of Pt decoration with SAs and clusters. However, small deconvolution peaks related to metallic Pt are also observed, with peaks at 71.36 eV and 74.66 eV corresponding to Pt0 4f7/2 and Pt0 4f5/2, indicating the presence of some nanoparticles in the LI5 sample after the reusability test. Based on the literature,44,55 light exposure over periods from minutes to hours leads to the agglomeration of Pt single atoms into dimers, multimers, and eventually nanoparticles. Despite this aggregation and reduction to the metallic state, the photocatalytic H2 evolution remains nearly unaffected.
 | ||
| Fig. 4 (a) H2 evolution results of the pristine, light-induced and photo-deposited TiO2-NSs in hexachloroplatinic solution, and (b) corresponding H2 production rates. (c) Reusability results of the H2 production for the LI5 sample. | ||
 | ||
| Fig. 5 (a) STEM image and (b and c) HAADF-STEM images of LI5 sample after reusability test, along with (d) corresponding high-resolution XPS spectra of Pt 4f. | ||
4. Conclusion
In summary, our study undertook a comprehensive exploration of the generation of point defects, specifically Ti3+ and VO, on TiO2-NSs through UV-light radiation, followed by Pt addition at various resting times for photocatalytic hydrogen production. STEM and HAADF-STEM observations unveiled a nuanced correlation between the size of Pt particles and the resting time in the light-induced (LI) samples. Pt particles initially deposit on the surfaces of TiO2-NSs as nanoparticles (LI0). However, after 5 minutes (as observed in the LI5 sample), a combination of Pt SAs and clusters forms. With a further increase in time to 60 minutes, the presence of Pt SAs and clusters gradually diminishes, giving way to the deposition of Pt nanoparticles with lower loadings. Importantly, Pt SAs and clusters displayed superior performance in hydrogen evolution, as illustrated by the LI5 sample (1170.35 μmol h−1 g−1), which exhibited a remarkable 4000-fold increase over the pristine sample (0.28 μmol h−1 g−1). Additionally, the sustained UV radiation during Pt addition, i.e., PD5 and PD10 samples, led to the formation of Pt nanoparticles with lower loading compared to LI samples, resulting in reduced photocatalytic hydrogen production. XPS analysis conclusively affirmed the atomic-scale deposition of Pt in the LI5 sample. Photocatalytic assessments substantiated the hypothesis that a higher density of Ti3+ or VO facilitates Pt nanoparticle formation, whereas under these conditions, the formation of Pt SAs and clusters is less favored. Furthermore, our investigation highlights the enduring efficacy of TiO2-NSs decorated with Pt SAs and clusters, as demonstrated by consistent photocatalytic activity across multiple reusability cycles. These findings offer valuable insights for designing efficient photocatalytic systems for sustainable hydrogen production.Data availability
The data used in this research are subject to legal restrictions and cannot be shared publicly. Requests for data access may be considered on a case-by-case basis and subject to approval from the University of Siegen's legal department.Author contributions
M. Shahsanaei: formal analysis, investigation, methodology, visualization, writing—original draft, writing—review & editing. N. Farahbakhsh: formal analysis, investigation, methodology, visualization, writing—review & editing. S. Pour-Ali: visualization, writing—original draft, writing—review & editing. A. Schardt: investigation, writing—review & editing. S. Orangpour: investigation, writing—review & editing. C. Engelhard: methodology, validation, visualization, writing—review & editing, Sh. Mohajernia: conceptualization, methodology, validation, visualization, writing—review & editing. M. S. Killian: conceptualization, formal analysis, methodology, validation, visualization, writing—review & editing. S. Hejazi: conceptualization, formal analysis, methodology, validation, visualization, writing—original draft, writing—review & editing.Conflicts of interest
There are no conflicts to declare.Acknowledgements
Part of this work was done at the University of Siegen in the structure of the Chemistry & Structure of novel Materials (CSnM) research group; part was performed at the University of Alberta Energy Materials Research Group. Therefore, we would like to acknowledge the funding for each institute. DFG for CSnM and NSERC and Future energy system, Alberta Innovates and Government of Alberta at NRGMATs research group.References
- B. Wang, S. Shen and S. S. Mao, J. Materiomics, 2017, 3, 96–111 CrossRef.
- X. Zhao, G. Zhang and Z. Zhang, Environ. Int., 2020, 136, 105453 CrossRef CAS PubMed.
- M. Ge, J. Cai, J. Iocozzia, C. Cao, J. Huang, X. Zhang, J. Shen, S. Wang, S. Zhang, K. Q. Zhang, Y. Lai and Z. Lin, Int. J. Hydrogen Energy, 2017, 42, 8418–8449 CrossRef CAS.
- V. Kumaravel, S. Mathew, J. Bartlett and S. C. Pillai, Appl. Catal., B, 2019, 244, 1021–1064 CrossRef CAS.
- N. S. Ibrahim, W. L. Leaw, D. Mohamad, S. H. Alias and H. Nur, Int. J. Hydrogen Energy, 2020, 45, 28553–28565 CrossRef CAS.
- J. Wan, W. Chen, C. Jia, L. Zheng, J. Dong, X. Zheng, Y. Wang, W. Yan, C. Chen and Q. Peng, Adv. Mater., 2018, 30, 1705369 CrossRef.
- K. Wenderich and G. Mul, Chem. Rev., 2016, 116, 14587–14619 CrossRef CAS.
- A. Naldoni, M. Altomare, G. Zoppellaro, N. Liu, Š. Kment, R. Zbořil and P. Schmuki, ACS Catal., 2019, 9, 345–364 CrossRef CAS.
- H. Li, L. Zhang, R. Li, W. Du, B. Wu, W. Lei, J. Yu, G. Liu, T. Tan, L. Zheng and X. Liu, Nano Today, 2023, 51, 101885 CrossRef CAS.
- Y. Wang, J. Yu, J. Zhu, Q. Liu, J. Liu, R. Chen, R. Li and J. Wang, J. Mater. Chem. A, 2023, 11, 14257–14264 RSC.
- L. Liu and A. Corma, Chem. Rev., 2018, 118, 4981–5079 CrossRef CAS.
- X. Yang, A. Wang, B. Qiao, J. U. N. Li, L. Jingyue and Z. Tao, Acc. Chem. Res., 2013, 46, 1740–1748 CrossRef CAS PubMed.
- J. Xi, H. S. Jung, Y. Xu, F. Xiao, J. W. Bae and S. Wang, Adv. Funct. Mater., 2021, 31, 2008318 CrossRef CAS.
- H. Luo, Y. Liu, S. D. Dimitrov, L. Steier, S. Guo, X. Li, J. Feng, F. Xie, Y. Fang, A. Sapelkin, X. Wang and M. M. Titirici, J. Mater. Chem. A, 2020, 8, 14690–14696 RSC.
- H. Li, R. Li, G. Liu, M. Zhai and J. Yu, Adv. Mater., 2024, 36, 2301307 CrossRef CAS PubMed.
- M. Jian, J. X. Liu and W. X. Li, Chem. Sci., 2021, 12, 10290–10298 RSC.
- X. Han, Q. Kuang, M. Jin, Z. Xie and L. Zheng, J. Am. Chem. Soc., 2009, 131, 3152–3153 CrossRef CAS PubMed.
- G. Cha, I. Hwang, S. Hejazi, A. S. Dobrota, I. A. Pašti, B. Osuagwu, H. Kim, J. Will, T. Yokosawa and Z. Badura, iScience, 2021, 24, 102938 CrossRef CAS PubMed.
- A. Wang, J. Li and T. Zhang, Nat. Rev. Chem, 2018, 2, 65–81 CrossRef CAS.
- J. Li, M. F. Stephanopoulos and Y. Xia, Chem. Rev., 2020, 120, 11699–11702 CrossRef CAS.
- F. D. Speck, J. H. Kim, G. Bae, S. H. Joo, K. J. J. Mayrhofer, C. H. Choi and S. Cherevko, JACS Au, 2021, 1, 1086–1100 CrossRef CAS PubMed.
- C. Tang, L. Chen, H. Li, L. Li, Y. Jiao, Y. Zheng, H. Xu, K. Davey and S. Z. Qiao, J. Am. Chem. Soc., 2021, 143, 7819–7827 CrossRef CAS PubMed.
- Z. Zhang, J. Liu, J. Wang, Q. Wang, Y. Wang, K. Wang, Z. Wang, M. Gu, Z. Tang, J. Lim, T. Zhao and F. Ciucci, Nat. Commun., 2021, 12, 1–9 CrossRef PubMed.
- G. Gao, S. Bottle and A. Du, Catal. Sci. Technol., 2018, 8, 996–1001 RSC.
- T. Chen, L. Ye and T. W. B. Lo, J. Mater. Chem. A, 2021, 9, 18773–18784 CAS.
- Z. Sun, S. Wang and W. Chen, J. Mater. Chem. A, 2021, 9, 5296–5319 RSC.
- Y. Chen, S. Ji, C. Chen, Q. Peng, D. Wang and Y. Li, Joule, 2018, 2, 1242–1264 CAS.
- W. Ji, X. Wang, M. Tang, L. Yang, Z. Rui, Y. Tong and J. Y. S. Lin, Chem. Commun., 2019, 55, 6846–6849 RSC.
- S. Qin, N. Denisov, B. B. Sarma, I. Hwang, D. E. Doronkin, O. Tomanec, S. Kment and P. Schmuki, Adv. Mater. Interfaces, 2022, 22, 2200808 CrossRef.
- S. Qin, N. Denisov, J. Will, J. Kolařík, E. Spiecker and P. Schmuki, Sol. RRL, 2022, 6, 2101026 CrossRef CAS.
- X. Zhou, I. Hwang, O. Tomanec, D. Fehn, A. Mazare, R. Zboril, K. Meyer and P. Schmuki, Adv. Funct. Mater., 2021, 31, 2102843 CrossRef CAS.
- S. Weon, M.-J. Suh, C. Chu, D. Huang, E. Stavitski and J.-H. Kim, ACS ES&T Eng., 2021, 1, 512–522 Search PubMed.
- C. P. Sajan, S. Wageh, A. A. Al-Ghamdi, J. Yu and S. Cao, Nano Res., 2016, 9, 3–27 CrossRef CAS.
- S. Liu, J. Yu and M. Jaroniec, Chem. Mater., 2011, 23, 4085–4093 CrossRef CAS.
- X. Han, Q. Kuang, M. Jin, Z. Xie and L. Zheng, J. Am. Chem. Soc., 2009, 131, 3152–3153 CrossRef CAS.
- S. M. Wu, I. Hwang, B. Osuagwu, J. Will, Z. Wu, B. B. Sarma, F. F. Pu, L. Y. Wang, Z. Badura, G. Zoppellaro, E. Spiecker and P. Schmuki, ACS Catal., 2023, 13, 33–41 CrossRef CAS.
- S. Hejazi, S. Pour-Ali, M. S. Killian and S. Mohajernia, Electrochem. Commun., 2022, 136, 107246 CrossRef CAS.
- S. Rej, S. M. H. Hejazi, Z. Badura, G. Zoppellaro, S. Kalytchuk, Š. Kment, P. Fornasiero and A. Naldoni, ACS Sustain. Chem. Eng., 2022, 10, 17286–17296 CAS.
- S. Xue, K. Li, Z. Lin, K. Zhang, J. Zheng, M. Zhang and Z. Shen, Mater. Today Sustain., 2022, 20, 100213 CrossRef.
- K. Lan, Y. Liu, W. Zhang, Y. Liu, A. Elzatahry, R. Wang, Y. Xia, D. Al-Dhayan, N. Zheng and D. Zhao, J. Am. Chem. Soc., 2018, 140, 4135–4143 CrossRef CAS PubMed.
- Y. Liu, W. Chen, C. Yang, Q. Wei and M. Wei, J. Power Sources, 2018, 392, 226–231 CrossRef CAS.
- M. Shahrezaei, S. M. H. Hejazi, H. Kmentova, V. Sedajova, R. Zboril, A. Naldoni and S. Kment, ACS Appl. Mater. Interfaces, 2023, 15, 37976–37985 CrossRef CAS.
- S. M. H. Hejazi, M. Shahrezaei, P. Błoński, M. Allieta, P. M. Sheverdyaeva, P. Moras, Z. Baďura, S. Kalytchuk, E. Mohammadi, R. Zbořil, Š. Kment, M. Otyepka, A. Naldoni and P. Fornasiero, Chem Catal., 2022, 2, 1177–1190 CrossRef CAS.
- N. Denisov, S. Qin, J. Will, B. N. Vasiljevic, N. V. Skorodumova, I. A. Pašti, B. B. Sarma, B. Osuagwu, T. Yokosawa, J. Voss, J. Wirth, E. Spiecker and P. Schmuki, Adv. Mater., 2023, 35, 2206569 CrossRef CAS PubMed.
- K. Toukabri, S. Hejazi, M. Shahsanaei, S. Pour-Ali, A. Kosari, B. Butz, M. S. Killian and S. Mohajernia, Langmuir, 2024, 40, 4661–4668 CrossRef CAS PubMed.
- N. Liu, X. Zhou, N. T. Nguyen, K. Peters, F. Zoller, I. Hwang, C. Schneider, M. E. Miehlich, D. Freitag, K. Meyer, D. Fattakhova-Rohlfing and P. Schmuki, ChemSusChem, 2017, 10, 62–67 CrossRef CAS PubMed.
- O. E. Dagdeviren, D. Glass, R. Sapienza, E. Cortés, S. A. Maier, I. P. Parkin, P. Grütter and R. Quesada-Cabrera, Nano Lett., 2021, 21, 8348–8354 CrossRef CAS PubMed.
- S. Khamgaonkar, M. Okasha and V. Maheshwari, Inorg. Chem. Front., 2023, 10, 6812–6848 RSC.
- H. Chen, C. E. Nanayakkara and V. H. Grassian, Chem. Rev., 2012, 112, 5919–5948 CrossRef CAS PubMed.
- Y. Lan, Y. Lu and Z. Ren, Nano Energy, 2013, 2, 1031–1045 CrossRef CAS.
- S. Hejazi, H. Mehdi-pour, C. O. Otieno, J. Müller, S. Pour-Ali, M. Shahsanaei, S. Sarabadani Tafreshi, B. Butz, M. S. Killian and S. Mohajernia, Int. J. Hydrogen Energy, 2024, 51, 222–233 CrossRef CAS.
- N. Daelman, M. Capdevila-Cortada and N. López, Nat. Mater., 2019, 18, 1215–1221 CrossRef CAS PubMed.
- R. Lang, W. Xi, J. C. Liu, Y. T. Cui, T. Li, A. F. Lee, F. Chen, Y. Chen, L. Li, L. Li, J. Lin, S. Miao, X. Liu, A. Q. Wang, X. Wang, J. Luo, B. Qiao, J. Li and T. Zhang, Nat. Commun., 2019, 10, 1–10 CrossRef CAS PubMed.
- G. Cha, A. Mazare, I. Hwang, N. Denisov, J. Will, T. Yokosawa, Z. Badura, G. Zoppellaro, A. B. Tesler, E. Spiecker and P. Schmuki, Electrochim. Acta, 2022, 412, 140129 CrossRef CAS.
- X. Li, W. Bi, L. Zhang, S. Tao, W. Chu, Q. Zhang, Y. Luo, C. Wu and Y. Xie, Adv. Mater., 2016, 28, 2427–2431 CrossRef CAS PubMed.
- J. Cai, A. Cao, Z. Wang, S. Lu, Z. Jiang, X. Y. Dong, X. Li and S. Q. Zang, J. Mater. Chem. A, 2021, 9, 13890–13897 RSC.
- E. D. Fakhrutdinova, O. A. Reutova, T. A. Bugrova, I. Y. Ovsyuk, L. S. Kibis, O. A. Stonkus, D. B. Vasilchenko, O. V. Vodyankina and V. A. Svetlychnyi, Trans. Tianjin Univ., 2024, 30, 198–209 CrossRef CAS.
- Z. Yin, Z. Wang, J. Wang, X. Wang, T. Song, Z. Wang and Y. Ma, Chem. Commun., 2020, 56, 5609–5612 RSC.
Footnote |
| † Electronic supplementary information (ESI) available. See DOI: https://doi.org/10.1039/d4ta01809e |
| This journal is © The Royal Society of Chemistry 2024 |