
 Open Access Article
 This Open Access Article is licensed under a Creative Commons Attribution-Non Commercial 3.0 Unported Licence
Copper- and manganese-based layered hybrid organic–inorganic compounds with polymorphic transitions as energy storage materials†
R.
Salgado-Pizarro
a,
C.
Puigjaner
b,
J.
García
c,
A. I.
Fernández
*a and
C.
Barreneche
a
aDepartment of Materials Science and Physical Chemistry, Section of Materials Science and Engineering, Faculty of Chemistry, Universitat de Barcelona, C/ Martí i Franquès 1-11, 08028, Barcelona, Spain. E-mail: ana_inesfernandez@ub.edu
bX-ray Diffraction Unit, Scientific and Technological Centers, University of Barcelona, Lluís Solé i Sabarís 1-3, Barcelona, 08028, Spain
cDepartment of Inorganic and Organic Chemistry, Section of Organic Chemistry, Faculty of Chemistry, Universitat de Barcelona, C/ Martí i Franquès 1-11, 08028 Barcelona, Spain
First published on 28th June 2024
Abstract
Solid–solid phase change materials (ss-PCM) have emerged as a promising alternative to traditional methods of thermal regulation, such as solid–liquid transformations. Due to their wide operational temperature range and competitive performance, ss-PCM materials are increasingly being explored for their potential in cooling electronic devices. Here, we explore the potential of layered hybrid organic–inorganic perovskites (LHOIPs) as thermal energy storage materials for passive cooling applications. Two formulations, bis(dodecylammonium) tetrachlorocuprate(II) (CuC12) and bis(dodecylammonium) tetrachloromanganate(II) (MnC12) were synthesised and comprehensively characterised. The analyses revealed that these materials present a two-dimensional structure with a triclinic conformation at 100 K. Notably, both materials exhibited a polymorphic transformation with low thermal hysteresis (1.3–2.5 K). These findings indicate that these materials hold significant potential as thermoregulator materials in cooling electronics. Furthermore, both CuC12 and MnC12 demonstrated good thermal stability compared to other types of ss-PCM. Overall, the findings of this study suggest that LHOIPs, particularly CuC12 and MnC12, are promising candidates for further exploration as thermal energy storage materials in electronic cooling applications.
1 Introduction
Nowadays, efficient heat management is crucial for portable electronic devices, especially due to their design requirements and growing power, which results in high power densities.1 This makes heat dissipation difficult and shortens the lifespan of electronic devices. In fact, 55% of electronic device failure or damage is due to internal overheating.2,3 The primary heat sources of portable electronic devices are Central Processing Units (CPUs) and batteries, where the heat generation density of CPUs is 50 kW m−2 to 1 MW m−2.4 The methods for electronic devices' thermal regulation can be divided into two main groups: active cooling, where the system needs an external source of energy to improve heat dissipation and passive cooling, generally based on the natural convection of the heat.5 One way to reduce the electronic devices' internal overheating is to enhance the performance of passive cooling by integrating latent heat storage materials into heat sinks. This would increase the heat absorption in passive cooling and reduce the workload of active cooling components.Latent heat storage, also called phase change materials (PCMs), is one of the most promising technologies for thermal regulation in medium temperatures. A wide variety of PCMs can be found nowadays. However, solid–solid PCMs (ss-PCMs) are recommended for this specific application since they do not present leakage and lower corrosion issues than solid–liquid PCMs (sl-PCMs). Also, the ss-PCMs present minimal volume changes and, in some cases, better thermal conductivity than normal paraffin.
Despite this, ss-PCMs present attractive qualities over sl-PCMs as thermoregulating materials in electronics, and interest in these materials has increased in different fields in the last year. However, ss-PCMs are much less studied than sl-PCMs.6,7 According to their composition, the ss-PCMs can be grouped into three main groups: organic ss-PCMs, inorganic ss-PCMs, and hybrid ss-PCMs.8 In the organic ss-PCMs, we can find plastic crystals and polymeric ss-PCMs. The polymorphic transition in the plastic crystals relies on a shift of the layered or chain-like structure to an orientally disordered cubic structure.9,10 However, in the polymeric ss-PCM, the transition relies on the non-crystallizable moieties whose structure is reorganized over the phase transition and the crystallizable moieties preventing melting.11,12 In the inorganic ss-PCMs, the metallic-based and the ceramic-based ss-PCMs are reported, where the metallic-based relates to the martensitic phase transition, and the ceramic-based relates to the inorganic salts, whose presents polymorphic transformation at high temperatures and the ceramics present a polymorphic transition through pressure and temperature.8 Finally, hybrid ss-PCMs are in the spotlight due to their versatility and tuneable properties, as they can store energy through various driven forces (change of pressure, magnetic field, or temperature). As with the other groups, the hybrid ss-PCMs can be divided into: complex compounds and perovskite-based materials. The main characteristics of each group of ss-PCM are listed in Table 1.
Two-dimensional layered hybrid organic–inorganic perovskites (LHOIPs) materials have gained significant attention recently due to their unique properties in optoelectronics, solar cells field, light-emitting diodes, and photodetectors applications, which present high environmental stability and efficient photoluminescence.13 LHOIPs present a wide range of compositional and structure varieties, allowing for tuning their properties to find specific applications.14 One of the LHOIP chemical composition subfamilies follows this chemical formula (CnH2n+1NH3)2MX4 (n = 8 to 18), being M a divalent transition metal (Cu2+, Mn2+, Co2+, …) and X a halogen (Cl− or Br−). This subfamily of LHOIP presents polymorphic transitions that are interesting from a thermal energy storage (TES) point of view. This family of materials will be an essential step up of TES technology since tailored materials may be proposed for specific applications, such as cooling electronics, thermal management in highly specialised equipment, or aerospace purposes. Also, these materials have an advantage over the commonly studied organic or inorganic phase change materials since the phase transition of LHOIPs happens in a solid state. Hence, no leakage or encapsulation problem must be addressed.15,16 Moreover, these materials deal with comparative thermal conductivity and lower thermal expansion than solid–liquid phase change materials, as well as enthalpy values and a wide range of temperatures as a function of the structure used.17
Polymorphic transitions of these materials often occur in a sequence of two (or more), where one is more energetic than the other.18–21 Regardless of the number of polymorphic transitions, in all cases, the organic chain remains ionically bonded to the inorganic part, which last remains unaffected by increasing the temperature.22,23 Different studies explain that the main polymorphic transition of this subfamily of LHOIPs relies only on the hydrocarbon chain rearrangement, forming an ordered state where the hydrocarbon chain states in a zig-zag conformation and when the temperature increases, the chain moves to a freedom conformation.22 During this rearrangement, some studies notice that gauche conformation arises in the hydrocarbon chain and an increase in the distance between the facing ends, changing then the volume cell.14
The synthesis optimisation of bis(dodecylamonium) tetrachlorocuprate was previously studied. The study involved examining several synthetic routes and solvent media to determine the appropriate protocol and evaluate the effect of the solvent media. The study concluded that a synthetic protocol that avoids filtration and recrystallisation resulted in a superior yield without decreasing the main key thermal properties for TES applications.24 Moreover, prior research has examined how the length of the carbon chain affects the thermal properties. The research indicates that a longer carbon chain leads to larger volume cells and components with higher transition temperatures and greater overall transition enthalpy. Also, the study confirmed the cyclic durability of the materials for up to 200 cycles.21
In this study, we choose the bis(dodecylammonium) tetrachlorocuprate(II) (C12H25NH3)2CuCl4 and bis(dodecylammonium) tetrachloromanganate(II) (C12H25NH3)2MnCl4, in order to disclose the crystal structure using X-ray diffraction (XRD), and the molecular organisation using infrared spectroscopy (FTIR) and nuclear magnetic resonance (NMR). Additionally, the thermal properties, such as energy storage capacity, latent heat, and transition temperature stability over thermal cycles, were determined using differential scanning calorimetry (DSC). Moreover, complementary techniques, such as scanning electron microscope (SEM), helium pycnometer, elemental analysis, and thermogravimetric analysis, are used to characterise the material thoroughly and demonstrate its potential in thermal energy storage applications.
2 Experimental procedure
2.1 Synthesis of samples
The reactants copper(II) chloride dihydrated (No. CAS 10125-13-0) and manganese(II) chloride tetrahydrate (No. CAS 13446-34-9) were purchased from VWR international, n-dodecylamine 98% (No. CAS 124-22-1) was purchased from Acros Organics, hydrochloric acid 37% (No. CAS 7647-01-0) from Labbox and anhydrous methanol (max. 0.003% H2O) (No. CAS 67-56-1) from Merck Group. The synthesis of this layered hybrid organic–inorganic perovskite follows the reaction in eqn (1), where n corresponds to the number of carbons of the amine and M, the corresponding metal employed (Cu or Mn).| 2CnH2n+1NH2 + 2HCl + MCl2 → (CnH2n+1NH3)2MCl4 | (1) |
The reactants were accurately weighted to follow the molar ratio presented in eqn (1). Firstly, the alkylamine was dissolved in 45 mL of anhydrous methanol and mixed with the proper content of metal chloride in a round bottom flask. Then, a previously prepared mixture solution with the proper amount of hydrochloric acid and 5 mL of anhydrous methanol was added dropwise to the solution. The mixture was heated to reflux for 4 hours at 337 K under constant stirring. The final solution was poured into a Petri dish and left to dry in a desiccator for seven days. The synthesis procedure in the present study followed the method proposed by R. Salgado-Pizarro et al.24
The theoretical elemental composition of C, H, N, Cl and Cu/Mn in (C12H25NH3)2CuCl4 is 49.87%, 9.79%, 4.85%, 24.53% and 10.99%, and in (C12H25NH3)2MnCl4 50.62%, 9.91%, 4.92%, 24.90% and 9.65%, respectively. The experimental content of C, H, N, Cl, and Cu/Mn in (C12H25NH3)2CuCl4 is 50.06%, 9.87%, 4.86%, 25.38%, and 10.44%, and in (C12H25NH3)2MnCl4 is 46.79%, 9.92%, 4.58%, 25.19% and 9.8%, respectively. The C, H, and N contents were measured by elemental analysis, the Cl content was measured by Mohr titration, and the Cu/Mn content was measured by inductively coupled plasma mass spectrometry (ICP-MS).
2.2 Crystallographic study
A colourless plate-like specimen of (C12H25NH3)2MnCl4 (MnC12) with approximate dimensions 0.090 × 0.040 × 0.020 mm, and a yellow plate-like specimen of (C12H25NH3)2CuCl4 (CuC12), with dimensions 0.080 × 0.050 × 0.020 mm, were used for the X-ray crystallographic analysis. The X-ray intensity data were measured on a D8 Venture system equipped with a multilayer monochromator and a Mo microfocus (λ = 0.71073 Å). Using a narrow-frame algorithm, the frames were integrated with the Bruker SAINT software package. The data integration using a triclinic unit cell yielded for MnC12 a total of 21![[thin space (1/6-em)]](https://www.rsc.org/images/entities/char_2009.gif) 843 reflections to a maximum θ angle of 26.60° (0.80 Å resolution), of which 3188 were independent (average redundancy 6.852, completeness = 98.8%, Rint = 7.36%, Rsig = 5.02%) and 2674 (83.88%) were greater than 2σ(F2). On the other hand, the integration of the data for CuC12 also using a triclinic unit cell yielded a total of 38908 reflections to a maximum θ angle of 26.43° (0.80 Å resolution), of which 6220 were independent (average redundancy 6.255, completeness = 99.7%, Rint = 10.84%, Rsig = 7.34%) and 4723 (75.93%) were greater than 2σ(F2). Data were corrected for absorption effects using the multi-scan method (SADABS). The calculated minimum and maximum transmission coefficients (based on crystal size) are 0.5925 and 0.7454 for MnC12 and 0.5945 and 0.7454 for CuC12. Both structures were solved and refined using the Bruker SHELXTL software package, using the P
843 reflections to a maximum θ angle of 26.60° (0.80 Å resolution), of which 3188 were independent (average redundancy 6.852, completeness = 98.8%, Rint = 7.36%, Rsig = 5.02%) and 2674 (83.88%) were greater than 2σ(F2). On the other hand, the integration of the data for CuC12 also using a triclinic unit cell yielded a total of 38908 reflections to a maximum θ angle of 26.43° (0.80 Å resolution), of which 6220 were independent (average redundancy 6.255, completeness = 99.7%, Rint = 10.84%, Rsig = 7.34%) and 4723 (75.93%) were greater than 2σ(F2). Data were corrected for absorption effects using the multi-scan method (SADABS). The calculated minimum and maximum transmission coefficients (based on crystal size) are 0.5925 and 0.7454 for MnC12 and 0.5945 and 0.7454 for CuC12. Both structures were solved and refined using the Bruker SHELXTL software package, using the P![[1 with combining macron]](https://www.rsc.org/images/entities/char_0031_0304.gif) space group, with Z = 1 for the formula unit C24H56Cl4MnN2 and with Z = 2 for the formula unit C24H56Cl4CuN2. The final anisotropic full-matrix least-squares refinement on F2 for MnC12 with 172 variables converged at R1 = 8.33%, for the observed data and wR2 = 22.93% for all data, while for CuC12 with 287 variables converged at R1 = 4.82%, for the observed data and wR2 = 10.10% for all data. The crystal structures were deposited in the CSD (Cambridge Structural Database) under the deposition numbers 2305993 and 2305992 for MnC12 and CuC12, respectively.
space group, with Z = 1 for the formula unit C24H56Cl4MnN2 and with Z = 2 for the formula unit C24H56Cl4CuN2. The final anisotropic full-matrix least-squares refinement on F2 for MnC12 with 172 variables converged at R1 = 8.33%, for the observed data and wR2 = 22.93% for all data, while for CuC12 with 287 variables converged at R1 = 4.82%, for the observed data and wR2 = 10.10% for all data. The crystal structures were deposited in the CSD (Cambridge Structural Database) under the deposition numbers 2305993 and 2305992 for MnC12 and CuC12, respectively.
The crystal data and details of data collection and refinements for both compounds are summarised in Table 2.
| MnC12 | CuC12 | |||
|---|---|---|---|---|
| Chemical formula | C24H56Cl4MnN2 | C24H56Cl4CuN2 | ||
| Formula weight | 569.44 g mol−1 | 578.04 g mol−1 | ||
| Temperature | 100(2) K | 100(2) K | ||
| Wavelength | 0.71073 Å | 0.71073 Å | ||
| Crystal system | Triclinic | Triclinic | ||
| Space group |
P |
P |
||
| Unit cell dimensions | a = 5.0677(5) Å | α = 90.026(4)° | a = 7.0943(3) Å | α = 90.911(2)° |
| b = 5.0725(5) Å | β = 92.083(4)° | b = 7.4399(3) Å | β = 92.693(2)° | |
| c = 29.955(3) Å | γ = 90.807(10)° | c = 28.7460(12) Å | γ = 90.210(2)° | |
| Volume | 769.43(13) Å3 | 1515.36(11) Å3 | ||
| Z | 1 | 2 | ||
| Density (calculated) | 1.229 g cm−3 | 1.267 g cm−3 | ||
| Absorption coefficient | 0.790 mm−1 | 1.088 mm−1 | ||
| F (000) | 307 | 622 | ||
| θ range of data collection | 2.04 to 26.60° | 2.13 to 26.43° | ||
| Index ranges | −6 ≤ h ≤ 6, −6 ≤ k ≤ 6, −37 ≤ l ≤ 37 | −8 ≤ h ≤ 8, −9 ≤ k ≤ 9, −35 ≤ l ≤ 35 | ||
| Reflections collected | 21843 |
38908 |
||
| Independent reflections | 3188 [R (int) = 0.0736] | 6220 [R (int) = 0.1084] | ||
| Refinement method | Full-matrix least-squares on F2 | |||
| Data/restraints/parameters | 3188/1/172 | 6220/0/287 | ||
| Goodness-of-fit on F2 | 1.093 | 1.045 | ||
| Final R indices [I > 2σ(I)] | R 1 = 0.0833, wR2 = 0.2194 | R 1 = 0.0482, wR2 = 0.0925 | ||
| Final R indices | R 1 = 0.0965, wR2 = 0.2293 | R 1 = 0.0742, wR2 = 0.1010 | ||
| Weighting scheme | w = 1/[σ2(Fo2) + (0.1183P)2 + 3.6984P] | w = 1/[σ2(Fo2) + (0.0336P)2 + 0.9350P] | ||
| Where P = (Fo2 + 2Fc2)/3 | Where P = (Fo2 + 2Fc2)/3 | |||
| Largest diff. peak and hole | 2.616 and −1.010 e Å−3 | 0.508 and −0.569 e Å−3 | ||
| RMS deviation from the mean | 0.160 e Å−3 | 0.092 e Å−3 | ||
Variable temperature experiments were performed at the ALBA Synchrotron beamline BL04-MSPD using Mythen detector,25 a wavelength of 0.9544 Å and a Cyberstar hot gas blower with a Eurotherm temperature controller (Eurotherm Worthing, UK). The powder diffraction patterns were indexed using DICVOL06 and the obtained cell parameters were refined via pattern matching with Topas software.26,27
2.3 Molecular structure determination
Fourier-transformed infrared (FT-IR) spectroscopy coupled with Attenuated Total Reflectance (ATR) (PerkinElmer Spectrum Two™) was used to determine the molecular structures and evaluate the chemical changes that originated during the synthesis. Nuclear magnetic resonance (NMR) spectra of 1H (400 MHz) and 13C (101 MHz) in methanol-d4 (CD3OD) were recorded using a Bruker BioSpin GmbH 400 MHz NMR spectrometer, in order to validate the amine protonation during the synthesis.2.4 Morphology study
A scanning electron microscope (SEM) was used to address the morphology of the synthesised structures, using an XTE 325/D8395, Quanta 200 FEI. Several representative flakes were mounted on a carbon adhesive and coated with carbon in order to acquire SEM images and perform energy-dispersive scattering (EDS) analysis of the surface.2.5 Thermophysical study
Differential Scanning Calorimetry (DSC) was performed using a DSC822e from Mettler Toledo. Around 3.6 mg in Al crucible and a heating ramp from 30 to 80 °C was carried out to evaluate the polymorphic transition at 1 K min−1. Ten cycles of heating and cooling ramps were performed at 10 K min−1 for the stability evaluation. Specific heat (Cp) measurements were performed at 1 K min−1 with an amplitude of 0.5 K and a period of 60 seconds in a Q2000 from TA Instruments. The tests performed with the DSC used a nitrogen atmosphere. Thermogravimetric analysis (TGA) was performed under an air atmosphere using a Q600 SDT from TA instruments to evaluate the thermal stability of the component.3 Results and discussion
3.1 Crystal structure
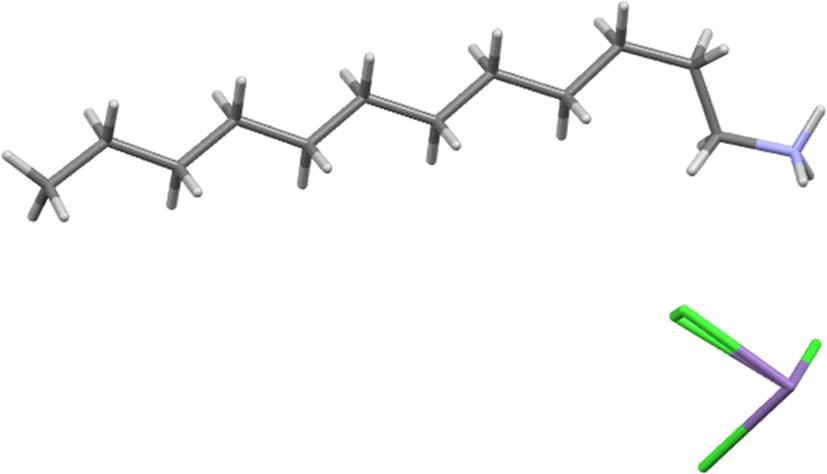
The MnC12 compound was crystallised from slow cooling to form white plate-like crystals of a triclinic system with space group P and unit cell dimensions of a = 5.0677(5) Å, b = 5.0725(5) Å, c = 29.955(3) Å, α = 90.026(4)°, β = 92.083(4)°, γ = 90.807(10)° and Z = 1 (see Table 2). Its asymmetric unit is shown in Fig. 1. The ion Mn2+ adopts the six-coordinated configuration, forming an infinite net of [MnCl4]2− with the octahedral geometry. The monomeric [MnCl4]2− moiety binds with the monomeric [C12H25NH3]+ through electrostatic interactions and several strong N–H⋯Cl and weaker C–H⋯Cl hydrogen bonds, which are shown in Table 3. These hydrogen bonds are the main interactions responsible for the sandwich-layered construction, which gives rise to a space super-molecule establishing a two-dimensional perovskite structure (see Fig. 2). The alkylammonium chain contains all trans C–C bonds except for a single gauche C–C bond, which is the one adjacent to the ammonium.
 | ||
| Fig. 1 Asymmetric unit of MnC12. | ||
| Donor–H⋯acceptor [ARU] | d(D–H) (Å) | d(H⋯A) (Å) | d(D⋯A) (Å) | ∠(D–H⋯A) (°) |
|---|---|---|---|---|
| N1A–H1A⋯Cl1A [x, −1 + y, z] | 0.91 | 2.43 | 3.289(5) | 157 |
| N1A–H1A⋯Cl1B [−3 − x, −y, −1 − z] | 0.91 | 2.51 | 3.291(5) | 145 |
| N1A–H1A⋯Cl2 [−2 − x, −y, −1 − z] | 0.91 | 2.73 | 3.361(5) | 127 |
| N1A–H1B⋯Cl2 [−2 − x, 1− y, −1 − z] | 0.91 | 2.75 | 3.186(4) | 111 |
| N1A–H1B⋯Cl3 [−2 − x, 1 − y, −1 − z] | 0.91 | 2.29 | 3.186(4) | 169 |
| N1A–H1C⋯Cl1A | 0.91 | 2.41 | 3.314(5) | 171 |
| N1A–H1C⋯Cl2 [−2 − x, 1 − y, −1 − z] | 0.91 | 2.78 | 3.186(4) | 109 |
| C1A–H1AA⋯Cl1A [1 + x, −1 + y, z] | 0.99 | 2.76 | 3.679(10) | 154 |
| C1A–H1AA⋯Cl1B [−2 − x, −y, −1 − z] | 0.99 | 2.22 | 3.096(10) | 147 |
| C1A–H1AB⋯Cl1A [1 + x, y, z] | 0.99 | 2.75 | 3.575(10) | 142 |
| C1A–H1AB⋯Cl1B [−2 − x, 1 − y, −1 − z] | 0.99 | 2.78 | 3.649(10) | 147 |
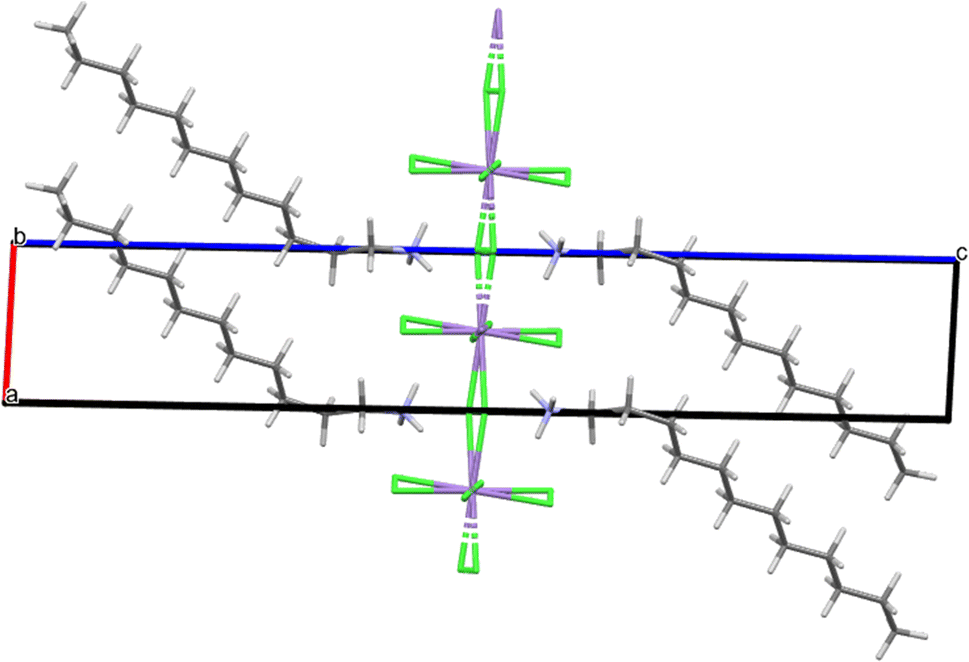 | ||
| Fig. 2 Packing of MnC12 viewed parallel to [010]. | ||
Compound CuC12 was also crystallised by slow cooling to form yellow plate-like crystals of a triclinic system with space group P and unit cell dimensions of a = 7.0943(3) Å, b = 7.4399(3) Å, c = 28.7460(12) Å, α = 90.911(2)°, β = 92.693(2)°, γ = 90.210(2)° and Z = 2 (Table 2). Its asymmetric unit is shown in Fig. 3, where two non-equivalent alkylammonium chains and two monomeric [CuCl4]2− are observed. The steric configuration of [CuCl4]2− is almost square, forming an infinite net of the inorganic moieties. Its packing is shown in Fig. 4, where the [CuCl4]2− component binds with the organic [C12H25NH3]+ moiety through electrostatic interactions and several strong N–H⋯Cl and weaker C–H⋯Cl hydrogen bonds (see Table 4). Similar to the manganese compound, a sandwich construction is formed, which is extended to a space super-molecule, helping to establish the two-dimensional perovskite structure. One of the alkylammonium chains contains all trans C–C bonds, while the other chain contains all trans C–C bonds except for one single gauche C–C bond, the one adjacent to the ammonium.
 | ||
| Fig. 3 Asymmetric unit of CuC12. | ||
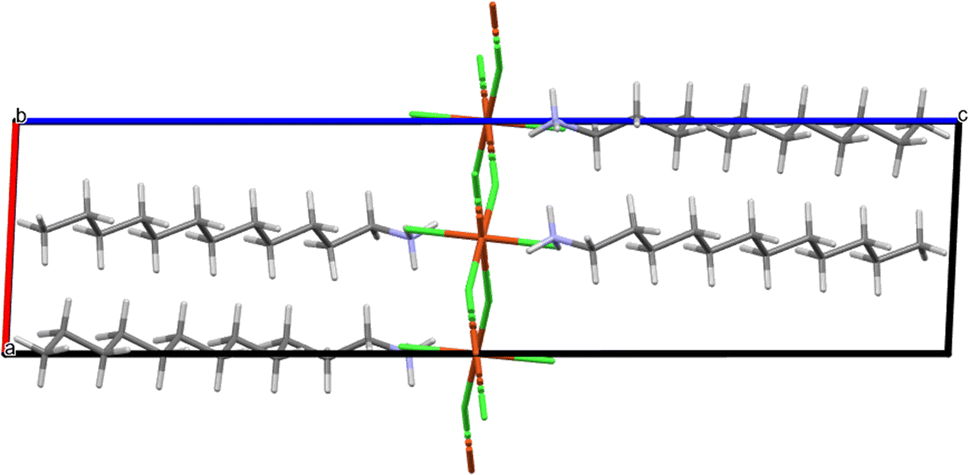 | ||
| Fig. 4 Packing of CuC12 viewed parallel to [010]. | ||
| Donor–H⋯acceptor [ARU] | d(D–H) (Å) | d(H⋯A) (Å) | d(D⋯A) (Å) | ∠(D–H⋯A) (°) |
|---|---|---|---|---|
| N1–H1N1⋯Cl1 | 0.91 | 2.36 | 3.214(2) | 157 |
| N1–H2N1⋯Cl4 [x, 1 + y, z] | 0.91 | 2.38 | 3.238(3) | 157 |
| N1–H3N3⋯Cl3 [1 − x, 2 − y, 1 − z] | 0.91 | 2.48 | 3.365(3) | 163 |
| N2–H1N2⋯Cl1 [1 + x, y, z] | 0.91 | 2.43 | 3.311(3) | 162 |
| N2–H2N2⋯Cl2 | 0.91 | 2.35 | 3.198(3) | 156 |
| N2–H3N2⋯Cl3 [1 − x, 2 − y, 1 − z] | 0.91 | 2.32 | 3.205(2) | 164 |
| C10–H10B⋯Cl1 | 0.99 | 2.71 | 3.679(3) | 166 |
| C12–H12A⋯Cl1 [x, 1 + y, z] | 0.99 | 2.66 | 3.576(3) | 154 |
| C24–H24B⋯Cl3 [1 − x, 1 − y, 1 − z | 0.99 | 2.77 | 3.687(3) | 154 |
The powder X-ray diffractogram of MnC12 at 340 K was indexed to an orthorhombic unit cell with unit cell parameters a = 66.25 Å, b = 5.28 Å and c = 5.19 Å and a volume of 1816 Å3. On the other hand, the powder X-ray diffractogram of CuC12 at 343 K was indexed to a tetragonal unit cell with unit cell parameters a = 10.49 Å and c = 31.92 Å and a volume of 3518 Å3. Taking into account the unit cell volume, the molecular weight of each compound, and an estimated density value of 1.2 mg m−3, the number of molecules in the unit cell was calculated to be Z = 2 for MnC12 and Z = 4 for CuC12. Different space groups could be assigned for both compounds based on the systematic absences; therefore, as an example, the space groups P212121 and P![[4 with combining macron]](https://www.rsc.org/images/entities/char_0034_0304.gif) 21m were assigned for MnC12 and CuC12, respectively, in order to perform the subsequent Pawley pattern matchings. These matchings fitted very well with the experimental X-ray powder diffractograms in both cases, being the agreement factors 4.33% (MnC12) and 4.91% (CuC12) (Fig. S1 and S2 in the ESI†).
21m were assigned for MnC12 and CuC12, respectively, in order to perform the subsequent Pawley pattern matchings. These matchings fitted very well with the experimental X-ray powder diffractograms in both cases, being the agreement factors 4.33% (MnC12) and 4.91% (CuC12) (Fig. S1 and S2 in the ESI†).
Additionally, Fig. 5 presents the XRD profile of the two components before and after the phase transition. In both cases it can be observed an increase in the volume cell, as was reported previously, since the lower angle peaks are shifted to lower angles after the phase transition; this means that the distance between the perovskite layers increases due to the reorganisation of the carbon chain.28,29 Moreover, an amorphous halo around 11.5° is observed; this may be related to a loss of the order of the carbon chain, resembling the organisation of melting like a polymer after the phase transitions.17,23
 | ||
| Fig. 5 XRD spectra of MnC12 and CuC12 before and after the thermal transition. | ||
3.2 Molecular structure
The FTIR-ATR spectra profiles for Cu and Mn components and the raw materials used are displayed in Fig. 6(a) and (b). The main bands of the raw materials are observed in two obtained components. | ||
| Fig. 6 Infrared spectra of CuC12, MnC12 and raw materials. | ||
In both cases, the 2955, 2871, 2917, and 2849 cm−1 bands correspond to asymmetric and symmetric stretching of R–CH3 and R–CH2–R, respectively, while the 1472 and 1463 cm−1 bands are related to bending of R–CH2–R. The 1377 cm−1 band is assigned to the symmetrical bending of R–CH3, and the 728 and 720 cm−1 bands represent R–CH2–R rocking, with the 891 cm−1 band indicating terminal C–C stretching.15,30–32
In the case of the primary amine vibration bands, include were detected at 3400–3250 cm−1 for N–H stretching, 1581 cm−1 for asymmetric deformation of NH3+, 1491 and 1480 cm−1 for symmetric deformation of NH3+, 1215 cm−1 for C–N stretching, and 769 cm−1 for NH3+ wagging.30,31
Minor variations between the Cu and Mn compounds are observed in the FTIR spectra. In particular, the N–H stretching vibration band at 3400–3250 cm−1 appears to shift to a lower wavenumber in the Mn compounds, while symmetric and asymmetric deformation of NH3+ shift to higher wavenumber values in the Mn compounds due to polarity changes in the bonds.33
Fig. 7 presents the 1H and 13C NMR spectra of CuC12 and MnC12 compounds, showing the expected peaks (13C or 1H) corresponding to the alkylamine used. In the 1H NMR spectrum (Fig. 7(a)), a slight shift (∼0.2 ppm) in the peak corresponding to the CH2 next to the N is observed in both CuC12 and MnC12 to lower fields concerning the parent unprotonated amine. Also, the alkylamine protonation is observable, detecting the shift of NH3+ at 7.5 ppm.34 Peaks assignable to remains of water and CH2DOD from the solvent are also detected in some spectra. In the 13C NMR spectrum (Fig. 7(b)), differences between the dodecylamine, C12H27N, and the obtained ammonium compounds are clearly observed. A shift to higher fields of the C1 in CuC12 and MnC12 pecks is detected regarding the parent C12H27N. The peak at 33.98 ppm detected in the C12H27N seems to shift to lower ppm on the compounds' spectra. A 2D NMR experiment (gHSQC) correlating 1H and 13C signals suggests that this peak is shifted to 27.20 ppm. Remarkably, in the CuC12 spectrum, it is able to differentiate the shifts of all the 12 carbons (Fig. S6†) that cannot be determined in the C12H27N or the MnC12 spectra. In order to validate the alkylamine protonation, it was prepared a protonated alkylamine with trifluoroacetic acid (TFA), and was analysed by the 13C and 1H NMR spectra (Fig. S9 and S10†). It was detected that 13C and 1H spectra of the protonated alkylamine with TFA present similar shift patterns to those obtained in our components, validating our hypothesis. Moreover, in both cases, slight differences in the signal positions between the CuC12 and MnC12 spectra are detected due to the difference in the polarity of the two metals used and due to the paramagnetic behaviour of the (CuCl4)2− and (MnCl4)2− moieties, the signals are not good enough to evaluate the NMR spectra correctly.
 | ||
| Fig. 7 NMR spectra: (a) 13C-NMR and (b) 1H-NMR. | ||
3.3 Morphology
The morphology of the resulting crystals was analysed by SEM, as shown in Fig. 8 and 9. Both samples exhibit similar morphologies, resembling flakes or stacking sheets, regarding a two-dimensional structure consistent with the XRD results. Furthermore, a composition analysis was conducted with EDS at different points of the solid to support the elemental analysis and to verify its homogeneity. The result indicates that the main components of the samples are C, Cl, and Cu/Mn, consistent with the elemental analysis. It should be noted that the carbon content is not comparable, as the samples are coated with graphite, and this technique cannot determine the hydrogen content. Furthermore, some potassium was detected in CuC12, which can be attributed to the dust adhered during sample preparation, while oxygen was detected in the MnC12 sample, possibly due to the moisture of the sample.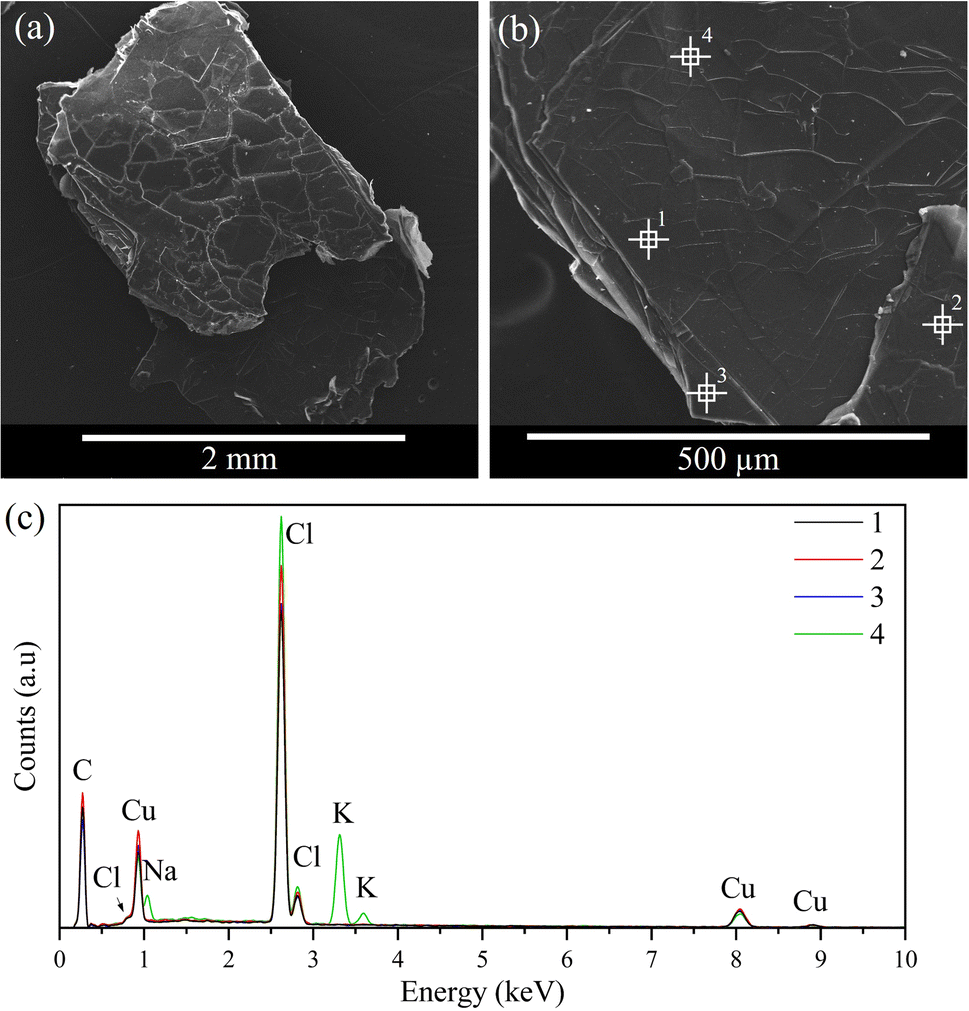 | ||
| Fig. 8 (a) and (b) SEM images and (c) EDS spectra of CuC12 samples. | ||
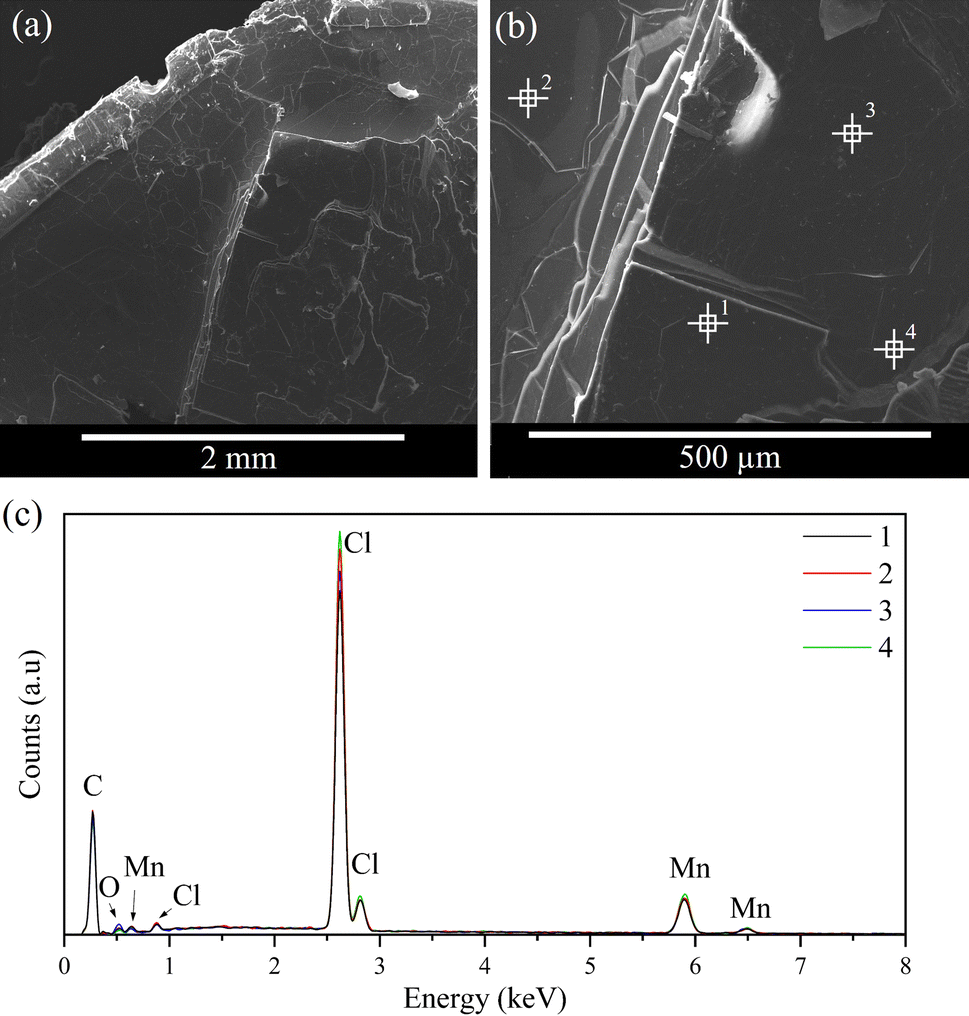 | ||
| Fig. 9 (a) and (b) SEM images, and (c) EDS spectra of MnC12 samples. | ||
3.4 Thermophysical evaluation
The main thermal properties of the two materials are shown in Table 5. They show similar transition temperature and enthalpy values, slightly higher values in the MnC12 sample. This effect could be attributed to the shorter distance between the ammonia and the (MnCl4)2− that may be related to an increase in the polarity of the bond. Hence, higher energy will be needed to reorganise the structure.| ss-PCM | T 1 (K) | ΔH1 (J g−1) | T 2 (K) | ΔH2 (J g−1) | ΔHtotal (J g−1) |
|---|---|---|---|---|---|
| CuC12 | 330.9 | 62.3 | 338.1 | 11.3 | 74.5 |
| MnC12 | 331.7 | 72.5 | 336.0 | 7.4 | 79.9 |
Fig. 10(a) and (b) show the heat flow curves of ten heating and cooling cycles of the two materials studies performed in a DSC. In both cases, the curve profile is stable under cycles, and no decrease in the enthalpy values is observed. However, a slight curve shift is observed in both samples towards higher temperatures for the CuC12 sample and the opposite for the MnC12, where the values of those temperature variations are in Table 6. This difference may be attributed to slight differences in the organisation of the alkylamine chain over the cycles that may be a consequence of the heating rate used. Moreover, in the heating cycles of MnC12, the two transitions overlap, which may be attributed to the high heating rate.
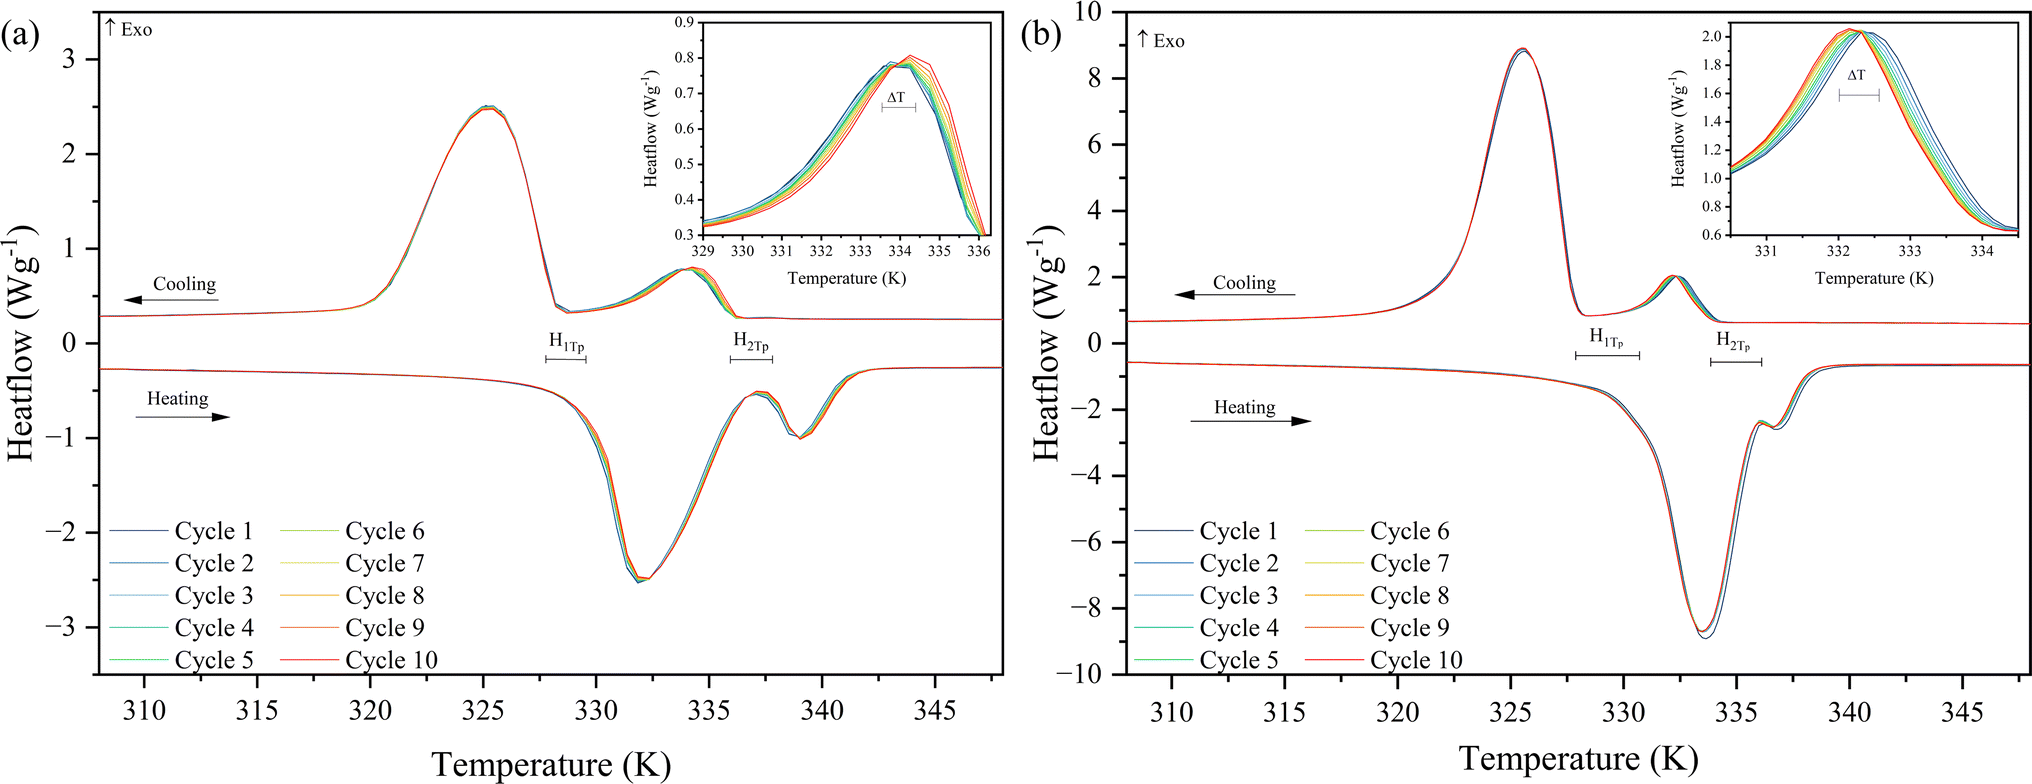 | ||
| Fig. 10 Heat flow curves of ten thermal cycles (a) CuC12 and (b) MnC12. | ||
| ss-PCM | Heating | Cooling | H 1To (K) | H 2To (K) | ||
|---|---|---|---|---|---|---|
| ΔTp1 (K) | ΔTp2 (K) | ΔTp1 (K) | ΔTp2 (K) | |||
| CuC12 | 0.17 | 0.16 | 0.00 | 0.5 | 1.36 | 1.65 |
| MnC12 | 0.16 | 0.16 | 0.16 | 0.16 | 2.55 | 2.15 |
Additionally, the phase change hysteresis was calculated between mean values of the onset temperature of the heating and cooling phase transitions (see Table 6). For the CuC12, similar hysteresis values were obtained in the two transitions, 1.36 and 1.65 K, respectively. Slightly higher values were obtained in the MnC12 than CuC12 in both transitions, 2.55 and 2.15 K, respectively.
The specific heat measurements of the heating and cooling of both samples are presented in Fig. 11. A good overlap of the heating and cooling curves is observed for the two samples. However, close to the transition temperature, the cooling curve increases its Cp value because of the hysteresis of the system. For the CuC12, the curves remain overlapped up to 320 K, where the transition temperatures are 330.9 and 338.1 K for heating and cooling, respectively. In the case of MnC12, the curves remain overlapped up to 310 K, where the transition temperatures are 331.7 and 336.0 K for heating and cooling.
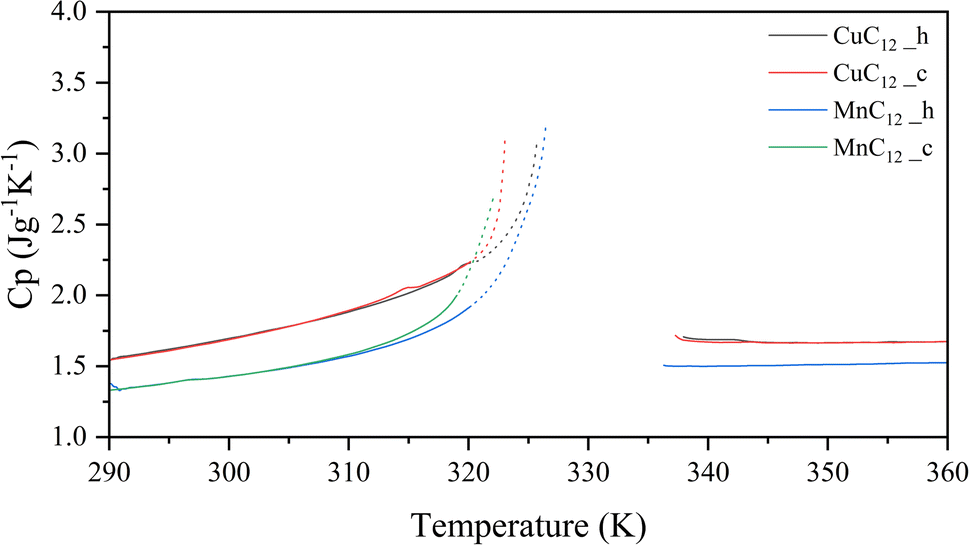 | ||
| Fig. 11 Specific heat profile as a function of the temperature for CuC12 and MnC12 (h: heating; c: cooling). | ||
Moreover, CuC12 has higher Cp values than the MnC12 sample, which goes from 1.5 to 2.2 J g−1 K−1 and 1.3 to 1.5 J g−1 K−1 before the transition. After the transition, the values remain constant at around 1.7 and 1.5 J g−1 K−1. Comparing the results with other solid–solid PCM, which works in the same range of temperatures, they present values similar to the polymeric solid–solid PCM, which are around 0.8 to 1.5 J g−1 K−1.35,36
The thermogravimetric study performed is presented in Fig. 12, which reveals four different decomposition steps (I–IV). The first step (I), occurring up to 420 K, is attributed to the sample moisture and results in a weight loss of 1.5 wt%. This effect is observed mainly in the MnC12 sample and is likely due to the sample preparation process. The second step (II) corresponds to the degradation of the carbon chain portion of the LHOIP, obtaining CxHyNz as an undecomposed organic residue and the formation of MCl2.37,38 This step shows a mass loss of 50 and 45 wt% up to 595 and 635 K for CuC12 and MnC12, respectively. The third step (III) involves decomposing the CxHyNz organic residue with a mass loss of 10 and 7 wt% up to 700 K.37 The final step (IV) involves the release of chlorides from the metal complex, which corresponds to a mass loss of 30 and 37 wt% up to 900 K.39 A schematic approach to the decomposition steps is presented in eqn (2).
 | (2) |
 | ||
| Fig. 12 Thermograms, weight loss as a function of temperature for CuC12 and MnC12 complexes. | ||
Furthermore, the thermo-oxidative temperatures at 5% (T5%) and 10% (T10%) mass loss and the non-volatile inorganic residue at 900 K were determined. The thermos-oxidative temperatures of CuC12 at T5% and T10% are 492 and 500 K, and for the MnC12, they are 520 and 540 K, respectively. The residue at 900 K was 8.5 and 9.4 wt% for the CuC12 and MnC12, respectively. The MnC12 presents higher thermo-oxidative temperatures, possibly due to the higher polarity of the alkylamine and manganese chloride, resulting in a higher bond force. These results show that CuC12 and MnC12 present competent thermal stability compared to other families of solid–solid PCMs. The maximum working temperature for organic ss-PCMs is 423–523 K, and for polymeric ss-PCMs is 473–573 K.36
4 Conclusions
In this work, we report the structural and thermal characterization of selected LHOIPs, CuC12 and MnC12, to be considered as suitable solid–solid phase change materials. The main remarks of the study are the following:- The crystal structure of CuC12 and MnC12 is resolved at 100 K for the first time, obtaining a triclinic structure at this temperature. Moreover, the structures were deposited in the CSD.
- The molecular structure of both structures is well described by FTIR and NMR, where the NMR results validate the amine protonation of the obtained components.
- The calorimetry results show that we are dealing with first-order structures, and polymorphic transitions and with low-hysteresis materials that present a specific heat around 1.5–2.2 J g−1 K−1.
This study provides enough knowledge to consider these materials ideal candidates for cooling purposes in special applications like electronics or aerospace, among others. However, further investigation regarding the molecular motion of the hydrocarbon chain must be done in order to understand the polymorphic transitions and enhance them fully.
Data availability
Data will be made available on request. The crystallographic data for [MnC12] and [CuC12] has been deposited at the [CCDC] under [2305993] and [2305992].Author contributions
R. Salgado: conceptualization, methodology, formal analysis, investigation, data curation, writing – original draft, writing – review & editing, visualisation. C. Puigjaner: formal analysis, investigation, data curation, writing – original draft, writing – review & editing, visualisation. J. García: formal analysis, investigation, writing – review & editing, visualisation. A. I. Fernández: conceptualization resources, supervision, writing – review & editing, funding acquisition, project administration. C. Barreneche: resources, supervision, writing – review & editing, funding acquisition, project administration.Conflicts of interest
There are no conflicts to declare.Acknowledgements
The authors would like to thank the Catalan Government for the quality accreditation given to their research group (DIOPMA 2021 SGR 00708). DIOPMA is a certified agent TECNIO in the category of technology developers from the Government of Catalonia. The authors are grateful to the CCiTUB for the equipment or measurements of XRD, ICP, elemental analysis and NMR, to the ALBA Synchrotron for the XRD at variable temperature and to the Condensed Matter Physics Department of the University of Barcelona for their contribution with some calorimetry measurements. This work is partially supported by the grant PID2021-123511OB-C32 funded by MCIN/AEI/10.13039/501100011033 and, as appropriate, by “ERDF A way of making Europe” and the PhD grant PRE2019-087336 funded by MCIN/AEI/10.13039/501100011033 and, as appropriate, by “ESF Investing in your future” of R. Salgado-Pizarro.References
- P. K. Schelling, L. Shi and K. E. Goodson, Mater. Today, 2005, 8, 30–35 CrossRef CAS.
- M. Ikhlaq, M. Yasir, M. Demiroglu and M. Arik, IEEE Trans. Compon., Packag., Manuf. Technol., 2021, 11, 1156–1170 CAS.
- L. T. Yeh, J. Electron. Packag., 1995, 117, 333–339 CrossRef.
- A. Danowitz, K. Kelley, J. Mao, J. P. Stevenson and M. Horowitz, Commun. ACM, 2012, 55, 55–63 CrossRef.
- A. R. Dhumal, A. P. Kulkarni and N. H. Ambhore, J. Eng. Appl. Sci., 2023, 70, 140 CrossRef.
- T. Bo, T. Zhi-Cheng, L. Rui-Bin, M. Chang-Gong and Z. Jing-Nan, Energy Convers. Manage., 2010, 51, 1905–1910 CrossRef.
- W. Li, D. Zhang, T. Zhang, T. Wang, D. Ruan, D. Xing and H. Li, Thermochim. Acta, 1999, 326, 183–186 CrossRef CAS.
- A. Usman, F. Xiong, W. Aftab, M. Qin and R. Zou, Adv. Mater., 2022, 34, 2202457 CrossRef CAS PubMed.
- J. Timmermans, J. Phys. Chem. Solids, 1961, 18, 1–8 CrossRef CAS.
- S. Santos-Moreno, S. Doppiu, G. A. Lopez, N. Marinova, Á. Serrano, E. Silveira and E. Palomo del Barrio, Materials, 2020, 13, 1162 CrossRef CAS PubMed.
- X. Lu, C. Fang, X. Sheng, L. Zhang and J. Qu, Ind. Eng. Chem. Res., 2019, 58, 3024–3032 CrossRef CAS.
- K. Chen, R. Liu, C. Zou, Q. Shao, Y. Lan, X. Cai and L. Zhai, Sol. Energy Mater. Sol. Cells, 2014, 130, 466–473 CrossRef CAS.
- S. Tan, N. Zhou, Y. Chen, L. Li, G. Liu, P. Liu, C. Zhu, J. Lu, W. Sun, Q. Chen and H. Zhou, Adv. Energy Mater., 2018, 1803024 Search PubMed.
- J. Li, M. Barrio, D. J. Dunstan, R. Dixey, X. Lou, J.-L. Tamarit, A. E. Phillips, P. Lloveras, J. Li, D. J. Dunstan, R. Dixey, A. E. Phillips, X. Lou, M. Barrio, J.-L. Tamarit and P. Lloveras, Adv. Funct. Mater., 2021, 31, 2105154 CrossRef CAS.
- R. Salgado-Pizarro, J. A. Padilla, E. Xuriguera, C. Barreneche and A. I. Fernández, Energies, 2021, 14, 2621 CrossRef CAS.
- C. Barreneche, L. Navarro, A. de Gracia, A. I. Fernández and L. F. Cabeza, Renew Energy, 2016, 85, 281–286 CrossRef CAS.
- V. Busico, P. Corradini, M. Vacatello, F. Fittipaldi and L. Nicolais, in Thermal Storage of Solar Energy, ed. C. den Ouden, Springer, Dordrecht, 1981, pp. 309–324 Search PubMed.
- R. Kind, S. Pleko, H. Arend, R. Blinc, J. Seliger, B. Loar, J. Slak, A. Levstik, C. Filipi, G. Lahajnar, F. Milia and G. Chapuis, J. Chem. Phys., 1979, 71, 2118 CrossRef CAS.
- M. Vacatello, V. Busico and P. Corradini, J. Chem. Phys., 1982, 78, 590–591 CrossRef.
- M. Bochalya, P. K. Kanaujia, G. Vijaya Prakash and S. Kumar, AIP Conf. Proc., 2019, 2142, 2–6 CrossRef.
- R. Salgado-Pizarro, A. Svobodova-Sedlackova, A. I. Fernández and C. Barreneche, J. Energy Storage, 2023, 73, 109156 CrossRef.
- V. Busico, C. Carfagna, V. Salerno, M. Vacatello and F. Fittipaldi, Sol. Energy, 1980, 24, 575–579 CrossRef CAS.
- G. F. Needham, R. D. Willett and H. F. Franzen, J. Phys. Chem., 1984, 88, 674–680 CrossRef CAS.
- R. Salgado-Pizarro, C. Barreneche and A. I. Fernández, Mater. Today Chem., 2023, 30, 101491 CrossRef CAS.
- F. Fauth, I. Peral, C. Popescu and M. Knapp, Powder Diffr., 2013, 28, S360–S370 CrossRef CAS.
- A. Boultif and D. Louër, J. Appl. Crystallogr., 2004, 37, 724–731 CAS.
- A. A. Coelho, J. Evans, I. Evans, A. Kern and S. Parsons, Powder Diffr., 2011, 26, S22–S25 CrossRef CAS.
- M. Bochalya, P. K. Kanaujia, G. Vijaya Prakash and S. Kumar, J. Solid State Chem., 2019, 273, 219–225 CrossRef CAS.
- D. He, Y. Di, Y. Yao, Y. Liu and W. Dan, J. Chem. Eng. Data, 2010, 55, 5739–5744 CrossRef CAS.
- M. Bochalya, P. K. Kanaujia, G. Vijaya Prakash and S. Kumar, J. Solid State Chem., 2019, 273, 219–225 CrossRef CAS.
- J.-K. Kang, J.-H. Choy and M. Rey-Lafon, J. Phys. Chem. Solids, 1993, 54, 1567–1577 CrossRef CAS.
- R. G. Snyder, J. Mol. Spectrosc., 1961, 7, 116–144 CrossRef CAS.
- E. Pretsch, T. Clerc, J. Seibl and W. Simon, Tabellen zur Strukturaufklärung organischer Verbindungen: mit spektroskopischen Methoden, Springer-Verlag, Heidelberg, 1976 Search PubMed.
- J. E. Sarneski, H. L. Surprenant, F. K. Molen and C. N. Reilley, Anal. Chem., 1975, 47, 2116–2124 CrossRef CAS.
- A. Fallahi, G. Guldentops, M. Tao, S. Granados-Focil and S. Van Dessel, Appl. Therm. Eng., 2017, 127, 1427–1441 CrossRef.
- C. R. Raj, S. Suresh, R. R. Bhavsar and V. K. Singh, J. Therm. Anal. Calorim., 2020, 139, 3023–3049 CrossRef CAS.
- D. Wyrzykowski, A. Pattek-Janczyk, T. Maniecki, K. Zaremba and Z. Warnke, J. Therm. Anal. Calorim., 2008, 91, 279–284 CrossRef CAS.
- E. Styczeń, A. Pattek-Janczyk, M. Gazda, W. K. Jóźwiak, D. Wyrzykowski and Z. Warnke, Thermochim. Acta, 2008, 480, 30–34 CrossRef.
- E. Styczeń, W. K. Jóźwiak, M. Gazda, D. Wyrzykowski and Z. Warnke, J. Therm. Anal. Calorim., 2008, 91, 979–984 CrossRef.
Footnote |
| † Electronic supplementary information (ESI) available. CCDC 2305993 and 2305992. For ESI and crystallographic data in CIF or other electronic format see DOI: https://doi.org/10.1039/d4ta01060d |
| This journal is © The Royal Society of Chemistry 2024 |