
 Open Access Article
 This Open Access Article is licensed under a
 Creative Commons Attribution 3.0 Unported Licence
Aging iridium oxide catalyst inks: a formulation strategy to enhance ink processability for polymer electrolyte membrane water electrolyzers†
Sunilkumar
Khandavalli
 *a,
Jae Hyung
Park
b,
Robin
Rice
a,
Diana Y.
Zhang‡
ac,
Sarah A.
Berlinger
d,
Guido
Bender
a,
Deborah J.
Myers
b,
Michael
Ulsh
a and
Scott A.
Mauger
a
*a,
Jae Hyung
Park
b,
Robin
Rice
a,
Diana Y.
Zhang‡
ac,
Sarah A.
Berlinger
d,
Guido
Bender
a,
Deborah J.
Myers
b,
Michael
Ulsh
a and
Scott A.
Mauger
a
aChemistry and Nanoscience Center, National Renewable Energy Laboratory, 15013 Denver West Parkway, Golden, Colorado 80401, USA. E-mail: skhandav@nrel.gov
bChemical Sciences and Engineering Division, Argonne National Laboratory, Argonne, Illinois 60439, USA
cDepartment of Chemical Engineering and Materials Science, University of Minnesota, Minneapolis, Minnesota 55455, USA
dEnergy Conversion Group, Lawrence Berkeley National Laboratory, Berkeley, California 94720, USA
First published on 28th October 2024
Abstract
Iridium oxide (IrO2) is recognized as a state-of-art catalyst for anodes of low-temperature polymer-electrolyte membrane water electrolyzers (PEMWE), one of the promising clean energy technologies to produce hydrogen, a critical energy carrier for decarbonization. However, typical IrO2 ink formulations are challenging to process in liquid-film coating processes because of their poor stability against gravitational settling and low viscosities. Here we report on time evolution of the microstructure of concentrated IrO2 inks in a water-rich dispersion medium, probed using a combination of rheology and X-ray scattering for up to four days. The inks progressively evolve from a predominantly liquid-like to a gel-like material with increasing aging time that can be leveraged as a formulation strategy to enhance their stability against sedimentation, and processability during electrode fabrication. We also elucidate the aging behavior by investigating the effects of ink formulation composition – ionomer concentration and solvent composition – and using the extended-DLVO theory. The implications of aging on electrode fabrication, including via direct coating onto membranes and porous transport layers, and membrane-electrode-assembly performance has also been examined. Our findings offer not only a facile but also an environmentally benign formulation strategy to enhance ink processibility, expand practical fabrication approaches, and advance PEMWE manufacturing.
1. Introduction
Low-temperature polymer electrolyte membrane water electrolyzers (PEMWE) are one of the promising technologies to produce greenhouse-gas-free hydrogen (H2), a critical energy carrier for the decarbonization of several sectors such as transportation, grid-scale energy storage and distribution, and chemical production.1,2 Key components of the PEMWE membrane electrode assembly (MEA) are the catalyst layers, composed of electrocatalyst particles, typically unsupported iridium oxide (IrO2) and supported platinum (Pt), and perfluorosulfonic acid (PFSA) ionomer, which acts as a binder for the catalyst and a proton conducting medium. The catalyst layers are commonly fabricated by liquid-film coating of an ink – a mixture of catalyst and ionomer dispersed in liquid media, often a binary mixture of water and low-aliphatic alcohol – onto a substrate, which is then dried to form the catalyst layer. Developing new or improved ink design and processing approaches for fabrication and integration of catalyst layers into MEAs, is important for reducing overall manufacturing cost (and thus H2 production costs) and accelerating wide-scale deployment of PEMWEs.Two key aspects of designing optimal ink formulations are controlling the stability and rheological properties of the inks as they play an important role during coating3 and drying processes,4 impacting the homogeneity and ease of coating of the catalyst layer.5,6 Ideally, inks are stable against agglomeration and gravitational settling during processing (i.e., ink preparation, coating, and drying steps) for ease of handling and the creation of a uniform, homogeneous catalyst microstructure, and for optimal catalyst utilization, which can potentially impact the device performance.7–9 Additionally the rheological properties of the catalyst ink would need to be fine-tuned to match the requirements of the desired catalyst-layer coating method (such as slot-die, blade, gravure, or screen-printing) and catalyst loading.
However, because of high density of IrO2 particles (11.66 g cm−3), which is nearly ∼6× greater than the Pt-on-carbon black used on the cathode side of a PEMWE, typical IrO2 ink formulations show poor stability against gravitational sedimentation. Furthermore, their low porosity along with high density of IrO2, the viscosities are generally low (∼2 mPa s–100 mPa s).10 Moreover, due to concerns around catalyst poisoning or disrupting an optimal catalyst structure/morphology for best device performance, there is often a reluctance to significantly alter the composition of the ink formulations, for example by the inclusion of rheology-modifying additives to improve their stability and tune rheological properties. Together poor stability and low viscosity of IrO2 inks often present challenges for the production of consistent and uniform catalyst layers.
Herein we report a dramatic change in the microstructure and rheology of IrO2 inks dispersed in a water–n-propanol (nPA) solvent mixture at high water-content (90 H2O%) after initial preparation with aging time. The microstructure of inks was probed over the course of 96 h using steady shear and oscillatory rheology. The rheological observations, confirmed by X-ray scattering measurements, of the ink over this duration show a slow evolution of their structure from a predominantly liquid-like to a gel-like material. This is the first report, to our knowledge, of such time evolution behavior in IrO2 inks. Though studies exist on IrO2 inks, their focus,10,11 including our own previous work, have been generally limited to fresh/as-prepared inks. Lyu et al.12 is the only study thus far in literature, to our knowledge, examining the effect of aging on PEMWE IrO2 inks for up to 14 days on similar ink system consisting of Nafion D2020 and water–nPA solvent mixture. However, they find aging to have very little effect on ink properties, catalyst layer morphology, and performance, though, for a different solvent composition, than those in which we observe changes. To gain insights into the mechanisms behind the aging behavior, we also examine the effects of ionomer concentration and solvent composition (water–nPA ratio) on aging behavior. The implications of the observed aging behavior on catalyst layer processing, examined by performing small-scale coating experiments, including direct coating onto membranes and porous transport layers (PTLs), and MEA performance has also been examined.
2. Experimental
2.1 Materials and sample preparation
Iridium(IV) oxide (IrO2) catalyst powder (99.9% purity, 85% Ir minimum) was acquired from Alfa Aesar. Nafion dispersions (D2020, equivalent weight (EW) ∼900 g mol−1, and D2021 of 1000 g mol−1 EW, ion power) was used as is. The Brunauer–Emmett–Teller (BET) specific surface area and the pore volume of dry IrO2 powders were measured to be approximately 15–20 m2 g−1 and 0.092 cm3 g−1, respectively.10 For both rheometry and X-ray scattering measurements, the inks were prepared by adding desired amounts of IrO2, water (Milli-Q, 18 mOhm.cm, 0.2 ppb TOC), alcohol (1-propanol, Alfa Aesar), and ionomer dispersion into a glass vial, in that order. To achieve the desired dispersion media composition, the alcohol-to-H2O mass ratio was varied appropriately, based on the solvent composition of the D2020/D2021 stock dispersion, which is specified to consist of 20 wt% ionomer, 34 wt% H2O, and 46 wt% volatile organic content (VOC) with 44 wt% 1-propanol.13 All the anode/IrO2 inks as well as ionomer dispersions were mixed by sonication in an ice water bath for 1 h. To better capture the time evolution behavior of the inks primarily due to the nature of interaction between the particles, and to minimize any gravitational sedimentation of the particles during the aging duration that could influence the degree of interparticle interactions and the aging behavior, the ink vials were placed on a tube/bottle roller (Thermo Scientific) at 80 rpm for gentle agitation for the desired duration. Unless otherwise stated, all ink concentrations reported throughout the paper are given on a mass-basis, and inks with ionomer consist of D2020. The ionomer concentration in the inks is expressed in terms of ionomer-to-catalyst mass ratio (I/C).2.2 Rheology measurement protocol
Rheological measurements on catalyst inks were performed using a stress controlled rheometer (Thermo-Scientific HAAKE Mars 60 Rheometer) with a stainless-steel parallel plate geometry (40 mm diameter) and a gap of 500 μm. For measurements on ionomer dispersions a stainless-steel cone-plate geometry (40 mm diameter and 2° cone angle) was used. All the measurements have been performed at 25 °C. A solvent saturation trap was used to minimize any solvent evaporation during measurements. Prior to making all rheological measurements, the samples were preconditioned to eliminate any sample loading history on the microstructure by conducting a pre-shear step at 500 s−1 for 60 s followed by resting for 60 s. The steady shear rheology measurements were performed by imposing a decreasing-rate sweep with logarithmic spacing. The shear rate limits were adjusted on an individual sample basis within the range of 500 to 0.05 s−1. For amplitude-sweep measurements, the frequency was fixed at 0.5 Hz and the strain amplitude was increased logarithmically from 0.001 to 10. For frequency-sweep measurements, the frequency was varied from 1 Hz to 0.01 Hz at a fixed strain amplitude chosen from the linear viscoelastic region.2.3 X-Ray scattering
The structure of IrO2 inks was characterized through ultra-small-angle and small-angle X-ray scattering (USAXS/SAXS) using beamline 9ID-C at the advanced photon source (APS) at Argonne National Laboratory. The catalyst inks, prepared using the process described earlier, were placed into 1 mm-diameter glass capillaries, sealed with epoxy resin to avoid air entrapment, and positioned horizontally in the beamline hutch. These samples were exposed to monochromatic X-rays with energy ranging from 16.8 to 21 keV. Scattered X-ray intensity was measured using a Bonse–Hart camera for USAXS and a Pilatus 100 K detector for SAXS. Two different q-ranges for scattering vectors, 10−4 to 6 × 10⁻² Å−1 for USAXS and 3 × 10⁻² to 1 Å−1 for SAXS, enabled capturing of structural information from nanoscale to micron-sized aggregates. X-Ray photon flux was around 5 × 1012 mm−2 s−1. The relationship between scattering vector q and the object size was given by q = 4π![[thin space (1/6-em)]](https://www.rsc.org/images/entities/char_2009.gif) sin(θ/2)/λ, where λ is the X-ray beam wavelength.14,15 Background scattering from a capillary filled with the solvent was recorded and subtracted from the ink data to ensure accurate readings. The data analysis was performed using Irena software, developed by APS X-ray Science Division, on the Igor Pro (WaveMetrics) platform. This analysis utilized the maximum entropy method coupled with a regularization technique to obtain a smooth particle size distribution by minimizing the sum of squared curvature deviations.16,17
sin(θ/2)/λ, where λ is the X-ray beam wavelength.14,15 Background scattering from a capillary filled with the solvent was recorded and subtracted from the ink data to ensure accurate readings. The data analysis was performed using Irena software, developed by APS X-ray Science Division, on the Igor Pro (WaveMetrics) platform. This analysis utilized the maximum entropy method coupled with a regularization technique to obtain a smooth particle size distribution by minimizing the sum of squared curvature deviations.16,17
2.4 Dynamic light scattering (DLS) and electrophoretic mobility measurements
DLS and electrophoretic mobility measurements (to calculate zeta potential ζ) have been performed using Zetasizer Nano ZS (Malvern Instruments Ltd, Malvern, UK). A high-concentration zeta cell (ZEN1010) was used for the tests, allowing measurements of turbid samples, such as here, due to smaller path length of the cell. The inks were prepared following a similar procedure described above, but were limited to dilute concentrations (0.1% IrO2) as allowed by the method. A Helmholtz–Smoluchowski (HS) equation18 was used to calculate ζ, assuming that the electric double layer thickness (which is typically few nms) is much smaller than the particle size, which is valid here as the Zavg diameter of the particles determined from DLS is ∼200 nm. All the measurements have been performed at 25 °C.2.5 Ionomer adsorption measurements
To determine the amount of adsorbed ionomer onto IrO2 particles, inks were prepared using the procedure outlined above. They contained 2.5 wt% IrO2 in a 9:1 H2O:nPA (w/w) with varying I/C ratios using Nafion D2020. Immediately after sonication, the inks were centrifuged for one hour at 11000 rpm. This caused the IrO2 with adsorbed Nafion to sediment, while the free Nafion remained in the supernatant. To ensure that only adsorbed Nafion remained on the sediment, the supernatant was removed, and the sediment was washed with MilliQ water and recentrifuged for 30 minutes. The sediment was then dried at 100 °C for one hour to remove residual water. To quantify the amount of adsorbed ionomer, approximately 40 mg of each sample was then placed in a platinum pan and loaded into the Thermogravimetric Analyzer TGA (Q50, TA Instruments), where they were held at 100 °C for 30 minutes, prior to ramping up to 800 °C at 30 °C min−1 in nitrogen. Adsorbed Nafion degradation occurs between ∼300 °C and 650 °C, with complete degradation before 650 °C.19 While IrO2 also experiences mass loss in this same temperature range, the mass loss is reproducible. Therefore, the mass change due to only ionomer degradation can be calculated by subtracting the percentage mass loss between 250 and 650 °C of the control bare IrO2 from the adsorbed Nafion samples. 250 °C is chosen as the initial normalization temperature to avoid any residual water effects. From the percent mass loss due to ionomer, the amount of ionomer originally adsorbed onto the catalyst, as well as the concentration of free ionomer left in the supernatant, can be calculated.
2.6 Coating
Small-scale coating experiments were performed using either a Mayer rod (#12 and #20 with 0.3 mm and 0.51 mm wire diameters, respectively) or a Blade Coater (Zehntner Testing Instruments, 4 inch-wide) at a fixed coating gap of 50 μm, attached to an automatic film applicator (QPI-AFA3800, Qualtech Products Industry, Denver, CO, USA) that allows precise control of both their translational speed and the drying temperature by heating the coating substrate from bottom. The inks were coated onto the desired substrate (held onto the film applicator by tape) at a fixed coating speed of v = 20 mm s−1 and at a drying temperature of 80 °C or 25 °C. Three different substrates were used: Teflon (∼355 μm-thick), Nafion membrane (Nafion™ 212, 50.8-μm-thick, Ion Power, Inc., New Castle, DE, USA) and a Pt-coated porous transport layer (PTL) (2GDL10N-0.25 Pt Coated, Bekaert).2.7 Membrane electrode assembly (MEA) fabrication
For performance comparison, anode catalyst layers were fabricated using both fresh and aged (96 h after preparation) inks. The anode ink formulation consists of 18% IrO2, 0.2 ionomer-to-catalyst ratio (I/C, Nafion D2021), and 90 wt% H2O and ∼10 wt% nPA (samples 5 & 6 in Table 1). The fresh and aged inks were coated onto a PTFE transfer liner using a Mayer rod (#20) at 25 °C as described above. The loadings were determined using X-ray fluorescence spectroscopy (Fischerscope XDV-SDD, 50 kV, 50 W X-ray source XRF) which were given in Table 1. For the cathode catalyst layer, the ink was prepared by sequential addition of 87.7 mg catalyst Pt/C (TEC10E50E Tanaka, 50 wt% HSC), and 22.9 ml water (Milli-Q), 17.5 ml n-propanol (OmniSolv, HPLC grade) into a 50 ml vial. The resulting container of ink was cooled in ice for 5 minutes. 104.9 μl of Nafion D2020 was then added to the vial, which was horn sonicated for 30 seconds. This solution was bath sonicated for 15 min in ice water, and manually shaken every 5 min before being loaded into an ultrasonic spray system for deposition. The inks were then ultrasonically spray-coated onto Nafion 115 or N212 membranes with 0.1 mgPt cm−2 loading. The anode catalyst layers were then transferred via hot press onto the cathode-coated membranes following a procedure similar to in our previous study.12 The hot-press transfer appeared visually uniform and complete for all samples.| No. | Formulation | Ink state | Coating temperature (°C) | Substrate | Ir loading mgIr cm−2 |
|---|---|---|---|---|---|
| 1 | 20% IrO2–50% H2O|D2020 | Aged | 80 | Teflon | 0.47 ± 0.035 |
| 2 | 20% IrO2–90% H2O|D2020 | Aged | 80 | Teflon | 0.63 ± 0.020 |
| 3 | 20% IrO2–90% H2O|D2020 | Fresh | 80 | Membrane | 0.79 ± 0.019 |
| 4 | 20% IrO2–50% H2O|D2020 | Aged | 80 | Membrane | 0.66 ± 0.020 |
| 5 | 18% IrO2–90% H2O|D2021 | Fresh | 25 | Teflon | 0.55 ± 0.042 |
| 6 | 18% IrO2–90% H2O|D2021 | Aged | 25 | Teflon | 0.58 ± 0.019 |
The catalyst coated membranes were assembled into PEM electrolysis test hardware with a 5 cm2 Pt-coated porous transport layer (PTL) (2GDL10N-0.25 Pt Coated, Bekaert) and carbon paper gas diffusion layer (GDL) (MGL280 Carbon Paper, AvCarb) with an estimated 20% compression of the GDL set by PTFE gaskets outside the active area.
2.8 Electrochemical performance measurement
Tests were performed on MEAs having at least two anode catalyst layer coatings of both the fresh and aged (96 h) water-rich inks, labelled as fresh ink #1 and #2, and aged ink #1 and #2. The performance testing routine evolved during the testing matrix. The fresh ink #2 CCM was tested last with a testing routine of cyclic voltammetry (CV), conditioning, polarization curve, electrochemical impedance spectroscopy (EIS), and CV. The aged #1 and #2 CCMs were tested likewise except without the initial CV measurement. Finally, the fresh #1 CCM only received conditioning and polarization curve testing. The CV testing conditions are described below.Conditioning, polarization curve, and EIS employed a dry cathode and 50 ml min−1 DI H2O anode flow rate at 80 °C. Conditioning consisted of a 24-minute ramp to 1.85 V, a 10 hour hold at 1.85 V, a 30-minute hold at 1.5 V, and a series of 11 polarization curves ramping between 0.01 A cm−2 and 4.0 A cm−2. The total conditioning time was approximately 40 hours. For EIS measurement the conditioning period was performed using an AutoLab PGSTAT302N in combination with a 20 A booster. Impedance spectra were recorded galvanostatically at every polarization curve point from 0.01 A cm−2 to 4 A cm−2, over a frequency range from 40 kHz to 0.4 Hz. Within the EIS measurement an additional potentiostatic impedance curve was recorded at 1.25 V for transmission-line impedance analysis before the polarization curve. Reported polarization curves were recorded sweeping from low to high current density.
Cyclic voltammetry was performed using an Autolab PGSTAT302N in combination with a 20 A booster both before cell conditioning and following EIS measurements. The cell environment was maintained at 80 ± 0.5 °C, with water flowing over the anode, and humidified (100% RH) hydrogen flowing over the cathode at 80 ± 0.5 °C. A total of 10 scans between 1.4 V and 0.01 V were measured at a 0.2 V s−1 scan rate.
3. Extended DLVO theory
The classical DLVO theory describes the net interaction potential between particles (ϕnet,DLVO) as a sum of van der Waals attraction potential (ϕvdW) and electrostatic repulsion potential (ϕe), ϕnet,DLVO = ϕvdW + ϕe. To elucidate the role of hydrophobic forces on attraction between particles in water-rich IrO2 inks, we use the extended DLVO theory, incorporating the contribution from hydrophobic forces arising from the ionomer coverage on the particle surface. For simplicity, we exclude any contributions from steric repulsions to the total interaction potential assuming the thickness of the ionomer coverage on the particle surface to be very small to impart repulsions via steric hinderance mechanism.The van der Waals attraction potential is given by20
 | (1) |
 | (2) |
The electrostatic repulsion potential is given as23
 | (3) |
 | (4) |
:1 electrolyte in the medium (mol m−3), which was varied between 0–25 mM NaCl. For salt-free condition, an electrolyte concentration of 3 mM was used by taking an average of pH values of Nafion dispersions in the same solvent mixtures (90% H2O/10% nPA) reported in ref. 25 which was found to vary between 1.7 and 3.2 for 0.1 to 4 wt% ionomer concentration range.
The hydrophobic interaction potential can be calculated using van Oss, Chaudhury, and Good (VOCG) theory,26,27
| ϕh(x) = −2ΔGABSLπl0aexp(−(x0 − x)/l0) | (5) |
 | (6) |
One can also evaluate the time needed for the particles to overcome the energy barrier and undergo aggregation using the Smoluchowski's theory. The driving force for collision between particles that must occur in order for the particles form a larger aggregate/floc could be either Brownian motion/thermal energy or an external force such as shear or other forces. If we consider the case of diffusion-limited aggregation, with collisions occurring between two equally sized spheres, the time required for the particle populations to reduce by 50%, called coagulation time (the characteristic time scale of aggregation), is given by,30,31
 | (7) |
 | (8) |
4. Results and discussion
This section is organized as follows: first the time evolution behavior of water-rich inks is discussed. This is followed by the investigation into the mechanism behind the aging behavior in water-rich inks by examining the effects of formulation composition – ionomer concentration and water–alcohol composition – on their aging behavior. We conclude by examining the implications of changes in the rheology and structure of aged water-rich inks on coatability as well as MEA performance.4.1 Time evolution of ink microstructure and rheology
Fig. 1a shows the steady shear rheology – viscosity versus shear rate – of concentrated water-rich IrO2 inks, consisting of 90% H2O in a water–nPA solvent mixture, 20% IrO2, and 0.2 I/C (D2020), as a function of aging time since preparation, spanning ta ∼ 0 h to 96 h. Unless otherwise stated, the ink composition is the same for all the data presented in the Results and discussion section. As can be seen in Fig. 1a, the fresh inks (ta = 0 h) display a Newtonian response. After ta = 3 h, their viscosity at all shear rates begins to increase and the response changes from Newtonian to shear thinning, indicating a buildup in their microstructure. With further increase in ta, up to 96 h, both their overall viscosities and the shear-thinning magnitudes continue to increase. This indicates a progressive buildup of structure or an increase in the degree of catalyst flocculation with aging time. Such an increase with aging time leads to an increase in the degree of breakdown of flocculated structure by shear forces resulting in the observed increase in the magnitude of shear thinning. For ta > 7 h, the asymptotic increase in the viscosity at low shear rates without a clear low-shear Newtonian plateau suggests the existence of a finite yield stress, thus the formation of a percolated network. Note that for ta ≥ 3 h cases showing shear thinning, reflecting a break-down of the flocculation structure, the increase in viscosity with aging time at the highest shear rate (500 s−1) is significant, nearly 15× between 3 h and 96 h. With an increase in the degree of flocculation, the magnitude of shear rates required to completely breakdown the flocculated structure is also expected to increase. Therefore, a partial break down of the flocculated structure at the maximum shear rate studied here would explain such large increase in their high-shear rate viscosities with aging time. Alternately, if the shear rates are large enough to breakdown the flocculated structure completely, the contribution of any free ionomer existing in the medium to the viscosity would become important. At such condition, any increase/growth in the structure of ionomer itself with aging time could also contribute to the observed large increase in shear viscosities at high shear rates. Future studies using techniques such as Rheo-SANS, allowing visualization of the evolution of structure in shear, could help clarify whether the large viscosities at high shear rates in aged inks is predominantly due to partial break-down of catalyst flocs or due to any structure growth in ionomer itself with aging time. | ||
| Fig. 1 (a) Steady-shear rheology, (b) frequency sweep, (c) summary of moduli at 5.18 rad s−1 from the frequency sweep data and (d) amplitude sweep data at different aging times of water-rich inks (20% IrO2–0.2 I/C–90% H2O in dispersion medium). The lines in plots (c) are only a guide-to-eye. | ||
The changes in the ink phase with aging time could be better captured from their viscoelastic response – linear and non-linear – characterized using oscillatory shear rheology. Fig. 1b shows linear viscoelasticity (or small amplitude oscillatory shear rheology) – storage modulus (G′) and loss modulus (G′′) as a function of frequency (ω) – of the inks at different aging times, although only for ta ≥ 7 h. For ta < 7 h, we were unable to accurately characterize their frequency sweep response due to low signal-to-noise ratios. With increasing ta, the magnitude of G′ and G′′ throughout the frequency range increases and the frequency dependency of the moduli decreases, indicative of an increase in the average relaxation time of the inks. Such a trend suggests a progressive buildup of their ink structure with aging time which can be better visualized from the increasing trend in G′ and G′′ at ω = 5.18 rad s−1 summarized in Fig. 1b. Furthermore, at ta = 7 h, G′ < G′′ through the frequency range, scaling differently with frequency where G′ ∼ ω0.50 and G′ ∼ ω0.62, which indicates a predominantly viscoelastic liquid-like structure of the inks where the clusters/aggregates of IrO2 are still isolated and have not yet grown to a volume-spanning network. Whereas for ta > 7 h, G′ > G′′ throughout the frequency range, which suggests a predominantly viscoelastic solid-like nature of the inks and the formation of a percolated network of clusters. Such a transition in their viscoelastic response after 7 h is consistent with the change in their steady-steady response from that of a shear thinning liquid to that of an yield-stress fluid.
The non-linear viscoelastic response (amplitude sweep response) of the inks as shown in Fig. 1d is also consistent with the linear viscoelastic response indicating a similar evolution of their structure/phase with aging time. At ta = 7 h, the non-linear response is like that of a predominantly viscoelastic liquid-like material, where G′ < G′′ in the linear viscoelastic (LVE) region at low γ0 where the moduli are strain independent. In the non-linear region, both G′ and G′′ decline with increasing γ0, known as strain softening and strain thinning, respectively. Such non-linearities are indicative of a break-down of the structure of flocs by large deformation amplitudes, reducing their viscoelasticity. Whereas for ta > 7 h, the inks display a response typical of colloidal gels.33,34 In the LVE region, G′ > G′′, indicative of a predominantly elastic-like structure at equilibrium with the values of moduli increasing with aging time, suggests an increase in the strength of the network/percolation degree. In the non-linear viscoelastic regime, G′ shows a strain-softening response. Whereas G′′ exhibits a weak strain thickening response at intermediate γ0 range due to an increase in dissipation as a result of network breakdown, followed by a strain thinning response at large γ0. With increasing aging time, the intensity of the dominant non-linearities (strain softening and strain thinning), quantified by the power-law exponents m (G′ ∼ γ0−m) and n (G′′ ∼ γ0−n), increases. Between ta = 7 to 96 h, m increases only slightly from 1.00 to 1.14, whereas n increases nearly by 2× factor, from 0.26 to 0.46, reflecting an increase in the degree of network, and commensurate larger extent of break-down at large deformations. These comparisons of their viscoelastic response further support a slow build-up in the microstructure of water-rich inks with aging time.
Using combined USAXS/SAXS, we further confirm the structure buildup in water-rich inks with aging time. Fig. 2a shows the scattering curves – scattering intensity (I) vs. scattering vector (q) – of fresh inks and aged inks ta = 96 h after preparation in water-rich media. The high q range (>0.005 Å−1), where the shape of the scattering curves looks similar between fresh and aged inks, corresponds to the internal structure of the primary aggregates (aggregates of primary particles) as the length scales are less than 120 nm (a ∼ 2π/q). This is to be expected since the same catalyst was used. However, at lower q (< 0.005 Å−1), which corresponds with scattering features of 100 s of nm and μm, the intensity curves deviate. The scattering curves for fresh inks display a low-q plateau with a characteristic Guinier-knee. In contrast, for aged inks the intensity at low q range continues to increase. This indicates the presence of populations of larger structures, corresponding to the agglomerates of primary aggregates, and that the IrO2 particles in the aged inks are flocculated. The radius of gyration Rg values have also obtained from unified fits to the data near the primary Guinier-knee in the low-q region (q < 0.005 Å−1) reflecting the average size of the primary aggregates or agglomerates of primary aggregates. The Rg of aged inks (∼434 nm) is much larger than that of the fresh inks (Rg ∼ 85 nm). The existence of agglomerate populations in aged inks can also be seen more clearly from the volume size distribution plots extracted from the scattering curves (Fig. 2b). The mass fractal dimension obtained from power-law fits to the data in the low-q region as I ∼ q−df is df ∼ 1.95, suggests the dimensionality of IrO2 agglomerates in aged inks is ∼2D where the flocs are loosely packed or less compact. These comparisons validate the rheological observations indicating an increase in catalyst flocculation with aging time.
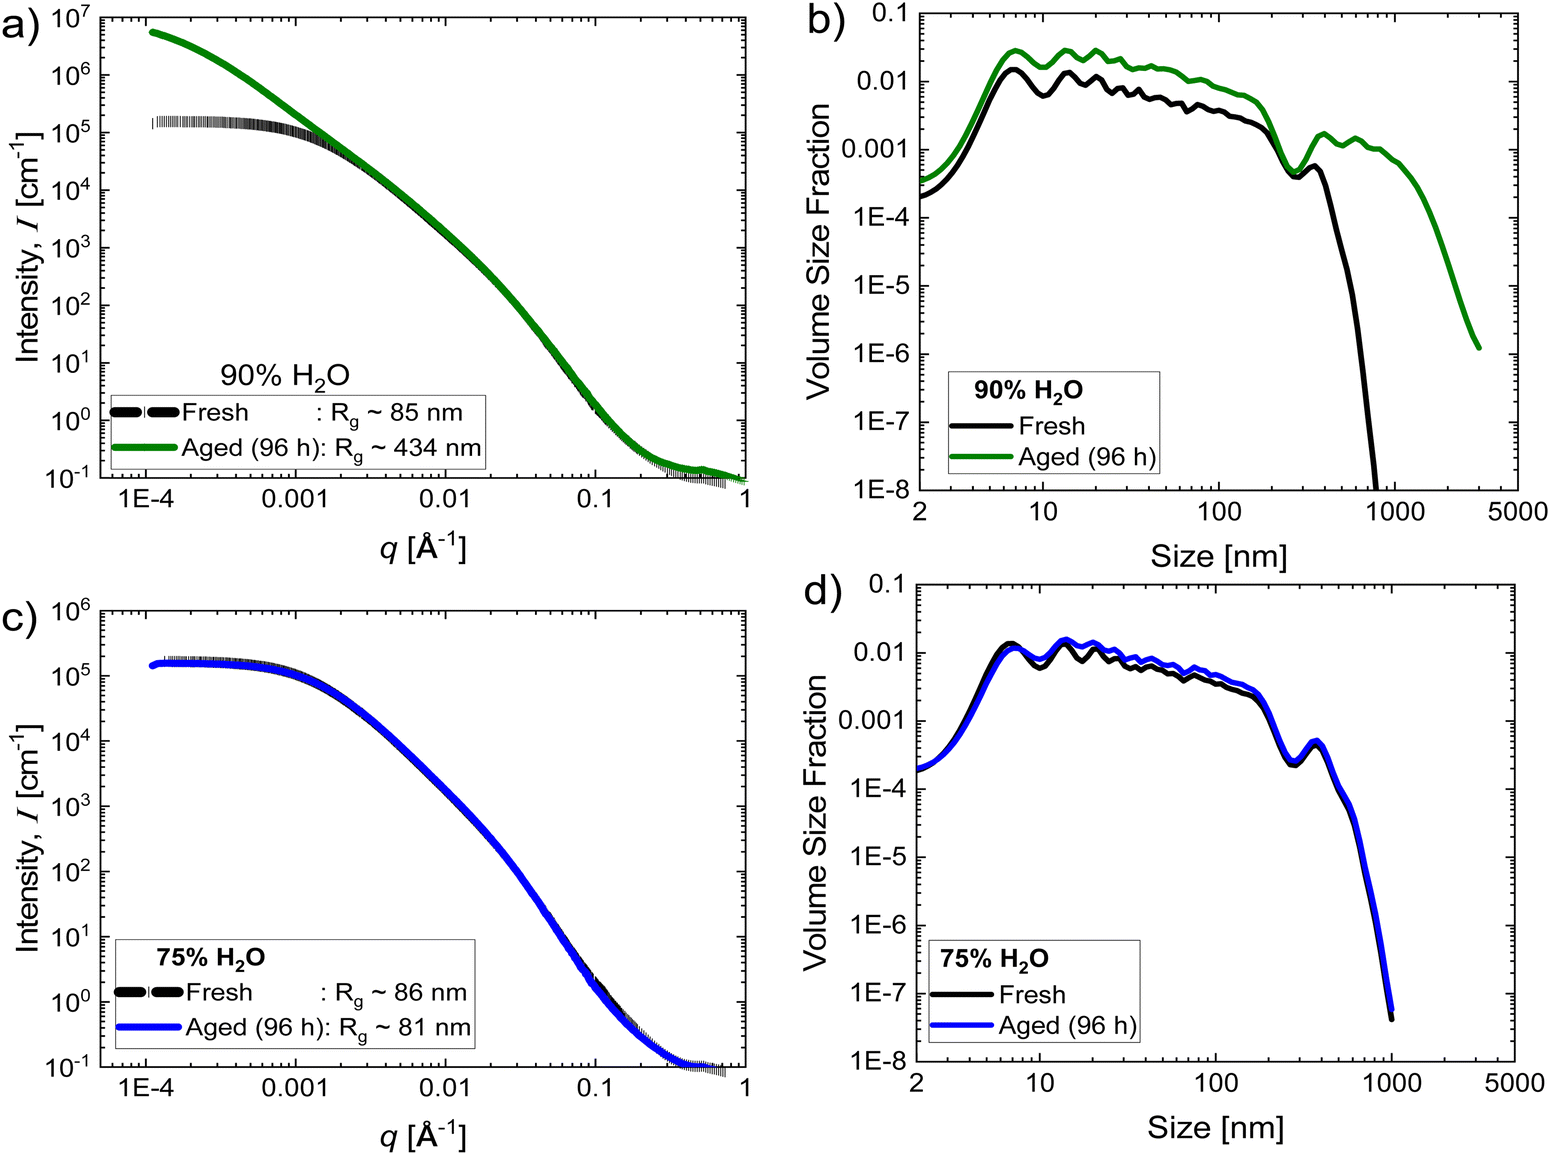 | ||
| Fig. 2 (a) and (c) Scattering curves – intensity versus scattering vector q – and (b) and (d) volume size distribution of fresh and aged inks (96 h aging time) in (a) and (b) 90% H2O and (c) and (d) 75% H2O dispersion media at 20% IrO2 and 0.2 I/C. | ||
Although the temporal variation in ink structure observed above has been previously reported for other attractive colloidal particle dispersions (i.e., clay dispersions),35,36 this is first such reports on catalyst inks, including on fuel cells, although such studies examining the time-evolution behavior of catalyst inks are very limited.12,37 The strong buildup of the microstructure of IrO2 inks, transitioning from a predominantly liquid-like to a gel-like material with aging time suggests the nature of interactions between the particles are predominantly attractive. Note that the inks here were subjected to gentle agitation during aging time, as mentioned previously in the Experimental section. If the inks were left statically during the wait period, the structure build-up observed above is not evident. The steady-shear response of statically rested inks for 96 h of aging time, measured after remixing the ink by sonication (1 h), nearly overlaps with that of the fresh inks (Fig. S1a, ESI†). This is due to predominant gravitational sedimentation of IrO2 particles in statistically rested inks after a certain aging time, evident from significant collection of IrO2 mass at the bottom of the vial after 96 h of aging time (Fig. S1b, ESI†) that is not seen in rolled inks forming a gel-like structure (Fig. S1c, ESI†); this might be expected due to the high density of IrO2 particles (11.9 g cc−1) relative to the dispersion medium (∼1 g cc−1). This will reduce the local concentration of particles, and thus the degree of interparticle interactions, preventing a continual growth of their structure and the formation of a percolated network.
In addition, the aging behavior shown above for concentrated IrO2 (20%) inks is also seen at lower IrO2 concentrations, for up to 10%, though the extent of structure build-up after a finite aging time (96 h) is lower (Fig. S2, ESI†). However, for IrO2 concentrations below 10%, the structure build-up is not evident; their steady-shear response or the viscosity magnitude varies very little with aging time, examined for up to 96 h, indicating minimal structure growth. This is expected, because decreasing particle concentration reduces the degree of interparticle interactions, retarding the flocculation kinetics, thus the extent of structure growth after a finite time.
The microstructure of the catalyst inks is dictated by the complex interplay of interactions between catalyst, ionomer, and solvent. In the next sections, we analyse how the formulation composition – ionomer and water–alcohol composition – alters the structure build-up with aging time or aging behavior of the inks, which is not only important for optimizing IrO2 ink composition in practice, but also provides insights into the mechanism behind attraction between particles in water-rich medium, resulting in the observed aging behavior.
4.2 Effect of ionomer concentration
Ionomer is well-known to play a predominantly role in dictating the microstructure of catalyst inks by strongly altering the interactions between catalyst particles. Therefore, we first investigate the role of ionomer in the aging behavior of water-rich inks by examining the effect of ionomer concentration (ionomer-to-catalyst mass ratio, I/C) on the extent of structure build-up in aged IrO2 inks. Fig. 3a compares the rheology between fresh inks and aged inks (96 h) at different I/C varied between 0 and 0.2. For better comparison, their low-shear-rate viscosity (10 s−1) as a function of I/C was also compared in Fig. 3b. At 0 I/C, the steady shear response of fresh and aged inks is very similar, displaying a weak shear thinning at low and high shear rates with shear thickening at intermediate shear rates (inset of Fig. 3a), indicating very little variation in their rheology with aging time. With the addition of a small amount of ionomer, I/C = 0.025, while both fresh and aged inks show a qualitatively similar response – predominantly shear thinning – the 96 h age inks have overall larger viscosities than that of the fresh inks, by at least 67% (Fig. 3b). For I/Cs beyond 0.05, the response of both fresh and aged inks becomes shear thinning only, but with the aged inks displaying significantly larger viscosities and shear thinning magnitudes compared to that of fresh inks. Such differences indicate an increase in the extent of structure build-up in the aged inks relative to the fresh inks with increasing I/C. The linear viscoelasticity data, though characterized only for aged inks and higher I/Cs (> 0.05) with sufficient viscoelasticity (Fig. S3, ESI†) to be able to characterize accurately, is also consistent with the steady shear rheology observations. With increasing I/C, the moduli values at all frequencies increased, indicating an increase in the structure buildup. | ||
| Fig. 3 (a) Steady-shear rheology of fresh and aged (96 h) inks as function of I/C consisting of 20% IrO2 and 90% H2O in the medium. (b) Low-shear viscosity (∼10 s−1) comparison between fresh and aged water-rich inks (90% H2O) as a function of I/C. The inset in figure a shows zoomed-in data of fresh inks. | ||
The dramatic increase in the viscoelasticity of the aged inks above 0.025 I/C where their structure evolves to a gel after a certain aging time, compared to in fresh inks, demonstrates that ionomer is playing a role in their aging where it is inducing or mediating attraction between the particles. Such an observation rules out the potential role of particles alone (i.e., interactions between bare particles) in the aging behavior, e.g., due to any surface chemistry changes with time as reported previously in Pt–carbon inks though at high alcohol-content in a water–alcohol (nPA) solvent mixture.37
Previous studies on IrO2 inks, by contrast, indicate that ionomer induces repulsions between IrO2 particles, stabilizing them against agglomeration,10,11 like in several other ink systems consisting of catalysts (platinum supported on carbon (Vulcan),38 Fe–N–C catalyst39) as well as carbon black (Vulcan and high surface carbon HSC).38 In our own previous work on the same system – IrO2 in water–nPA mixture – but at a higher alcohol-content in the media (50% nPA),10 the addition of ionomer led to a dramatic change in their steady-shear rheology of the inks. The response transitioned from strong shear thinning to Newtonian accompanied by a significant reduction in their overall viscosity. This indicated a strong decrease in the agglomerated structure of catalyst, and thus the stabilization of the catalyst by ionomer. Li et al.11 have also reported a similar dispersion of IrO2 particles by ionomer at low-to-intermediate I/C ratios from imaging the electrodes via SEM.
The conclusions in the previous studies, however, were based on comparisons between as-prepared (fresh) inks, and the time evolution behavior has not been compared. Further comparison between fresh inks, with and without ionomer, suggests stabilizing effect of ionomer on IrO2 inks at short time scales similar to previous findings. This was inferred primarily from additional experiments using USAXS and visualization of their gravitational settling behavior, as shown in Fig. 4, rather than from the rheology data. The differences in the rheology of fresh inks (Fig. 3), particularly between inks with and without ionomer, are not large enough to clearly distinguish changes in the rheology due to any variation in the agglomerated structure of IrO2 from contributions of the added ionomer to the overall viscosities.
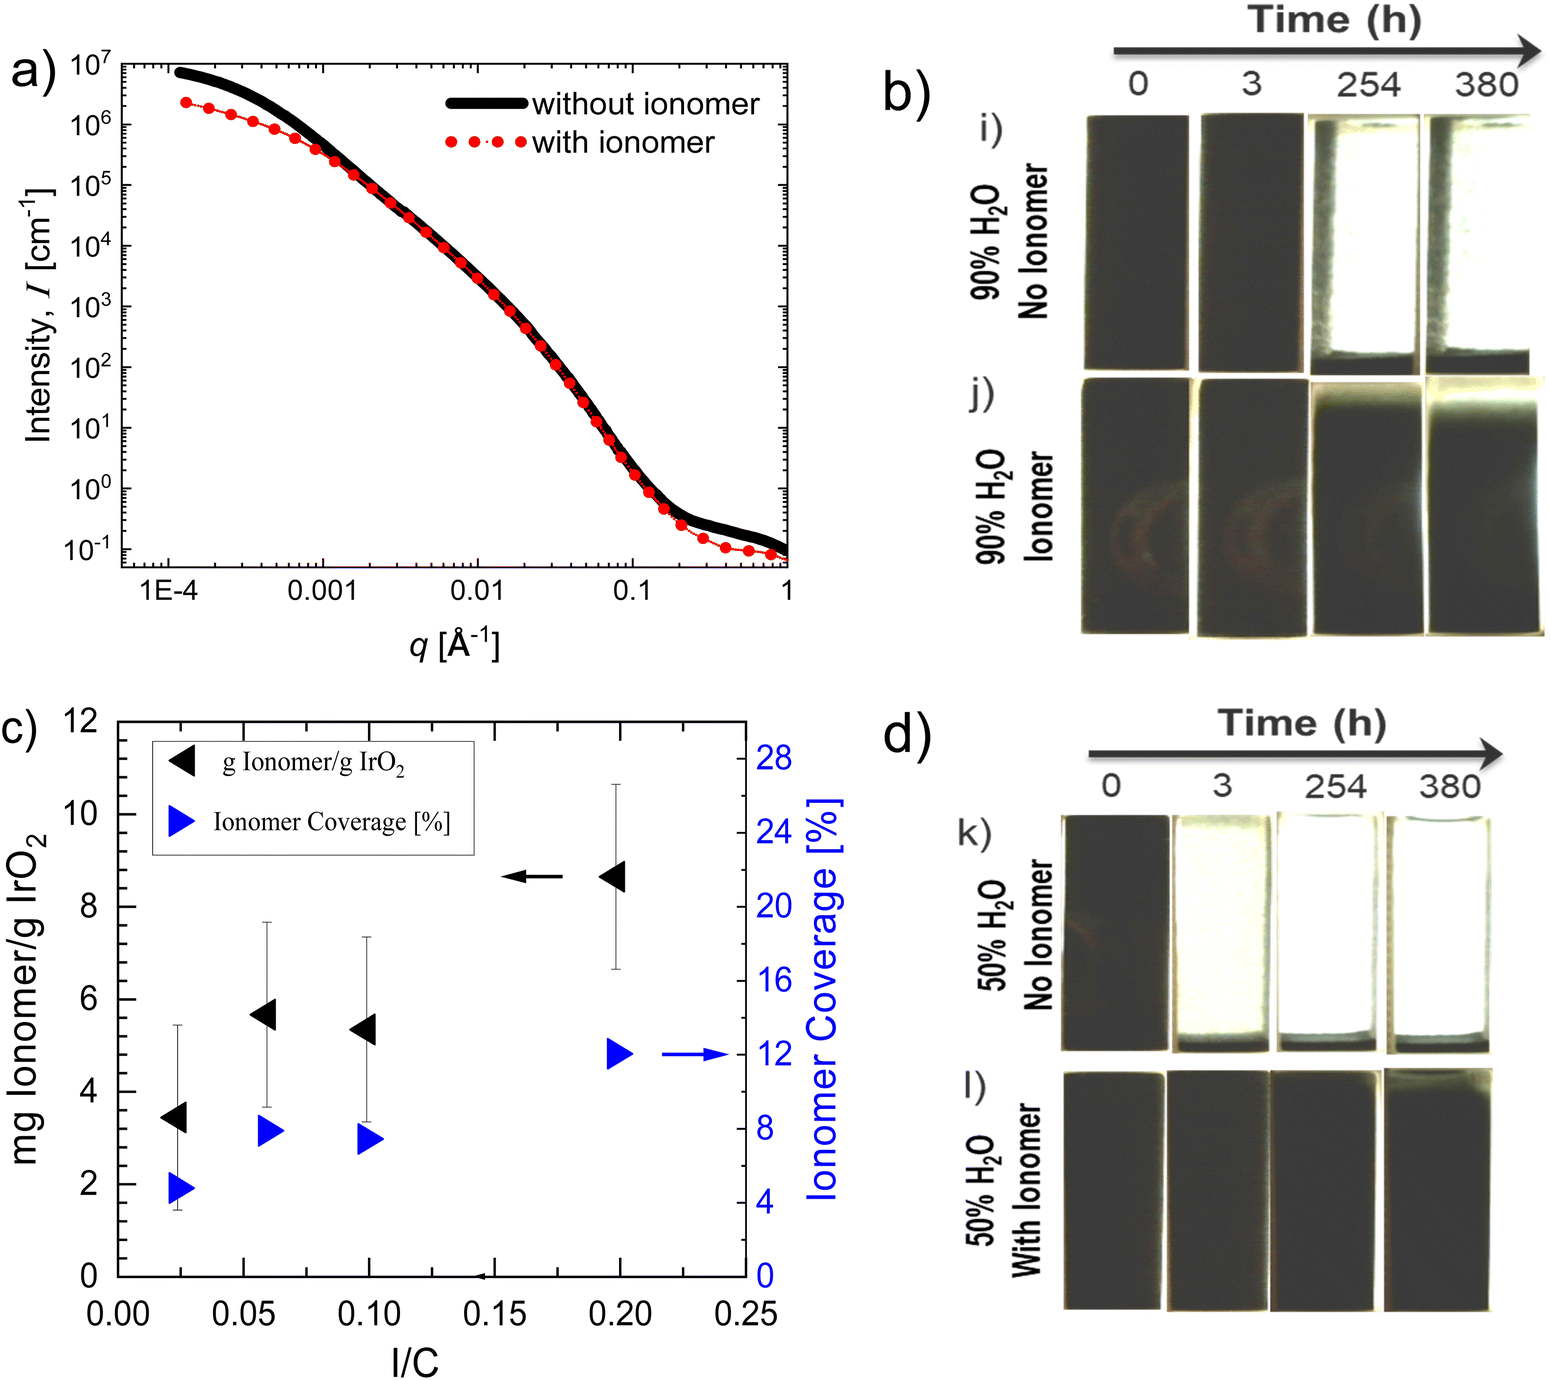 | ||
| Fig. 4 (a) Scattering curves, intensity versus scattering vector q of IrO2 inks without and with ionomer (30% IrO2–0.1 I/C–D2020–90% H2O). Visualization of gravitational settling of dilute inks in (b) 90% H2O and (d) 50% H2O in the dispersion medium, both with and without ionomer (5% IrO2–0.2 I/C–D2020). (c) Measurements of adsorbed ionomer per g of IrO2 catalyst and estimated ionomer coverage% as a function of I/C for water-rich IrO2 inks (2.5 wt% IrO2–90% H2O). | ||
Fig. 4a compares USAXS curves between fresh inks without and with ionomer at 0.1 I/C. To better capture differences in agglomeration, the IrO2 concentration here was increased to 30%. The scattering intensities of inks with ionomer in the low-q range (q < 0.03 Å−1), corresponding to larger length scales, are lower compared to that of neat inks (0 I/C) indicating reduced agglomeration. The differences are clearer from the volume size distribution of particles extracted from the scattering curves that are also compared in Fig. S4 (ESI†). Inks with ionomer have smaller population of larger particles (>300 nm) compared to inks with no ionomer. Comparison of their gravitational settling behavior visualized for over two weeks, shown in Fig. 4b, further corroborate USAXS observations. Note that dilute IrO2 concentrations (5 wt%) were chosen as they allowed better visualization of the settling behavior. Inks with no ionomer (Fig. 4b-i) settle completely within 10 h. Whereas inks with ionomer (Fig. 4b-j) only begin to settle after 254 h showing that ionomer enhances ink stability against agglomeration, retarding gravitational sedimentation of the particles.
Additional comparisons between fresh inks above show the addition of ionomer reduces IrO2 agglomeration, delaying their sedimentation, qualitatively similar to previous observations on fresh inks. Measurements of ionomer adsorption onto IrO2 particles via thermogravimetric analysis (TGA) suggest that ionomer adsorbs onto IrO2 particles. As shown in Fig. 4c, the concentration of adsorbed ionomer increases with increasing ionomer concentration. The absence of a clear plateau in the concentration of adsorbed ionomer at higher I/Cs suggests the free surface area of IrO2 is not fully saturated by ionomer coverage. The ionomer coverage% on IrO2 surface has also been roughly estimated as follows. The total projected area of the adsorbed ionomer on IrO2 particles has been calculated using the height (hi) of the adsorbed ionomer micelles as Ai = mi/ρi/hi, taking them to be cylindrical in shape as known in polar medium such as here.40,41 The ρi is ionomer density (2.05 g cc−1)42 and mi is adsorbed ionomer mass. For hi, a value of 2 nm, which is based on an AFM study characterizing Nafion adsorption from a water-rich water–nPA dispersion media (99.5 wt% H2O) on a different surface (Pt), has been used since we unaware for such measurements on IrO2 surface in literature.43 Using the average BET specific surface area (SSA) of IrO2 of 17.5 m2 g−1,10 the total surface area of IrO2 particles in the inks for a given mass of IrO2 (mp) can also be calculated as Ap = mp × SSAp. From these, the ionomer coverage of IrO2 surface has been estimated as ∼Ai/Ap × 100. The estimated ionomer coverage% as a function of I/C is shown in Fig. 4d, which increases with increasing I/C. These estimations suggest a maximum ionomer coverage of only ∼12% at the maximum I/C of 0.2 studied here. Note however that the actual ionomer coverage maybe slightly higher, because here we assume all the BET surface area of IrO2 to be accessible for ionomer coverage which might not be true due to possible presence of agglomerates that are not dispersed/broken which would reduce the accessible surface area. Even though the estimated ionomer coverage percent seems small, it appears to be sufficient to alter the interparticle interactions, as evident from the differences in the sedimentation behavior and agglomerated structure between inks with and without ionomer compared above.
Measurements of zeta potential (Fig. S5a, ESI†) – corresponding to the charge of the particles at the slipping plane – as a function of ionomer concentration (0–0.2 I/C), are also consistent with adsorption measurements suggesting the occurrence of ionomer adsorption, altering the surface chemistry of the particles, and thus their zeta potential. Although the changes are very small, the zeta potential values exhibit an increase (∼10%) with increasing ionomer concentration between 0 to 0.05 I/C, prior to declining beyond 0.05 I/C, a trend similar to in Pt–Vulcan inks reported previously.25 The initial increase is qualitatively similar to previous findings on IrO2 inks albeit in an alcohol-rich dispersion media,10,11 where the sulfonic acid groups of the adsorbed ionomer would increase the surface charge of the particles, and thus their zeta potential. The improved stability/reduced agglomeration in inks with ionomer compared to neat inks could thus be attributed to adsorbed ionomer that can impart interparticle repulsions via well-known mechanisms, similar to that commonly induced by polyelectrolytes upon adsorption onto colloidal particle surfaces – electrostatic repulsions, or steric hinderance, or a combination of both, called electro-steric repulsion.44,45
However, the observations of the structure evolution of concentrated inks over longer time scales, indicating a progressive growth of their structure with aging time, suggest that adsorbed ionomer is only providing short-term stability to the particles with attractive forces still operating between the particles. These results indicate that examination of fresh inks alone might not provide a complete picture of how ionomer is altering the interparticle interactions and on the extent of ink stability. The above comparisons between both fresh and aged inks as a function of I/C indicate that the addition of ionomer leads to greater repulsions between the particles compared to in neat IrO2 inks. However, the magnitude of repulsions imparted by ionomer is not strong enough to overcome the attractive forces arising from the ionomer itself or because of solvent–particle interactions and lead to long-term stability or prevent flocculation of the particles over time.
4.3 Interparticle interaction mechanism
 | ||
| Fig. 5 (a) Calculated interparticle interaction potential curves at salt-free conditions. The curves include van der Waals (ϕvdW), electrostatic (ϕe), hydrophobic (ϕh), DVLO (ϕtotal,DLVO) potential, and xDVLO (ϕtotal,xDLVO) potentials, where a is the particle radius (106 nm). (b) Interaction potential curves (ϕe and ϕtotal,xDLVO) calculated at different Debye lengths (κ−1). (c) DLS measurements of dilute IrO2 inks (0.1% IrO2–0.2 I/C–90% H2O) and (d) rheology of concentrated inks (20% IrO2–0.2 I/C–90% H2O) at different salt (NaCl) concentrations. The data of 20% IrO2–90% H2O ink without ionomer at 250 mM NaCl is also included. | ||
Ionomer can present both long ranged-electrostatic repulsions and short-ranged attraction because of its amphiphilic chemistry – consisting of both hydrophilic/ionic sidechains and hydrophobic perfluorobackbone – and thus can impart kinetic stability, like in electrostatically stabilized colloidal particle dispersions. The sulfonic acid groups of the ionomer, which are expected to exist in a predominantly dissociated state in polar media such as here, can present long-ranged electrostatic repulsions. Such interactions are well-known be to the responsible for their extended conformation at dilute concentrations, arising from intra-chain electrostatic repulsions,47,48 as well as for the appearance of the viscosity scaling, η ∼ c1/2,49–51 called Fuoss's law, similar to salt-free polyelectrolytes solutions.52 Whereas the perfluorobackbone can present the vice versa, attractions, via hydrophobic forces, which are also expected to be strong here due to high H2O% (90%) in the medium. Such hydrophobic attraction between their backbone have been proposed to be responsible for their self-assembly in polar media into rod-like micelles, often referred to as primary aggregates.40,41,48,53–55
The adsorbed ionomer, existing at the solvent–particle interface, can similarly present both the long-ranged electrostatic repulsions and short-ranged hydrophobic attractions. And if the ionomer coverage of the free surface area of IrO2 is sufficiently large, the interparticle interactions would be predominantly dictated by the interactions between ionomer and solvent. At such conditions, the competition between the long-ranged electrostatic repulsions and short-ranged hydrophobic attractions, from their ionic sidechains and hydrophobic backbone, respectively, of the adsorbed ionomer, could result in kinetic stability.
This can be quantitatively described using the extended DLVO theory by considering the net interaction potential between particles (ϕtotal,xDLVO) to be the sum of DLVO forces – van der Waals attraction potential (ϕvdW) and electrostatic repulsion potential (ϕe) – and the hydrophobic attraction potential (ϕh), ϕtotal = ϕvdW + ϕe + ϕh, as discussed in the theoretical Section 3.28,56,57Fig. 5a shows the evaluated interaction potential curves at salt-free conditions. The calculations of hydrophobic attraction potential, decaying exponentially with separation distance, support the above hypothesis where ϕh < 0 indicating unfavorable interaction between the dispersion medium and the particles, resulting in attraction between particles at short separations via hydrophobic forces. The calculated acid-based free energy of interaction between water and Nafion, used for the evaluation of the hydrophobic attraction potential, is ΔGSLAB ∼ −46 mJ cm−2, which is lower than that of PTFE-water, ∼−60 mJ cm−2, that has also been similarly calculated. This is expected because of the sulfonic acid groups in their structure, making the ionomer less hydrophobic than a PTFE.
Furthermore, compared to van der Waals attraction potential, the hydrophobic attraction potential decays more gradually with increasing separation distance, thus predominantly competing against the long-ranged electrostatic potential over larger separation distances. The electrostatic potential decays even more gradually with increasing separation due to large Debye lengths at salt-free conditions (κ−1 ∼ 5 nm), dominating the net potential at large separations (ϕe > 0). At intermediate separations, the competition between the two – hydrophobic and electrostatic forces – leads to a peak (energy barrier) in the net potential curve (ϕmax > 0), like in electrostatically stabilized colloidal dispersions. The existence of such electrostatic energy barrier here could be preventing rapid flocculation of IrO2 inks via hydrophobic forces, imparting kinetic stability to the inks. However, the energy barrier here is likely not very large, and the particles are able to overcome the barrier after a certain duration, causing an increase in their structure or flocculation that is evident from the rheology data after couple hours.
The above hypothesis was further tested by analysing the effect of salt/electrolyte concentration on flocculation of both dilute and concentrated IrO2 inks. The addition of salt modifies the Debye length, and thus the electrostatic repulsion potential, affecting the competition between electrostatic repulsions and attractive forces. Fig. 5c compares DLS measurements on dilute inks (0.1% IrO2) at a series of salt concentrations. We can see a clear increase in the Zavg and PDI of the particles with increasing salt concentration beyond 10 mM to 25 mM NaCl where the Zavg increases from ∼260 nm to 320 nm and the PDI increases from ∼0.23 to 0.31 indicating an increase in IrO2 flocculation. The observations are also similar in concentrated inks, characterized using rheology (Fig. 5d). In the absence of any salt or at low salt concentrations (25 mM NaCl), the fresh inks display a Newtonian response with very low viscosities, indicating a liquid-like structure. Whereas with increasing salt concentration to 250 mM, the steady-shear and linear viscoelastic responses of fresh inks (show in Fig. 6b) indicate their gelation which does not occur in salt-free inks until 7 h of aging time. The acceleration of flocculation in both dilute and concentrated inks with increasing salt concentration demonstrates that the competition between long-ranged electrostatic repulsions and short-ranged attractive forces dictate the net interactions between the particles, supporting the above hypothesis. The addition of salt screens the electrostatic interactions, reducing the magnitude of electrostatic repulsion potential relative to hydrophobic attraction potential, and thus the energy barrier the particles would need to overcome to undergo flocculation.
 | ||
| Fig. 6 (a) Steady-shear rheology of fresh water-rich inks and ionomer dispersions with and without salt. (b) Frequency sweep data of fresh water-rich inks and ionomer dispersions with salt. The inks consist of 20% IrO2–0.2 I/C–90% H2O and the ionomer dispersions consist of 4.76% ionomer–90% H2O. The ionomer dispersions were measured 24 h after preparation. | ||
This is quantitatively elucidated in Fig. 5b by evaluating interaction potentials – electrostatic and total potential – at various electrolyte concentrations (10 to 250 mM) altering the Debye length. Increasing the electrolyte concentration reduces the Debye length, causing an increase in the steepness of decay of electrostatic potential (Fig. 5b). This results in a decrease in the energy barrier at intermediate separations, and consequently accelerating the flocculation kinetics, as given by eqn (7). And increasing above a certain salt concentration (>25 mM), the hydrophobic attraction potential dominates the net interaction potential, leading to the disappearance of the energy barrier causing rapid flocculation of particles, as seen at high salt concentrations (>25 mM NaCl) in concentrated inks undergoing gelation soon after ink preparation (Fig. 5d). These observations further corroborate the role of kinetic stability in the aging behavior of water-rich IrO2 inks, predominantly arising from the competition between electrostatic forces and hydrophobic forces, and qualitatively agree with the extended DLVO theory, supporting our hypothesis.
Note that the adsorption measurements, discussed earlier, suggest ionomer coverage of the free surface area of IrO2 is partial and the existence of bare IrO2 surface even at maximum I/C values studied here. Depending on the magnitude of the electrostatic potential associated with bare IrO2 surface and the strength of van der Waals attraction, the screening of electrostatic repulsions arising from the bare IrO2 surface itself by salt could also contribute to the observed flocculation in the inks above. To verify this the effect of salt addition on the rheology of neat IrO2 inks without ionomer has also been examined. As shown in Fig. 5d, unlike in inks with ionomer which transform to a gel at the same salt concentration immediately after preparation, no gelation was observed in neat IrO2 inks with salt addition (250 mM) measured even after 24 h of aging time. This result indicates any contribution of van der Waals attraction from the bare surface of IrO2 uncovered by ionomer to gelation in inks with ionomer upon salt addition due to the screening effect of salt is minimal. These observations support the dominant role of ionomer in inducing attraction between particles and eventual gelation of inks with increasing aging time.
Note however that, in the calculation of the free energy of Nafion–solvent interaction to evaluate hydrophobic interaction potential term in the extended-DVLO theory, the surface energy parameters of bulk/thick Nafion films/membranes have been used which indicate Nafion surface is predominantly hydrophobic. However, several studies on Nafion films suggest that the surface properties of thin Nafion films (below ∼100 nm) can significantly deviate from that of bulk films/membranes, and can switch from hydrophobic to hydrophilic in nature, depending on the surface chemistry of the substrate and processing/preparation history.29,58–60 This is due to interaction of ionomer with the substrate, altering their self-assembly – re-organization of their hydrophobic and hydrophilic domains at the interface – at nano length scales and thus their surface properties. Future studies, using techniques such as contrast-variation small-angle neutron scattering (CV-SANS), cryo-TEM, and AFM, characterizing the thickness of the ionomer coverage, the orientation/self-assembly of ionomer on IrO2 surface, as well as the distribution of ionomer in the inks (i.e., ionomer concentration/coverage degree on the particle surface verses in the media), and whether they evolve with aging time, will enable validation of the above proposed attraction mechanisms (i.e., hydrophobic forces), or if additional or alternate attraction mechanisms are at play; such studies, thus far, have been predominantly limited to Pt–carbon/carbon surfaces.43,47,61,62
Furthermore, if the concentration of free ionomer concentration in medium is sufficiently large, a structure buildup in free ionomer, similar to in particles via the same aggregation mechanism as described by the above extended-DVLO theory, is also possible. Such structure buildup of free ionomer could also contribute to the observed increase in the viscoelasticity of the inks with aging time in addition to the structure buildup of IrO2 particles. To gain insights into the degree to which the free ionomer could undergo aggregation at these ionomer concentrations and the extent of impact on ink rheology, we analysed the rheology of neat ionomer dispersions with and without salt at the same ionomer concentration as in the inks (20 wt% IrO2–0.2 I/C–90% H2O). Fig. 6a compares the steady-shear rheology of neat ionomer dispersions (4.76 wt% w.r.t. solvent) with and without salt (250 mM NaCl) measured after 24 h since preparation. We can see the addition of salt leads to a dramatic increase in the viscosities of ionomer dispersions as well as in the magnitude of shear thinning. Small amplitude oscillatory shear rheology data shown in Fig. 6b indicates gelation of ionomer dispersions with salt, similar to in inks with salt (which is also coplotted), where the moduli vary very little or weakly with frequency with G′ > G′′ throughout the frequency range. Like in inks with salt discussed earlier, when the long-ranged electrostatic interactions are screened by salt, the short-ranged hydrophobic attraction between the backbone of ionomer are expected to dominate and lead to their gelation.
Such dramatic increase in the rheology of neat dispersions with salt addition shows that the aggregation in ionomer itself could result in a dramatic increase in the viscoelasticity of the inks. However, experiments have also been performed on neat ionomer dispersions without any salt to examine whether a similar structure buildup occurs with aging time (Fig. S6, ESI†). In contrast to neat ionomer dispersions with salt as well as to inks with/without salt, we do not observe any gelation in neat ionomer dispersions even after an aging time of 96 h. The response remains predominantly Newtonian-like, and the viscosity increases only slightly between 0 and 96 h aging time. This is likely due to larger inter-ionomer separation distance in neat ionomer dispersions compared to in inks (with particles) that would delay the aggregation kinetics of ionomer. Additionally, the magnitude of electrostatic repulsions between ionomer aggregates in neat dispersions could also be larger compared to in inks. This is due to reduced excluded volume interactions in the absence of particles that would otherwise screen electrostatic repulsions between ionomer due to pervasion of particles into the electric double layer charge of ionomer, like in concentrated polyelectrolyte solutions;63 and/or due to a higher translational entropy for the counter-ions of the sulfonic acid groups of the ionomer to dissociate into the medium due to a higher available free volume in medium in the absence of particles available for the counter-ions to occupy, like in dilute polyelectrolyte solutions.64
The above experiments in neat ionomer dispersions not only demonstrate the role of ionomer in attraction between particles, but also suggest structure growth in free ionomer in medium could be responsible for observed viscoelastic enhancement of the inks. However, whether the dominant interparticle attraction mechanism leading to flocculation particles of IrO2 particles is attraction between adsorbed ionomer of particles or free-ionomer mediated attraction of the particles, and if the viscoelastic enhancement of the inks with aging time is predominantly due to structure buildup of IrO2, as indicating by USAXS, or due to aggregation of free ionomer in the medium requires addition investigation. Future studies utilizing techniques such as CV-SANS allowing the visualization of structure and distribution of both ionomer and catalyst in the inks with aging time could help address these questions.
4.4 Effect of dispersion medium composition
In the inks examined above showing transient behavior, the H2O% of the dispersion media is much higher than that of in typical catalyst inks. Therefore, we next investigate whether varying H2O% alters the aging behavior of catalyst inks. As noted before, except for Lyu et al.,12 studies thus far on IrO2 inks have only focused on fresh inks. Furthermore, how the solvent composition of the dispersion medium alters the structure and stability of IrO2 inks has not been explored yet in literature, to our knowledge. Understanding this effect on structure and aging behavior is not only crucial for tuning the CL morphology during processing and improving the device performance,65–68 but also can provide insights into the interparticle interaction mechanisms governing their stability and aging behavior.To investigate the impact of water–alcohol composition on aging behavior of IrO2 inks, steady-shear rheological behavior has been compared between fresh and aged (ta = 96 h) inks at different amounts of H2O% in the dispersion medium (90%, 75%, and 50%). Fig. 7a compares the steady-shear rheology – relative viscosity ηr = η/ηmversus shear rate – of the inks. In contrast to the aged inks with the highest H2O-content (90%), both lower H2O% cases (75 and 50% H2O) display a Newtonian response with very low viscosities; their data nearly overlaps with that of the fresh inks. Such a response suggests very little variation in the structure of inks with lower H2O% in the media with aging time. This observation is consistent with the findings of Lyu et al.,12 who examined changes in various inks properties, including rheology, of a similar ink system – 20 wt% IrO2, 0.2 I/C (D2020), and a water–nPA dispersion medium with 50 wt% H2O. The variation in the overall viscosities and the steady-shear response, which was weakly shear thinning, was found to be minimal with aging time, examined for over 14 days much longer than those here.
 | ||
| Fig. 7 (a) Steady-shear rheology of fresh and aged (96 h) inks as a function of H2O% in the dispersion medium at 20% IrO2 and 0.2 I/C. The data of fresh inks is zoomed-in in the inset of figure (a). (b) Steady-shear rheology of alcohol-rich inks (20% IrO2–0.2 I/C–75% H2O) and ionomer dispersions (4.76% ionomer–75% H2O/25% nPA) with and without salt (250 mM NaCl) measured after 24 h since preparation. (c) Hydrophobic (ϕh) and (d) total interaction potential (ϕtotal,xDLVO) curves calculated for different values of ionomer–solvent interaction free energy at 25 mM electrolyte concentration (κ−1 = 1.8 nm). | ||
The USAXS/SAXS measurements, shown in Fig. 2, further confirm the rheological observations. In contrast to 90% H2O case where scattering intensities of the aged ink in the low-q region deviate from that of the fresh ink as discussed earlier (Fig. 2a), the scattering intensities of both fresh and aged inks with lower H2O content (75%) look similar (Fig. 2c), indicating a very little change in their structure with aging time. This is clearer from plots of their volume size distribution in Fig. 2b and d extracted from the scattering intensity curves. In contrast to the 90% H2O ink cases where the particle size distribution of aged inks is dramatically different from that of the fresh inks (Fig. 2b), the differences in particle size distribution between aged and fresh inks are relatively very small in 75% H2O-content cases (Fig. 2d), indicating minimal variation in their structure with aging time.
The gravitation settling behavior has also been compared between alcohol-rich and water-rich inks though at dilute IrO2 concentrations (5 wt%) as shown in Fig. 4b and d. We can see that the water-rich inks (Fig. 4b-j) begin to settle in ∼10 days (254 h), but no settling is evident in alcohol-rich inks (Fig. 4d-l) until ∼16 days (380 h). This shows enhanced stability of alcohol-rich inks, consistent with rheology and USAXS/SAXS observations on concentrated inks where the alcohol-rich inks display minimal variation in their structure with aging time, in contrast to the water-rich inks. These comparisons show that the water–alcohol composition of the dispersion medium dramatically alters the interaction between IrO2 particles, significantly impacting their stability and aging behavior. The absence of structure build-up in inks with H2O content below 75% suggests an enhanced stability of the inks against flocculation at lower H2O% where the particles remain in a predominantly well-dispersed state over longer durations, a behavior desirable for creating catalyst layer with consistent morphology or catalyst loading, and thus the device performance.
Similar to H2O-rich inks, comparison of electrophoretic mobility measurements (Fig. S4a, ESI†) between alcohol-rich inks at dilute concentrations, with (0.2 I/C) and without ionomer, indicate adsorption of ionomer onto IrO2 surface. The addition of ionomer increases the zeta potential of the particles because of the contribution of sulfonic acid groups of the adsorbed ionomer increasing the surface charge density of the particles. This suggests the role of adsorbed ionomer in the enhanced stability of alcohol-rich inks that could impart repulsions between particles via the mechanisms discussed earlier – the electrostatic or/steric hinderance mechanisms. Comparison of gravitational settling behavior between inks with and without ionomer, shown in Fig. 4d, further corroborate this. Inks with no ionomer (Fig. 4d-j) settle almost completely in just 3 h. Whereas inks with ionomer (Fig. 4d-k) appear to remain suspended for significantly longer duration of nearly 10 days (254 h), showing a significant enhancement in ink stability by ionomer against agglomeration, consisting with previous studies on alcohol-rich IrO2 inks.10,11 However, strong differences in the stability and aging behavior observed between water-rich inks and alcohol-rich inks, that are particularly dramatic in concentrated IrO2 inks, shows alcohol% is strongly altering the interaction between adsorbed ionomer, and thus between the particles.
We can rationalize the enhanced stability of alcohol-rich inks relative to water-rich inks by analysing how the water–alcohol composition is influencing the strength of electrostatic repulsions and hydrophobic attraction, competition between which is dictating the net interaction between particles, as discussed in the previous section. The enhanced stability of alcohol-rich inks could arise from either greater electrostatic repulsion between the sulfonic acid sidechains, or reduced attraction strength between the adsorbed ionomer, or a combination of both, resulting in a higher repulsion barrier, and consequently in greater stability. However, due to lower polarity of the alcohol-rich (50% H2O) medium (εr ∼ 43)69 compared to the water-rich (90% H2O) medium (εr ∼ 73), the strength of electrostatic repulsions associated with the sulfonic acid groups are expected to be relatively weaker. This is due to reduced degree of dissociation of the sulfonic acid groups of the adsorbed ionomer in a lower polarity media, leading to a lower surface potential/charge of the particles.25 In addition, the electric double layer charge in a lower polarity medium is also expected be more extended/diffusive, leading a weaker growth in electrostatic potential with decreasing interparticle separation distance. A combination of both would lead to reduced electrostatic repulsions. Therefore, it is unlikely the enhanced stability of alcohol-rich inks compared to water-rich inks is due to greater electrostatic repulsions.
Furthermore, studies examining the adsorption behavior of ionomer with EW between 620–1000 g mol−1 onto various surfaces, though limited to carbon, Pt–carbon, or other model surfaces/particles, from water–alcohol solvent mixtures suggest reduced ionomer adsorption amounts from an alcohol-rich solvent compared to a water-rich solvent, including onto hydrophilic surfaces, such as IrO2 particles here.61,70 This has been attributed to a decrease in the strength of hydrophobic forces at higher alcohol%, the primary driving force for ionomer adsorption onto surfaces from water–alcohol solvent mixtures, as determined experimentally by Berlinger et al.61 using isothermal titration calorimetry (ITC) method. A similar reduced ionomer adsorption amounts in alcohol-rich medium would result in lower surface charge densities of IrO2 particles due to fewer sulfonic acid groups on the particles surface. This could also contribute to lower electrostatic repulsion potential between particles in alcohol-rich inks compared to in water-rich inks.
Whereas, with increasing alcohol% (or decreasing H2O%), the strength attraction of hydrophobic forces, and thus magnitude of attraction between the perfluorobackbone of adsorbed ionomer, is expected to decrease. Park et al.,5 who measured contact angle of various water–alcohol mixtures, including nPA, on Nafion membranes, found the contact angle to overall decrease with increasing alcohol%, indicating an increase in the affinity of interaction between the solvent and the ionomer. Simulation studies examining the aggregation behavior of ionomer in media have also found that the degree of ionomer aggregation through their backbone via hydrophobic forces to decrease with decreasing dielectric constant of the medium48 or increasing alcohol%,55 suggesting a decrease in the strength of the hydrophobic attraction between their backbone with increasing alcohol% in the dispersion medium.
We further tested this by performing additional rheological experiments on both neat ionomer dispersions and IrO2 inks in alcohol-rich medium (75% H2O), with and without salt (250 mM NaCl). As shown in Fig. 7b, unlike the water-rich cases (both ionomer dispersions and inks) where the addition of salt leads to a dramatic change in their rheology with data indicating a transition from a liquid-like to a gel-like material (Fig. 6b), the response of alcohol-rich ionomer dispersions with added salt (250 mM NaCl) remains Newtonian with low viscosities, indicating minimal changes in their structure. In fact, the viscosity of both inks and ionomer dispersions decreases by ∼50% upon salt addition, opposite to the water-rich cases. In our previous study analyzing the effect of composition of water–alcohol (1-proponal/2-propanol) mixture on ionomer dispersions rheology (3 M and Nafion), the dispersions displayed a similar polyelectrolyte-like scaling (η0 ∼ c1/2) at low concentrations for all water–alcohol composition (10–75 wt% alcohol). Such scaling indicated an extended/rod-like structure at low concentrations, like in salt-free polyelectrolyte solutions that is well-known to arise from strong intra-chain electrostatic repulsions.39,49 The reduced viscosity with salt addition is likely due to contraction of ionomer chains because of screening of intra-chain electrostatic repulsions by salt, reducing the effective size of ionomer.71
These observations, indicating a minimal structure growth, if any, in both neat ionomer dispersions and inks upon salt addition relative to that of in water-rich cases, support a decrease in the strength of hydrophobic attraction between ionomer. This is because, if short-range hydrophobic forces are present with magnitudes as large as in water-rich cases, the addition of salt should result in flocculation/aggregation like in water-rich ionomer dispersions and inks. A decrease in the strength of hydrophobic forces between adsorbed ionomer at higher alcohol% in the medium would increase the net electrostatic energy barrier the particles would need to overcome to approach short separations and undergo flocculation via the short-ranged van der Waals forces.
This is quantitatively elucidated in Fig. 7c and d exploring the effect of strength of hydrophobic potential on net interparticle interactions. Since the surface tension parameters of H2O–nPA mixtures or pure nPA are unknown and requires determination, we only qualitatively analyse the effect by calculating interaction potentials at different ΔGSLAB values, keeping everything else fixed. The values were varied between ΔGSLAB = −46 mJ cm−2, corresponding to 100% H2O, and ΔGSLAB = 13 mJ cm−2 corresponding to 100% ethanol that was also evaluated using the surface tension parameters γL+ = 0.02 and γL− = 68 mJ m−2.26 With decreasing ΔGSLAB the steepness of the decay of hydrophobic potential decreases (Fig. 7c), reducing the competition against electrostatic potential. This is leading to an increase in the energy barrier that would increasingly retard the flocculation kinetics, increasing the stability of the dispersions (Fig. 7d). At 13 mJ cm−2, corresponding to pure ethanol with ΔGSLAB > 0, the interactions become overall repulsive, indicating favorable interaction between ionomer and the dispersion medium, resulting in thermodynamic stability to the dispersions.
The observations above not only show a dramatic effect of water–alcohol composition on interparticle interactions, and consequently on the stability and aging behavior of the inks, but also support the role of hydrophobic forces in attraction between particles at high H2O% in the dispersion medium. However, as noted earlier, previous studies suggest the thickness of the ionomer coverage as well as the nature of the ionomer self-assembly at solvent–particle interface can alter the wettability of thin Nafion films with water. Studies, though focused on carbon, Pt–carbon, or other model surfaces, have also found water–alcohol composition of the dispersion medium to affect the extent of ionomer adsorption, and thus its thickness on the particle surface, as discussed earlier.43,61,70,72 Since ionomer is known to commonly exist as aggregates/micelles in media and can adsorb onto interfaces as micelles rather than as isolated molecules, the differences in ionomer adsorption based on solvent composition has been primarily attributed to differences in their aggregated structure in pure media. Whether the solvent composition is similarly impacting the coverage thickness of ionomer on IrO2 surfaces and is playing role in the observed aging behavior by altering the interaction between particles, requires more investigation. Future studies comparing the adsorption behavior of ionomer on IrO2 surfaces as a function of solvent composition, particularly at non-dilute ionomer concentrations such as here in the concentrated inks, which are currently lacking, will help clarify this question. However, our comparisons of the effect of salt on neat ionomer dispersions between water-rich and alcohol-rich dispersions, demonstrate that alcohol% can dramatically alter the strength of hydrophobic forces between ionomer – both adsorbed and free ionomer in the medium – strongly supporting the extended-DLVO theory we proposed above elucidating interparticle interaction mechanism and the aging behavior.
4.5 Implications
The viscoplastic rheological behavior of gel-like water-rich inks, which is dramatically different than a Newtonian or a weakly shear thinning response at typical formulation compositions,5,10,12 can be expected to strongly alter the coating and drying behavior of the inks, processes known to be significantly impacted by the fluid rheology,3,4 and thus the resulting coating morphology. To evaluate this, preliminary scale-scale/bench-top coating experiments have been performed using a mayer rod/blade coater attached to a film coater at a fixed coating speed of v = 2 mm s−1 and drying temperature of 80 °C. The Mayer rod number (20) and the blade coating gap (50 μm) for the coating experiments were chosen such that the final IrO2 loadings of the catalyst layers are in a relevant practical range (0.3–0.7 mgIr cm−2). To make an MEA, the anode catalyst layer is commonly fabricated by coating the catalyst ink onto a PTFE/Teflon; the resulting coating is then transferred onto a cathode-coated membrane by hot-pressing, called as a decal method. Therefore, a Teflon was used as a substrate. Three catalyst ink cases were chosen for comparison (Table 1). These include two low viscosity Newtonian inks – a fresh water-rich ink (90% H2O) and an aged (96 h) alcohol-rich ink consisting of 50% H2O, close to the solvent composition in typical formulations5,10,12 – and an aged (96 h) water-rich ink with a gel-like structure exhibiting a viscoplastic flow behavior.
Fig. 8 compares the coatings made from the three inks via Meyer rod. The films of fresh water-rich inks (low viscosity Newtonian liquids) rupture spontaneously, leading to large voids/spots (Fig. 8a). This is likely due to the poor wettability of a water-rich (polar solvent) inks with the hydrophobic Teflon substrate. In contrast, the aged gel-like water-rich inks form a uniform coating (Fig. 8b) and no de-wetting was observed. A spontaneous film rupture of a liquid film coated onto a non-wettable substrate below a certain wet film thickness, as observed in the fresh water-rich inks, is known to be initiated by disturbances to the film.73,74 The disturbances can arise from several sources, such as local surface tension differences either due to surface-active components in the liquid film or local differences in temperature, inducing a liquid flow (called as a Marangoni effect), gas bubbles, or impurities. Here the de-wetting in water-rich inks is likely initiated by disturbances due to high drying temperatures resulting in Marangoni-stresses and/or formation of gas/vapor bubbles, because such de-wetting was not observed at reduced drying temperatures (∼25 °C). The propagation of these disturbances is likely significantly suppressed in films of the aged water-rich inks because of high viscous resistance to the local liquid flow, leading to a uniform film.
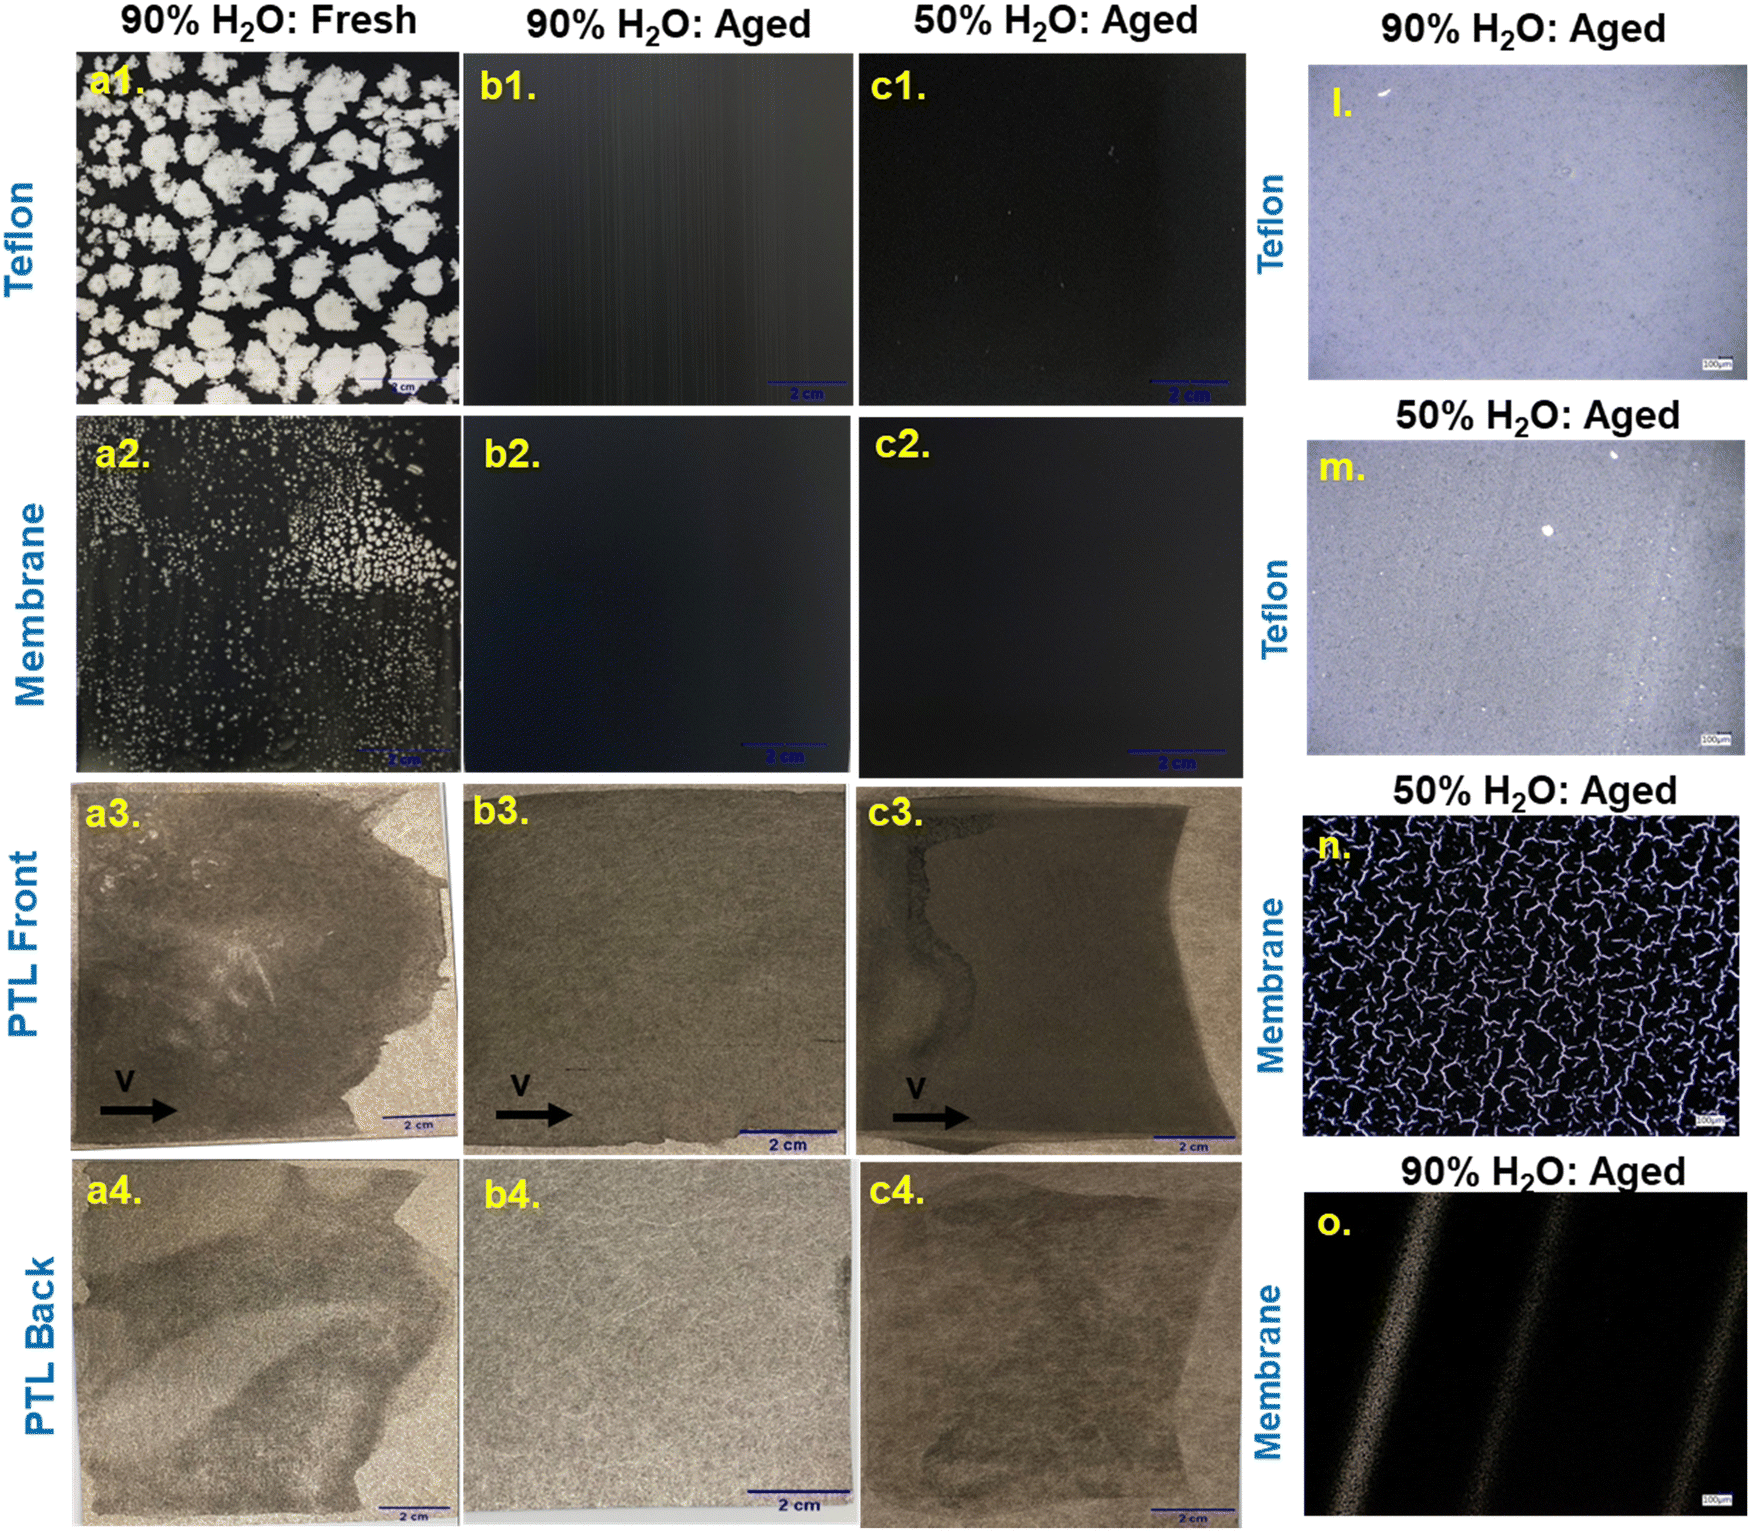 | ||
| Fig. 8 Images of coatings of fresh inks in 90% H2O medium (a1)–(a4), aged inks in 90% H2O medium (b1)–(b4) and aged inks in 50% H2O medium (c1)–(c4) on different substrates: Teflon (a1)–(c1), Nafion N212 membrane (a2)–(c2) and Pt-coated PTL, both the frontside (a3)–(c3) and the backside (a4)–(c4). Optical images of coatings of aged inks in 90% H2O medium and aged inks in 50% H2O medium on Teflon (l and m, respectively) and membrane (o and n, respectively) substrates. The inks are composed of 20% IrO2 and 0.2 I/C (D2020). | ||
However, the alcohol-rich inks, despite low viscosities, result in a uniform coating similar to the aged water-rich inks with very high viscosities (Fig. 8c). This is likely due to better wettability of an alcohol-rich ink with Teflon than a water-rich ink. However, the average IrO2 loadings were lower ∼25% lower than the aged water-rich inks (Table 1). A combination of both higher wettability and low viscosity of alcohol-rich inks are likely leading to a reduced wet film thickness, consequently resulting in lower IrO2 loadings. The evolution of higher IrO2 loadings in aged water-rich inks than alcohol-rich inks for similar coating conditions shows that the viscoplastic rheology of the aged water-rich inks could offer better dimensionality control of the coating, suppressing excessive ink spreading, important for efficient optimization and fabrication of catalyst layer with precise loadings.
While a decal method is the most common method of anode catalyst layer fabrication via R2R/scalable processes, as noted above, alternate fabrication approaches such as direct coating anode inks onto a membrane or a porous transport layer (PTL) via scalable coating processes are considered attractive due to several cost-saving benefits such as less material wastage and fewer processing steps for MEA fabrication, in addition to improved ionic/electronic conductivity due to increased interfacial contact between catalyst and membrane/PTL.75 However, several coating challenges associated with such direct-coating approaches must be tackled in order to realize these approaches, such as poor dimensionality control of membranes due to swelling/solvent absorption and ink infiltration into the pores of the PTLs during coating, which can be detrimental to device performance.76,77 Efforts toward addressing these challenges while exist, but are very few.5,75 Reports of direct-coating onto PTLs, thus far to our knowledge, are limited to spray coating, a low-through put method.75,78,79 Motivated by these issues we further explored the viability of the aged water-rich inks for direct-coating on both membranes and PTLs, and analyse whether their viscoplastic rheology can overcome some of the limitations associated with the low viscosities of typical IrO2 ink formulations for direct coating approaches.
The coatings on a N212 membrane of the three inks made using a Meyer rod were compared in Fig. 8-a2–c2. The observations are somewhat similar that on Teflon above. The fresh water-rich inks lead to circular spots/voids (Fig. 8-a2), likely due to their poor wettability with the membrane.5 The aged water-rich inks, in contrast, result in a visually homogeneous coating (Fig. 8-b2), similar to on Teflon, due to strong viscous resistance to the film-thinning disturbances, preventing their de-wetting. The alcohol-rich inks (50% nPA), also lead to a visually homogenous coating similar to aged water-rich inks (Fig. 8-c2) due improved wettability with membrane at intermediate alcohol compositions.5 However, the optical images show cracks in coatings (Fig. 8-n). Such cracks are not seen in aged water-rich inks where the coating looks homogenous (Fig. 8-o). This observation is consistent with previous studies on IrO2 inks where the crack formation was found to reduce with decreasing alcohol-content of a water–alcohol dispersion medium.5 Park et al.,5 examining the evolution of contact angle of water–alcohol mixtures, including water–nPA mixtures, as a function of time on Nafion 212 membranes, found the contact angle to decrease monotonically with increasing alcohol% in water–ethanol or water–methanol solvent mixtures. Whereas for solvent mixtures consisting of nPA or IPA, at intermediate alcohol% (50 wt%), the solvent was found to imbibe the membrane. The solvent of the alcohol-rich inks here could be similarly imbibing into the membrane. Deformation and swelling of the membrane as a result of solvent-imbibition could be playing role in the formation of cracks.80 These comparisons show the gel-like water-rich inks not only lead to enhanced coating stability against film-thinning disturbances that lead to unwanted defects due to their low viscosities, but also mitigates the formation of cracks, offering a promising formulation strategy for direct-coating onto membranes.
Analysing the coating behavior onto Pt-coated PTL next, both fresh water-rich and aged alcohol-rich inks coated using a blade coater spontaneously absorbs into the PTL, as can be seen from the appearance of particles on the backside of the PTLs in the images, Fig. 8-a4 and c4, respectively, making it difficult to form a homogenous/uniform catalyst layer coating (Fig. 8-a3 and c3). Such spontaneous imbibition could be resulting from a combination of both high wettability of the ink with the PTL – leading to a high capillary pressure in the pores – and their low viscosities – offering very little viscous resistance to the flow through the PTL pores. Such excessive ink infiltration into the PTL pores is undesired as it not only would increase the mass transport resistance and reduce catalyst utilization that negatively affect the device performance, but also would be difficult to precisely control the catalyst loading on the PTL. Whereas the aged water-rich inks result in a homogenous coating layer (Fig. 8-c3) and do not show a complete bleed-through as can be seen from the backside image of the coating on PTL (Fig. 8-c4). The high viscous resistance of the inks to flow into PTL pores as well as the quick recovery/build-up of their viscosity after cessation of shear forces imposed during coating – as indicated by the transient rheology measurements (shear rate step-down jump tests, Fig. S7, ESI†) – could be significantly minimizing the ink infiltration into the media and allowing the formation of a stable coating meniscus to create a film/coating layer.81,82 The aged water-rich inks could thus offer a better control of coating uniformity as well as the degree of catalyst infiltration into the PTL, and thus the catalyst loading, not achieved using the fresh water-rich or aged alcohol-rich inks, providing a potential ink design strategy for fabrication of anodes via direct coating onto PTL. We should also note that while direct-coating onto membrane via scalable/R2R coating method has been previously demonstrated,5 this is the first study to demonstrate direct-coating of anode inks onto PTL via a scalable coating method.
The small-scale coating experiments above demonstrated the aged water-rich inks offer a new formulation strategy to enhance coating morphology control, including for direct-coating approaches advancing the scalable-fabrication of MEA. In addition, their viscoplastic rheology could also expand coating approaches/methods, such as screen-printing, for example, requiring yield stress-like fluids displaying viscoplastic rheology, for electrode fabrication. Note however that although these preliminary small-scale coating experiments, demonstrating the feasibility of fabricating anode catalyst layers with uniform morphology with practically relevant catalyst loadings at fixed coating conditions, the processing window/coating process constraints associated with such viscoplastic rheology of gel-like inks for a specific coating method of interest based on through-put/yield requirements needs to be further examined. This is crucial for translating from a lab-scale to an industrial/large-area electrode fabrication (i.e., roll-to-roll) which will be the subject of our future work.
Fig. 9 compares cell performance as measured by (a) the test stand following conditioning and (b) AutoLab during EIS measurement using N115 as a membrane. Both test stand and potentiostat show very similar performance across samples. In particular, we observe very little difference in performance between the as-prepared inks and flocculated anode inks (96 h), with a spread of cell performance ranging 10.1 mV and 7.9 mV at 4.0 A cm−2, respectively. Note that, the inks used for performance testing were formulated with Nafion D2021 (EW 1000), as described in the Experimental section, which nonetheless exhibit a similar time-dependent rheological response (data shown in Fig. S8, ESI†) to the inks formulated with D2020 (EW 900) that are discussed in previous sections.
 | ||
| Fig. 9 (a) Polarization curves for each sample extracted following conditioning. (b) Polarization curves extracted from EIS measurement (solid) shown with HFR corrected voltage (dashed). The tests were performed using N115 as a membrane. | ||
Fig. 10 compares various parameters extracted during EIS measurement. The averaged-HFR for all samples for which an EIS measurement was completed is shown in Fig. 10a. We observe no significant difference in the cell resistance between electrodes of dispersed and flocculated inks. Further, Fig. 10b shows HFR-corrected cell voltage extracted at 0.1 A cm−2, being within the Tafel regime for each sample, and at a high current density of 4.0 A cm−2, which includes both transport and catalyst layer resistance effects in addition to Tafel kinetics. The data in both regimes show no difference in potential between dispersed and flocculated samples. Finally, Fig. 10c shows the non-faradaic transmission line impedance spectra taken at 1.25 V with residual hydrogen in the cell's cathode chamber. This transmission-line spectra is used to determine the sample's catalyst layer resistance.84,85 The data show only minor variations in the catalyst layer resistance between the two. Note that unlike the electrodes of aged inks where EIS has been measured for both the samples, in the case of electrodes of fresh inks, the EIS measurements have been collected for just one sample (fresh #2). However, we compared additional EIS data, collected following the same experimental procedure as described in the Experimental section but using a different membrane (N212 instead of N115) and inks containing D2020 Nafion dispersions instead of D2021. The polarization curves (Fig. S9a, ESI†) both with and without HFR correction nearly overlap between the fresh and aged inks samples. They show differences below ∼4 mV at 4 A cm−2, are very consistent with the above data tested using N115 membrane, and demonstrate good reproducibility of our results. Furthermore, the variations in the HFR-corrected data (Fig. S9b, ESI†) of both fresh and aged samples between N115 and N212 are very small, indicating that we have very good performance reproducibility of our electrodes. In comparison to the differences of ∼15 mV observed at 4 A cm−2 in our experiments, benchmarking efforts reported in the literature discuss the maximum reported cell-to-cell variability to be ∼11 mV.86
 | ||
| Fig. 10 Comparison of (a) averaged HFR and (b) HFR-corrected potential for each sample where an EIS measurement was performed and grouped by electrodes of fresh and aged (96 h) anode inks (18% IrO2–0.2 I/C–90% H2O) using N115 membrane. HFR-corrected potential is extracted at both 0.1 A cm−2 being well within the Tafel regime for each sample, as well as at 4.0 A cm−2 which includes mass transport and catalyst layer resistance effects as well as Tafel kinetics. (c) Impedance spectra taken in a non-faradaic condition with residual hydrogen in the cathode chamber. Shown impedance spectra are corrected in real impedance by HFR to allow direct comparison of the width of the high frequency catalyst layer resistance region. | ||
These preliminary comparisons show very little effect, importantly, no adverse effect of flocculation of the catalyst in the aged water-rich inks on device performance, demonstrating their applicability in practice. However, more detailed investigations are underway in our group to better understand the impact of catalyst flocculation on the electrode structure, utilizing various techniques including advanced microscopy and nano X-ray computed tomography (nano-xCT) characterizing the electrode structure and the device performance over longer duration (i.e., durability).
5. Conclusions
The findings of this work are expected to have significant implications on formulation design and processing of PEMWE anode inks, offering a new, simple formulation design strategy to not only mitigate current processing challenges with typical IrO2 ink formulations during solution-processed fabrication, but also potentially enable electrode fabrication via low-cost and efficient approaches, such as direct coating onto membranes and porous transport layers. The gel-like structure approached at water-rich solvent compositions after a certain aging time in concentrated IrO2, probed using a combination of rheology and X-ray scattering techniques, can be expected to significantly improve the stability of inks against gravitation sedimentation. Furthermore, the viscoplastic rheological behavior displayed by the gel-like inks, which is dramatically different from that of fresh inks – both water-rich and alcohol-rich inks – displaying a Newtonian or a very weak shear thinning response with very low viscosities, could offer a new rheology tuning strategy to better control the coating morphology as well as catalyst loadings, including for direct-coating onto membranes and porous transport layers, advancing the manufacturing scale-up of MEA.Investigation into the effects of ionomer concentration and dispersion media composition (water/nPA ratio) suggests that ionomer – adsorbed and free ionomer existing in the medium – plays a predominantly role in the aging behavior observed in water-rich inks, where it is strongly altering the interaction particles by adsorbing onto their surface. Additional experiments analysing the effect of salt concentration on aging behavior of the inks suggest the competition between long-ranged electrostatic repulsions and short-ranged attractive forces predominantly dictates the net interaction between particles. However, the magnitude of electrostatic repulsions is not large enough to prevent flocculation of particles by the attraction forces, leading only to short-term stability, resulting in a progressive build-up of their structure after a certain aging time.
Examination of the effect of water–alcohol composition shows decreasing H2O content in the media reduces the strength of attraction between particles, enhancing their stability against flocculation and gravitational settling. The observation also supports the role of hydrophobic forces that we hypothesized to be inducing attraction between particles, where strong hydrophobic attraction between perfluorobackbone of the adsorbed ionomer in water-rich medium, and their competition against electrostatic repulsions is leading to their short-term stability, and could be explained using the extended DVLO-theory.
Comparison of MEA performance between catalyst-layers of the fresh and aged water-rich inks with dramatically different microstructure showed very little difference in their performance indicating no adverse effect of aging/catalyst flocculation on device performance. Additional studies, utilizing advanced microscopy and nano X-ray computed tomography, to characterize the effects of ink age on electrode structure to better understand the MEA performance results, as well as the impact on cell durability are currently underway in our group. The findings of this study will advance electrocatalyst ink formulation development and scalable fabrication of electrodes for electrochemical storage and conversion devices.
Data availability
The data for this article will be provided upon request.Conflicts of interest
There are no conflicts of interest to declare.Acknowledgements
The authors thank Jayvier Yanagisako for assistance with performing rheological experiments, Jason Pfeilsticker for developing experimental setup for visualizing gravitational settling behavior, and Omar Jose Guerra Fernandez for providing feedback on the manuscript. The authors also acknowledge Jan Ilavsky and Ivan Kuzmenko of the Advanced Photon Source 9-ID for assistance with USAXS measurements, and Siddharth Rajupet for helpful discussions regarding the ionomer adsorption measurements. The authors also thank the reviewers for providing feedback towards improving the quality of the manuscript. This work was authored in part by Alliance for Sustainable Energy, LLC, the manager and operator of the National Renewable Energy Laboratory for the U.S. Department of Energy (DOE) under Contract No. DE-AC36-08GO28308. The submitted manuscript was created, in part, by UChicago Argonne, LLC, Operator of Argonne National Laboratory, Argonne, U.S. Department of Energy Office of Science laboratory, operated under Contract No. DE-AC02-06CH11357. This research used the resources of the Advanced Photon Source (APS), a U.S. Department of Energy (DOE) Office of Science User Facility, operated for the DOE Office of Science by Argonne National Laboratory, also under Contract No. DE-AC02-06CH11357. Funding was provided as part of the H2NEW Consortium funded by the U.S. Department of Energy Office of Energy Efficiency and Renewable Energy Hydrogen and Fuel Cell Technologies Office. The views expressed in the article do not necessarily represent the views of the DOE or the U.S. Government. The U.S. Government retains and the publisher, by accepting the article for publication, acknowledges that the U.S. Government retains a nonexclusive, paid-up, irrevocable, worldwide license to publish or reproduce the published form of this work, or allow others to do so, for U.S. Government purposes.References
- DOE National Clean Hydrogen Strategy and Roadmap, 2022.
- DOE Pathways to Commercial Liftoff: Clean Hydrogen, 2023.
- S. Khandavalli and J. P. Rothstein, AIChE J., 2016, 62, 4536–4547 CrossRef CAS.
- M. D. Haw, M. Gillie and W. C. K. Poon, Langmuir, 2002, 18, 1626–1633 CrossRef CAS.
- J. Park, Z. Kang, G. Bender, M. Ulsh and S. A. Mauger, J. Power Sources, 2020, 479, 228819 CrossRef CAS.
- S. M. Alia, K. S. Reeves, J. S. Baxter and D. A. Cullen, J. Electrochem. Soc., 2020, 167, 144512 CrossRef CAS.
- S. Holdcroft, Chem. Mater., 2014, 26, 381–393 CrossRef CAS.
- N. N. Kariuki, A. T. Haug, J. H. Park, M. J. Lindell and D. J. Myers, J. Electrochem. Soc., 2022, 169, 104502 CrossRef CAS.
- T. Suzuki, S. Tsushima and S. Hirai, Int. J. Hydrogen Energy, 2011, 36, 12361–12369 CrossRef CAS.
- S. Khandavalli, J. H. Park, N. N. Kariuki, S. F. Zaccarine, S. Pylypenko, D. J. Myers, M. Ulsh and S. A. Mauger, ACS Appl. Mater. Interfaces, 2019, 11, 45068–45079 CrossRef CAS.
- G. F. Li, D. Yang and P. Y. Abel Chuang, ACS Catal., 2018, 8, 11688–11698 CrossRef CAS.
- X. Lyu, J. Foster, R. Rice, E. Padgett, E. B. Creel, J. Li, H. Yu, D. A. Cullen, N. N. Kariuki, J. H. Park, D. J. Myers, S. Mauger, G. Bender, S. Pylypenko and A. Serov, J. Power Sources, 2023, 581, 233503 CrossRef CAS.
- https://www.sigmaaldrich.com/specification-sheets/215/327/663492-BULK_______ALDRICH__.pdf .
- J. Ilavsky, F. Zhang, A. J. Allen, L. E. Levine, P. R. Jemian and G. G. Long, Metall. Mater. Trans. A, 2013, 44, 68–76 CrossRef CAS.
- J. Ilavsky and P. R. Jemian, J. Appl. Crystallogr., 2009, 42, 347–353 CrossRef CAS.
- D. Tatchev and R. Kranold, J. Appl. Crystallogr., 2004, 37, 32–39 CrossRef CAS.
- L. E. Levine and G. G. Long, J. Appl. Crystallogr., 2004, 37, 757–765 CrossRef CAS.
- R. J. Hunter, in Zeta Potential in Colloid Science, ed. R. J. Hunter, Academic Press, 1981, pp. 59–124 Search PubMed.
- M. Thoma, W. Lin, E. Hoffmann, M. M. Sattes, D. Segets, C. Damm and W. Peukert, Langmuir, 2018, 34, 12324–12334 CrossRef CAS.
- N. Jacob, Israelachvili, Intermolecular and Surface Forces, Academic Press, Cambridge, 2nd edn, 2011 Search PubMed.
- W. S. Choi, S. S. A. Seo, K. W. Kim, T. W. Noh, M. Y. Kim and S. Shin, Phys. Rev. B: Condens. Matter Mater. Phys., 2006, 74, 205117 CrossRef.
- J. Backholm and G. A. Niklasson, Sol. Energy Mater. Sol. Cells, 2008, 92, 1388–1392 CrossRef CAS.
- J. Mewis and N. J. Wagner, Colloidal Suspension Rheology, Cambridge University Press, Cambridge, 2011 Search PubMed.
- N. Jacob, Israelachvili, Intermolecular and Surface Forces, Academic Press, Cambridge, 2nd edn, 2011 Search PubMed.
- S. A. Berlinger, B. D. McCloskey and A. Z. Weber, J. Phys. Chem. B, 2018, 122, 7790–7796 CrossRef CAS PubMed.
- C. J. van Oss, Interfacial Forces in Aqueous Media, CRC Press, 2nd edn, 2006 Search PubMed.
- C. J. van Oss, Colloids Surf., A, 1993, 78, 1–49 CrossRef CAS.
- C. Galindo-González, J. de Vicente, M. M. Ramos-Tejada, M. T. López-López, F. González-Caballero and J. D. G. Durán, Langmuir, 2005, 21, 4410–4419 CrossRef.
- D. K. Paul, K. Karan, A. Docoslis, J. B. Giorgi and J. Pearce, Macromolecules, 2013, 46, 3461–3475 CrossRef CAS.
- M. V. Smoluchowski, Phys. Z., 1916, 17, 557–585 Search PubMed.
- J. H. Masliyah and S. Bhattacharjee, Electrokinetic Phenomena, Electrokinetic and Colloid Transport Phenomena, John Wiley & Sons, Ltd, 2006 Search PubMed.
- N. Fuchs, Z. Phys., 1934, 89, 736–743 CrossRef.
- E. Moghimi, A. R. Jacob, N. Koumakis and G. Petekidis, Soft Matter, 2017, 13, 2371–2383 RSC.
- A. Ettehadi, M. Tezcan and G. Altun, Rheol. Acta, 2020, 59, 665–683 CrossRef CAS.
- J. Labanda and J. Llorens, Colloids Surf., A, 2008, 329, 1–6 CrossRef CAS.
- S. Jatav and Y. M. Joshi, J. Rheol., 2014, 58, 1535–1554 CrossRef CAS.
- S. Uemura, T. Yoshida, M. Koga, H. Matsumoto, X. Yang, K. Shinohara, T. Sasabe and S. Hirai, J. Electrochem. Soc., 2019, 166, F89 CrossRef CAS.
- S. Khandavalli, J. H. Park, N. N. Kariuki, D. J. Myers, J. J. Stickel, K. Hurst, K. C. Neyerlin, M. Ulsh and S. A. Mauger, ACS Appl. Mater. Interfaces, 2018, 10, 43610–43622 CrossRef CAS PubMed.
- S. Khandavalli, R. Iyer, J. H. Park, D. J. Myers, K. C. Neyerlin, M. Ulsh and S. A. Mauger, Langmuir, 2020, 36, 12247–12260 CrossRef CAS PubMed.
- C. Welch, A. Labouriau, R. Hjelm, B. Orler, C. Johnston and Y. S. Kim, ACS Macro Lett., 2012, 1, 1403–1407 CrossRef CAS.
- A. Tarokh, K. Karan and S. Ponnurangam, Macromolecules, 2020, 53, 288–301 CrossRef CAS.
- A. Kusoglu and A. Z. Weber, Chem. Rev., 2017, 117, 987–1104 CrossRef CAS.
- R. Devivaraprasad and T. Masuda, Langmuir, 2020, 36, 13793–13798 CrossRef CAS.
- G. Fritz, V. Schäddler, N. Willenbacher and N. J. Wagner, Langmuir, 2002, 18, 6381–6390 CrossRef CAS.
- M. B. Einarson and J. C. Berg, J. Colloid Interface Sci., 1993, 155, 165–172 CrossRef CAS.
- B. Derjaguin and L. Landau, Acta Physicochem. URSS, 1941, 14, 633–662 Search PubMed.
- F. Xu, H. Zhang, J. Ilavsky, L. Stanciu, D. Ho, M. J. Justice, H. I. Petrache and J. Xie, Langmuir, 2010, 26, 19199–19208 CrossRef CAS.
- M. Ghelichi, K. Malek and M. H. Eikerling, Macromolecules, 2016, 49, 1479–1489 CrossRef CAS.
- S. Khandavalli, J. H. Park, H. H. Winter, D. J. Myers, M. Ulsh and S. A. Mauger, Macromolecules, 2023, 56, 6988–7005 CrossRef CAS.
- P. Aldebert, G. Gebel, B. Loppinet and N. Nakamura, Polymer, 1995, 36, 431–434 CrossRef CAS.
- C. I. Gupit, X. Li, R. Maekawa, N. Hasegawa, H. Iwase, S. Takata and M. Shibayama, Macromolecules, 2020, 53, 1464–1473 CrossRef CAS.
- A. V. Dobrynin, R. H. Colby and M. Rubinstein, Macromolecules, 1996, 28, 1859–1871 CrossRef.
- P. Aldebert, B. Dreyfus, G. Gebel, N. Nakamura, M. Pineri and F. Volino, J. Phys., 1988, 49, 2101–2109 CrossRef CAS.
- B. Loppinet, G. Gebel and C. E. Williams, J. Phys. Chem. B, 1997, 101, 1884–1892 CrossRef CAS.
- A. T. Kuo, S. Urata, K. Nakabayashi, H. Watabe and S. Honmura, Macromolecules, 2021, 54, 609–620 CrossRef CAS.
- S. Gyergyek, D. Makovec and M. Drofenik, J. Colloid Interface Sci., 2011, 354, 498–505 CrossRef CAS PubMed.
- P. Hu and L. Liang, Miner. Eng., 2020, 154, 106421 CrossRef CAS.
- D. K. Paul, H. K. (Key) Shim, J. B. Giorgi and K. Karan, J. Polym. Sci., Part B: Polym. Phys., 2016, 54, 1267–1277 CrossRef CAS.
- H. F. M. Mohamed, S. Kuroda, Y. Kobayashi, N. Oshima, R. Suzuki and A. Ohira, Phys. Chem. Chem. Phys., 2013, 15, 1518–1525 RSC.
- S. C. DeCaluwe, A. M. Baker, P. Bhargava, J. E. Fischer and J. A. Dura, Nano Energy, 2018, 46, 91–100 CrossRef CAS.
- S. A. Berlinger, B. D. McCloskey and A. Z. Weber, ACS Energy Lett., 2021, 6, 2275–2282 CrossRef CAS.
- R. Koestner, Y. Roiter, I. Kozhinova and S. Minko, J. Phys. Chem. C, 2011, 115, 16019–16026 CrossRef CAS.
- M. Rubinstein, R. H. Colby and A. V. Dobrynin, Phys. Rev. Lett., 1994, 73, 2776–2779 CrossRef CAS.
- C. Wandrey, Langmuir, 1999, 15, 4069–4075 CrossRef CAS.
- T. Van Cleve, S. Khandavalli, A. Chowdhury, S. Medina, S. Pylypenko, M. Wang, K. L. More, N. Kariuki, D. J. Myers, A. Z. Weber, S. A. Mauger, M. Ulsh and K. C. Neyerlin, ACS Appl. Mater. Interfaces, 2019, 11, 46953–46964 CrossRef CAS.
- L. Osmieri, G. Wang, F. C. Cetinbas, S. Khandavalli, J. Park, S. Medina, S. A. Mauger, M. Ulsh, S. Pylypenko, D. J. Myers and K. C. Neyerlin, Nano Energy, 2020, 104943 CrossRef CAS.
- D. Wu, N. Kayo, S. M. Jayawickrama, Y. K. Phua, N. Tanaka and T. Fujigaya, Int. J. Hydrogen Energy, 2023, 48, 5915–5928 CrossRef CAS.
- T. T. Ngo, T. L. Yu and H.-L. Lin, J. Power Sources, 2013, 225, 293–303 CrossRef CAS.
- G. Akerlof, J. Am. Chem. Soc., 1932, 54, 4124–4139 CrossRef.
- T. Mashio, A. Ohma and T. Tokumasu, Electrochim. Acta, 2016, 202, 14–23 CrossRef CAS.
- C. G. Lopez, R. H. Colby, P. Graham and J. T. Cabral, Macromolecules, 2017, 50, 332–338 CrossRef CAS.
- R. Balu, N. R. Choudhury, J. P. Mata, L. De Campo, C. Rehm, A. J. Hill and N. K. Dutta, ACS Appl. Mater. Interfaces, 2019, 11, 9934–9946 CrossRef CAS.
- A. Nikolov and D. Wasan, Adv. Colloid Interface Sci., 2014, 206, 207–221 CrossRef CAS.
- S. F. Kistler and P. M. Schweizer, Liquid Film Coating, Springer, Netherlands, Dordrecht, 1997 Search PubMed.
- M. Bühler, F. Hegge, P. Holzapfel, M. Bierling, M. Suermann, S. Vierrath and S. Thiele, J. Mater. Chem. A, 2019, 7, 26984–26995 RSC.
- Y. D. Yi and Y. C. Bae, Polymer, 2017, 130, 112–123 CrossRef CAS.
- C. H. Hsu and C. C. Wan, J. Power Sources, 2003, 115, 268–273 CrossRef CAS.
- M. Bühler, P. Holzapfel, D. McLaughlin and S. Thiele, J. Electrochem. Soc., 2019, 166, F1070 CrossRef.
- S. A. Grigoriev, P. Millet, S. A. Volobuev and V. N. Fateev, Int. J. Hydrogen Energy, 2009, 34, 4968–4973 CrossRef CAS.
- M. I. Smith and J. S. Sharp, Langmuir, 2011, 27, 8009–8017 CrossRef CAS PubMed.
- L. Courbin, J. C. Bird, M. Reyssat and H. A. Stone, J. Phys.: Condens. Matter, 2009, 21, 464127 CrossRef CAS PubMed.
- A. Clarke, T. D. Blake, K. Carruthers and A. Woodward, Langmuir, 2002, 18, 2980–2984 CrossRef CAS.
- Q. Gong, C. Li, Y. Liu, J. Ilavsky, F. Guo, X. Cheng and J. Xie, ACS Appl. Mater. Interfaces, 2021, 13, 37004–37013 CrossRef CAS PubMed.
- J. Huang, Y. Gao, J. Luo, S. Wang, C. Li, S. Chen and J. Zhang, J. Electrochem. Soc., 2020, 167, 166503 CrossRef CAS.
- E. Padgett, G. Bender, A. Haug, K. A. Lewinski, F. Sun, H. Yu, D. A. Cullen, A. Steinbach and S. M. Alia, Meet. Abstr., 2022, p. 1435 Search PubMed.
- T. Lickert, S. Fischer, J. L. Young, S. Klose, I. Franzetti, D. Hahn, Z. Kang, M. Shviro, F. Scheepers, M. Carmo, T. Smolinka, G. Bender and S. Metz, Appl. Energy, 2023, 352, 121898 CrossRef.
Footnotes |
| † Electronic supplementary information (ESI) available. See DOI: https://doi.org/10.1039/d4sm00987h |
| ‡ Affiliation a is Diana Y. Zhang's present affiliation. |
| This journal is © The Royal Society of Chemistry 2024 |