
 Open Access Article
 This Open Access Article is licensed under a Creative Commons Attribution-Non Commercial 3.0 Unported Licence
Bubbles and drops between circular frames: shape, force and stability analysis†
Friedrich
Walzel
 *,
Jonathan
Dijoux
,
Leandro
Jacomine
,
Élodie
Harle
,
Pierre
Muller
,
Thierry
Charitat
and
Wiebke
Drenckhan
*,
Jonathan
Dijoux
,
Leandro
Jacomine
,
Élodie
Harle
,
Pierre
Muller
,
Thierry
Charitat
and
Wiebke
Drenckhan
Institut Charles Sadron, CNRS UPR22 – University of Strasbourg, 23 rue du Loess, BP 84047 67034 Strasbourg Cedex 2, France. E-mail: friedrich.walzel@ics-cnrs.unistra.fr
First published on 27th September 2024
Abstract
Interactions between bubbles and drops play an important role in many physical phenomena. Whether we consider the interaction between two bubbles (drops) or between many (foams or emulsions), these interactions are complex and still poorly understood. An interesting case arises when two equal- and constant-volume bubbles (drops) interact with each other while being held by two axisymmetrically positioned frames of circular opening – a configuration which is frequently used in characterisation devices. The minimisation of the surface energy of this “double bubble” (or “double drop”) configuration, constrained by the fixed volume and the frame boundaries, creates a complex landscape of shape spaces where physically stable shapes are separated by different types of instabilities. Combining experiments, finite element simulations and theory, we provide here for the first time a complete analysis of these shape spaces, considering the adhesive energy between the bubbles and the drops (expressed by the contact angle) as an additional control parameter. We provide the full shape diagrams for different contact angles (0°, 60° and 90°), including a detailed discussion of four types of instabilities. Two of these instabilities break the axisymmetry, while the two others break the connectivity of the ensemble. As far as we are aware, two of these instabilities have never been reported before. We accompany the shape and stability analysis with detailed mechanical characterisation using force and pressure measurements. Experiments, simulations and theory showing excellent agreement. This work will not only be useful in guiding the exploitation of double bubble (double drop) experiments on frames, but it also opens the possibility to exploit these configurations for the characterisation of increasingly complex bubble or drop interactions. Since the contact angle of 90° corresponds to an “imaginary” film separating the two bubbles (drops), our analysis naturally includes the shape and stability of a capillary bridge between two circular frames.
1 Introduction
Bubbles and drops play an important role in many physical phenomena. Their interactions control the behaviour of assemblies of bubbles or drops, ranging all the way from the simple assembly of two bubbles or two drops to the complex multi-body interactions in foams and emulsions.1–3 One of the most commonly used techniques to characterise the properties of individual bubbles (drops) is rising bubble (pendant drop) tensiometry,4–6 which uses the shape analysis of an axisymmetric bubble (drop) held by a capillary with circular cross-section. Here, we propose to exploit this kind of configuration after the addition of a second bubble (drop) held by an axisymmetrically positioned capillary to investigate the interactions between bubbles (drops), as shown in Fig. 1. Similar configurations have been used in the past in order to quantify the coalescence of bubbles (drops)7–10 or the adhesive energy between bubbles, drops or vesicles,11–13 the latter being expressed by the contact angle θc created between the two bubbles (drops) (Fig. 1). However, even in the case of bubbles (drops) of equal and constant volume V, constant interfacial tension γ, fixed on identical, axisymmetrically positioned frames with a circular cross-section of radius R, and separated by a distance h (Fig. 1), surface minimisation creates a highly complex landscape of possible shape configurations. The V–R–θc–h shape space contains zones with different physically stable shapes that are separated by at least four types of shape instabilities. These instabilities may either break the axisymmetry of the ensemble or its connectivity. They are sketched in Fig. 2 together with the convention used for the names and abbreviations throughout the article. One illustrative example which includes three of these instabilities is shown in Fig. 3 for the case of two soap bubbles in air. The two bubbles are initially separated (“separated bubbles”, SB). Upon decreasing h, they “jump” into contact (“connected bubbles”, CB) at h = hSB→CB during a first shape instability, creating a contact angle of θc = 60° due to the natural attraction between soap bubbles in air. Further reducing h creates an increasing “flattening” deformation of the two axisymmetric bubbles, until a second shape instability is reached at h = hCB→TB12,14,15 which breaks the axisymmetry by tilting of the two bubbles (“tilted bubbles”, TB). Further decreasing h increases the tilt angle. Increasing h again, the same shapes are re-accessed in a fully reversible manner until h = hSB→CB. For h > hSB→CB, a range of elongated, axisymmetric bubble shapes are accessible due to the attraction between the bubbles. At another critical distance (hCB→SB or hCB→DB), the two bubbles may either detach from each other (top row of Fig. 3, “separated bubbles”, SB) or detach from the frame (the bottom row of Fig. 3, “detached bubbles”, DB). The precise sequence of the shape configurations and the shape instabilities depends on V, R and θc (Fig. 1). For different parameter ranges, other types of instabilities may arise, which are described in more detail in Section 3 and summarised visually in Fig. 4. | ||
Fig. 1 Configurations considered in this article: (a) “bubble/drop”: two drops or two bubbles in contact surrounded by a liquid (θc = 0°); (b) “soap bubbles”: two bubbles in contact in air (θc = 60°); (c) “capillary bridge”: one bubble or drop separated by an “imaginary” central film of zero interfacial tension, leading to θc = 90°. All bubbles or drops are held by axisymmetrically positioned circular frames. The geometrical variables are as follows: h is the distance between the frames, R is the frame radius, V is the bubble or drop volume, θc is the contact angle between the upper and lower bubbles and θ is the angle of inclination of the r(z)-profile. Fz![[e with combining right harpoon above (vector)]](https://www.rsc.org/images/entities/i_char_0065_20d1.gif) z is the vertical force component in the z-direction exerted on the lower bubble by the lower frame, pi and po are the inner and outer pressure of the bubbles (drops), respectively, and γf and γb are the effective film and effective bubble interfacial tensions, respectively. z is the vertical force component in the z-direction exerted on the lower bubble by the lower frame, pi and po are the inner and outer pressure of the bubbles (drops), respectively, and γf and γb are the effective film and effective bubble interfacial tensions, respectively. | ||
 | ||
| Fig. 2 Overview of the convention used for the names and abbreviations of the physically stable shapes for the three contact angles θc. For simplicity, only “bubble” is used even though the terminology applies equally to drops. | ||
 | ||
| Fig. 3 Series of photographs of soap bubble experiments where the distance h between the frames is first decreased and then increased in a quasi-static manner showing different shapes and instabilities which can be obtained. In the bottom row, the volume V of the bubbles is larger, leading to a different instability upon increasing h. | ||
 | ||
| Fig. 4 Overview of different shape configurations for two bubbles (or drops) (left), two soap bubbles (centre) and capillary bridges (right) (see Fig. 1a), which appear by changing h, R, V and θc. One finds five different shapes which are listed in Fig. 2: connected bubbles (CB), separated bubbles (SB), detached bubbles (DB), tilted bubbles (TB) with the tilt angle φ, and shifted bubbles (ShB). | ||
In order to capture these complex behaviours for the entire V–R–θc–h parameter space, we combine experiments, finite element simulations (Surface Evolver) and theory (Delaunay surfaces). We provide a complete description of these “shape spaces”, including the mechanical stress created by the bubbles (drops) on the frames.
Other research groups conducted similar investigations with three-dimensional or quasi-two dimensional soap bubbles.14–16 However, in most of the previous investigations, the bubbles (drops) are confined between two parallel solid walls on which the bubbles (drops) can move freely, i.e. the boundary condition is given by a fixed contact angle between the bubble (drop) and the solid surface. The fact that in our setup the bubbles (drops) are fixed by a frame of constant radius R changes some degrees of freedom of the problem and hence the shape behaviour. While Fortes et al.16 and Bohn15 discuss also briefly this case, they do not show quantitative results. Since this configuration is relevant for many physical scenarios, it is important to establish a more quantitative understanding.
In our analysis, we concentrate on systems with constant interfacial tension γ. By choosing wisely the gas/liquid or liquid/liquid configuration, we have access to different contact angles θc between the bubbles (drops), as shown in Fig. 1. This contact angle can be interpreted as the change in surface energy between the contact film of effective tension γf and the “free” bounding surface with effective tension γb. The tensions are related to the contact angle θcvia equilibrium considerations at the contact line
2γb![[thin space (1/6-em)]](https://www.rsc.org/images/entities/char_2009.gif) cos(θc) = γf. cos(θc) = γf. | (1) |
In all our considerations, we neglect gravity. In the experiments, this is ensured by choosing configurations in which the interfacial tension dominates gravity (see Section 2.2 in the main article and Section S1.2 in the ESI†). In this case, the characteristic height of the bubbles or drops must be smaller than the capillary length, which is equivalent to a small Bond number. All surfaces are therefore constant mean curvature surfaces given by the Young–Laplace law and the constant interfacial tension γ. In the case of axisymmetric shapes, the external surfaces are part of the family of Delaunay surfaces17 whose theory we describe in more detail in Section 2.3.
In the following, we will analyse in detail the different shape spaces by combining experiments (Section 2.2), finite element simulations (Surface Evolver, Section 2.4) and the theory of Delaunay surfaces (Section 2.3). In the theoretical part, we also provide the method to obtain the shapes which fit to the experiments and simulations (Section 2.3). We combine all three methods to analyse acting forces and/or pressures for different experimental configurations (Section 3.2). We then discuss in detail the associated shape diagrams for the three different contact angles θc (Section 3.3). To facilitate the reading, we keep the main body of the article as synthetic as possible, while some of the more technical parts are provided in the ESI.†
Experiments, simulations and theory showing excellent agreement. We think that this work will be useful for scientists working on double bubble (double drop) and capillary bridge problems between frames. It does not only provide a solid basis to start exploring more complex interactions (such as bubbles or drops with elastic interfaces), but is also hoped to inspire more in-depth investigations of some of the instabilities which still await a theoretical description.
2 Materials and methods
2.1 Materials
For soap bubbles, we used a mixture of 30 wt% glycerol, 3 wt% Fairy dishwashing liquid and deionised water (Milli-Q). We mixed them for 20 minutes with a magnetic stirrer and used this solution for a period of 5 months. The interfacial tension of this solution with air was γ = 26.0 ± 0.5 mN m−1 measured with pendant drop tensiometry (TRACKER device from TECLIS).Air bubbles were also created in an aqueous solution of Sodium Dodecyl Sulfate (SDS) at a concentration of 6.5 g L−1, which corresponds to 2.75 times the critical micelle concentration. The solution was mixed for a couple of hours with a magnetic stirrer. The interfacial tension between the aqueous SDS solution and air was γ = 33 ± 0.5 mN m−1. The same solution was used to create water drops with SDS in silicone oil (BLUESIL FLD 47V100, LOT 9255610). At 20 °C, its density was determined to be ρ = 0.965 ± 0.001 kg L−1 using a D4 METTLER TOLEDO densimeter. The interfacial tension between the aqueous SDS solution and the silicone oil was measured to be γ = 11.2 ± 0.2 mN m−1 using pendant drop tensiometry (TRACKER device from TECLIS), also at 20 °C.
2.2 Experimental methods
We use two different setups (Fig. 5): one for the “bubble/drop” configuration (Fig. 5a) and one for the “soap bubble” configuration (Fig. 5b). Each experiment consists of a cycle where h is varied, while V, R, and θc remain constant. The pressure changes across the interface are small compared to the atmospheric pressure. Consequently, the volume changes during an experiment are negligible even for the bubbles, i.e., all systems are considered as incompressible. | ||
| Fig. 5 The two experiment setups used in this article: (a) “bubble/drop setup” and (b) “soap bubble setup”. The bubble/drop setup refers in reality to two different setups which follow the same principles. One is a modified device from TECLIS and the other one (shown in (a)) is a lab-made device following the principles of the TECLIS device. In the images, we can see: ① the two syringes to charge the system with a liquid, ② the two frames for the soap bubbles, ③ the syringes to control the volume of the drops with a linear motor, ④ the tilting mechanisms to change the angular orientation of the needles, ⑤ the diffusive backlights, ⑥ the cameras, ⑦ the vessel with temperature control, ⑧ the tubes which contain temperature controlled water, ⑨ the two needles (one is straight and the other is in U-shape), ⑩ the pressure sensor and ⑪ the micro controller for a transverse displacement of the upper needle with a tilting mechanism. The “soap bubble setup” (b) has the same overall configuration. The differences are the frame size (⑨ vs. ②) and the pressure sensor ⑩ in (a) and the force sensor ⑫ in (b). | ||
The verticality and coaxiality of the needle ends are adjusted at the beginning of each experiment. Depending on the type of experiment to be conducted, the quartz vessel was filled with an aqueous SDS solution for the investigation of bubble–bubble interactions, or with a silicone oil for the investigation of drop–drop interactions. In the first case, the syringes, tubes and needles were filled with air, while in the second case they were filled with SDS solution. We decided to make water drops in silicone oil (rather than the opposite), as it is easier to clean the vessel than the syringe system. Both systems can be easily inverted to investigate water drops in air or oil drops in water.
At the beginning of each experiment, the bubbles or drops were formed separately with a defined volume. With help of the cameras coupled to a PID control, the volume is accurately controlled and kept constant for 60 s to allow surfactant adsorption on the bubble (drop) surface. Then, the bubbles (drops) are moved against each other along the needle axis with help of the micro-controller until they touch and deform. We make sure that the deformation is slow enough to be considered quasi-static using a slow displacement velocity of the needle of 20 μm s−1. Even though the PID volume control is switched off during this part of the experiment, its duration is short enough to assume that the drop volumes remain constant. We verify this by measuring the bubble (drop) volume before and after each experiment.
Since it is impossible to measure directly Δp in the bubbles, the measured pressure has always a constant offset related to the hydrostatic pressure inside and outside of the bubble. This offset is obtained by comparing the mean curvature at the apex of a single bubble with the pressure obtained with the sensor at the beginning of every experiment. To increase the precision of the offset measurement, the bubble was inflated and deflated quasi-statically to obtain more points for calibration. This procedure is described in Section S1 in the ESI.†
For the experiments, a soap film was first formed on the outlet of the frames by immersing them in the soap solution. Afterwards, a given volume of air was injected into the frames via syringes to create bubbles of volume V. The sizes of the syringes were chosen for each experiment to optimise the precision in the volume control for the desired bubble volumes, which ranged between 1 mL < V < 30 mL. The relative error is typically of the order of 1%. Afterwards, the bubbles were positioned on the same symmetry axis with the help of two cameras (IDS U3-3800CP-M-GL R2) positioned at an angle of 90° to each other. The upper bubble was moved in the vertical direction using a linear table CKK and a motor MSN03. The movement was smooth with a speed of 0.02 mm s−1 controlled using a lab-made LabVIEW program. We verified that this speed is slow enough to neglect viscoelastic contributions of the soap films.
The vertical component of the force Fz exerted on the lower bubble by the lower frame in the z-direction is measured by monitoring the apparent weight of the bottom frame with a high-precision scale SECURA224-1S with a precision of 0.1 μN. The frame weight plus some drained liquid imposes an offset, which is extracted to obtain the correct force Fz, as discussed below. The change in the drained liquid during an experiment is small enough to be neglected. The offset is obtained with a precision of 1 μN. The shape of the bubbles is obtained by imaging them in front of a diffusive screen using a digital camera IDS U3-3800CP-M-GL R2. These images are also used to obtain the distance h between the frames.
At the beginning of each experiment, the distance h between the two frames is decreased until the film between the two bubbles is strongly tilted. Afterwards, the measurement starts by capturing images and saving the force Fz every two seconds. The upper frame moves smoothly upwards. The measurement is stopped 10 s after the two bubbles detach or one bubble detaches from a frame. The force measured after a detachment is used to calculate the offset between Fz and the apparent weight.
The experimental procedure is the same for the capillary bridge (contact angle θc = 90°) only with one large bubble of volume 2V, which connects the two frames. It is explained in more detail in Section S1 in the ESI.†
2.3 Theoretical method: shape analysis using Delaunay surfaces
In the following, we only talk about bubbles to facilitate reading. However, all concepts apply equally to drops. One can divide the films and interfaces of the two bubbles in contact into three parts: the upper and the lower bubbles (external surface) and the film separating the two bubbles. In all our considerations, we neglect gravity. In the experiments, we ensure this by choosing configurations in which interfacial tension dominates gravity, as discussed in Section 2 and in Section S1 in the ESI.† We therefore assume Δp as constant along the z direction, meaning that the upper and lower parts of the bubble shape are constant mean curvature surfaces. If the two bubbles have the same volume and the boundary conditions are mirror symmetric, the pressure difference between both bubbles is zero and the separating film is a minimal surface. In the case where the bubble configuration remains axisymmetric, the separating film remains a horizontal, flat plane at mid-height and the upper and lower parts can be described by a “Delaunay surface”.17,18 Together with the catenoid shape, Delaunay surfaces are the only axisymmetric constant mean curvature surfaces.18 Using these known mathematical results, we analyse our experiments with the help of the analytical equations describing Delaunay surfaces, as described in the following.The energy of an axisymmetric shape defined by r(z) (Fig. 1) with constant interfacial tension γ can be written as
 | (2) |
 | (3) |
For cylinders, unduloids and spheres, the pressure and the interfacial tension contributions have opposite signs (minus sign in eqn (3)). For nodoids, the interfacial tension force changes its orientation at the point where the profile becomes horizontal (r,z has a singularity). At this point, the last term in eqn (3) switches sign.20
The absolute value of the inverse mean curvature
 | (4) |
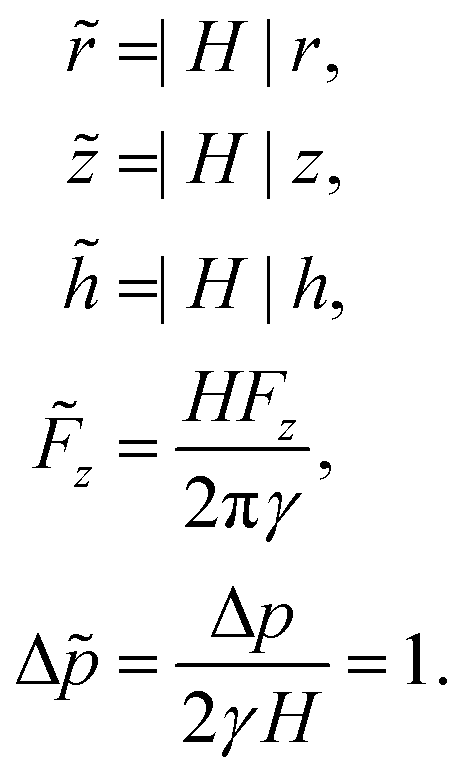 | (5) |
![[F with combining tilde]](https://www.rsc.org/images/entities/i_char_0046_0303.gif) z. The numerical prefactor 2π, which scales the force Fz, is used to obtain the standard Delaunay surface equations. Then, the normalised surface shape depends only on one parameter, the normalised force20
z. The numerical prefactor 2π, which scales the force Fz, is used to obtain the standard Delaunay surface equations. Then, the normalised surface shape depends only on one parameter, the normalised force20 | (6) |
Four different groups of Delaunay surfaces are commonly distinguished by the value of z (see Fig. 6):20,21 “nodoids” for z > 0, “spheres” for z = 0, “unduloids” for 0 > z > −0.25 and “cylinders” for z = −0.25. The only other Delaunay surface, which exists, is the catenoid.22,23 It is obtained by setting Δp = 0, i.e. by requiring not only axisymmetry but also zero mean curvature. It represents a special case in which |H| becomes infinitely small. The length normalisation with |H| therefore becomes impossible. For more information, see Section S4 in the ESI.†
 | ||
Fig. 6 Examples of the normalised profiles ![[r with combining tilde]](https://www.rsc.org/images/entities/i_char_0072_0303.gif) ( (![[z with combining tilde]](https://www.rsc.org/images/entities/i_char_007a_0303.gif) ) of the four Delaunay surfaces: cylinders, unduloids, spheres and nodoids obtained with eqn (3) (shifted by = 2 for a better visualisation). The black dash-dotted lines are the rotation axis of the shapes. The dashed, grey shaded circles in the cavalier perspective are the possible start and end points/planes for the Delaunay profiles/surfaces. The black crosses are the turning points where the slope d/d is maximal or minimal for unduloids and spheres. By crossing the surface, we obtain always a pressure jump of |Δ ) of the four Delaunay surfaces: cylinders, unduloids, spheres and nodoids obtained with eqn (3) (shifted by = 2 for a better visualisation). The black dash-dotted lines are the rotation axis of the shapes. The dashed, grey shaded circles in the cavalier perspective are the possible start and end points/planes for the Delaunay profiles/surfaces. The black crosses are the turning points where the slope d/d is maximal or minimal for unduloids and spheres. By crossing the surface, we obtain always a pressure jump of |Δ![[p with combining tilde]](https://www.rsc.org/images/entities/i_char_0070_0303.gif) | = 1. Since there is a self-intersection for the nodoids, there are three zones, one with = ∞, one with = ∞ + Δ and one with = ∞ + 2Δ, shown in different pink shadows. ω0 and ω1 show a possible start and an end point for surfaces. In the case of a nodoid, the chosen shape has Δp < 0 and some parts of the interface go beyond the plane of the frame. The volume enclosed between the plane of the frame and this part of the interface is counted as negative (the red area in the figure). | = 1. Since there is a self-intersection for the nodoids, there are three zones, one with = ∞, one with = ∞ + Δ and one with = ∞ + 2Δ, shown in different pink shadows. ω0 and ω1 show a possible start and an end point for surfaces. In the case of a nodoid, the chosen shape has Δp < 0 and some parts of the interface go beyond the plane of the frame. The volume enclosed between the plane of the frame and this part of the interface is counted as negative (the red area in the figure). | ||
In our experimental configuration, when axisymmetry is preserved, the external surfaces of the bubbles or drops are therefore sections of Delaunay surfaces belonging to one of the five families defined above. Using the standard parametrisation of the shape of these surfaces by the rolling angle ω of cone sections along the axis of symmetry21 (see also Section S2 in the ESI†) leads to the cylindrical coordinate equations
| r = r(ω,z,H), | (7) |
| z = z(ω,z,H), | (8) |
| (ω = ω0) = 0, | (9) |
 | (10) |
| (ω = ω1) = |H|R. | (11) |
At the boundary of the contact film, the contact angle θc defines the slope d/d(ω = ω0)
 | (12) |
 | (13) |
can be negative at some parts of the shape in the case of a nodoid (Fig. 6). Consequently, the interface can go beyond the plane of the frame. The volume enclosed between the plane of the frame and this part of the interface is then counted as negative to maintain volume conversation (the red part in Fig. 6 for the nodoid profile).
The different boundary conditions therefore lead to the five relationships (9)–(13). Eqn (9) is trivial and fixes an integration constant corresponding to translation along the z-axis. The other four equations are used to calculate the four unknown physical quantities: ω0, ω1, H and z. We therefore obtain a uniquely defined surface.
It is more natural to think about sets of surfaces which differ only in one boundary condition, for example in h. This is also the relevant consideration for our experiments, since in each experiment we change only the distance h. We can then search for the corresponding surfaces whose z fulfill all boundary conditions to obtain the complete set of Delaunay surfaces. The exact procedure of how the equations are solved is explained in Section S2 in the ESI.† In general, the Delaunay surfaces are scaled and cut so that they satisfy the boundary conditions. However, one needs to keep in mind that the question of the stability of these shapes is not solved with these considerations.
For different types of Delaunay surfaces, defined by the value of z, the angle θ = cot−1(,) (see Fig. 1) varies between two extreme values θmin(z) and θmax = 180° − θmin(z). The minimum angle θmin is plotted in Fig. 7 as a function of z. The contact angle θc must be included in this interval for a solution to exist. Consequently, we found for θc = 0° only surfaces which are parts of nodoids and spheres, for θc > 0° also some unduloids and for θc = 90° all types of Delaunay surfaces, including cylinders (the cylindrical surface is only accessible in the case of “capillary bridges”).
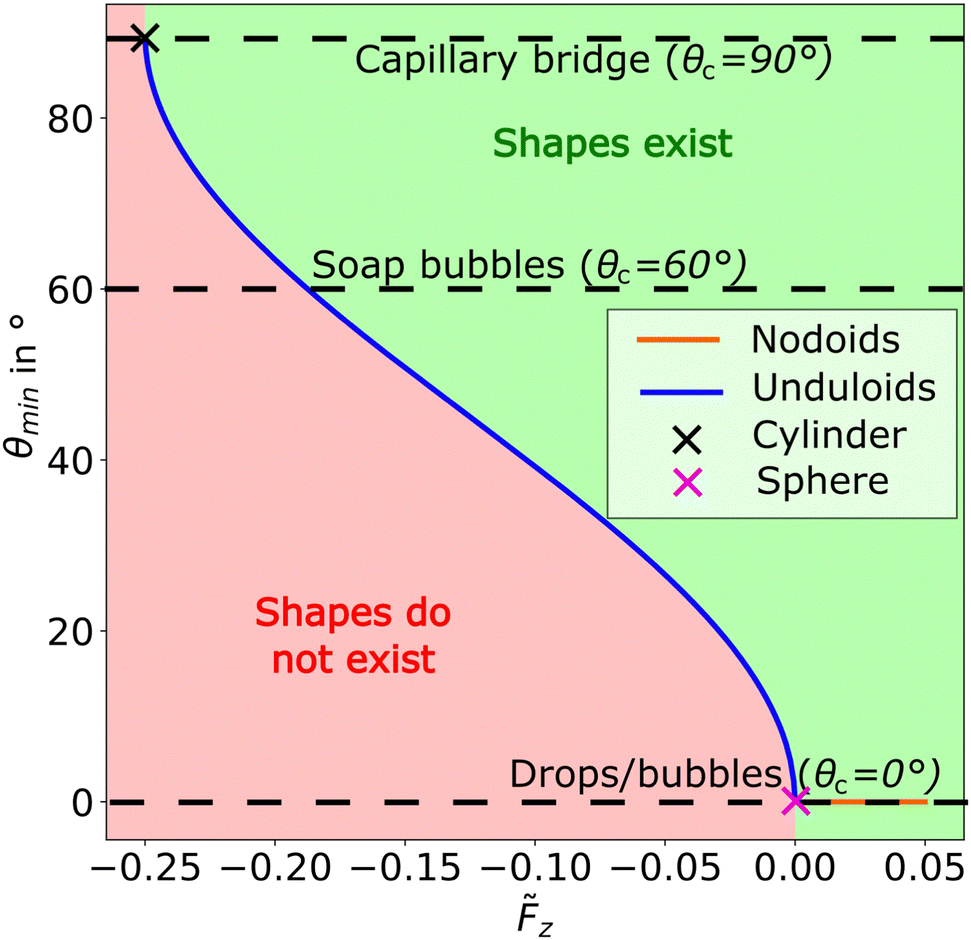 | ||
| Fig. 7 The minimal contact angle θmin is plotted for different Delaunay surfaces with different z values. The red and green areas illustrate the inaccessible and accessible z values, respectively, for different contact angles θc. Only the z values larger than the crossing point between the horizontal dashed lines (illustrating different contact angles θc) are accessible for the specific θc. | ||
Spherical solutions always have z = 0. There is only one solution for θc = 0° (a simple sphere truncated by the frame) and two solutions for θc > 0° (a simple sphere truncated by the frame and a double truncated sphere by the frame and the other bubble).
The nodoid is the only Delaunay surface which exists under compression (Fz > 0) and with a negative pressure difference Δp < 0. By crossing an interface of a Delaunay surface, the pressure changes by |Δp|. Depending on the direction in which the interface is crossed, the pressure jump is positive or negative. The self-intersection of the nodoids allows to cross two interfaces. Before crossing an interface, = ∞; after crossing the first interface, = ∞ + Δ, and after crossing the second interface, = ∞ + 2Δ, as shown by the pink shaded areas in Fig. 6. If we now define o = ∞ + 2Δ and i = ∞ + Δ, the pressure difference Δio = i − o is in this case −Δ and changes sign. Since we also changed the direction of ω, the force also changes sign.
2.4 Computational method: Surface Evolver
Surface Evolver is a finite element program to simulate surfaces under given constraints.24 It models surfaces using a mesh of facets which are defined by edges and vertices. Bodies are closed surfaces having a given volume and pressure. The mesh can be refined during the simulation by splitting facets into smaller facets by adding new vertices.The vertices move in the direction of the energy gradient under the consideration of constraints during every convergence step to obtain the smallest energy possible. A stable configuration is found if the surface is an energy minimum. The energy gradient vanishes in this case. The resulting surface properties can then be compared to experiments and theory.
Surface Evolver also provides a tool to investigate shape instabilities.14 An extremal surface is stable if all second derivatives of the energy functional with respect to the surface coordinates are positive. All second derivatives are expressed by the Hessian matrix. In most cases, an analytical solution for the Hessian matrix is not available. Surface Evolver provides a numerically obtained Hessian matrix, which is the second derivative of the energy functional with respect to the vertex coordinates. If the energy is a stable minimum, all eigenvalues λi of the Hessian matrix are positive. A shape instability occurs when the smallest eigenvalue reaches zero. We use this method to investigate the stability of different configurations. The detailed procedure of the simulation is explained in Section S5 in the ESI.†
3 Results and discussion
3.1 General observations
In order to describe different stable shapes and instabilities, we use the following naming convention, which is summarised schematically in Fig. 2 with the corresponding images given in Fig. 4 for the three contact angles θc. A detailed example for one contact angle is given in Fig. 3. For simplicity, we only use the word “bubble” here, but most of these configurations can also be obtained using drops. The initial configuration is given by two axisymmetric “separate bubbles”, which we label as “SB”. When these are put in contact by decreasing h, they “jump” into a new configuration, creating axisymmetric “connected bubbles” (“CB”). The instability between these two is labelled as “SB → CB”. By increasing h of a CB configuration with sufficiently large R (depending on θc), one observes that the bubbles separate (“CB → SB”). This instability is also observed in the work of Bohn15 and Fortes et al.16 in the case where the bubbles are confined between two parallel walls. By decreasing h in the CB configuration for any R and θc, the axisymmetry is lost and one observes “tilted bubbles” (“TB”) for θc = 0° and θc = 60°, and a mirror symmetric buckling for θc = 90°. Even if, for θc = 90°, the shape after the transition has characteristic differences, we want to group it with the other tilting instabilities since all of them appear only if the bubbles are under compression, i.e. when Fz > 0. The onset of this tilting is a well-defined instability “CB → TB”, which is also observed in the case of bubbles confined between two parallel walls.15 Bradley et al.14 also conducted Surface Evolver simulations for this problem. The difference with our configuration is that for bubbles confined between two walls the point of instability is always at Fz = 0.15,16 Besides these two known instabilities, pinning the bubbles on frames creates new instabilities for certain parameter ranges of h, R, V and θc, which are reported here for the first time in detail. The article of Frostad et al.12 observed detached bubbles for some experiments. The detached bubbles (DB) are observed by increasing h coming from a CB (“CB → DB”). For this instability to arise, R has to be smaller than a limit value, which depends on θc. For perfectly symmetric systems, this detachment should occur simultaneously on both frames. However, in reality, it typically arises only on one frame, as shown in Fig. 3b or Fig. 4. For θc = 0°, this instability does not exist due to the lack of attractive forces between the bubbles (drops) (forces Fz which are negative). The second new instability is a bubble shifting (“ShB”) away from the CB upon decreasing h, i.e. CB → ShB. There the film between the two bubbles is shifted away from the frame symmetry-axis, while maintaining the mirror symmetry in the xy-mid plane. This instability is observed only for R above a critical value which depends on θc and diverges to infinity when θc goes towards 0°. To analyse these observations in depth, we combine in the following experiments (Section 2.2), theory of Delaunay surfaces (Section 2.3) and Surface Evolver simulations (Section 2.4).Since the bubble volume V and the interfacial tension γ remain constant during one experiment, they provide a natural length and stress scale of the problem. Since they are more readily accessible than the mean curvature H used in Section 2.3, we use them here to normalise all lengths L (such as r, R or h) and forces Fz and Δp by defining
 | (14) |
 | (15) |
 | (16) |
![[p with combining circumflex]](https://www.rsc.org/images/entities/i_char_0070_0302.gif) predicted by Delaunay surfaces, Δp and V in eqn (16) have to be replaced by 2Δ and Ṽ, respectively. In the following, we will work only with the normalised values from eqn (14) and (16), which allows us to provide a coherent picture combining experiments, theory and simulations. We discuss first the forces and pressures arising in the system (Section 3.2) before turning to a more detailed analysis of the shapes and their stability (Section 3.3).
predicted by Delaunay surfaces, Δp and V in eqn (16) have to be replaced by 2Δ and Ṽ, respectively. In the following, we will work only with the normalised values from eqn (14) and (16), which allows us to provide a coherent picture combining experiments, theory and simulations. We discuss first the forces and pressures arising in the system (Section 3.2) before turning to a more detailed analysis of the shapes and their stability (Section 3.3).
3.2 Force and pressure characterisation
This subsection compares forces and pressures obtained by experiments, simulations and theory. In the case of soap bubbles and capillary bridges created by soap films, we measured directly the vertical force component Fz, since it is proportional to the system size and hence large enough to be measured with sufficient precision (Section 2.2). In the case of the bubble/drop configuration, in contrast, we have to work with much smaller systems to be able to neglect gravity. We therefore measure the pressure difference between the bubbles and the surrounding liquid (Section 2.2). It is inversely proportional to the system size and therefore large enough to be measured with sufficient precision.In Fig. 8, the normalised pressure difference Δ is plotted over the normalised distance ĥ between the frames for the three methods (experiments, simulations and theory) and for two contact angles (θc = 0° in Fig. 8a and b and θc = 90° in Fig. 8c and d). In Fig. 9, the normalised force ![[F with combining circumflex]](https://www.rsc.org/images/entities/i_char_0046_0302.gif) z is plotted over the normalised distance ĥ between the frames for the three methods (experiments, simulations and theory) and for two contact angles (θc = 60° in Fig. 9(a and b) and θc = 90° in Fig. 9(c and d)). In both figures, panels (a) and (c) show in detail how the pressure or the force depend on the distance between the frames, indicating the different shapes and transitions via arrows and a colour shading. The sub-panels (b) and (d) plot the pressure- or force-height relationship for different frame radii
z is plotted over the normalised distance ĥ between the frames for the three methods (experiments, simulations and theory) and for two contact angles (θc = 60° in Fig. 9(a and b) and θc = 90° in Fig. 9(c and d)). In both figures, panels (a) and (c) show in detail how the pressure or the force depend on the distance between the frames, indicating the different shapes and transitions via arrows and a colour shading. The sub-panels (b) and (d) plot the pressure- or force-height relationship for different frame radii ![[R with combining circumflex]](https://www.rsc.org/images/entities/i_char_0052_0302.gif) represented by different colours. The theory (solid lines) shows the pressures and forces for all possible Delaunay surfaces which meet the boundary conditions. They are not necessarily physically stable shapes. The simulation and the experiments show only pressures and forces of stable shapes. To give the reader an order of magnitude of the physically measured values of the pressure and forces, a dimensional graph is shown in Section S1 in the ESI.† The measured forces and pressure differences typically are in the range of −0.02 N < Fz < 0.02 N and −50 Pa < Δp < 50 Pa.
represented by different colours. The theory (solid lines) shows the pressures and forces for all possible Delaunay surfaces which meet the boundary conditions. They are not necessarily physically stable shapes. The simulation and the experiments show only pressures and forces of stable shapes. To give the reader an order of magnitude of the physically measured values of the pressure and forces, a dimensional graph is shown in Section S1 in the ESI.† The measured forces and pressure differences typically are in the range of −0.02 N < Fz < 0.02 N and −50 Pa < Δp < 50 Pa.
 | ||
| Fig. 8 Different dimensionless pressure differences Δ are plotted over the dimensionless height ĥ for water drops in silicone oil. For the two figures (a) and (b), the contact angle is θc = 0° and for the figures (c) and (d), the contact angle is θc = 90°. The figures (a) and (c) illustrate the different shapes and the path related to the pressure measurements during one measurement and the figures (b) and (d) show how Δ changes with ĥ for different frame radii . In all figures, experimental data (Exp) are compared to simulations (SE) and to the theory of Delaunay surfaces (DS). In the theoretical curve, spherical (z = 0) and catenoid (Δ = 0) solutions are highlighted with a filled circle and an open triangle, respectively. Pressure jumps are related to bubbles coming into contact SB → CB, a bubble detachment CB → SB for larger frame radii or a bubble frame detachment CB → DB for smaller frame radii. The ShB appears only for Δ < 0. The change in pressure is fairly small and in most cases almost the same as for the axisymmetric solution. Consequently, the shape transition CB ↔ ShB is only observable visually. | ||
 | ||
| Fig. 9 Different normalised force z measurements are plotted over the normalised height ĥ for soap bubbles. In the figures (a) and (b), the contact angle is θc = 60° and in the figures (c) and (d), the contact angle is θc = 90°. The figures (a) and (c) illustrate the different shapes and the path related to the force measurements during one measurement and the figures (b) and (d) show how z changes with ĥ for different frame radii . In all figures, experimental data (Exp) are compared to simulations (SE) and to the theory of Delaunay surfaces (DS). In the theoretical curve, spherical (z = 0) and catenoid (Δ = 0) solutions are highlighted with a filled circle and an open triangle, respectively. Force jumps are related to bubbles coming into contact SB → CB, a bubble detachment for larger frame radii or, a bubble frame detachment for smaller frame radii. The largest radius for which a bubble frame detachment appears depends on θc. The tilt instability appears only if the bubbles are under compression with z > 0. The instability presents a discontinuity in dz/dĥ. | ||
Let us start by considering more closely the pressure–height cycle shown in Fig. 8a in the case of = 0.62 and θc = 0°. By starting at a point of two separated bubbles (SB), the pressure difference Δ remains constant upon decreasing ĥ until the two drops touch each other. One obtains connected bubbles (CB) with the transition SB ↔ CB. Then, Δ increases smoothly by decreasing ĥ. This changes at the tilted bubble shape transition CB ↔ TB, where dΔ/dĥ has a jump. By increasing ĥ, one goes the same way back, i.e. for θc = 0°, the pressure–height cycle has no hysteresis. In Fig. 8b, one observes the influence of different frame radii. The general behaviour remains the same. With increasing , the slope dΔ/dĥ is increasing in absolute values for the CB, but Δ for the SB is decreasing. Δ at CB ↔ TB is increasing with increasing .
An example of a force–height cycle is shown in Fig. 9a in the case of = 0.88 and θc = 60°. This corresponds to a sequence as the one shown in the top row of Fig. 3. Starting at a point with two separated bubbles (SB), the distance ĥ is decreased (going from right to left) until the bubbles touch each other. Since θc > 0°, the bubbles are attractive and there is a jump to negative values of z, corresponding to the transition SB → CB. If the height ĥSB→CB is larger than the height for the minimal force z (for example the curves in Fig. 9b for = 0.88 and = 1.39), further approaching the frames leads to a decrease in the force z, reaching the minimum, and then an increase in forces. In the case where the height ĥSB→CB is smaller than the height for the minimal force z (for example in Fig. 9b for = 0.45 and = 0.17), the force z, further approaching the frames, leads only to an increase in z. Whether the SB → CB is reached before or after the minimum depends on . However, at this stage, we lack a physical interpretation for this observation. In both cases, an axisymmetric shape is maintained reaching positive values of z. When a critical distance is reached, the axisymmetry is broken leading to the tilted bubble state (TB) via the tilt instability (CB ↔ TB). This corresponds to a second order shape transition, since z is continuous during the instability in experiments and simulations (i.e. the first derivative of the energy with respect to ĥ is continuous) (Fig. 9). Only the slope of z changes at this point. This tilting instability cannot be described by the Delaunay theory. In the TB, the tilting angle φ increases with decreasing ĥ (see Fig. 4 and11) and dz/dĥ changes. The tilting increases until the contact film touches the frame boundaries. In this case, the deformation often becomes irreversible due to the pinning of the soap film on the frame geometry. That is why before reaching this point, we increase ĥ again (withdrawing the frames from each other). The system follows again the TB and CB branch moving back into negative z which reaches a minimum before increasing again. In the case of attractive bubbles (θc > 0°), we observe a hysteresis, i.e. we have access to stable CB shapes at distances ĥ larger than the first contact height. Upon increasing ĥ further, the bubbles detach from each other (CB → SB) and the force vanishes, z = 0. We have therefore returned to the initial configuration and can start another cycle. Depending on θc and , the final instability can also evolve towards a bubble detachment from the frame (CB → DB), as shown in the bottom sequence of Fig. 3. The overall shape of the z(ĥ) curve depends on . Different examples are plotted in Fig. 9b. They show that with increasing the distance ĥ for a CB → SB decreases and the minimal and maximal z increase in absolute values. Catenoid shapes appear for larger frame radii as well.
A very similar cycle is obtained for the capillary bridge with θc = 90° shown in Fig. 8c and d and 9c and d. Detailed examples of these cycles are given in Fig. 8c for Δ(ĥ) and in Fig. 9c for z(ĥ). Let us consider first the cycle of Fig. 9c with = 0.17: we start with two separated bubbles (SB) and decrease ĥ (approaching frames). When the two bubbles touch each other, we observe the instability SB → CB. In this case, the film between the two bubbles may break and one obtains a capillary bridge. (Since it is difficult to control if the film breaks or remains intact, we often started directly with the capillary bridge by starting with ĥ = 0.) Continuing approaching the frames, we observe again the instability CB → TB, which looks in this case more like a shifting, see Fig. 4. Then, we increase ĥ again (withdrawing the frames from each other). The system follows again the TB and CB branch moving back into negative z. Depending on , one observes a CB → SB, or, as in the case of Fig. 9c, a CB → DB instability. A hysteresis would also be possible between the DB and the CB, but is rarely observed in experiments since the DB configuration is often unstable due to gravity.
The pressure–height cycle in Fig. 8c corresponds to a of 1.17. This is a regime where experiments and simulations can differ in their shape transitions, since in the experiment the boundary conditions are never as perfectly axisymmetric as in the simulations and the energies of the shapes ShB and CB are in this regime very close to each other. Consequently, we observe a SB → ShB in the experiment and a SB → CB in the simulation. This adds for the experiment two times the shape transition CB ↔ ShB for the approaching-withdrawing cycle. The simulation shows the same behavior for larger . The rest of the cycle is similar to the cycle shown in Fig. 9a.
With the increasing , the minimum of Δ(ĥ) decreases and also reaches zero and negative values (see Fig. 8d). The Δ(ĥ) range for one approaching-withdrawing cycle decreases with decreasing (see Fig. 8d).
3.3 Shape instabilities and shape diagrams
In what follows, we discuss in more detail the different instabilities that occur during the approaching-withdrawing cycles. For a given bubble volume, the equilibrium forms are characterised by the two scaled parameters ĥ (scaled distance between frames) and (scaled frame radius) and by the contact angle θc. In principle, θc can vary continuously from 0° to 90°. Theoretically and numerically, this is not difficult. Experimentally, we have only studied the cases of θc = 0°, 60° and 90°, but it is possible to access other angles by tuning the effective interfacial tension of the different interfaces. It is therefore interesting to discuss in a general manner the different states of the system in the phase space θc–ĥ–. The instabilities are then given by surfaces (f(θc,ĥ,) = Cte) whose traces we can observe experimentally in the planes θc = 0°, 60° and 90°. We plot the shape diagrams for these three cases in Fig. 10 and discuss in detail the different shape transitions, given again by experiments, simulations and (in most cases) theory.
 | ||
| Fig. 10 Three shape diagrams for the ĥ–-plane corresponding to different contact angles θc for (a) two soap bubbles (θc = 60°), (b) capillary bridges (θc = 90°) and (c) two bubbles or drops in a liquid (θc = 0°). The solid lines are shape transitions predicted by the theory of Delaunay surfaces, and the dotted dashed lines are shape transitions obtained with help of Surface Evolver. The dotted lines are special Delaunay surfaces: blue, spherical caps which touch each other in one point (z = 0); red, spherical double truncated surfaces in contact (z = 0); magenta, catenoid surfaces (Δ = 0). The different colors of the experimental points refer to the different phase transitions and show at which point the respective phase transition was observed in the experiment. In the yellow area, the surface is a connected bubble (CB). In the blue area, one observes separated bubbles (SB), in the green area detached bubbles (DB), in the red area tilted bubbles (TB) and in the magenta area shifted bubbles (ShB). The blue yellow and the blue magenta patterned areas symbolize the history dependence of the shape. If one comes from a completely blue area, the shape will be a SB. If one comes from a completely yellow or magenta area, the shape will be a CB or a ShB. | ||
z increases and crosses zero. At this crossing, the corresponding shape is composed of double truncated spheres (see Fig. 9 and the red dotted line in Fig. 10). However, this time the bubbles are fully connected, i.e. this point is always reached at a distance ĥ ≤ ĥSB→CB. For even smaller ĥ, z becomes positive and the axisymmetric solutions are parts of nodoids. At a specific ĥCB↔TB, depending on and θc, the axisymmetry is broken and the film between the two bubbles begins to tilt in a random direction (CB ↔ TB in Fig. 9 and the red dash dotted line in Fig. 10). The force measurements do not show a jump this time (as for the SB → CB, the CB → DB or the CB → SB (see below) instabilities). Instead, one observes merely a change in slope (Fig. 8 and 9), as discussed in Section 3.2.
We determined the point of instability numerically, with help of the eigenvalues of the Hessian matrix in Surface Evolver and experimentally by direct visualisation. One eigenvalue has to cross zero for a shape transition, as shown in Sections S5 and S6 in the ESI.† The shape diagrams in Fig. 10 show the experimental points for the CB ↔ TB with red crosses and the simulated points as a red dash-dotted line, as already mentioned above. All simulated and almost all experimental points are on the left side of z = 0 (the red dotted line in Fig. 10). It follows that z > 0 when the tilt instability occurs. The difference between the simulation and the experiments is due to geometric inaccuracies in the experiments and the difficulty to determine precisely a rather smooth shape transition.
In contrast to the case of two bubbles confined between parallel plates,14–16 some nodoids are stable when the bubbles are pinned on frames. In the case of two bubbles between plates, the spherical solution can always be rotated and shifted in a manner that, for smaller distances between the plates h, the surface (and hence the surface energy) remains the same.16 This is not possible for pinned bubbles, where the pinning adds an energy barrier for a shift of the contact area between the bubble and the frame. That is why the CB ↔ TB appears only for z > 0 and the contact film between two tilted, pinned bubbles in contact is not flat, as discussed in more detail in Section 3.4.
. When > Tr1(θc), an instability is observed where the two bubbles detach from each other (bubble–bubble detachment CB → SB in Fig. 8 and 9, the blue solid line in Fig. 10). When ≤ Tr1(θc), we observe an instability where the bubbles detach from the frame (bubble–frame detachment CB → DB in Fig. 8 and 9, and the green solid line in Fig. 10). In theory, the detachment should occur from both frames simultaneously. However, in the experiment, it occurs always from the upper frame because of gravity. The value of Tr1(θc) has been obtained both numerically and theoretically (see Section S3 in the ESI†) and corresponds to a triple point in the phase diagram ĥ– for a given θc (crossing point of green and blue solid lines in Fig. 10). The values for the Tr1 and ĥTr1 of these triple points are listed in Table 1. The points are part of a triple line in the θc–ĥ– space.
–ĥ–θc shape space, where three shape configurations meet. We call them triple points. There are two triple points, Tr1 between CB, SB and DB and Tr2 between CB, SB and ShB. The points are listed for θc = 0°, θc = 60° and θc = 90°. For Tr1 with 0° < θc < 90°, the point is not well defined, and this one observes a jump in ĥ. It is predicted by the theory and validated by the simulation. For θc = 60°, the jump is too small to be measurable in experiments. For more information, see Section S3 in the ESI
| Tr1 | Tr2 | |||
|---|---|---|---|---|
| θ c |
|
ĥ |
|
ĥ |
| 0° | 0.0 | 2.4814 | ||
| 60° | 0.1782 ± 0.0001 | 3.48 ± 0.01 | 1.91 ± 0.01 | 0.939 ± 0.005 |
| 90° | 0.632 ± 0.005 | 2.69 ± 0.02 | 1.70 ± 0.01 | 1.27 ± 0.01 |
The bubble–bubble detachment instability CB → SB is observed when the theory of Delaunay surfaces predicts the maximal distance ĥ, corresponding to the point where the compressibility ∂ĥ/∂z of the system changes sign. We obtained this point numerically by converging the function ĥ(z) to a maximum. The point of instability for both, the simulation and the experiment, agrees within the uncertainties (see Fig. 8 and 9 CB → SB, and Fig. 10 (blue solid line)). If one moves the frames up and down, exceeding the height where the CB → SB occurs and going below the height of the simple truncated spherical solution (SB → CB), one obtains a hysteresis already discussed in Section 3.2 and shown in Fig. 10 by the zone with blue and yellow stripes. By observation we found out that the bubble–frame detachment CB → DB always occurs when ![[r with combining circumflex]](https://www.rsc.org/images/entities/i_char_0072_0302.gif) ,ẑ(±0.5ĥ) = 0, which corresponds to a vertical interface at the frame. For the case of a cylindrical capillary bridge (the green dotted line in Fig. 10b), this is always the case. The cylindrical capillary bridge becomes unstable at ĥ = 2π with = 0.4662 (where the green dotted line and the green solid line meet each other in Fig. 10b). This cylinder height is also known as the critical length of the Rayleigh instability for capillary bridges after which the surface is physically unstable.25 It is also the ĥ of one period of the Delaunay surface with z = −0.25, i.e. ω1 − ω0 = π. Unduloids are also unstable with respect to small fluctuations, if they exceed one period.26,27 The solid green line in Fig. 10b shows the function (ĥ) for one period of a Delaunay surface for all z < 0, if one starts at an extremum of the profile (ẑ). Since there is always a maximum and a minimum in the profile (ẑ) (except for the cylinder), one finds two solutions for one ĥ, one with a smaller (the lower branch) and one with a larger (the upper branch). Theoretically also all other in between the upper and lower branches are possible shapes. But they are not mirror symmetric to the xy-plane. All of these shapes are already physically unstable. The upper and lower branches meet each other at the cylindrical shape of one period (the shortest unstable cylinder).
,ẑ(±0.5ĥ) = 0, which corresponds to a vertical interface at the frame. For the case of a cylindrical capillary bridge (the green dotted line in Fig. 10b), this is always the case. The cylindrical capillary bridge becomes unstable at ĥ = 2π with = 0.4662 (where the green dotted line and the green solid line meet each other in Fig. 10b). This cylinder height is also known as the critical length of the Rayleigh instability for capillary bridges after which the surface is physically unstable.25 It is also the ĥ of one period of the Delaunay surface with z = −0.25, i.e. ω1 − ω0 = π. Unduloids are also unstable with respect to small fluctuations, if they exceed one period.26,27 The solid green line in Fig. 10b shows the function (ĥ) for one period of a Delaunay surface for all z < 0, if one starts at an extremum of the profile (ẑ). Since there is always a maximum and a minimum in the profile (ẑ) (except for the cylinder), one finds two solutions for one ĥ, one with a smaller (the lower branch) and one with a larger (the upper branch). Theoretically also all other in between the upper and lower branches are possible shapes. But they are not mirror symmetric to the xy-plane. All of these shapes are already physically unstable. The upper and lower branches meet each other at the cylindrical shape of one period (the shortest unstable cylinder).
Since in experiments all frames have a finite rim thickness, the upper and lower pinning positions are not necessarily the same, giving rise to Delaunay surfaces without mirror symmetry. They occur only if this configuration has less surface area for the same ĥ in comparison to the mirror symmetric solution and if ,ẑ(ĥ/2) and ,ẑ(−ĥ/2) do not have the same sign. This is, for instance, the case for a soap film capillary bridge close to a cylindrical solution (see Fig. 10b). Experimentally, we occasionally observed some Delaunay surfaces which lost their mirror symmetry in the xy-plane for θc = 90°, as shown in Section S7 in the ESI.†
The solid green line in Fig. 10a represents shapes with z < 0, ,ẑ(±ĥ/2) = 0 and |ω1 − ω0| > π for θc = 60°. Basically, they are the same surfaces as for θc = 90° only a little longer due to the change in contact angles. The upper branch is folded to the right side (as shown in Section S3 in the ESI†) due to the change in contact angle θc. The solid green line corresponds to the theoretical prediction for the CB → DB. Beyond this line (the line included), all shapes are again physically unstable. The experimental measurements for both contact angles show good agreement with this prediction.
For θc = 0°, the CB → DB does not exist since there are no attractive forces between the bubbles. Consequently, there are no unduloids fulfilling all boundary conditions. Section S3 in the ESI† discusses also the other contact angles θc in more detail.
, θc and ĥ, the pressure difference Δ between the inside and the outside of the bubbles can become zero and negative. On the magenta dotted line, Δ = 0, and above the magenta dotted line, Δ < 0, as shown in Fig. 10a and b. If Δ = 0, the surface is part of a catenoid. The only axisymmetric constant mean curvature surfaces with Δ < 0 are nodoids, as discussed in Section 2. Some of them are unstable against non-axisymmetric perturbation, as in the case for the TB. In this case, the film between the two bubbles is shifted away from the frame axis as shown in the ShB examples of Fig. 4. The mirror symmetry to the mid-plane remains, as in the case for the TB with θc = 90°. However, here the contact film for two bubbles remains horizontal and flat. We can identify a critical frame radius Tr2 such that: if ≤ Tr2, we go from CB ↔ ShB and back from ShB ↔ CB before we obtain a CB → SB. If ≥ Tr2, we go from CB ↔ ShB and then directly to ShB → SB. Therefore, Tr2 represents the triple points where the dash dotted magenta line and the solid blue line meet each other in the shape diagrams in Fig. 10 and the triple line for the same shapes in the θc––ĥ-space. The numerically obtained values of Tr2 and ĥTr2 are found in Table 1. The theoretical prediction for the CB → SB starts to be wrong at the Tr2 line. Simulations are therefore necessary to obtain the real point of detachment.
The last stable catenoid is the point in Fig. 10 where the dotted magenta line (for catenoids) and the blue solid line (CB → SB) are tangential to each other. Starting from this point, all catenoid solutions in the clockwise direction of the magenta dotted line are stable, while those in the counter clockwise direction are unstable. This is fundamentally different from the stable catenoid solution without a volume constraint.28,29
3.4 Shape of the tilted film
As already mentioned, the contact film between the two bubbles is a minimal surface. This remains also the case if the bubbles have a TB shape. The TB maintains a point symmetry to the origin with| (ψ) = (ψ + π) | (17) |
| ẑ(ψ,) = −ẑ(ψ + π,), | (18) |
 | ||
| Fig. 11 Left: Two bubbles in the tilted bubble configuration (TB) simulated with Surface Evolver with θc = 60° (with the tilt angle φ). The upper part shows a zoom of the tilted film in the rotated coordinate system x′y′z′ to illustrate the three-fold symmetry of the film. The change in z′ is small compared to . Right: Example of a “Karcher tower”, a known three-fold minimal surface. | ||
4 Conclusions
In this article, we investigated the shape, stability and mechanical properties of two interacting bubbles or drops pinned on parallel, circular frames. These include capillary bridges, which may be considered as two bubbles (drops) separated by a film of zero surface energy.In contrast to some previously investigated cases of bubbles or drops interacting between two parallel plates,15,27 the constraints imposed by pinning create complex shape spaces separated by different types of instabilities. We investigate here in detail the force/pressure–shape–deformation relation using control parameters such as the volume V of the bubbles (drops), the radius R of the circular frames, the distance h between the frames, and the contact angle θc between the bubbles (drops). Whenever the surfaces are axisymmetric, we combine experiments and computer simulations (Surface Evolver24) with the Delaunay theory of constant mean curvature surfaces.17 In all cases, experiments, simulations and theory show very good agreement, generally within the experimental/numerical errors. In the case of non-axisymmetric surfaces (TB and ShB), for which no analytical theory exists to our knowledge, we have limited ourselves to a comparison between experiments and numerical simulations. Once again, the agreement is very good and within the experimental and numerical errors.
As shown in Fig. 2 and 10, we found five different types of physically stable shapes characterised by different force/pressure–deformation relation: connected bubbles (CB), separated bubbles (SB), detached bubbles (DB), tilted bubbles (TB) and shifted bubbles (ShB). The system moves between these shapes through approaching and withdrawing the frames from each other, passing through different types of instabilities which are discussed in detail in Section 3. The theory of Delaunay surfaces explains three types of shapes and the instabilities between them. To the best of our knowledge, it is the first time that DB and ShB – and the associated instabilities – are mentioned and investigated. ShB only exist for bubbles (drops) pinned on frames and not for bubbles (drops) interacting between parallel plates. The TB, CB and SB are also observed for bubbles (drops) interacting between parallel plates,15,16 but the detailed behaviour is different. For example, for the case of the instability CB ↔ TB, which was already known from previous investigations between parallel plates,14–16 we show that the bubbles (drops) remain stable at higher compression (z > 0) if they are pinned on frames. We show that this instability can be described as a second order shape transition (Section S6, ESI†) and that the tilted film becomes undulated with a three-fold symmetry (Section 3.4). Future work will establish the theoretical prediction of this instability and the associated film shapes.
While we concentrated on three different contact angles θc = 0°, 60°, and 90° between the bubbles (drops) for practical reasons, our calculations include naturally the intermediate contact angles, which are of increasing interest for communities working on adhesive foams or emulsions.31–33
The significance of the provided shape and force/pressure diagrams extends far beyond mere curiosity. Bubbles or drops in contact held by frames are increasingly used to quantify the highly non-local interactions between bubbles (drops). Our work can therefore be used to cleanly design and analyse experiments which investigate bubble or drop interactions.
While the presented investigations explore interactions between “simple” bubbles (drops) of the constant interfacial tension, future investigations will extend this work to interactions between bubbles (drops) with complex interfacial properties, including the presence of interfacial elasticity.
Author contributions
Friedrich Walzel: designed the analysis, developed and built the in-house instrument, conducted the experiments, performed the simulations and theoretical analysis, interpreted the observations, wrote the manuscript, proofread the manuscript, and acquired the funding. Jonathan Dijoux: developed and built the in-house instrument and proofread the manuscript. Leandro Jacomine: developed and built the in-house instrument and proofread the manuscript. Elodie Harle: conducted experiments and proofread the manuscript. Pierre Muller: interpreted the observations, wrote the manuscript, and proofread the manuscript. Thierry Charitat: designed the analysis, interpreted the observations, wrote the manuscript, proofread the manuscript, and acquired the funding. Wiebke Drenckhan: designed the analysis, interpreted the observations, wrote the manuscript, proofread the manuscript, and acquired the funding.Data availability
In the online repertoire, https://zenodo.org/uploads/13142081, you can find the most important python functions for the analysis, a Surface Evolver example and some data for the bubble and drop experiments with the corresponding force and pressure measurements. Not all data have been uploaded as this would take up too much data volume. We are also happy to provide other examples upon request.Conflicts of interest
There are no conflicts to declare.Acknowledgements
The authors thank Damien Favier for numerous discussions and precious technical help. Jean Farago, Aurelie Hourlier-Fargette, Felix Kratz, Jan Kierfeld and Reinhard Hohler are also warmly thanked for regular stimulating exchanges on the matter. Jeremie Sanchez is thanked for his help with the Labview coding. We thank TECLIS for lending us their “Double bubble device” and for a dynamic collaboration on technical aspects of this project. This work has been financed by a scholarship from the Doctoral School ED182, combined with an ERC Consolidator Grant (agreement 819511 METAFOAM). It was conducted in the framework of the Interdisciplinary Institute HiFunMat, as part of the ITI 20212028 program of the University of Strasbourg, CNRS and Inserm, was supported by IdEx Unistra (ANR-10-IDEX-0002) and SFRI (STRATUS project, ANR-20-SFRI-0012) under the framework of the French Investments for the Future Program.Notes and references
- R. Hohler and S. Cohen-Addad, Soft Matter, 2017, 13, 1371–1383 RSC.
- R. Höhler and D. Weaire, Adv. Colloid Interface Sci., 2019, 263, 19–37 CrossRef PubMed.
- G. Ginot, R. Höhler, S. Mariot, A. Kraynik and W. Drenckhan, Soft Matter, 2019, 15, 4570–4582 RSC.
- Y. Rotenberg, L. Boruvka and A. Neumann, J. Colloid Interface Sci., 1983, 93, 169–183 CrossRef.
- J. D. Berry, M. J. Neeson, R. R. Dagastine, D. Y. Chan and R. F. Tabor, J. Colloid Interface Sci., 2015, 454, 226–237 CrossRef PubMed.
- F. S. Kratz and J. Kierfeld, J. Chem. Phys., 2020, 153, 094102 CrossRef PubMed.
- D. Y. Chan, E. Klaseboer and R. Manica, Soft Matter, 2011, 7, 2235–2264 RSC.
- R. Han, S. Li, A. Zhang and Q. Wang, Phys. Fluids, 2016, 28, 062104 CrossRef.
- H.-H.-Q. Dinh, E. Santanach-Carreras, M. Lalanne-Aulet, V. Schmitt, P. Panizza and F. Lequeux, Langmuir, 2021, 37, 8726–8737 CrossRef CAS PubMed.
- T. Morokuma and Y. Utaka, Int. J. Heat Mass Transfer, 2016, 98, 96–107 CrossRef CAS.
- R. F. Tabor, H. Lockie, D. Mair, R. Manica, D. Y. C. Chan, F. Grieser and R. R. Dagastine, J. Phys. Chem. Lett., 2011, 2, 961–965 CrossRef CAS.
- J. M. Frostad, M. C. Collins and L. G. Leal, Langmuir, 2013, 29, 4715–4725 CrossRef CAS PubMed.
- K. Li, W. Wang, F. Xiao, Y. Ge, H. Jin, Z. Yu, J. Gong, W. Gao and Z. Peng, Langmuir, 2021, 37, 6830–6837 CrossRef CAS PubMed.
- G. Bradley and D. Weaire, Comput. Sci. Eng., 2001, 3, 16–21 CrossRef CAS.
- S. Bohn, Eur. Phys. J. E: Soft Matter Biol. Phys., 2003, 11, 177–189 CrossRef CAS PubMed.
- M. A. Fortes, M. E. Rosa, M. F. Vaz and P. I. Teixeira, Eur. Phys. J. E: Soft Matter Biol. Phys., 2004, 15, 395–406 CrossRef CAS PubMed.
- C. Delaunay, J. Math. Pures Appl., 1841, 6, 309–315 Search PubMed.
- K. Kenmotsu, Surfaces with constant mean curvature, American Mathematical Soc., 2003 Search PubMed.
- D. H. R. Courant, The Calculus of Variations, John Wiley & Sons, Ltd, 1989, ch. 4, pp. 164–274 Search PubMed.
- B. G. Chen and R. D. Kamien, Eur. Phys. J. E: Soft Matter Biol. Phys., 2009, 28, 315–329 CrossRef CAS.
- B. Athukorallage, T. Paragoda and M. Toda, Surv. Math. Math. Sci., 2014, 4, 1–20 Search PubMed.
- L. Salkin, A. Schmit, P. Panizza and L. Courbin, Am. J. Phys., 2014, 82, 839–847 CrossRef CAS.
- U. Dierkes, S. Hildebrandt, F. Sauvigny, U. Dierkes, S. Hildebrandt and F. Sauvigny, Minimal surfaces, Springer, 2010 Search PubMed.
- K. Brakke, Exper. Math., 1992, 1, 141–165 CrossRef.
- X. Zhang, R. S. Padgett and O. A. Basaran, J. Fluid Mech., 1996, 329, 207–245 CrossRef CAS.
- R. Gillette and D. Dyson, Chem. Eng. J., 1971, 2, 44–54 CrossRef CAS.
- T. I. Vogel, SIAM J. Appl. Math., 1987, 47, 516–525 CrossRef.
- M. A. Erle, R. Gillette and D. Dyson, Chem. Eng. J., 1970, 1, 97–109 CrossRef.
- F. Walzel, A. Requier, K. Boschi, J. Farago, P. Fuchs, F. Thalmann, W. Drenckhan, P. Muller and T. Charitat, Phys. Rev. E, 2022, 106, 014803 CrossRef CAS.
- H. Karcher, Manuscripta Math., 1988, 62, 83–114 CrossRef.
- S. Cox, A. Kraynik, D. Weaire and S. Hutzler, Soft Matter, 2018, 14, 5922–5929 RSC.
- J. Bibette, T. Mason, H. Gang, D. Weitz and P. Poulin, Langmuir, 1993, 9, 3352–3356 CrossRef.
- D. Filip, V. Uricanu, M. H. Duits, D. Van den Ende, J. Mellema, W. Agterof and F. Mugele, Langmuir, 2006, 22, 560–574 CrossRef PubMed.
Footnote |
| † Electronic supplementary information (ESI) available. See DOI: https://doi.org/10.1039/d4sm00919c |
| This journal is © The Royal Society of Chemistry 2024 |