 Open Access Article
Creative Commons Attribution 3.0 Unported Licence
Elasto-inertial instabilities in the merging flow of viscoelastic fluids†
Mahmud Kamal
Raihan
 a,
Nayoung
Kim
a,
Yongxin
Song
a,
Nayoung
Kim
a,
Yongxin
Song
 *b and
Xiangchun
Xuan
 *a
*a
aDepartment of Mechanical Engineering, Clemson University, Clemson, SC 29634-0921, USA. E-mail: xcxuan@clemson.edu
bCollege of Marine Engineering, Dalian Maritime University, Dalian 116026, P. R. China. E-mail: yongxin@dlmu.edu.cn
First published on 16th July 2024
Abstract
Many engineering and natural phenomena involve the merging of two fluid streams through a T-junction. Previous studies of such merging flows have been focused primarily upon Newtonian fluids. We observed in our recent experiment with five different polymer solutions a direct change from an undisturbed to either a steady vortical or unsteady three-dimensional flow at the T-junction with increasing inertia. The transition state(s) in between these two types of merging flow patterns is, however, yet to be known. We present here a systematic experimental study of the merging flow of polyethylene oxide (PEO) solutions with varying polymer concentrations and molecular weights. Two new paths of flow development are identified with the increase of Reynolds number: one is the transition in very weakly viscoelastic fluids first to steady vortical flow and then to a juxtaposition state with an unsteady elastic eddy zone in the middle and a steady inertial vortex on each side, and the other is the transition in weakly viscoelastic fluids first to a steady vortical and/or a juxtaposition state and then to a fully unsteady flow. Interestingly, the threshold Reynolds number for the onset of elastic instabilities in the merging flow is not a monotonic function of the elasticity number, but instead follows a power-law dependence on the polymer concentration relative to its overlap value. Such a dependence turns out qualitatively consistent with the prediction of the McKinley–Pakdel criterion.
1. Introduction
Viscoelastic polymer flows in microchannels are relevant in many fields such as oil recovery,1,2 groundwater remediation,3,4 blood characterization,5 lab-on-a-chip applications,6–10etc. Numerous studies have been conducted in the past two decades to understand the elasto-inertial instabilities in these flows.11–15 Many of them have been focused on flow fields with embedded re-entrant corners and/or stagnation points because they are profound at inducing elastic stresses and in turn instabilities.16–33 A T-shaped junction is one such structure with a stagnation point pinned along the straight edge as well as two re-entrant corners on the bending edges. It has been frequently used for sample mixing34,35 and sheath-focused particle/cell sorting,36–39 where the incoming flows enter through the two side branches and merge in the main branch of a T-shaped microchannel (named as merging flow hereafter). The success of either of these microfluidic operations relies on a comprehensive understanding of the merging flow behavior at the T-junction. To date, however, most of the studies on this topic in the literature have been focused upon Newtonian fluids.40–49 There are only a limited number of reports on how the fluid rheological properties may affect the merging flow of non-Newtonian fluids.Perera and Walters50 predicted a reduced pressure drop in the merging flow of an elastic fluid as compared to a Newtonian fluid. Nishimura et al.51 observed secondary circulations in the merging flow of polyacrylamide (PAA) solution at the upstream sides of the re-entrant corners. Poole et al. predicted that fluid shear thinning either promotes or inhibits the bifurcation to asymmetric merging flow52 while fluid elasticity draws flow instabilities at a lower Reynolds number than in a Newtonian fluid.53 Soulages et al.54 reported a direct transition of steady symmetric polyethylene oxide (PEO) flow to three-dimensional unsteady flow in a T-shaped microchannel at increasing Weissenberg number. Their observation agrees qualitatively with numerical simulation based on the simplified Phan–Thien–Tanner model. In a recent study our group investigated the effects of fluid rheological properties on the merging flow of five types of polymer solutions including polyvinylpyrrolidone (PVP), xanthan gum (XG), hyaluronic acid (HA), PEO and PAA.55 We observed in these solutions a direct switch from an undisturbed flow to either a steady vortical or an unsteady three-dimensional flow near the stagnation point of the T-junction with the increase of Reynolds number, depending on the strength of fluid elasticity and/or shear thinning. The transition state in between these two types of merging flow patterns is, however, still unknown.
This work is aimed to fill the knowledge gap through a systematic experimental study of the merging flow of viscoelastic PEO solutions through a planar T-shaped microchannel. By varying either the concentration or molecular weight of the polymer,56,57 we can achieve a span of the fluid elasticity number over three orders of magnitude. We also vary the flow rate in each of the tested PEO solutions and achieve a span of both the Reynolds and Weissenberg numbers over two orders of magnitude. These wide ranges of parameters enable us to observe a full transition from the fluid inertia-induced vortical flow to the fluid elasticity-induced unsteady flow at the T-junction. We analyze the flow field images and compare the experimental data in dimensionless parameter spaces for a unified understanding.
2. Experiment
2.1. Materials
The T-shaped microchannel used in our recent study55 was reused here providing the basis for a domain independent comparison of the results from the two projects. It was fabricated with polydimethylsiloxane (PDMS) using the standard soft lithography technique. The channel has an average depth of 50 μm with two 100 μm wide side branches of 8 mm long each and one 200 μm wide main branch of 10 mm long. We used neutrally charged and flexibly chained PEO (Sigma Aldrich) as our model polymer to prepare the viscoelastic solutions in deionized water (Thermo Fisher Scientific) for their well characterized properties in numerous previous works.6–8,16,58,59 We chose 100 ppm PEO solution with 1 MDa molecular weight as the reference fluid. To investigate the polymer effect, we altered the concentration of PEO from 10 to 500 ppm or the average molecular weight of PEO from 0.3 to 8 MDa (nominal values as per the company). The PEO-free deionized water was also tested as a control experiment. The rheological properties of the prepared PEO solutions are summarized in Table 1. The overlap concentration, c*, was obtained from the relationship,60c* = 1/[η], where [η] = 0.072 Mw0.65 is the intrinsic viscosity with Mw being the molecular weight of PEO polymer. All the PEO solutions have a small relative concentration, c/c*, indicating to solutions being in their respective dilution regimes. Under this notion, their dynamic viscosities can be assumed to be shear independent and scale linearly with the relative polymer concentration,60| η = ηs(1 + c/c*) | (1) |
| λ ∝ [η]Mw(c/c*)0.65 ∝ c0.65Mw2.0725 | (2) |
| M w (MDa) | c (ppm) | c* (ppm) | η (mPa s) | λ (ms) | El | |
|---|---|---|---|---|---|---|
| 0.3 | 100 | 3820 | 0.0340 | 1.03 | 0.00658 | 0.00085 |
| 0.6 | 100 | 2440 | 0.0533 | 1.05 | 0.0277 | 0.0036 |
| 1 | 10 | 1750 | 0.00743 | 1.01 | 0.0179 | 0.0023 |
| 30 | 0.0223 | 1.02 | 0.0365 | 0.0047 | ||
| 50 | 0.0371 | 1.04 | 0.0509 | 0.0066 | ||
| 100 | 0.0743 | 1.07 | 0.0798 | 0.011 | ||
| 200 | 0.149 | 1.15 | 0.125 | 0.018 | ||
| 300 | 0.223 | 1.22 | 0.163 | 0.025 | ||
| 400 | 0.297 | 1.30 | 0.197 | 0.032 | ||
| 500 | 0.371 | 1.37 | 0.227 | 0.039 | ||
| 2 | 100 | 1110 | 0.117 | 1.12 | 0.336 | 0.047 |
| 4 | 100 | 710 | 0.183 | 1.18 | 1.41 | 0.21 |
| 8 | 100 | 453 | 0.287 | 1.29 | 5.94 | 0.96 |
2.2. Methods
The flow pattern at the T-junction of the microchannel was visualized by seeding 1 μm diameter fluorescent polystyrene particles (Bangs Laboratories) at a concentration of 0.05% solid content into each of the prepared solutions. The particle suspension was driven through the microchannel from the two side branches by two identical syringe pumps (KD Scientific, Holliston, MA, USA) at equal flow rates. The streakline images of tracer particles were recorded using an inverted fluorescent microscope (Nikon Eclipse TE2000U) equipped with a CCD camera (Nikon DS-Qi1Mc) at a rate of 10–15 frames per second. The obtained images were processed using the Nikon imaging software (NIS-Elements AR 3.22). The effect of fluid inertia on the merging flow dynamics at the T-junction is characterized by the Reynolds number, | (3) |
 | (4) |
 is the characteristic shear rate across the width of the main branch. The relative impact of the fluid elastic to inertial effect is measured by the elasticity number,
 | (5) |
3. Results and discussion
3.1. Experimental images
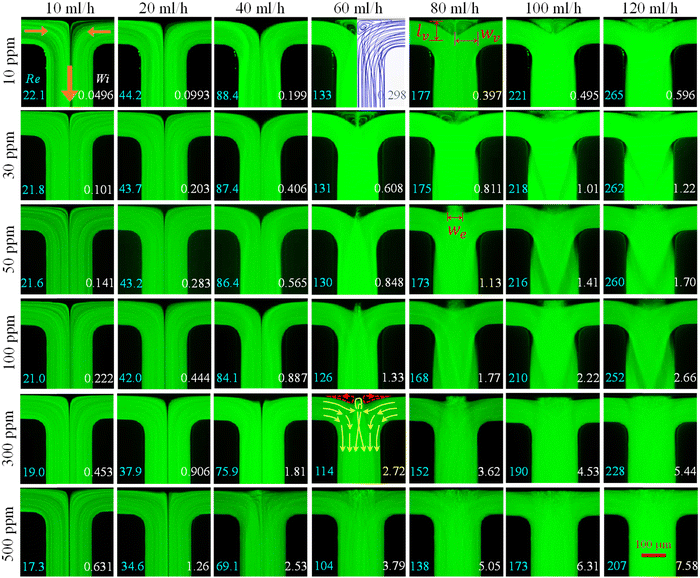
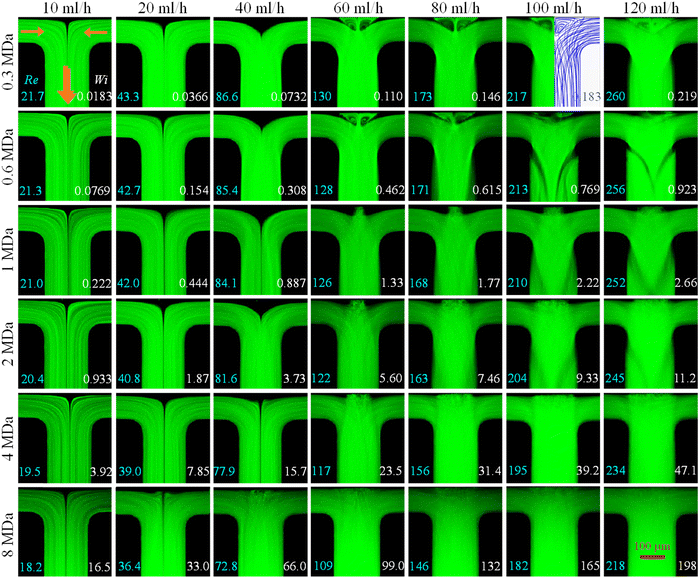
In 30 ppm PEO solution, however, increasing the flow rate to 90 mL h−1 (Re = 197 and Wi = 0.913) causes the streamlines near the cusp of inflow attachment to diverge unsteadily inwards the circulating zone. This deviation from the inertial feature signifies the impact of fluid elasticity because the free stagnant point at the cusp is the most promiscuous location for any elasticity induced breaking of stability to begin with.11,12,15 Such an elasto-inertial instability occurs at 70 mL h−1 (Re = 151, data not shown in Fig. 1) in the more viscoelastic 50 ppm PEO solution, whereas the solutions with 100 ppm and above up to 300 ppm PEO encounter this state at even lower flow rates due to their increasingly stronger elasticity (see the increasing values of El in Table 1). The divergent streamlines in these PEO solutions become intense enough with the increasing flow rate to extend till the top wall, separating the contact between the inertial circulations. As a result, there exists a juxtaposition of an unsteady elastic eddy zone near the free stagnation point of the cusp and a steady inertial vortex on its each side in 50–300 ppm PEO solutions, which has not been reported in the literature on merging flows. Real-time videos of the streaklines of tracer particles in these solutions at the flow rate of 60 mL h−1 are available in the ESI.†
The elastic eddy zone becomes wider with the increasing inertia and gradually suppresses the inertial vortices on either side. A transition to (nearly) full suppression is observed in 300 ppm PEO solution at 120 mL h−1 (Re = 228), while 50–200 ppm PEO solutions all remain in the juxtaposition state till the highest tested flow rate. In contrast, 400 ppm and 500 ppm PEO solutions each show a transition from the undisturbed to juxtaposition state at 20 mL h−1 without going through the steady vortical flow and subsequently to a fully unsteady flow. The overlaying irregular streamlines at the T-junction only get accentuated without changing fundamentally in time fluctuations and spatial dimensions as the flow rate is increased. This unsteady regime at Re ≥ 34.6 signifies the combined effect of fluid elasticity and inertia. Such a phenomenon is different from the observation in 1000 ppm/2 MDa PEO solution (El = 0.37) in our recent study,55 where the state of unsteady flow starts at a much smaller Re = 4.18, way before the fluid inertia plays a significant role. This variation should be attributed to the much weaker elasticity of the fluids tested here (e.g., El = 0.039 for the PEO solution with the highest concentration of 500 ppm).
It is noted that the elasto-inertial instability in the 100 ppm/8 MDa PEO solution is again different from our recent observation in 1000 ppm/2 MDa solution, wherein, as noted earlier, the unsteady flow starts far before the fluid inertia takes effects.55 As the PEO solution in our recent study actually has a smaller El = 0.37 than the 8 MDa solution (El = 0.96), we hypothesize that the polymer entanglement in terms of c/c* (see Table 1) may play the primary role here and will discuss this aspect later in the paper. Another interesting phenomenon to note is that the juxtaposition and the subsequent unsteady states can be accessed by increasing either the flow rate (i.e., fluid inertia in terms of Re as well as fluid elasticity in terms of Wi) or the polymer content including both concentration and Mw (i.e., fluid elasticity in terms of El via the relaxation time). This phenomenon may be drawn upon the McKinley–Pakdel criterion,64 which is expressed as,
 | (6) |
 is the curvature of a fluid path. Specifically, the M value can be incurred in the local flow region such that M > Mcrit by increasing either λ (through the increase of polymer concentration and/or molecular weight) or V (through the increase of flow rate) and hence imposing insufficient time for the relaxation and distribution of polymeric stresses on the path of traversal, invoking elastic instabilities. We will further discuss this aspect in the following sections through a quantitative analysis of all the experimental images and an integrated illustration in dimensionless parameter spaces.
3.2. Quantitative analyses
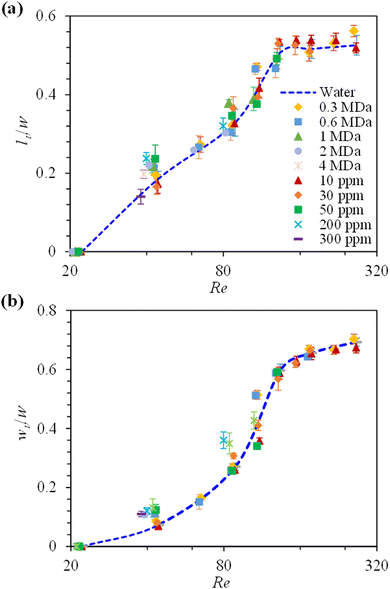
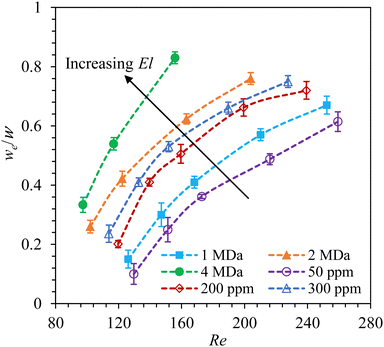
To quantify the effects of polymer concentration and Mw on the merging flow of PEO solutions, we measured from the images in Fig. 1 and 2 the length, lv, and width, Mv, of the inertial vortices before the onset of juxtaposition state. Fig. 3(a) and (b) show the growth of the normalized (by the width of the main branch) vortex length, lv/w, and vortex width, wv/w, respectively, with respect to Re. Overall, a sigmoidal pattern, which has a slower growth in the low and high Re ends of the graph while a band of steeply increasing part in between, can be observed for both the length and width of inertial vortices. Moreover, the data points for each of these dimensions in every PEO solution illustrated in Fig. 3 collapse into the curve fitted for water. This phenomenon is consistent with that reported for the viscoelastic PVP (Mw = 0.36 MDa) and HA (Mw = 0.357 MDa) solutions in our recent study,55 indicating the dominant role of fluid inertia in the vortical flow over the fluid elasticity and shear-thinning effects. Note that Fig. 3 does not include the cases for 8 MDa or 400 and 500 ppm PEO solutions because of the absence of steady vortical flow therein.We also measured from the images in Fig. 1 and 2 the width of the elastic eddy zone, we, in the juxtaposition state before the merging flow becomes fully unsteady. Fig. 4 shows the growth of the normalized (also by the width of the main branch) elastic eddy zone width, we/w, against Re in PEO solutions with varying concentrations or Mw. Overall, the curve for each case follows a roughly logarithmic dependence on Re. As the concentration or Mw is increased, the onset of the elastic eddy zone occurs earlier in Re because of the enhanced fluid elasticity effect in terms of the increasing value of El (see Table 1). The earliest onset takes place in 50 ppm/1 MDa solution (El = 0.0066) at Re = 130 whereas it is at Re = 97.4 in 100 ppm/4 MDa PEO solution (El = 0.21). The magnitude of we/w is also larger at any specific Re in higher El PEO solutions, further validating the elastic feature of the eddy zone in the juxtaposition state. Note that Fig. 4 does not include the cases for 0.3 and 0.6 MDa or 10 and 30 ppm PEO solutions, wherein the juxtaposition state does not appear.
3.3. Summary of flow regimes
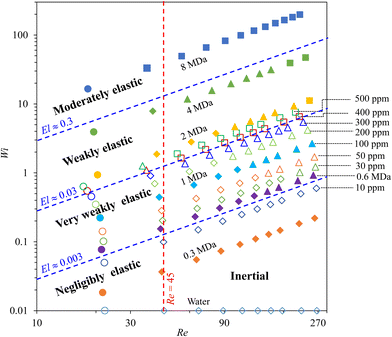
Fig. 5 summarizes the flow regimes for our tested PEO solutions in the Re–Wl space, which is divided into four domains using three diagonal isolines at El ≈ 0.003, 0.03 and 0.3, respectively. The value of Wi = 0.01 is assigned to water at all flow rates for the sake of its inclusion to this plot. The vertical isoline at Re = 45 is also included on the plot to highlight the inertial domain, which was obtained from a three-dimensional simulation (COMSOL®) for the onset of inertial vortices in water flow and has been experimentally validated in our recent study.55 In the negligibly elastic domain with El < 0.003, increasing the flow rate to around Re = 45 causes the flow at the T-junction to transition from a undisturbed state to inertial vortices in 100 ppm/0.3 MDa (El = 0.00085) and 10 ppm/1 MDa (El = 0.0023) PEO solutions despite the simultaneously increasing Wi. This phenomenon indicates that the fluid inertia effect dominates over the fluid elasticity effect in these two least viscoelastic PEO solutions. In the moderately elastic domain with El > 0.3 (including strongly elastic if El. > 1), increasing Re leads to a direct transition from undisturbed to fully unsteady flow in the mering flow of 100 ppm/8 MDa PEO solution. These two paths of merging flow development are consistent with the observations in our recent study.55In the very weakly elastic domain with 0.003 ≤ El ≤ 0.003, the merging flow of 30–300 ppm/1 MDa and 100 ppm/0.6 MDa PEO solutions transitions from undisturbed first to a steady vortical and then the juxtaposition state (which is unsteady due to the presence of elastic eddy zone) with the increase of Re. In the weakly elastic domain with 0.03 ≤ El ≤ 0.3, the merging flow transitions first to a juxtaposition state and then to a fully unsteady flow in 400 ppm (El = 0.032) and 500 ppm (El = 0.039)/1 MDa PEO solutions with the increase of Re. In the even more viscoelastic 100 ppm/2 MDa (El = 0.047) and 4 MDa (El = 0.21) PEO solutions, however, it transitions first to steady inertial vortices and subsequently to a juxtaposition state and then to a fully unsteady flow. This unexpected phenomenon in the weakly elastic domain implies the role of another factor in the merging flow of viscoelastic fluids. None of the paths of flow development involving the juxtaposition state in the very weakly or weakly elastic domain has been reported in previous studies.
Referring to eqn (3) and (4), we can rewrite the McKinley–Pakdel criterion64 in eqn (6) as,
 | (7) |
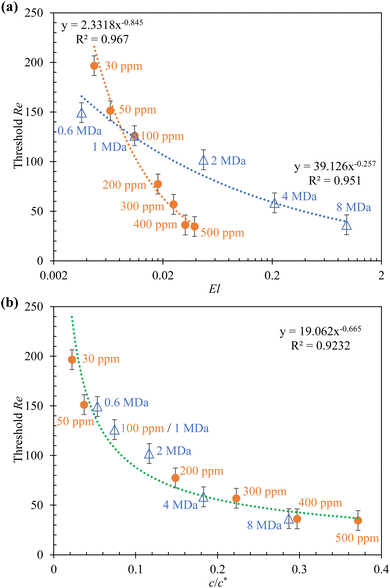
This form of Mcrit indicates an inverse relationship between the threshold Re for the onset of elastic instabilities (in the form of either diverging streamlines for 30 ppm/1 MDa and 100 ppm/0.6 MDa, juxtaposition state for 50–500 ppm/1 MDa and 100 ppm/1–4 MDa, or fully unsteady flow for 100 ppm/8 MDa) and the value of El. Fig. 6(a) shows the experimentally observed threshold Re against El in the PEO solutions with varying polymer concentrations and molecular weights, respectively. The data points for each parametric case can be best fitted to a power trendline, whose index (see the equations displayed on the chart), however, deviates from the prediction of eqn (7). The inclusion of the contribution of solvent viscosity into Mcrit, which, as suggested by McKinley et al.65 because of its stabilizing effect on the onset of purely elastic instabilities, does not seem to improve the agreement in either case (see Fig. S-3 and the additional analysis in terms of Wi in Section S-2 of the ESI†). The experimentally observed values of threshold Re in all the PEO solutions under test are replotted in Fig. 6(b) as a function of the relative polymer concentration, c/c* (see Table 1). A power-law dependence with an index of −0.665 (see the equation displayed on the chart) is obtained, which appears to closely match the dependence of the fluid relaxation time, λ, on c/c* in eqn (2). This correlation turns out qualitatively consistent with the McKinley–Pakdel criterion64 in the following scaling form via the use of eqn (2) and (3) in eqn (6),
| Mcrit ∝ (c/c*)0.65Re | (8) |
It also points to the significance of polymer entanglement in the merging flow of viscoelastic fluids, which may share a similar origin to the recent observations of c/c* dependent electro-elastic migration of particles in PEO solutions.66,67
We also note that the iso-El line in Fig. 5 for the negligibly elastic domain is two orders of magnitude smaller than the value, El ≈ 0.3, identified between the steady vortical flow in PVP (10![[thin space (1/6-em)]](https://www.rsc.org/images/entities/char_2009.gif) 000 ppm/0.36 MDa, El = 0.16) & HA (1000 ppm/0.357 MDa, El = 0.010) solutions and the unsteady flow in PEO (1000 ppm/2 MDa, El = 0.37) & PAA (200 ppm/18 MDa, El = 27) solutions in our recent study.55 Such a large discrepancy perhaps indicates a more important role of polymer Mw than concentration in the merging flow of viscoelastic fluids, which seems consistent with the fluid relaxation time in the Zimm theory given by eqn (2). This hypothesis may also be used to explain why even the negligibly elastic XG solution (2000 ppm/2 MDa) can undergo the unsteady flow55 because of its large polymer Mw. In addition, we note that the observed threshold Re = 4.18 for the onset of elastic instabilities in 1000 ppm/2 MDa PEO solution (c/c* = 1.17) in our recent study55 is much smaller than the lowest value of Re = 34.6 for 500 ppm/1 MDa PEO solution (c/c* = 0.371, see Table 1) in this work. This comparison turns out to be consistent with the fitted trendline in Fig. 6(b).
000 ppm/0.36 MDa, El = 0.16) & HA (1000 ppm/0.357 MDa, El = 0.010) solutions and the unsteady flow in PEO (1000 ppm/2 MDa, El = 0.37) & PAA (200 ppm/18 MDa, El = 27) solutions in our recent study.55 Such a large discrepancy perhaps indicates a more important role of polymer Mw than concentration in the merging flow of viscoelastic fluids, which seems consistent with the fluid relaxation time in the Zimm theory given by eqn (2). This hypothesis may also be used to explain why even the negligibly elastic XG solution (2000 ppm/2 MDa) can undergo the unsteady flow55 because of its large polymer Mw. In addition, we note that the observed threshold Re = 4.18 for the onset of elastic instabilities in 1000 ppm/2 MDa PEO solution (c/c* = 1.17) in our recent study55 is much smaller than the lowest value of Re = 34.6 for 500 ppm/1 MDa PEO solution (c/c* = 0.371, see Table 1) in this work. This comparison turns out to be consistent with the fitted trendline in Fig. 6(b).
4. Conclusions
We have experimentally studied the elasto-inertial instabilities in the merging flow of PEO solutions with varying polymer concentrations and molecular weights over a wide range of flow rates. The observed flow regimes in each of these solutions are summarized in the dimensionless Re-Wi space that can be divided into four domains based on the value of El. Specifically, the merging flow transitions from the undisturbed directly to steady vortical and unsteady overlaying states in the negligibly elastic (El < 0.003) and moderately elastic (El > 0.3 including strongly elastic if El > 1) domains, respectively, qualitatively consistent with those reported in our recent study.55 Two new paths of merging flow development are identified in the very weakly elastic (0.003 ≤ El ≤0.03) and weakly elastic (0.03 ≤ El ≤0.3) domains, where the former transitions first to a steady vortical and then to a juxtaposition state while the latter transitions first to a steady vortical and/or a juxtaposition state and then to a fully unsteady flow. We find that the development of inertial vortex size with Re before the juxtaposition state occurs in all the tested PEO solutions, if applicable, collapses into the curve for water. The width of the elastic eddy zone before the merging flow transitions to fully unsteady increases in higher-El PEO solutions for the same Re. However, the threshold Re for the onset of elastic instabilities is not a monotonic function of El, but instead follows a power-law dependence on the relative polymer concentration, c/c*, qualitatively consistent with the McKinley–Pakdel criterion.64 Our experimental results in this work advance the understanding of merging flow instabilities due to fluid elasticity. They are expected to enrich the database for the validation and calibration of numerical models for non-Newtonian fluid flows.68Author contributions
M. K. R. and N. K. performed the experiment; M. K. R. conducted the analysis of experimental data; Y. S. and X. X. designed and supervised the project; M. K. R. wrote the manuscript; X. X. edited the manuscript; all authors commented on the manuscript.Data availability
The data supporting this article have been included as part of the ESI.†Conflicts of interest
None.Acknowledgements
This work was supported in part by Clemson University through the Creative Inquiry and Departmental Honors Programs (X. X.), and University 111 Project of China under grant number B08046 (Y. S.).References
- A. Mohsenatabar Firozjaii and H. R. Saghafi, Petroleum, 2020, 6, 115–122 CrossRef.
- R. Farajzadeh, S. Kahrobaei, A. A. Eftekhari, R. A. Mjeni, D. Boersma and J. Bruining, Sci. Rep., 2021, 11, 829 CrossRef CAS.
- R. Mosler and T. A. Hatton, Curr. Opin. Colloid Interface Sci., 1996, 1, 540–547 CrossRef CAS.
- A. C. Barbati, J. Desroches, A. Robisson and G. H. McKinley, Annu. Rev. Chem. Biomol. Eng., 2016, 7, 415–453 CrossRef CAS PubMed.
- S. A. Wajihah and D. S. Sankar, Arch. Appl. Mech., 2023, 93, 1771–1796 CrossRef PubMed.
- X. Lu, C. Liu, G. Hu and X. Xuan, J. Colloid Interfaces Sci., 2017, 500, 182–201 CrossRef CAS.
- D. Yuan, Q. Zhao, S. Yan, S. Tang, G. Alici, J. Zhang and W. Li, Lab Chip, 2018, 18, 551–567 RSC.
- J. Zhou and I. Papautsky, Microsys. Nanoeng., 2020, 6, 113 CrossRef CAS.
- Y. Song, D. Li and X. Xuan, Electrophoresis, 2023, 44, 910–937 CrossRef CAS PubMed.
- F. Shen, J. Gao, J. Zhang, M. Ai, H. Gao and Z. Liu, Biomicrofluid, 2024, 18, 021504 CrossRef CAS.
- M. A. Alves and R. J. Poole, J. Non-Newtonian Fluid Mech., 2007, 144, 140–148 CrossRef CAS.
- F. J. Galindo-Rosales, L. Campo-Deaño, P. C. Sousa, V. M. Ribeiro, M. S. N. Oliveira, M. A. Alves and F. T. Pinho, Exp. Therm. Fluid Sci., 2014, 59, 128–139 CrossRef.
- A. Anbari, H. T. Chien, S. S. Datta, W. Deng, D. A. Weitz and J. Fan, Small, 2018, 14, 1703575 CrossRef.
- C. A. Browne, A. Shih and S. S. Datta, Small, 2020, 16, 1903944 CrossRef CAS PubMed.
- S. S. Datta, A. M. Ardekani, P. E. Arratia, A. N. Beris, I. Bischofberger, G. H. McKinley, J. G. Eggers, J. E. López-Aguilar, S. M. Fielding, A. Frishman, M. D. Graham, J. S. Guasto, S. J. Haward, A. Q. Shen, S. Hormozi, A. Morozov, R. J. Poole, V. Shankar, E. S. G. Shaqfeh, H. Stark, V. Steinberg, G. Subramanian and H. A. Stone, Phys. Rev. Fluids, 2022, 7, 080701 CrossRef.
- L. E. Rodd, J. J. Cooper-White, D. V. Boger and G. H. McKinley, J. Non-Newtonian Fluid Mech., 2007, 143, 170–191 CrossRef CAS.
- L. Campo-Deañoa, F. J. Galindo-Rosales, F. T. Pinho, M. A. Alves and M. S. N. Oliveira, J. Non-Newtonian Fluid Mech., 2011, 166, 1286–1296 CrossRef.
- A. Lanzaro, Z. Li and X. F. Yuan, Microfluid. Nanofluid., 2015, 18, 819–828 CrossRef CAS.
- S. J. Haward, J. Page, T. A. Zaki and A. Q. Shen, Phys. Fluids, 2018, 30, 113101 CrossRef.
- R. M. Matos, M. A. Alves and F. T. Pinho, Exp. Fluids, 2019, 60, 145 CrossRef.
- K. Zografos, W. Hartt, M. Hamersky, M. S. N. Oliveira, M. A. Alves and R. J. Poole, J. Non-Newtonian Fluid Mech., 2020, 278, 104222 CrossRef CAS.
- C. A. Browne, A. Shih and S. S. Datta, J. Fluid Mech., 2020, 890, A2 CrossRef CAS.
- M. Kumar, S. Aramideh, C. A. Browne, S. S. Datta and A. M. Ardekani, Phys. Rev. Fluids, 2021, 6, 033304 CrossRef.
- M. K. Raihan, S. Wu, Y. Song and X. Xuan, Soft Matter, 2021, 17, 9198–9209 RSC.
- C.-D. Xue, Z.-Y. Zheng, G.-S. Zhang, D.-W. Zhao and K.-R. Qin, Soft Matter, 2022, 18, 3867–3877 RSC.
- C. C. Hopkins, S. J. Haward and A. Q. Shen, Soft Matter, 2022, 18, 4868–4880 RSC.
- M. K. Raihan, S. Wu, H. Dort, M. Baghdady, Y. Song and X. Xuan, Soft Matter, 2022, 18, 7427–7440 RSC.
- C. C. Hopkins, A. Q. Shen and S. J. Haward, Soft Matter, 2022, 18, 8856–8866 RSC.
- F. Khalkhal and S. Muller, Phys. Rev. Fluids, 2022, 7, 023303 CrossRef.
- M. Kumar, D. M. Walkama, A. M. Ardekani and J. S. Guasto, Soft Matter, 2023, 19, 6761–6770 RSC.
- D. W. Carlson, A. Q. Shen and S. J. Haward, J. Non-Newtonian Fluid Mech., 2024, 323, 105169 CrossRef CAS.
- A. Yokokoji, S. Varchanis, A. Q. Shen and S. J. Haward, Soft Matter, 2024, 20, 152–166 RSC.
- X. Y. Xu, Z. Y. Zheng, K. Tian, D. Wang, K. R. Qin and C. D. Xue, Phys. Fluids, 2024, 36, 042001 CrossRef CAS.
- C.-Y. Lee, W.-T. Wang, C.-C. Liu and L.-M. Fu, Chem. Eng. J., 2016, 288, 146–160 CrossRef CAS.
- S. M. Saravanakumar and P.-V. Cicek, Micromachines, 2023, 14, 1827 CrossRef.
- X. Lu and X. Xuan, Anal. Chem., 2015, 87, 11523–11530 CrossRef CAS PubMed.
- K. Kang, S. S. Lee, K. Hyun, S. J. Lee and J. M. Kim, Nat. Commun., 2013, 4, 2567 CrossRef PubMed.
- D. Yuan, S. H. Tan, R. Sluyter, Q. Zhao, S. Yan, N. T. Nguyen, J. Guo, J. Zhang and W. Li, Anal. Chem., 2017, 89, 9574–9582 CrossRef CAS.
- S. Yan, Y. Liu, N.-T. Nguyen and J. Zhang, Anal. Chem., 2024, 96, 3925–3932 CrossRef CAS.
- M. Engler, N. Kockmann, T. Kiefer and P. Woias, Chem. Eng. J., 2004, 101, 315–322 CrossRef CAS.
- M. Hoffmann, M. Schlüter and N. Räbiger, Chem. Eng. Sci., 2006, 61, 2968–2976 CrossRef CAS.
- A. Soleymani, H. Yousefi and I. Turunen, Chem. Eng. Sci., 2008, 63, 5291–5297 CrossRef CAS.
- S. K. Reddy Cherlo and S. Pushpavanam, Chem. Eng. Sci., 2010, 65, 6486–6490 CrossRef.
- A. Fani, S. Camarri and M. V. Salvetti, Phys. Fluids, 2013, 25, 064102 CrossRef.
- A. Fani, S. Camarri and M. V. Salvetti, Phys. Fluids, 2014, 26, 074101 CrossRef.
- T. Andreussi, C. Galletti, R. Mauri, S. Camarri and M. V. Salvetti, Comput. Chem. Eng., 2015, 76, 150–159 CrossRef CAS.
- A. Mariotti, C. Galletti, R. Mauri, M. V. Salvetti and E. Brunazzi, Chem. Eng. J., 2018, 341, 414–431 CrossRef CAS.
- V. S. T. Madana and B. A. Ali, Phys. Fluids, 2020, 32, 07200 Search PubMed.
- S. Camarri, A. Mariotti, C. Galletti, E. Brunazzi, R. Mauri and M. V. Salvetti, Ind. Eng. Chem. Res., 2020, 59, 3669–3686 CrossRef CAS.
- M. G. N. Perera and K. Walters, J. Non-Newtonian Fluid Mech., 1977, 2, 49–81 CrossRef.
- T. Nishimura, K. Nakamura and A. Horikawa, J. Text. Mach. Soc. Jpn., 1985, 31, 1–6, DOI:10.4188/jte1955.31.1.
- R. J. Poole, M. Alfateh and A. P. Gauntlett, Chem. Eng. Sci., 2013, 104, 839–848 CrossRef CAS.
- R. J. Poole, S. J. Haward and M. A. Alves, Procedia Eng., 2014, 79, 28–34 CrossRef.
- J. Soulages, M. S. N. Oliveira, P. C. Sousa, M. A. Alves and G. H. McKinley, J. Non-Newtonian Fluid Mech., 2009, 163, 9–24 CrossRef CAS.
- L. Song, M. K. Raihan, L. Yu, S. Wu, N. Kim, S. Till, Y. Song and X. Xuan, Soft Matter, 2023, 19, 3207–3214 RSC.
- M. K. Raihan, M. Baghdady, H. Dort, J. Bentor and X. Xuan, Anal. Chem., 2023, 95, 16013–16020 CrossRef CAS PubMed.
- J. Bentor and X. Xuan, Anal. Chem., 2024, 96, 3186–3191 CAS.
- L. E. Rodd, T. P. Scott, D. V. Boger, J. J. Cooper-White and G. H. McKinley, J. Non-Newtonian Fluid Mech., 2005, 129, 1–22 CrossRef CAS.
- S. Wu, M. K. Raihan, L. Song, X. Shao, J. B. Bostwick, L. Yu, X. Pan and X. Xuan, J. Non-Newtonian Fluid Mech., 2021, 290, 104508 CrossRef CAS.
- V. Tirtaatmadja, H. G. McKinley and J. J. Cooper-White, Phys. Fluids, 2006, 18, 043101 CrossRef.
- F. Tian, L. Cai, J. Chang, S. Li, C. Liu, T. Li and J. Sun, Lab Chip, 2018, 18, 3436–3445 RSC.
- Y. Zhou, Z. Ma and Y. Ai, Lab Chip, 2020, 20, 568–581 RSC.
- P. Liu, H. Liu, D. Yuan, D. Jang, S. Yan and M. Li, Anal. Chem., 2021, 93, 1586–1595 CrossRef CAS PubMed.
- P. Pakdel and G. H. McKinley, Phys. Rev. Lett., 1996, 77, 2459–2462 CrossRef CAS PubMed.
- G. H. McKinley, P. Pakdel and A. Oztekin, J. Non-Newtonian Fluid Mech., 1996, 67, 19–47 CrossRef CAS.
- M. Serhatlioglu, Z. Isiksacan, M. Ozkan, D. Tuncel and C. Elbuken, Anal. Chem., 2020, 92, 6932–6940 CrossRef CAS PubMed.
- D. Li and X. Xuan, Phys. Fluids, 2023, 35, 092013 CrossRef CAS.
- M. A. Alves, P. J. Oliveira and F. T. Pinho, Annu. Rev. Fluid Mech., 2021, 53, 509–541 CrossRef.
Footnote |
| † Electronic supplementary information (ESI) available. See DOI: https://doi.org/10.1039/d4sm00743c |
| This journal is © The Royal Society of Chemistry 2024 |


