
 Open Access Article
 This Open Access Article is licensed under a Creative Commons Attribution-Non Commercial 3.0 Unported Licence
Development of NIAD-4 derivatives for fluorescence-based detection of protein aggregates†
Tze Cin
Owyong
 a,
Laura E.
Shippey
ab,
Siyang
Ding
a,
David S.
Owen
b,
Shouxiang
Zhang
a,
Jonathan M.
White
c,
Wallace W. H.
Wong
cd,
David P.
Smith
b and
Yuning
Hong
*a
a,
Laura E.
Shippey
ab,
Siyang
Ding
a,
David S.
Owen
b,
Shouxiang
Zhang
a,
Jonathan M.
White
c,
Wallace W. H.
Wong
cd,
David P.
Smith
b and
Yuning
Hong
*a
aDepartment of Biochemistry and Chemistry, La Trobe Institute for Molecular Science, La Trobe University, Melbourne, VIC 3086, Australia. E-mail: y.hong@latrobe.edu.au
bBiomolecular Research Centre, Department of Biosciences and Chemistry, Sheffield Hallam University, Sheffield, UK
cSchool of Chemistry, Bio21 Institute, The University of Melbourne, Parkville, VIC 3010, Australia
dARC Centre of Excellence in Exciton Science, The University of Melbourne, Parkville, VIC 3010, Australia
First published on 14th November 2024
Abstract
Impairment of protein quality control is a critical factor in the development of neurodegenerative disorders like Alzheimer's, Parkinson's and Huntington's disease, characterized by the accumulation of protein aggregates. As such, detection and monitoring of protein aggregates remains a crucial area of study. In this work, we synthesize a series of bithiophene derivatives based on a red emitting amyloid fluorophore NIAD-4. By molecular engineering, widened Stokes shifts and spectral tuning can be achieved in these derivatives. Through molecular docking and aggregation assays, we demonstrate the specificity of these derivatives towards protein fibrils over monomers and amorphous aggregates. Utilizing unbiased flow cytometry together with a cell viability indicator, we show that derivative NIAD-CNOET facilitates the discrimination of cells treated with and without preformed fibrils of α-synuclein, a model of the pathological hallmark of Parkinson's disease.
Introduction
Proteins play a crucial role in the function of a biological system. The maintenance of protein quality is governed by protein homeostasis (proteostasis), a complex network of biological systems and pathways that ensure the preservation of protein structure and function.1,2 Disruptions in proteostasis can arise from external stressors, such as environmental and pharmacological perturbations, as well as internal stressors like gene or protein mutations, abnormal protein expression, and impairment of protein quality control mechanisms.3–6 Prolonged exposure to such stressors can overwhelm the proteostasis network, leading to the buildup of misfolded proteins and aggregates. The formation of such protein aggregates is a hallmark of a multitude of diseases, in particular neurodegenerative diseases such as Alzheimer's, Huntington's and Parkinson's diseases.7,8Fluorescence-based techniques are commonly used for monitoring protein conformational change and sensing the formation of protein aggregates. A range of fluorophores have been developed for these purposes. For example, fluorescent molecular rotor thioflavin T (ThT) is the gold standard dye for in vitro detection of amyloid fibrils. Its binding mechanism and spectral properties upon interaction with protein aggregates have been extensively studied.9–11 The cationic benzothiazole group of ThT ensures excellent water solubility, with fluorescence intensity enhancement observed only upon binding to β-sheet-rich structures, a common characteristic of amyloid aggregates. Despite the availability of several amyloid dyes, few are suitable for cell-based studies. For example, ThT bears a positive charge, leading it to accumulate in mitochondria and G-quadruplex DNA structures, and thus cannot specifically stain protein aggregates in a cellular environment.12 Other fluorescence-based dyes, such as fluorescent molecular rotors and structures containing styryl or cationic groups, as well as derivatized BODIPY fluorophores, have been employed for staining protein aggregates in vitro, in mouse models, or in brain sections.13–22 Interestingly, several molecular rotors have also been reported to target and stain amorphous aggregates in cells.23–26 However, fluorophores for specifically reporting amyloid fibrils in complex cellular environments are still rare.
A milestone dye, NIAD-4, with a classic electron donor-acceptor structure was used for near-infrared (NIR) imaging of amyloid deposits in brain. It exhibited a remarkable binding affinity with a Ki of 10 nM (in contrast to ThT, Ki = 580 nM) and showed an approximate 400-fold increase in fluorescence intensity upon binding to β-amyloid aggregates.27 An example of cell staining based on fixed cells with permeant cell membranes was demonstrated in a study investigating the influence of protein aggregates on cytoplasmic nuclear transport within the cell.28
In this study, we proposed a series of NIAD-4 derivatives and examine their performance in direct comparison to the parent compound upon binding to protein aggregates in vitro and in cells (Fig. 1A). Computational methods were used to aid in fluorophore design and supporting study of dye–protein aggregate interactions. Our efforts were focused on attempts in improving sensitivity and functionality of NIAD-4. Ethyl cyanoacetate was chosen due to ester functionality to allow for different chemical structure and subsequent interactions with protein aggregates. Two structures with an additional vinyl bridge between the electron donor and acceptor structures were also proposed. We found NIAD-CNOET exhibited considerable specificity towards amyloid protein fibrils like NIAD-4 and further demonstrated its application in discriminating live cells with and without exposure to preformed fibrils (PFFs) of α-synuclein (α-syn), a model for Parkinson's disease and other synucleinopathies, using high-throughput flow cytometry.
 | ||
| Fig. 1 (A) Chemical structures of NIAD-4 and derivatives used in this study. Comparison of (B) normalized absorbance and (C) emission spectra of all dyes measured in DMSO. Excitation wavelength of 488 nm used for NIAD-4, NIAD-CNOET, and ASC-NIAD and 405 nm used for ASV-NIAD. Dye concentration was 10 μM for all measurements. | ||
Experimental section
Chemical synthesis and characterization
Monomeric and aggregated α-synuclein production
For the discontinuous kinetic assay, monomeric α-syn was dissolved in 50 mM sodium phosphate at a concentration of 140 μM (2 mg mL−1) in 1.5 mL Eppendorf tubes. The tubes were incubated in an Eppendorf Thermomixer at 1000 rpm, 37 °C. 180 μL each dye was mixed with 20 μL of α-syn at the stated time points. 50 μM final dye concentration was used for all time points.
Cell culture
After staining, cells were fixed with 4% (w/v) paraformaldehyde in PBS for 15 min at room temperature. Images were acquired on a Zeiss LSM 880 microscope using a 63× objective lens. For image acquisition, the pixel frame size was set at 512 × 512 and the pixel dwell time was 32.7 μs. For cell uptake and retention experiments, NIAD-4, NIAD-CNOET and ASC-NIAD (excitation: 488 nm; emission: 550–650 nm) with 0.5% laser power and ASV-NIAD (excitation: 405 nm; emission 550–650 nm) with 1.0% laser power was used.
SH-SY5Y cells (0.5 × 10⁵) were plated on coverslips within an Nunclon™ Delta Surface 24-well plate (ThermoFisher Scientific, catalog number: 142475). Cells were stained with the NIAD-CNEOT dye (1 μM) for 30 min at 37 °C, 5% CO2, then washed with PBS. After staining, cells were fixed with ice-cold methanol for 15 min at −20 °C. Images were acquired on a Zeiss LSM 800 microscope using a 63× objective lens. The pixel frame size was set at 1437 × 1437 (optimal presets) and the pixel dwell time was 0.73 μs (scan speed 28.43 s). To assess intracellular aggregation after PFF treatment, NIAD-CNEOT (excitation: 488 nm; emission: 550–650 nm) with 0.2% laser power was used.
![[thin space (1/6-em)]](https://www.rsc.org/images/entities/char_2009.gif) 000 cells and maintained overnight at 37 °C and 5% CO2 in DMEM, high glucose, GlutaMAX™ (Gibco). The medium was supplemented with 10% (v/v) FBS (Gibco) and 1% (v/v) Pen-Strep (Gibco). The next day cells were treated with monomeric or fibrillar α-syn (10% v/v) by adding the α-syn/sodium phosphate mixture to the cell culture medium and maintained at 37 °C and 5% CO2 for 24 h. Cells were washed in Gibco™ Dulbecco's phosphate-buffered saline (DPBS) and then stained with 10 μM NIAD-4 or NIAD-CNEOT for 30 min at 37 °C and 5% CO2. Cells were washed in DPBS (Gibco) and subsequently detached from the surface of culture flasks using Trypsin-EDTA (0.25%) (Gibco) and inactivated using DMEM GlutaMAX™ (10% FBS, 1% Pen-Strep). Cells were centrifuged at 1000 rpm for 5 min and the remaining supernatant was removed and the cell pellet was resuspended in DPBS. 1 μM SYTOX® Blue Dead Cell Stain/DMSO solution was incubated in cell suspension for 10 min. Cell suspension samples were analysed using CytoFLEX flow cytometer (Beckman). Analysis of data was conducted using FlowJo™ software. The gating and analysis strategies are shown in the ESI† (Fig. S24 & S25). Statistical analysis on population of cells was done using 1-way ANOVA and Tukey test.
000 cells and maintained overnight at 37 °C and 5% CO2 in DMEM, high glucose, GlutaMAX™ (Gibco). The medium was supplemented with 10% (v/v) FBS (Gibco) and 1% (v/v) Pen-Strep (Gibco). The next day cells were treated with monomeric or fibrillar α-syn (10% v/v) by adding the α-syn/sodium phosphate mixture to the cell culture medium and maintained at 37 °C and 5% CO2 for 24 h. Cells were washed in Gibco™ Dulbecco's phosphate-buffered saline (DPBS) and then stained with 10 μM NIAD-4 or NIAD-CNEOT for 30 min at 37 °C and 5% CO2. Cells were washed in DPBS (Gibco) and subsequently detached from the surface of culture flasks using Trypsin-EDTA (0.25%) (Gibco) and inactivated using DMEM GlutaMAX™ (10% FBS, 1% Pen-Strep). Cells were centrifuged at 1000 rpm for 5 min and the remaining supernatant was removed and the cell pellet was resuspended in DPBS. 1 μM SYTOX® Blue Dead Cell Stain/DMSO solution was incubated in cell suspension for 10 min. Cell suspension samples were analysed using CytoFLEX flow cytometer (Beckman). Analysis of data was conducted using FlowJo™ software. The gating and analysis strategies are shown in the ESI† (Fig. S24 & S25). Statistical analysis on population of cells was done using 1-way ANOVA and Tukey test.
Results and discussion
NIAD-4 and derivatives were synthesized according to synthetic routes shown in Scheme S1 and S2 in the ESI.† In brief, the formation of the primary bithiophene core with aldehyde 1 occurred through a Vilsmeier–Haack reaction. Subsequent bromination with N-bromosuccinimide (NBS) gave bifunctionalized 2 in good yield. To access NIAD-4 and NIAD-CNOET, a palladium catalyzed Suzuki reaction was carried out to first give intermediate 3 in good yield. Finally, Knoevenagel condensation with respective coupling partners and conditions gave NIAD-4 and NIAD-CNOET in fair yield (Scheme S1†). Aldol condensation of bifunctionalized bithiophene core 2 with acetone installed our extended vinyl group, giving intermediate 4. Subsequent palladium catalyzed Suzuki cross coupling with 4 was then carried out in good yield, giving ASV-NIAD. Knoevenagel condensation with malononitrile on ASV-NIAD then gave ASC-NIAD in fair yields (Scheme S2†). Synthetic characterization was carried out on molecules using 1H, 13C NMR spectroscopy and HRMS. X-ray diffraction crystallography further confirmed the structure of the final product NIAD-CNOET (Fig. S1, Table S1†).The absorbances measured in different solvents showed that apart from ASV-NIAD (408–424 nm), NIAD-4 and its derivatives exhibit very similar absorbance characteristics, with the absorbance maxima in the range of 455–496 nm (Fig. 1B). When comparing the absorbance maxima for each dye, we observed increasing red-shift of absorbance spectra in the order of ASV-NIAD, NIAD-CNOET, NIAD-4 and ASC-NIAD, which we attributed to the degree of conjugation as well as the strength of electron acceptor groups in the respective molecule structure, with the trend in agreement with DFT calculations (Fig. S2†). Furthermore, the emission maxima of the four dyes in DMSO also followed the same trend, with ASV-NIAD at the shortest wavelength 570 nm and ASC-NIAD at the longest wavelength 698 nm (Fig. 1C).
We next investigated the solvent effects on the photophysics of all dyes. Across different solvents, we observed minimal shifts in absorbance maxima for all dyes (Fig. S3†), except when measured in aqueous phosphate buffer (PBS). In this case, we attributed to water being a poor solvent and subsequent dye self-aggregation effects. In agreement with the absorption results, weak emission was observed in PBS, attributing to fluorescence quenching resulting from dye self-aggregation. Fluorescence intensity measurements in various solvents other than aqueous solvents revealed a positive correlation between solvent polarity and shifts towards longer wavelengths. More specific, depending on solvent polarity, emission spectra maxima for ASV-NIAD ranged from 524–599 nm and NIAD-4 and NIAD-CNOET exhibited similar spectral properties, with emission spectra maxima of 575–640 nm and 560–625 nm respectively. ASC-NIAD with the greatest conjugation and strong electron acceptor had an emission spectra maximum ranging from 600–692 nm (Fig. S4†).
DFT calculations showed similar HOMO and LUMO distributions (Fig. S2†). In all cases, the HOMO was centered around the electron donor hydroxyl moiety and electron rich bithiophene, while the LUMO was more centered on the electron acceptor dicyano, ethyl cyanoacetate and methylacetone groups for the respective derivatives. Smaller energy gaps were obtained from our calculations for structures containing the stronger electron acceptor dicyano group as compared to ethyl cyanoacetate and methylacetone. Furthermore, by comparing NIAD-4 with ASC-NIAD, we observed that extension of conjugation by vinyl groups further reduced HOMO-LUMO energy gap, which was also observed in the spectra of ASC-NIAD with larger Stokes shift. This provides an accessible method for modulating Stokes shift of fluorophores. Notably, all dyes exhibited a large Stokes shift, which can impart better sensitivity towards our biomolecules of interest, through minimizing spectral overlap with other common fluorophores.
We then conducted molecular docking experiments to better understand the binding poses and affinity of our fluorophores for binding sites on a series of protein fibrillar aggregates. Due to the complex structure of protein aggregates, as well as a multitude of possible binding sites, we used a blind docking approach on solved protein amyloid structures with structural data acquired by X-ray diffraction crystallography, NMR or electron microscopy experiments. The protein structures chosen were based off amyloid beta (Aβ) 1–42 and 1–40 and α-syn oligomers and aggregates. This approach enabled us to estimate dye performance and binding through calculated binding free energies.
Some general observations could be made for our dyes and the binding sites on all proteins with our in silico molecular docking experiments. The results suggested that extension of dye structure, as seen with ASC-NIAD, lowered binding energies toward protein aggregates and thus could improve binding performance. All dyes exhibited similar binding profiles and performance with NIAD-4. Furthermore, dyes were observed to have preferential binding to sites perpendicular to the protein backbone of ordered protein aggregates, suggesting that the planarity of the structures plays a crucial role in targeting these binding sites (Fig. 2, S5–S16†). The results highlight that molecular docking is a valuable tool for assisting in designing molecules for targeting protein amyloid assemblies.
 | ||
| Fig. 2 Representative image for molecular docking studies with selected protein aggregate structure of docked poses of αSyn from MSA patient structure type 1 (PDB: 6XYO). (A) Structure of αSyn and docking sites of interest. (B and C) Summary of docking site populations, mean and lowest binding energies. SD refers to the standard deviation. Full data are shown in Fig. S5–S16.† | ||
Following in silico experiments, we then moved on to test the ability for our dye to monitor protein aggregation in vitro. Ovalbumin was selected as the model protein system due to its ability to form both amorphous and fibril type aggregates under different conditions.33,34 We observed that ThT and all NIAD series dyes responded to protein fibrils with greater fluorescence intensity enhancements as compared to amorphous aggregates (Fig. 3A–D, S18†). Apart from ASC-NIAD, all dyes gave minimal fluorescence intensity enhancement for amorphous aggregates. Interestingly, we also found that NIAD-CNOET had a different response to the onset of amorphous aggregate formation as compared to NIAD-4, with a minor enhancement of fluorescence intensity at earlier time points (0–500 min) before the eventual decrease in fluorescence intensity, suggesting that the ethyl cyano-acetate group could be useful in modulating dye interaction with protein aggregates and could be used as a functional group for monitoring earlier stage aggregates. Further experiments were conducted on preformed protein fibrils (PFF) of α-syn, confirmed by AFM images (Fig. S17†), which is relevant to neurodegenerative disease such as Parkinson's. We observed that NIAD-4 and NIAD-CNOET gave good discrimination between the monomeric protein and amyloid forms, with incubation with PFF giving rise to an enhancement in PL intensity of dyes with the emission peak exhibiting a small blue shift (Fig. 3E and F). This suggests the amyloid aggregates, like the α-syn PFF, provide a more hydrophobic environment for these two dyes to bind, compared to its monomeric form. The discontinuous fluorescence kinetics of NIAD-4 and NIAD-CNOET show very similar time-dependent responses to ThT, suggesting they are binding to similar aggregate conformations (Fig. S19†). This also indicates that these dyes do not detect early aggregate conformations. Unfortunately ASC-NIAD and ASV-NIAD had less capability to differentiate between PFF to monomeric forms of α-syn (Fig. 3G and H), possibly due to their poor solubility in the buffer solution.
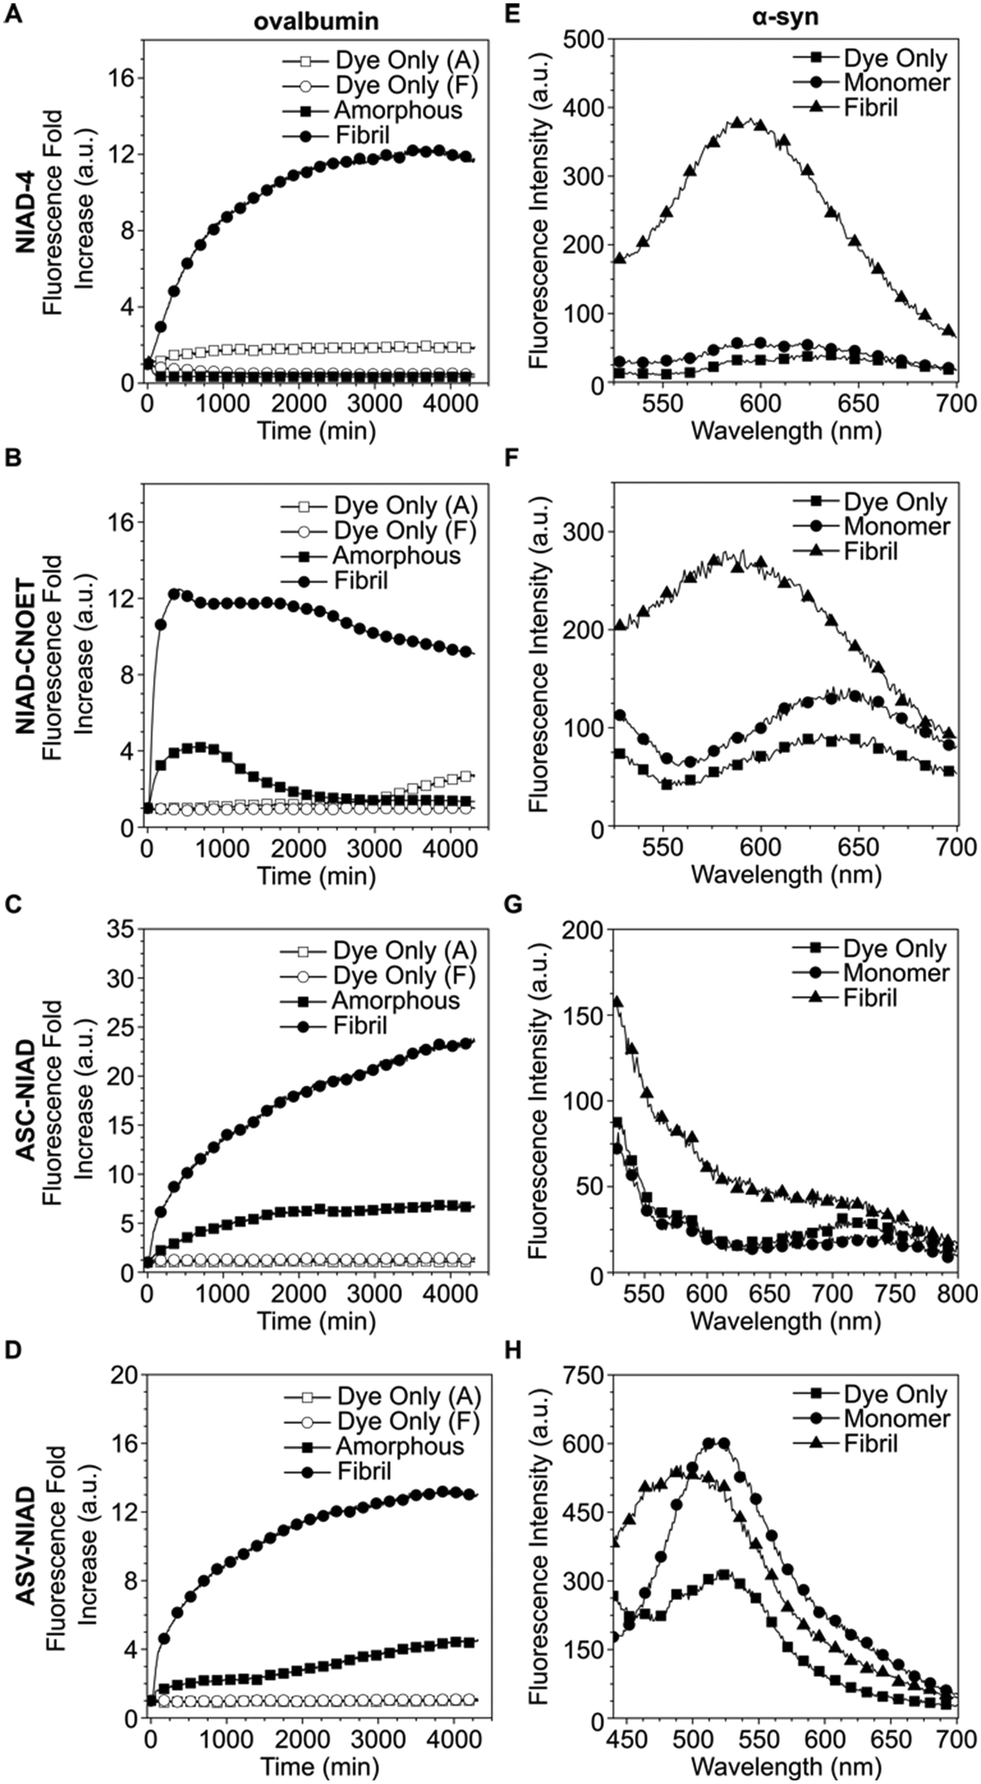 | ||
| Fig. 3 Fluorescence kinetics of (A–D) ovalbumin and spectra of (E–H) α-syn interactions for all dyes. (A and E) NIAD-4, (B and F), NIAD-CNOET, (C and G), ASC-NIAD, (D and H), ASV-NIAD. For NIAD-4 and NIAD-CNOET, the excitation and emission filters were 488/10 and 575/20 respectively. For ASC-NIAD, the excitation and emission filters were 488/10 and 650/10. For ASV-NIAD, the excitation and emission filters were 405/10 and 650/20 respectively. 10 μM dye and 1 mg mL−1 ovalbumin concentration was used for all conditions. n = 4 biological replicates. Note: for panels A–D, dye only (A) and dye only (F) refer to the corresponding aggregation buffer conditions without ovalbumin. | ||
Following in vitro characterization of our dyes, we began our cell experiments by checking the compatibility of the dyes with cells. Cell viability, above 85% for a range of dye incubation concentrations, was observed for following 1 h treatment. After 24 and 48 h dye incubation, the dyes did not have a large effect on cell viability, with only ASV-NIAD at 5 and 10 μM incubations showing a lower viability of 79 and 78% respectively (Fig. S20 and S21†). Taken together, these results showed that the NIAD series of dyes have excellent cell compatibility. We then moved on to confocal microscopy experiments. We observed good cellular uptake and retention of all dyes into the cell cytoplasm, with weaker staining in the nucleus for all dyes (Fig. S22†). The acquisition of z-stack images further confirmed dye uptake, retention and localization in cells (Fig. S23†).
Upon confirmation of dye uptake and ability to image in cells, we performed flow cytometry experiments and focused our efforts on the two dyes, NIAD-4 and NIAD-CNOET, due to their performance in vitro. Flow cytometry allows us to examine a large number of cells in an unbiased manner, compared to using microscopy-based methods. As a proof-of-concept test, we exposed live cells to α-syn PFF for 24 h and then stained with either NIAD-4 or NIAD-CNOET before subjecting to flow cytometry. Further, we used a nucleic acid stain SYTOX® Blue Dead Cell Stain to separate live and dead cell populations for analysis. We confirmed no crosstalk between SYTOX signal in the NIAD-4 and NIAD-CNOET channels and vice versa (Fig. S24D and E†). In our gating, we first gated for single cells (Fig. S24A and B†), before another gate for cells with higher side scatter profiles (Fig. S24C†) to differentiate the internal complexity, such as granularity. Subsequent gating enabled further analysis of the cell populations with their respective treatment conditions (Fig. 4A and S25†). Using the High gate population, NIAD-CNOET was able to distinguish between cells treated with and without α-syn PFF with a statistically significant change in the means (Fig. 4B), demonstrating the ability of NIAD-CNOET to bind to amyloid assemblies in a cellular environment.
 | ||
| Fig. 4 Flow cytometry experiments of cells treated with and without preformed fibrils (PFF) of α-syn protein. (A) Gating strategy of flow cytometry experiment showing PFF treated cells stained with NIAD-CNOET with SYTOX as the counter stain. (B) The high population under different conditions. n = 3 technical replicates, * p < 0.05. Statistical analysis was done using 1-way ANOVA and Tukey post hoc test. | ||
Conclusions
In summary, we have designed and synthesized a series of bithiophene based dyes on NIAD-4. Comparing photophysical properties, we see all dyes have large Stokes shift and have weak emission in aqueous media, giving rise to good sensitivity toward protein aggregates. We demonstrated the vinyl group as an accessible method for modulating Stokes shift. Molecular docking showed preferential binding toward sites perpendicular to the protein backbone of ordered protein condensates, with in vitro experiments further supporting our molecular docking observations. All dyes had good cell viability and compatibility. Due to the large Stokes shift and wide emission wavelength range, flow cytometry experiments with a cell viability stain were carried out. We found that NIAD-CNOET had good ability to discriminate cells treated with PFF of α-syn, based on gating strategy. This highlights the use of NIAD-CNOET for other flow cytometry-based studies of protein aggregates in cells.Data availability
The data supporting this article have been included as part of the ESI.† Crystallographic data for NIAD-CNOET has been deposited at the CCDC under 2234385.Author contributions
Tze Cin Owyong: conceptualization, data curation, formal analysis, investigation, methodology, writing – original draft. Laura Shippey: data curation, investigation, methodology, formal analysis, writing – original draft. Siyang Ding: data curation, validation. Shouxiang Zhang: data curation. Jonathan M. White: methodology, formal analysis. David S. Owen: data curation. Wallace W. H. Wong: resources, supervision. David P. Smith: resources, supervision. Yuning Hong: funding acquisition, methodology, resources, supervision, writing – review & editing.Conflicts of interest
There are no conflicts to declare.Acknowledgements
We thank Biological Optical Microscopy Platform (BOMP) in University of Melbourne for access to the confocal microscope and the Bio21 Mass Spectrometry and Proteomics Facility for technical support and access to mass spectrometers. This work was supported by grants to Y. H. (Australian Research Council FT210100271 and National Health and Medical Research Council APP2029017), W. W. H. W. (Australian Research Council CE170100026) and T. C. O. (La Trobe University ABC Scheme 2311080).Notes and references
- C. M. Dobson, Semin. Cell Dev. Biol., 2004, 15, 3–16 CrossRef CAS PubMed.
- M. S. Hipp, S.-H. Park and F. U. Hartl, Trends Cell Biol., 2014, 24, 506–514 CrossRef CAS PubMed.
- F.-X. Theillet, A. Binolfi, T. Frembgen-Kesner, K. Hingorani, M. Sarkar, C. Kyne, C. Li, P. B. Crowley, L. Gierasch, G. J. Pielak, A. H. Elcock, A. Gershenson and P. Selenko, Chem. Rev., 2014, 114, 6661–6714 CrossRef CAS PubMed.
- V. N. Uversky, C. J. Oldfield and A. K. Dunker, Annu. Rev. Biophys., 2008, 37, 215–246 CrossRef CAS.
- D. A. Drummond and C. O. Wilke, Cell, 2008, 134, 341–352 CrossRef CAS.
- M. Marques, B. Ramos, A. R. Soares and D. Ribeiro, Cells, 2019, 8, 228 CrossRef CAS PubMed.
- M. S. Hipp, P. Kasturi and F. U. Hartl, Nat. Rev. Mol. Cell Biol., 2019, 20, 421–435 CrossRef CAS PubMed.
- C. L. Klaips, G. G. Jayaraj and F. U. Hartl, J. Cell Biol., 2017, 217, 51–63 CrossRef PubMed.
- H. Naiki, K. Higuchi, M. Hosokawa and T. Takeda, Anal. Biochem., 1989, 177, 244–249 CrossRef CAS.
- M. Groenning, L. Olsen, M. van de Weert, J. M. Flink, S. Frokjaer and F. S. Jørgensen, J. Struct. Biol., 2007, 158, 358–369 CrossRef CAS.
- M. Biancalana, K. Makabe, A. Koide and S. Koide, J. Mol. Biol., 2009, 385, 1052–1063 Search PubMed.
- S. Zhang, H. Sun, H. Chen, Q. Li, A. Guan, L. Wang, Y. Shi, S. Xu, M. Liu and Y. Tang, Biochim. Biophys. Acta, 2018, 1862, 1101–1106 CrossRef CAS.
- S. Ding, B. Yao, L. Schobben and Y. Hong, Molecules, 2020, 25, 32 CrossRef CAS.
- K. Cao, M. Farahi, M. Dakanali, W. M. Chang, C. J. Sigurdson, E. A. Theodorakis and J. Yang, J. Am. Chem. Soc., 2012, 134, 17338–17341 CrossRef CAS PubMed.
- K. J. Cao, K. M. Elbel, J. L. Cifelli, J. Cirera, C. J. Sigurdson, F. Paesani, E. A. Theodorakis and J. Yang, Sci. Rep., 2018, 8, 6950 CrossRef.
- Y. Li, D. Xu, S.-L. Ho, H.-W. Li, R. Yang and M. S. Wong, Biomaterials, 2016, 94, 84–92 CrossRef CAS.
- X. Wu, J. Kosaraju, W. Zhou and K. Y. Tam, ACS Chem. Neurosci., 2017, 8, 676–685 CrossRef CAS PubMed.
- Y. Li, C. Chen, D. Xu, C.-Y. Poon, S.-L. Ho, R. Zheng, Q. Liu, G. Song, H.-W. Li and M. S. Wong, ACS Omega, 2018, 3, 6812–6819 CrossRef CAS.
- H. Watanabe, M. Ono, K. Matsumura, M. Yoshimura, H. Kimura and H. Saji, Mol. Imaging, 2013, 12, 338–347 CrossRef CAS PubMed.
- F. Sozmen, S. Kolemen, H.-O. Kumada, M. Ono, H. Saji and E. U. Akkaya, RSC Adv., 2014, 4, 51032–51037 RSC.
- M. Ono, M. Ishikawa, H. Kimura, S. Hayashi, K. Matsumura, H. Watanabe, Y. Shimizu, Y. Cheng, M. Cui, H. Kawashima and H. Saji, Bioorg. Med. Chem. Lett., 2010, 20, 3885–3888 CrossRef CAS.
- S. Lim, M. M. Haque, D. Su, D. Kim, J.-S. Lee, Y.-T. Chang and Y. K. Kim, Chem. Commun., 2017, 53, 1607–1610 RSC.
- Y. Liu, C. H. Wolstenholme, G. C. Carter, H. Liu, H. Hu, L. S. Grainger, K. Miao, M. Fares, C. A. Hoelzel, H. P. Yennawar, G. Ning, M. Du, L. Bai, X. Li and X. Zhang, J. Am. Chem. Soc., 2018, 140, 7381–7384 CrossRef CAS PubMed.
- Y. Liu, M. Fares, N. P. Dunham, Z. Gao, K. Miao, X. Jiang, S. S. Bollinger, A. K. Boal and X. Zhang, Angew. Chem., Int. Ed., 2017, 56, 8672–8676 CrossRef CAS PubMed.
- W. Wan, Y. Huang, Q. Xia, Y. Bai, Y. Chen, W. Jin, M. Wang, D. Shen, H. Lyu, Y. Tang, X. Dong, Z. Gao, Q. Zhao, L. Zhang and Y. Liu, Angew. Chem., Int. Ed., 2021, 60, 11335–11343 CrossRef CAS PubMed.
- C. H. Wolstenholme, H. Hu, S. Ye, B. E. Funk, D. Jain, C.-H. Hsiung, G. Ning, Y. Liu, X. Li and X. Zhang, J. Am. Chem. Soc., 2020, 142, 17515–17523 CrossRef CAS.
- E. E. Nesterov, J. Skoch, B. T. Hyman, W. E. Klunk, B. J. Bacskai and T. M. Swager, Angew. Chem., Int. Ed., 2005, 44, 5452–5456 CrossRef CAS.
- A. C. Woerner, F. Frottin, D. Hornburg, L. R. Feng, F. Meissner, M. Patra, J. Tatzelt, M. Mann, K. F. Winklhofer, F. U. Hartl and M. S. Hipp, Cytoplasmic Protein Aggregates Interfere with Nucleocytoplasmic Transport of Protein and RNA, Science, 2016, 351, 173–176 CrossRef CAS.
- G. M. Sheldrick, Acta Crystallogr., Sect. C: Struct. Chem., 2015, 71, 3–8 Search PubMed.
- L. J. Farrugia, J. Appl. Crystallogr., 1997, 30, 565 CrossRef CAS.
- C. F. Macrae, I. J. Bruno, J. A. Chisholm, P. R. Edgington, P. McCabe, E. Pidcock, L. Rodriguez-Monge, R. Taylor, J. Van De Streek and P. A. Wood, J. Appl. Crystallogr., 2008, 41, 466–470 CrossRef CAS.
- M. D. Hanwell, D. E. Curtis, D. C. Lonie, T. Vandermeersch, E. Zurek and G. R. Hutchison, Aust. J. Chem., 2012, 4, 17 CAS.
- J. M. D. Kalapothakis, R. J. Morris, J. Szavits-Nossan, K. Eden, S. Covill, S. Tabor, J. Gillam, P. E. Barran, R. J. Allen and C. E. MacPhee, Biophys. J., 2015, 108, 2300–2311 CrossRef CAS.
- M. Noji, M. So, K. Yamaguchi, H. Hojo, M. Onda, Y. Akazawa-Ogawa, Y. Hagihara and Y. Goto, Biochemistry, 2018, 57, 5415–5426 CrossRef CAS.
Footnote |
| † Electronic supplementary information (ESI) available: Synthesis and characterization; DFT and X-ray crystallography, molecular docking and cell viability and imaging. CCDC 2234385. For ESI and crystallographic data in CIF or other electronic format see DOI: https://doi.org/10.1039/d4sd00182f |
| This journal is © The Royal Society of Chemistry 2025 |