 Open Access Article
Fast and accurate identification of pathogenic bacteria using excitation–emission spectroscopy and machine learning†
Jacob
Henry
a,
Jennifer L.
Endres
b,
Marat R.
Sadykov
b,
Kenneth W.
Bayles
b and
Denis
Svechkarev
 *a
*a
aDepartment of Chemistry, University of Nebraska at Omaha, 6601 University Drive North, Omaha, NE 68182-0109, USA. E-mail: dsvechkarev@unomaha.edu
bDepartment of Pathology, Microbiology, and Immunology, University of Nebraska Medical Center, Omaha NE, USA
First published on 2nd July 2024
Abstract
Fast and reliable identification of pathogenic bacteria is of upmost importance to human health and safety. Methods that are currently used in clinical practice are often time consuming, require expensive equipment, trained personnel, and therefore have limited applications in low resource environments. Molecular identification methods address some of these shortcomings. At the same time, they often use antibodies, their fragments, or other biomolecules as recognition units, which makes such tests specific to a particular target. In contrast, array-based methods use a combination of reporters that are not specific to a single pathogen. These methods provide a more data-rich and universal response that can be used for identification of a variety of bacteria of interest. In this report, we demonstrate the application of the excitation–emission spectroscopy of an environmentally sensitive fluorescent dye for identification of pathogenic bacterial species. 2-(4′-Dimethylamino)-3-hydroxyflavone (DMAF) interacts with the bacterial cell envelope resulting in a distinct spectral response that is unique to each bacterial species. The dynamics of dye–bacteria interaction were thoroughly investigated, and the limits of detection and identification were determined. Neural network classification algorithm was used for pattern recognition analysis and classification of spectral data. The sensor successfully discriminated between eight representative pathogenic bacteria, achieving a classification accuracy of 85.8% at the species level and 98.3% at the Gram status level. The proposed method based on excitation–emission spectroscopy of an environmentally sensitive fluorescent dye is a powerful and versatile diagnostic tool with high accuracy in identification of bacterial pathogens.
Introduction
The precise identification of bacterial pathogens is crucial for safeguarding human health and safety.1 It plays a pivotal role in facilitating timely disease diagnosis, administering appropriate treatments, and efficiently containing outbreaks of microbial infections. Modern methods used in clinical practice include phenotyping, mass spectrometry, and polymerase chain reaction (PCR).2 Although these methods are usually precise, they have several drawbacks such as protracted processing times, elevated costs, and a need for specialized expertise. Other molecular identification approaches frequently entail the use of antibodies or other biomolecules,3–5 thereby incurring substantial expenses and often requiring meticulous handling protocols. Consequently, there is an urgent demand for straightforward, efficient, and affordable diagnostic solutions designed specifically for use in low-resource settings.Some organic luminophores, contingent upon their structural features, can undergo significant spectral changes in response to various environmental factors such as polarity, pH, and hydrogen bonding. Upon internalization of such dyes into bacteria, they may localize in various parts of the cell and exhibit different spectral responses. This unique feature of environmentally sensitive luminophores makes them ideal candidates for sensing applications. Among the variety of fluorescent dyes sensitive to their microenvironment,6,7 representatives of the 3-hydroxyflavone family stand out due to their unique spectral feature: the excited-state proton transfer in these molecules gives rise to two distinct emissive species,8 thus providing an increased amount of information compared to conventional dyes with a single emission band. Specifically, 2-(4′-dimethylamino)-3-hydroxyflavone (DMAF) and its analogs emerged as ideal candidates due to their high fluorescence quantum yields and exceptional solvatochromic properties.9
Unlike antibodies or aptamers, environmentally sensitive fluorescent dyes do not specifically bind to a particular target inside bacterial cell. Therefore, their interaction with the microenvironment is nonspecific and does not provide high specificity and selectivity. To address this, such dyes are combined into arrays:10 by creating unique signal patterns in response to every analyte tested, they offer analysis quality comparable with conventional single-analyte methods.11 Colorimetric and fluorometric sensor arrays have been used in analysis of small molecules,12 proteins,13,14 monitoring of food quality,15–18 as well as identification of bacteria.19–21 In our previous reports, we described a fluorescent sensor array based on DMAF and its derivatives and demonstrated its ability to accurately identify and quantify pathogenic bacteria in monocultures and mixtures, as well as predict their Gram status.22–24
Excitation–emission spectroscopy is a powerful fingerprinting technique that allows for the generation of unique spectral signatures of the analytes, and thus can also be used in conjunction with pattern analysis. Due to its inherent multidimensionality, it is widely used for quality control and safety monitoring in various sectors including the food industry25–27 and water treatment.28,29 This technique was also used for identification of bacteria using their autofluorescence.30,31 The latter, however, may pose additional challenges when performing measurements in complex sample matrices such as blood or blood serum. This is because these matrices contain components that may exhibit autofluorescence, which can overlap with the fluorescence signals from bacteria.
In this report, we present a bacterial sensor that uses an organic fluorescent dye, DMAF, in combination with excitation–emission spectroscopy. In our approach, DMAF exhibits a nuanced spectral response upon interaction with bacterial cell envelopes, providing a data-rich analytical output. This technique offers an alternative to multiplexing, enabling increased data collection by recording and analyzing the complex excitation–emission response from a single fluorescent dye. Using this approach, we demonstrate successful differentiation between eight representative bacterial pathogens, achieving a classification accuracy of 85.8% at the species level and 98.3% at the Gram status level. The analysis timeframe is streamlined, requiring less than 30 minutes post-culture. The sensitivity limit, estimated at ∼107 colony-forming units per milliliter (CFU mL−1), compares well with other molecular assay methods reported in the literature.32 This underscores the high potential of our approach for clinical applications, particularly in settings where rapid bacterial identification is of paramount importance.
Materials and methods
Bacterial culture
Eight bacterial species from our lab collection were used in the study: four Gram-positive bacteria (Staphylococcus aureus, Staphylococcus epidermidis, Bacillus subtilis, and Enterococcus faecalis) and four Gram-negative bacteria (Escherichia coli, Acinetobacter baumannii, Klebsiella pneumoniae, and Citrobacter freundii). Bacterial cultures were grown in tryptic soy broth medium (BD Biosciences) supplemented with 0.25% glucose or on plates containing tryptic soy broth and 1.5% agar. The bacteria were collected by centrifugation from an overnight culture at 15 hours during their stationary phase of growth, and washed once with 1× PBS. The bacterial pellets were subsequently resuspended in fresh PBS and diluted to an OD600 = 20.Fluorescence spectroscopy
Bacterial suspensions were prepared in disposable polypropylene cuvettes (l = 10 mm) suitable for fluorescence spectroscopy. To 2950 μL of 1× PBS, 50 μL of a bacterial stock suspension (OD600 = 20) were added. To the diluted bacterial suspension, 20 μL of 2-(4′-dimethylamino)-3-hydroxyflavone33 (DMAF, 1 mg mL−1 in DMSO) was added. After thorough mixing, each sample was incubated for 15 minutes in dark. Ten samples were prepared for each bacterial species, and excitation–emission spectra were recorded five times for each sample. Spectra were recorded on Aqualog integrated spectrophotometer-fluorometer (Horiba – Jobin Yvon). Samples were excited in the range 400–700 nm, and emission was recorded in the range 420–800 nm. Excitation–emission spectra for a solution of DMAF in 1× PBS devoid of bacteria were recorded and used as a reference. Recorded data was stored in tabular format suitable for further analysis.Dye–bacteria interaction dynamics
Samples of S. aureus, B. subtilis, and A. baumannii were prepared as described above. Excitation–emission spectra were recorded at specific time points: 0, 5, 10, 15, 30, 45, and 60 minutes. The experiment was performed in duplicate for each bacterial species. The excitation–emission spectra for a solution of DMAF in 1× PBS devoid of bacteria was recorded and used as a reference.Limit of detection (LOD) and limit of identification (LOI)
Two representative bacterial species (one Gram-positive, S. aureus, and one Gram-negative, E. coli) were used for these experiments. Samples with varying concentration of bacteria were prepared using the general procedures described above, with several modifications. To a volume of 1× PBS needed to maintain the overall sample volume at 3 mL, decreasing volumes of bacterial stock suspensions were added: 500, 250, 100, 50, 25, 10, 5, 1, 0.1 (10 μL of 1![[thin space (1/6-em)]](https://www.rsc.org/images/entities/char_2009.gif) :
:![[thin space (1/6-em)]](https://www.rsc.org/images/entities/char_2009.gif) 100 dilution of stock suspension), and 0.01 (10 μL of 1
100 dilution of stock suspension), and 0.01 (10 μL of 1![[thin space (1/6-em)]](https://www.rsc.org/images/entities/char_2009.gif) :
:![[thin space (1/6-em)]](https://www.rsc.org/images/entities/char_2009.gif) 1000 dilution of stock suspension) μL. To the diluted bacterial suspension, 20 μL of DMAF (1 mg mL−1 in DMSO) was added. Each sample was incubated for 15 minutes in dark. Excitation–emission spectra were recorded 5 times for each sample. The same spectra for a series of solutions of DMAF in 1× PBS devoid of bacteria were recorded and used as a reference.
1000 dilution of stock suspension) μL. To the diluted bacterial suspension, 20 μL of DMAF (1 mg mL−1 in DMSO) was added. Each sample was incubated for 15 minutes in dark. Excitation–emission spectra were recorded 5 times for each sample. The same spectra for a series of solutions of DMAF in 1× PBS devoid of bacteria were recorded and used as a reference.
Fluorescence microscopy
To visualize the localization of DMAF in bacterial cells, fluorescence microscopy imaging was performed using S. aureus and E. coli as representative Gram-positive and Gram-negative species. The bacteria were collected from the overnight cultures, washed twice with 1× PBS, and resuspended in fresh 1× PBS at OD600 = 5.72. DAPI and FM 4-64 were used as cytoplasm and membrane stains, respectively. Solutions of DMAF (1![[thin space (1/6-em)]](https://www.rsc.org/images/entities/char_2009.gif) :
:![[thin space (1/6-em)]](https://www.rsc.org/images/entities/char_2009.gif) 50 dilution of 2 mg mL−1 stock solution in DMSO), DAPI (1
50 dilution of 2 mg mL−1 stock solution in DMSO), DAPI (1![[thin space (1/6-em)]](https://www.rsc.org/images/entities/char_2009.gif) :
:![[thin space (1/6-em)]](https://www.rsc.org/images/entities/char_2009.gif) 200 dilution of 5 mg mL−1 stock solution in PBS), and FM 4-64 (1
200 dilution of 5 mg mL−1 stock solution in PBS), and FM 4-64 (1![[thin space (1/6-em)]](https://www.rsc.org/images/entities/char_2009.gif) :
:![[thin space (1/6-em)]](https://www.rsc.org/images/entities/char_2009.gif) 100 dilution of 10 μg mL−1 stock solution in DMSO) were individually added to bacterial suspensions and incubated for 15 min in the dark. Concurrently, 1% agarose in deionized water was prepared and placed in a 55 °C water bath. After incubation, the non-interacted dyes were removed by centrifugation at 15
100 dilution of 10 μg mL−1 stock solution in DMSO) were individually added to bacterial suspensions and incubated for 15 min in the dark. Concurrently, 1% agarose in deionized water was prepared and placed in a 55 °C water bath. After incubation, the non-interacted dyes were removed by centrifugation at 15![[thin space (1/6-em)]](https://www.rsc.org/images/entities/char_2009.gif) 000 rpm for 1 min and resuspension in 100 μL of 1× PBS. Subsequently, 50 μL of 1% agarose was added to each tube, vortexed, and mixed well. Each sample (10 μL) was placed on a slide, covered with coverslips, and sealed. The fluorescent and differential interference contrast (DIC) micrographs were collected on a Zeiss 710 confocal laser scanning microscope at λex = 515 nm and λem = 604–758 nm for FM 4-64, λex = 400 nm and λem = 450–550 nm for DAPI, and λex = 400 nm and λem = 500–600 nm for DMAF. The images were obtained using a Plan-APOCHROMAT 63×/1.4 oil DIC objective, with 5.2× zoom and 0.5 μm pinhole. Each sample was imaged in five independent replicates and processed using Zeiss Zen 3.5 (Blue edition) software.
000 rpm for 1 min and resuspension in 100 μL of 1× PBS. Subsequently, 50 μL of 1% agarose was added to each tube, vortexed, and mixed well. Each sample (10 μL) was placed on a slide, covered with coverslips, and sealed. The fluorescent and differential interference contrast (DIC) micrographs were collected on a Zeiss 710 confocal laser scanning microscope at λex = 515 nm and λem = 604–758 nm for FM 4-64, λex = 400 nm and λem = 450–550 nm for DAPI, and λex = 400 nm and λem = 500–600 nm for DMAF. The images were obtained using a Plan-APOCHROMAT 63×/1.4 oil DIC objective, with 5.2× zoom and 0.5 μm pinhole. Each sample was imaged in five independent replicates and processed using Zeiss Zen 3.5 (Blue edition) software.
Data analysis
Custom procedures for manipulation of excitation–emission spectra (scattering removal, normalization, background correction, etc.) developed in the MATLAB software were used to prepare the raw spectral data for use with neural network classification algorithm. Built-in convolutional neural network (Fig. S1†) classification algorithm available in MATLAB was used for pattern recognition analysis and classification of spectral data. Leave-one-out cross validation was used to assess the classification accuracy. The classification accuracy (CA) was used as a primary measure of the sensor's performance.Results and discussion
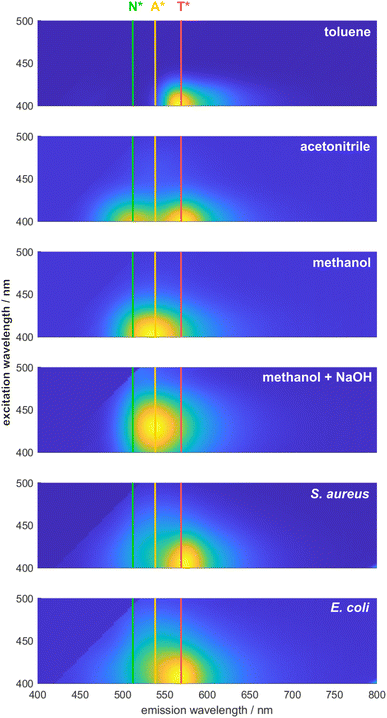
To demonstrate the ability of DMAF to provide differentiating information about various bacteria, its spectral signature was initially examined in pure PBS and upon the addition of bacterial cells. Due to the excited-state intramolecular proton transfer (ESIPT), the fluorescence of DMAF usually exhibits two distinct emission bands corresponding to the normal and phototautomeric forms. In an aqueous environment (Fig. 1, fluorescence in PBS), DMAF exhibits fluorescence characteristics indicative of highly hydrogen-bonded molecular species: a strong emission often attributed to the anionic form of the dye or its H-bonded complex with the solvent34 is observed between the emission bands of the normal and tautomer forms. This can be further illustrated by comparing DMAF excitation–emission profiles in aprotic acetonitrile (Fig. 2) that shows two distinct bands corresponding to the normal (N*) and phototautomeric (T*) forms to the protic methanol demonstrating a strong contribution of the H-bonded form. Emission of the latter is similar to that of the anion of DMAF (A*) generated upon addition of NaOH to its solution in methanol.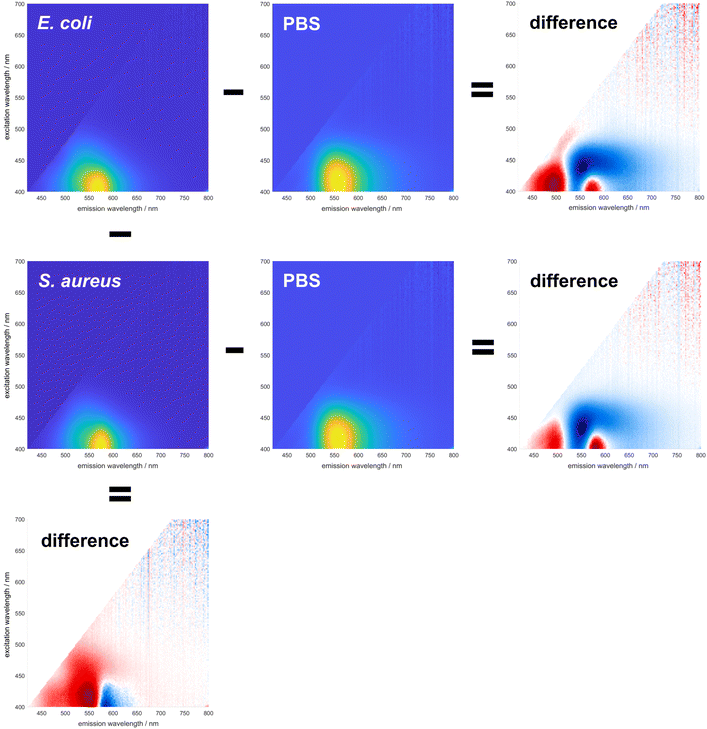 | ||
| Fig. 1 Changes in spectral responses of DMAF upon interaction with E. coli and S. aureus (horizontally), and difference between the spectral signatures of E. coli and S. aureus (vertically). | ||
The fluorescence exhibited by all three species is notably sensitive to the nuances of their microenvironment, and the overall spectral signature of the dye represents the combination of fluorescence of all three species.22 Upon interaction with the bacterial cell envelope, the fluorescence of DMAF changes. To better visualize these changes, difference matrices were generated by subtracting the normalized excitation–emission spectrum (EES) of the dye in pure PBS from the normalized EES of DMAF incubated with a suspension of bacteria in PBS (Fig. 1). The blue and red colors represent a relative decrease and increase of the fluorescence intensity, respectively. In the difference matrices obtained upon interaction of DMAF with S. aureus and E. coli, the drastic decrease in the contribution of the hydrogen-bonded species is manifested by the decrease of the emission around 550 nm,35 particularly at the longer excitation wavelengths. This decrease unequivocally indicates the penetration of the dye from PBS into the bacterial cell envelope. The increase in fluorescence around 490 and 580 nm indicates an increased contribution of the normal and phototaumeric forms of DMAF, respectively, in the overall EES. Interestingly, a very similar behavior was shown in our earlier report, where the dynamics of internalization of DMAF and its derivatives into hydrophobically-modified hyaluronic acid nanoparticles was studied by tracking the evolution of the dye's fluorescence.36
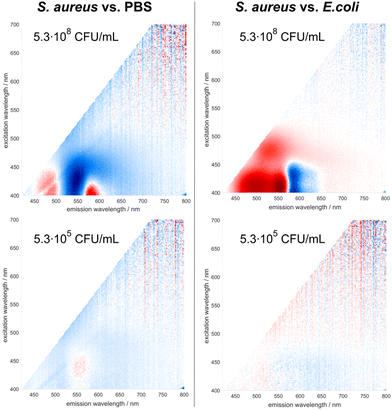
While the interaction of DMAF with bacteria leads to notable changes in its fluorescence, it is crucial to determine whether these changes will significantly differ among various bacterial species. Most importantly, the question was whether the interaction of DMAF with different bacteria would yield unique spectral signatures, enabling their reliable identification. The premise for this assumption was similar to the hypothesis that we used earlier in developing the sensor array based on DMAF and its derivatives:22 the dye's localization within the bacterial cell envelope will differ among various bacterial species, thereby leading to different microenvironments. This will lead to a unique combination of the dye's emissive species (normal form, phototautomeric form, and externally H-bonded complex exhibiting anion-like emission), which in turn will generate a spectral signature unique for a particular bacterial pathogen. The difference between the fluorescence spectra of DMAF incubated with S. aureus and E. coli is shown in the left column of Fig. 1: the difference matrix in the bottom visualizes a significant difference in the dye's response to these bacteria, with the long-wavelength portion of the emission spectrum more pronounced in the case of S. aureus, and more intensive emission in the areas related to the normal and H-bonded forms of DMAF prevailing in the case of E. coli.
Therefore, our experiments show that upon interaction with the components of the bacterial cell envelope, DMAF exhibits a distinctive and species-specific response with discernible alterations in the spatial distribution of the fluorescence intensity over the excitation–emission surface. Higher-level differences in the structure of the bacterial cell envelope exist at the Gram status level, which are also reflected in the characteristic response patterns of DMAF upon interaction with a series of Gram-positive and Gram-negative bacteria (Fig. S2–S4†). Notably, for the Gram-negative microorganisms, fluorescence is shifted towards the area of the hydrogen-bonded complex emission (around 540–550 nm) and farther into longer-wavelength excitation (past 440–450 nm). This also can be distinctively observed upon comparison of the excitation–emission profiles of S. aureus and E. coli in Fig. 2. It is worth noting that the similarities in the response patterns of DMAF and its derivatives to interactions with bacteria of the same Gram status were highlighted in our earlier report,22 and were used to accurately predict the Gram status of unknown species (i.e. those that were not included in the training data). The localization of DMAF in the bacterial cell envelopes of both Gram-positive and Gram-negative bacteria was confirmed by fluorescence microscopy (Fig. S5†). These results support the hypothesis that the structural differences in bacterial cell envelopes lead to unique spectral responses upon DMAF's interaction with bacteria.
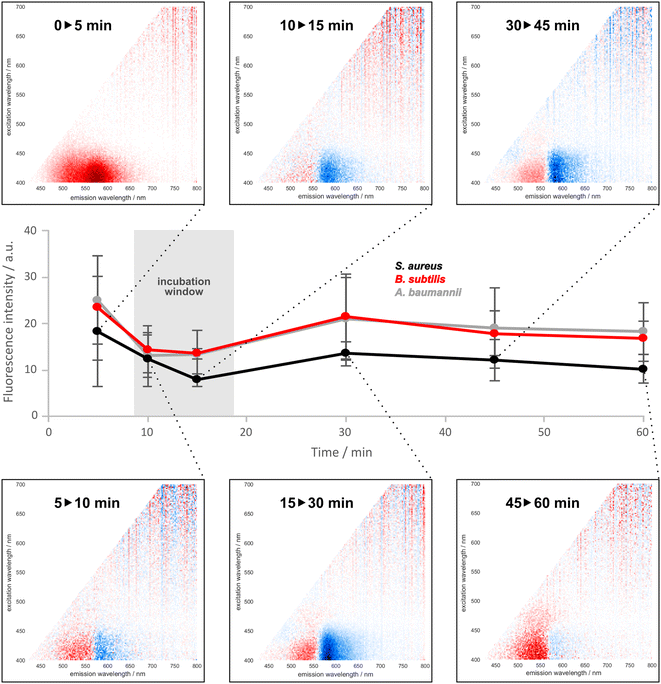
Dye–bacteria interaction dynamics were studied to establish the optimal incubation time. In this experiment, we considered the overall change of fluorescence intensity across the excitation–emission surface as a measure of the excitation energy redistribution over time. For each pair of adjacent time points, a difference matrix was generated (shown in panels in Fig. 3 are those for S. aureus), and the sum of absolute values of the matrix elements was calculated. These data are presented on the y axis of Fig. 3. In the initial period (0–5 minutes), a significant increase of the fluorescence intensity is observed across the entire emission range of DMAF, with a notable prevalence of the tautomeric emission. This corresponds to the penetration of DMAF from PBS into the bacterial cell envelope: a decrease in the dye's interactions with water (a polar protic solvent) and an increase in interactions with large molecules within the bacterial cell lead to less intensive solvent-induced fluorescence quenching37,38 and an increase of the emission intensity in a more rigid surrounding.
In the later time intervals (5–10 minutes and later), a consistent decrease of the fluorescence intensity is observed in the area of the tautomer emission, with a simultaneous increase of the fluorescence in the spectral range of the normal and hydrogen-bonded forms of DMAF. This is consistent with the dye's interactions with specific components of the bacterial cell envelope, such as peptidoglycan in the Gram-positive bacteria or lipopolysaccharides in the Gram-negative bacteria. From the changes in the overall fluorescence intensity, it can be seen that the process becomes more notable around the 30 minute time point. At the same time, in the period around 10–20 minutes, a local minimum of intensity change is observed for all three investigated bacteria. The choice of the incubation time within this window is dictated by practical considerations: if the method is applied in practice, performing a measurement when the changes in the signal (shape of the excitation–emission spectrum) are minimal will ensure better reproducibility and help minimize potential errors. Therefore, it was determined to use 15 minutes as the incubation time for further experiments.
The concentration of bacteria used in the majority of the experiments was based on the success of our previously-reported solution-based sensor.22 Spectra were recorded for a series of samples with increasing content of DMAF to determine the optimal dye concentration that will generate the signal intensity in the middle of the instrument's dynamic range for the bacterial strains used. The aim was to prevent the oversaturation of the detector, while ensuring that the signal intensity was at least five times greater than the background intensity.
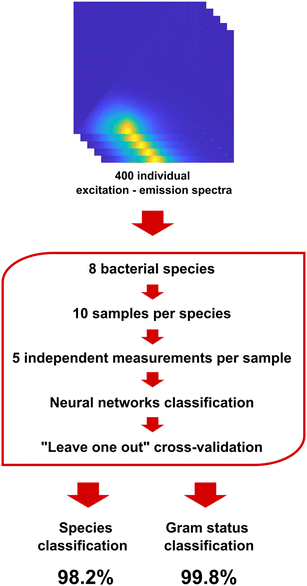
The primary objective of this work was to demonstrate the capability of DMAF to effectively differentiate between various pathogenic bacteria. To achieve this, an extensive library of spectral responses from 8 bacterial species was generated, comprising 50 independent measurements for each bacterium. This comprehensive dataset was crucial for training the pattern recognition software and ensuring a robust foundation for subsequent classification (Fig. 4). Classification accuracy was chosen as the main measure of the sensor's performance and was determined in a series of cross-validation experiments where ∼20% of the data was randomly used as a testing dataset, and the remaining part of the response library was used for training of the neural network classifier. As seen in Table 1, the classification accuracy achieved in this experiment exceeded 98%.
| Bacteria | Total | Correct | % correct |
|---|---|---|---|
| A. baumannii | 76 | 75 | 98.7 |
| B. subtilis | 74 | 69 | 93.2 |
| C. freundii | 66 | 66 | 100 |
| E. coli | 65 | 65 | 100 |
| E. faecalis | 69 | 67 | 97.1 |
| K. pneumoniae | 77 | 75 | 97.4 |
| S. aureus | 86 | 86 | 100 |
| S. epidermidis | 82 | 81 | 98.8 |
| Total | 595 | 584 | 98.2 |
Interestingly, the analysis of the confusion matrices showed that more than half of the false positive misclassifications occurred within the same Gram status. This observation aligns with the logical premise discussed above that the Gram status represents the highest level of structural distinction among bacteria: presence or absence of the outer membrane, as well as significant differences in the structure and composition of the peptidoglycan layer, should be reliably discerned by the dye upon interacting with the bacterial cell envelope. Consequently, the same dataset showed a 99+% classification accuracy when discerning Gram status, further reinforcing its efficacy in the discrimination of bacterial species (Table 2).
| Bacteria | Total | Correct | % correct |
|---|---|---|---|
| Gram-positive | 308 | 308 | 100 |
| Gram-negative | 292 | 291 | 99.7 |
| Total | 600 | 599 | 99.8 |
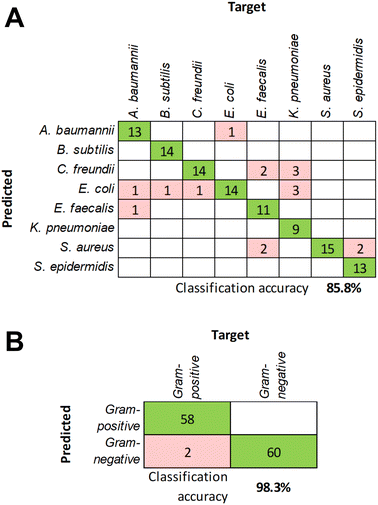
To further validate the classification model, additional independent measurements were performed to collect responses from all eight bacteria. Using those as unknowns and the previously compiled response dataset for training, the classification accuracy at the species level was determined to be 85.8% (Fig. 5A). The decrease of the accuracy compared to the cross-validation results may be due to limited training data. Acquiring data for each bacterial species during several measurement sessions will also increase the model's tolerance to slight variations in the response signals. At the same time, the classification accuracy at the Gram status level remained exceptionally high at 98.3% (Fig. 5B), which underscores the robust differences in the response patterns between Gram-positive and Gram-negative bacteria due to the structural differences in their cell envelope discussed above.
Two representative bacterial species (one Gram-positive, S. aureus, and one Gram-negative, E. coli) were selected to characterize the performance of the sensor at lower concentrations of bacteria. The sensor's performance threshold is not only important for understanding the sensitivity of the method, but also for practical applications. Being able to analyze samples with lower concentrations of bacteria translates into shortened culture times, thereby decreasing the overall time from sample collection to a reliable diagnostic decision. The signal intensity appears to be significantly dependent on the concentration of bacteria (Fig. 6): an increase in the latter leads to a dramatic rise of the fluorescence. At the same time, as discussed above, DMAF that had no interaction with bacterial cells remains quenched by the solvent and aggregation, thus mitigating its possible interference with the signal from the dye molecules inside the bacterial cell envelope.
The minimal concentration of bacteria at which the sensor can reliably detect their presence in the sample (limit of detection, LOD) and the minimal concentration at which the sensor achieves the identification of the bacterial species present in the sample (limit of identification, LOI) were determined. To assess the LOD, the accuracy of classification between the responses from DMAF to pure PBS and a sample containing bacteria was studied. As can be seen from the Table 3, the classification accuracy rises from 60–70% at ∼3 × 10⁴ CFU mL−1 to 80+% at concentrations reaching approximately 107 CFU mL−1. The LOI was assessed by studying the accuracy of classification between two different bacterial species. In this case, the model's performance starts around 50% (which means that the accuracy is close to random) at lower concentrations and rises to 90+% at concentrations around 5 × 10⁷ CFU mL−1. As discussed above, there is a significant difference between the dye's response to the sample containing any bacteria compared to its signal in pure PBS. The spectral differences between the samples containing two different bacterial species are relatively less notable (Fig. 1). This explains the lower observed performance of the model in identification of bacterial species compared to the detection of their presence in the sample at lower concentrations.
| Concentration (CFU mL−1) | Classification accuracy (%) | ||
|---|---|---|---|
| LOD | LOI | ||
| S. aureus vs. PBS | E. coli vs. PBS | S. aureus vs. E. coli | |
| 2.7 × 10⁴ | 69 | 63 | 50 |
| 5.3 × 10⁵ | 67 | 62 | 47 |
| 5.3 × 10⁶ | 75 | 88 | 81 |
| 2.7 × 10⁷ | 84 | 87 | 75 |
| 5.3 × 10⁷ | 89 | 84 | 90 |
| 1.3 × 10⁸ | 98 | 99 | 96 |
| 2.7 × 10⁸ | 97 | 97 | 100 |
| 5.3 × 10⁸ | 100 | 99 | 100 |
| 1.3 × 10⁹ | 96 | 100 | 100 |
| 2.7 × 10⁹ | 100 | 100 | 100 |
Conclusions
The integration of the excitation–emission spectroscopy of an environmentally sensitive fluorescent dye and pattern analysis using machine learning presents a promising approach for developing a streamlined and cost-effective diagnostic solution. Interaction of the dye with components of the bacterial cell envelope generates unique data-rich spectral responses for each bacterial species. This multidimensional fluorescent sensor stands out for its non-specificity to a particular target and its high accuracy in distinguishing between various pathogenic bacteria. In our experiments with eight species of pathogenic bacteria, we achieved the classification accuracy of the unknowns over 85%. With the potential for substantial expansion of the pathogen library in the future, this versatile platform holds promise for enhancing diagnostic capabilities in low-resource settings. These findings contribute to the advancement of diagnostic technologies, emphasizing the potential impact on timely disease diagnosis, appropriate treatment administration, and effective containment of microbial infections.Data availability
Data supporting this manuscript are included in the ESI.† Original training data for the classification model is available by request from the authors.Author contributions
JH: formal analysis, funding acquisition, investigation, methodology, visualization, writing – original draft; JLE: investigation, methodology, writing – review & editing; MRS: investigation, methodology, validation, writing – review & editing; KWB: funding acquisition, resources, supervision, writing – review & editing; DS: conceptualization, data curation, funding acquisition, investigation, methodology, project administration, resources, supervision, validation, writing – original draft, writing – review & editing.Conflicts of interest
The authors declare no conflicts.Acknowledgements
This work was supported in part by the University of Nebraska at Omaha (DS), and P01 AI83211 and R01 AI125589 (KB). JH acknowledges support from the UNO Fund for Undergraduate Scholarly Experiences.References
- R. Franco-Duarte, L. Černáková, S. Kadam, K. Kaushik, B. Salehi, A. Bevilacqua, M. R. Corbo, H. Antolak, K. Dybka-Stępień, M. Leszczewicz, S. Relison Tintino, V. C. A. De Souza, J. Sharifi-Rad, H. D. Melo Coutinho, N. Martins and C. F. Rodrigues, Advances in Chemical and Biological Methods to Identify Microorganisms—From Past to Present, Microorganisms, 2019, 7(5), 130, DOI:10.3390/microorganisms7050130.
- M. Sinha, J. Jupe, H. Mack, T. P. Coleman, S. M. Lawrence and S. I. Fraley, Emerging Technologies for Molecular Diagnosis of Sepsis, Clin. Microbiol. Rev., 2018, 31(2), e00089-17, DOI:10.1128/CMR.00089-17.
- J. McLeod, C. Park, A. Cunningham, L. O'Donnell, R. S. Brown, F. Kelly and Z. She, Developing a Toll-like Receptor Biosensor for Gram-Positive Bacterial Detection and Its Storage Strategies, Analyst, 2020, 145(18), 6024–6031, 10.1039/D0AN01050B.
- K. Chuensirikulchai, W. Laopajon, P. Phunpae, N. Apiratmateekul, S. Surinkaew, C. Tayapiwatana, S. Pata and W. Kasinrerk, Sandwich Antibody-Based Biosensor System for Identification of Mycobacterium Tuberculosis Complex and Nontuberculous Mycobacteria, J. Immunoassay Immunochem., 2019, 40(6), 590–604, DOI:10.1080/15321819.2019.1659814.
- M.-S. Song, S. Sekhon, W.-R. Shin, H. Kim, J. Min, J.-Y. Ahn and Y.-H. Kim, Detecting and Discriminating Shigella Sonnei Using an Aptamer-Based Fluorescent Biosensor Platform, Molecules, 2017, 22(5), 825, DOI:10.3390/molecules22050825.
- A. S. Klymchenko, Solvatochromic and Fluorogenic Dyes as Environment-Sensitive Probes: Design and Biological Applications, Acc. Chem. Res., 2017, 50(2), 366–375, DOI:10.1021/acs.accounts.6b00517.
- Y. Niko and A. S. Klymchenko, Emerging Solvatochromic Push–Pull Dyes for Monitoring the Lipid Order of Biomembranes in Live Cells, J. Biochem., 2021, 170(2), 163–174, DOI:10.1093/jb/mvab078.
- A. Sytnik, D. Gormin and M. Kasha, Interplay between Excited-State Intramolecular Proton Transfer and Charge Transfer in Flavonols and Their Use as Protein-Binding-Site Fluorescence Probes, Proc. Natl. Acad. Sci. U. S. A., 1994, 91(25), 11968–11972, DOI:10.1073/pnas.91.25.11968.
- D. A. Svechkarev, I. V. Bukatich and A. O. Doroshenko, New 1,3,5-Triphenyl-2-Pyrazoline-Containing 3-Hydroxychromones as Highly Solvatofluorochromic Ratiometric Polarity Probes, J. Photochem. Photobiol., A, 2008, 200(2–3), 426–431, DOI:10.1016/j.jphotochem.2008.09.005.
- J. R. Askim, M. Mahmoudi and K. S. Suslick, Optical Sensor Arrays for Chemical Sensing: The Optoelectronic Nose, Chem. Soc. Rev., 2013, 42(22), 8649, 10.1039/c3cs60179j.
- W. J. Peveler, M. Yazdani and V. M. Rotello, Selectivity and Specificity: Pros and Cons in Sensing, ACS Sens., 2016, 1(11), 1282–1285, DOI:10.1021/acssensors.6b00564.
- L. Zhang, X. Huang, Y. Cao, Y. Xin and L. Ding, Fluorescent Binary Ensemble Based on Pyrene Derivative and Sodium Dodecyl Sulfate Assemblies as a Chemical Tongue for Discriminating Metal Ions and Brand Water, ACS Sens., 2017, 2(12), 1821–1830, DOI:10.1021/acssensors.7b00634.
- R. L. Pérez, M. Cong, S. R. Vaughan, C. E. Ayala, W. I. S. Galpothdeniya, J. K. Mathaga and I. M. Warner, Protein Discrimination Using a Fluorescence-Based Sensor Array of Thiacarbocyanine-GUMBOS, ACS Sens., 2020, 5(8), 2422–2429, DOI:10.1021/acssensors.0c00484.
- W. J. Peveler, R. F. Landis, M. Yazdani, J. W. Day, R. Modi, C. J. Carmalt, W. M. Rosenberg and V. M. Rotello, A Rapid and Robust Diagnostic for Liver Fibrosis Using a Multichannel Polymer Sensor Array, Adv. Mater., 2018, 30(28), 1800634, DOI:10.1002/adma.201800634.
- Z. Li and K. S. Suslick, Portable Optoelectronic Nose for Monitoring Meat Freshness, ACS Sens., 2016, 1(11), 1330–1335, DOI:10.1021/acssensors.6b00492.
- Z. Li and K. S. Suslick, A Hand-Held Optoelectronic Nose for the Identification of Liquors, ACS Sens., 2018, 3(1), 121–127, DOI:10.1021/acssensors.7b00709.
- B. A. Suslick, L. Feng and K. S. Suslick, Discrimination of Complex Mixtures by a Colorimetric Sensor Array: Coffee Aromas, Anal. Chem., 2010, 82(5), 2067–2073, DOI:10.1021/ac902823w.
- C. Zhang, D. P. Bailey and K. S. Suslick, Colorimetric Sensor Arrays for the Analysis of Beers: A Feasibility Study, J. Agric. Food Chem., 2006, 54(14), 4925–4931, DOI:10.1021/jf060110a.
- J. R. Carey, K. S. Suslick, K. I. Hulkower, J. A. Imlay, K. R. C. Imlay, C. K. Ingison, J. B. Ponder, A. Sen and A. E. Wittrig, Rapid Identification of Bacteria with a Disposable Colorimetric Sensing Array, J. Am. Chem. Soc., 2011, 133(19), 7571–7576, DOI:10.1021/ja201634d.
- R. L. Phillips, O. R. Miranda, C. You, V. M. Rotello and U. H. F. Bunz, Rapid and Efficient Identification of Bacteria Using Gold-Nanoparticle–Poly(Para-phenyleneethynylene) Constructs, Angew. Chem., Int. Ed., 2008, 47(14), 2590–2594, DOI:10.1002/anie.200703369.
- J. Han, H. Cheng, B. Wang, M. S. Braun, X. Fan, M. Bender, W. Huang, C. Domhan, W. Mier, T. Lindner, K. Seehafer, M. Wink and U. H. F. Bunz, A Polymer/Peptide Complex-Based Sensor Array That Discriminates Bacteria in Urine, Angew. Chem., Int. Ed., 2017, 56(48), 15246–15251, DOI:10.1002/anie.201706101.
- D. Svechkarev, M. R. Sadykov, K. W. Bayles and A. M. Mohs, Ratiometric Fluorescent Sensor Array as a Versatile Tool for Bacterial Pathogen Identification and Analysis, ACS Sens., 2018, 3(3), 700–708, DOI:10.1021/acssensors.8b00025.
- D. Svechkarev, M. R. Sadykov, L. J. Houser, K. W. Bayles and A. M. Mohs, Fluorescent Sensor Arrays Can Predict and Quantify the Composition of Multicomponent Bacterial Samples, Front. Chem., 2020, 7, 916, DOI:10.3389/fchem.2019.00916.
- A. Laliwala, D. Svechkarev, M. R. Sadykov, J. Endres, K. W. Bayles and A. M. Mohs, Simpler Procedure and Improved Performance for Pathogenic Bacteria Analysis with a Paper-Based Ratiometric Fluorescent Sensor Array, Anal. Chem., 2022, 94(5), 2615–2624, DOI:10.1021/acs.analchem.1c05021.
- A.-Q. Chen, H.-L. Wu, T. Wang, X.-Z. Wang, H.-B. Sun and R.-Q. Yu, Intelligent Analysis of Excitation-Emission Matrix Fluorescence Fingerprint to Identify and Quantify Adulteration in Camellia Oil Based on Machine Learning, Talanta, 2023, 251, 123733, DOI:10.1016/j.talanta.2022.123733.
- R. C. Murugesan, M. T. A. Choudhury and A. Rozhin, 2D Excitation-Emission Fluorescence Mapping Analysis of Plant Food Pigments, Food Chem., 2023, 418, 135875, DOI:10.1016/j.foodchem.2023.135875.
- N. Rahmani and A. Mani-Varnosfaderani, Excitation-Emission Fluorescence Spectroscopy and Sparse Chemometric Methods for Grape Seed Oil Classification and Authentication, Chemom. Intell. Lab. Syst., 2023, 241, 104939, DOI:10.1016/j.chemolab.2023.104939.
- L. Li, Y. Wang, W. Zhang, S. Yu, X. Wang and N. Gao, New Advances in Fluorescence Excitation-Emission Matrix Spectroscopy for the Characterization of Dissolved Organic Matter in Drinking Water Treatment: A Review, Chem. Eng. J., 2020, 381, 122676, DOI:10.1016/j.cej.2019.122676.
- E. H. De Paulo, G. B. Magalhães, M. P. B. Moreira, M. H. C. Nascimento, O. A. Heringer, P. R. Filgueiras and M. F. Ferrão, Classification of Water by Bacterial Presence Using Chemometrics Associated with Excitation-Emission Matrix Fluorescence Spectroscopy, Microchem. J., 2024, 197, 109804, DOI:10.1016/j.microc.2023.109804.
- L. R. Dartnell, T. A. Roberts, G. Moore, J. M. Ward and J.-P. Muller, Fluorescence Characterization of Clinically-Important Bacteria, PLoS One, 2013, 8(9), e75270, DOI:10.1371/journal.pone.0075270.
- J. D. Walsh, J. M. Hyman, L. Borzhemskaya, A. Bowen, C. McKellar, M. Ullery, E. Mathias, C. Ronsick, J. Link, M. Wilson, B. Clay, R. Robinson, T. Thorpe, A. Van Belkum and W. M. Dunne, Rapid Intrinsic Fluorescence Method for Direct Identification of Pathogens in Blood Cultures, MBio, 2013, 4(6), e00865-13, DOI:10.1128/mBio.00865-13.
- O. Opota, A. Croxatto, G. Prod'hom and G. Greub, Blood Culture-Based Diagnosis of Bacteraemia: State of the Art, Clin. Microbiol. Infect., 2015, 21(4), 313–322, DOI:10.1016/j.cmi.2015.01.003.
- A. S. Klymchenko and A. P. Demchenko, Multiparametric Probing of Intermolecular Interactions with Fluorescent Dye Exhibiting Excited State Intramolecular Proton Transfer, Phys. Chem. Chem. Phys., 2003, 5(3), 461–468, 10.1039/b210352d.
- B. Dereka, R. Letrun, D. Svechkarev, A. Rosspeintner and E. Vauthey, Excited-State Dynamics of 3-Hydroxyflavone Anion in Alcohols, J. Phys. Chem. B, 2015, 119(6), 2434–2443, DOI:10.1021/jp507311n.
- V. V. Shynkar, A. S. Klymchenko, Y. Mély, G. Duportail and V. G. Pivovarenko, Anion Formation of 4′-(Dimethylamino)-3-Hydroxyflavone in Phosphatidylglycerol Vesicles Induced by HEPES Buffer: A Steady-State and Time-Resolved Fluorescence Investigation, J. Phys. Chem. B, 2004, 108(48), 18750–18755, DOI:10.1021/jp0467189.
- D. Svechkarev, A. Kyrychenko, W. M. Payne and A. M. Mohs, Probing the Self-Assembly Dynamics and Internal Structure of Amphiphilic Hyaluronic Acid Conjugates by Fluorescence Spectroscopy and Molecular Dynamics Simulations, Soft Matter, 2018, 14(23), 4762–4771, 10.1039/C8SM00908B.
- B. Dereka and E. Vauthey, Direct Local Solvent Probing by Transient Infrared Spectroscopy Reveals the Mechanism of Hydrogen-Bond Induced Nonradiative Deactivation, Chem. Sci., 2017, 8(7), 5057–5066, 10.1039/C7SC00437K.
- J. Maillard, K. Klehs, C. Rumble, E. Vauthey, M. Heilemann and A. Fürstenberg, Universal Quenching of Common Fluorescent Probes by Water and Alcohols, Chem. Sci., 2021, 12(4), 1352–1362, 10.1039/D0SC05431C.
Footnote |
| † Electronic supplementary information (ESI) available: Excitation–emission responses of all eight bacterial species, as well as confocal fluorescence micrographs showing localization of DMAF in bacterial cells, are presented in supplementary information available for download. See DOI: https://doi.org/10.1039/d4sd00070f |
| This journal is © The Royal Society of Chemistry 2024 |

