 Open Access Article
Extracellular vesicle analysis in supramolecular 3D hydrogels: a proof-of-concept†
Greta
Bergamaschi‡
 *a,
Roberto
Frigerio‡
a,
Angelo
Musicò
a,
Giulia
Lodigiani
a,
Paola
Gagni
 a,
Riccardo
Vago
b,
Marina
Cretich
*a and
Alessandro
Gori
*a
aIstituto di Scienze e Tecnologie Chimiche “Giulio Natta” – National Research Council of Italy (SCITEC-CNR), 20131 Milan, Italy
bUrological Research Institute, Division of Experimental Oncology, IRCCS San Raffaele Scientific Institute, Università Vita-Salute San Raffaele, Milano, Italy
First published on 19th February 2024
Abstract
In the present work, we report a proof-of-concept application of a composite Aga-Q3 hydrogel for the gentle confinement and analysis of extracellular vesicles (EVs) on microarray analytical platforms. Thanks to their peculiar functional properties, our 3D microdroplets are suitable to phenotype EVs with specific anti-surface antigen bioprobes, including antibodies and peptides.
Hydrogel materials have grown in popularity in recent years thanks to their versatility and diverse application possibilities, including the development of drug delivery systems, tissue engineering, biosensing platforms, and diagnostic biosensors.1–6 A fundamental figure of merit of hydrogels is that they can be tailored to mimic the biological milieu where biomolecular interactions occur.7
On these bases, the field of three-dimensional (3D) immunoassays is an expanding niche of hydrogel applications, where they are used as soft matrices to locally confine biomolecules onto analytical surfaces under semi-wet, native-like conditions. Efforts toward next-generation 3D immunoassays are fuelled by some appealing and relevant advantages over conventional planar, two-dimensional (2D) systems, such as increased loading capacity, lower nonspecific binding, and an improved signal-to-noise ratio.8–10
In this scenario, there has been an increased interest in composite hydrogels, which consist of blends of distinct nanostructured (bio)materials with synergically improved properties. The favourable supramolecular interactions that are established between the individual components can indeed induce new functional properties in the resulting blend, thus expanding possible application opportunities.8,11,12
Our group has recently contributed to this field by exploiting either peptide-based or composite hydrogels to realize microdroplet arrays, which we applied in the field of immunodiagnostics. In particular, our findings showed that the use of composite hydrogels obtained by the combination of a self-assembling peptide (Q3 peptide) with low-temperature gelling agarose (Aga) is ideal to balance hydrogel functional and mechanical properties.13
Herein, we propose a proof-of-concept study in the application of our composite Aga-Q3 hydrogel for the gentle confinement and analysis of extracellular vesicles (EVs) on microarray platforms. Extracellular vesicles (EVs) are cell-derived bio-nanoparticles that are arising with almost unprecedented expectations as circulating carriers of biomolecular information to be decoded for diagnostic purposes.14 EVs, depending on their biogenesis pathway, can be categorized into endosome-origin exosomes (50–150 nm), plasma-membrane-derived microvesicles (50–1000 nm) (MVs), and apoptotic bodies (500–2000 nm). However, achieving a precise distinction remains exceptionally challenging in routine practices due to the lack of a consensus on specific markers for EV subtypes. Notably, exosomes and MVs exhibit size overlap and share numerous known biomarkers enriched in EVs. As a result, the ISEV (International Society for Extracellular Vesicles) guidelines15 recommend concurrent classifications based on physical EV characteristics such as size or density. Specifically, the existing literature emphasizes that within the diverse array of extracellular vesicles, small EVs (30–250 nm)15–18 are key players in intercellular communication, assuming a crucial role in various pathological conditions, especially cancer metastasis.19,20 As such, they are broadly investigated as a promising class of EVs from both diagnostic and prognostic perspectives. On the other hand, EV analysis is facing remarkable challenges due to the peculiarities of these bioanalytes, and new methodologies are still needed to complement current technologies in EV analysis.21–24 Among the reference strategies presently employed for the analysis of EVs, the protein microarray platform plays a pivotal role in phenotyping EVs.25 In this technique, a panel of antibodies are employed to selectively capture EVs on an analytical surface targeting their most common surface proteins (e.g. tetraspanins, Annexin V). Subsequently, characteristic transmembrane proteins are detected through fluorescence-based immune staining. This strategy has been applied to the analysis of antibody-captured vesicles and also in a label-free mode, for example using surface plasmon resonance imaging (SPRi)26 and a single particle interferometric reflectance imaging sensor (SP-IRIS).27 However, targeting surface-exposed proteins for capturing presents several drawbacks, including potential bias due to soluble antigens, variability in antibody specificity and affinity, and poor or fluctuating relative abundance of surface protein markers.
In this work, we present a different approach by showing that small EVs can be successfully confined within our Aga-Q3 composite hydrogel through physical entrapment, without the need for specific surface targeting. This represents an unbiased technology for phenotyping EVs, potentially expanding the range of molecular tools available and enhancing analytical consistency.
We provide a proof-of-concept that microdroplet arrays are suitable systems to phenotype EVs by specific anti-surface antigen bioprobes, including antibodies and peptides.
The direct application of hydrogels in 3D microdroplet arrays is closely bound to the preservation of a narrow window of ideal rheological properties, which are prerequisites for hydrogel printability and physical stability under assay conditions.
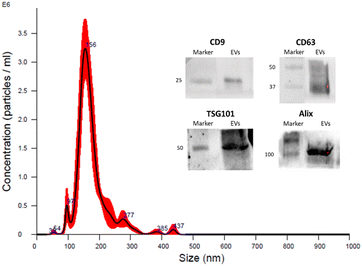
Then, to assess the properties of our composite hydrogels in the presence of EVs, we probed the rheologic properties of the composite materials by mixing Q3, Aga and EVs in a phosphate-buffered saline (PBS) buffer. With this goal, EVs from the conditioned HEK medium were isolated by sequential centrifugations as previously reported28 and characterised according to the guidelines,15 by nanoparticle tracking analysis (NTA) and western blotting (WB) to demonstrate the presence of the EV membrane surface and luminal proteins (see further details in the ESI†). Results confirmed the presence of vesicles with size and protein content compatible with EVs as shown in Fig. 1. Moreover, TEM analysis was also performed to assess the morphology of EVs (see Fig. S2†).
 | ||
| Fig. 1 Characterisation of isolated EVs from the HEK cell line performed by NTA and WB. Inset: the presence of transmembrane proteins CD63 and CD9 and luminal proteins ALIX and TSG101 was assessed by western blotting (see the ESI†). The HEK-EV preparation resulted positive for all the four proteins. Results of the analysis by NTA provided a mean particle size of 176 ± 3 nm and a concentration of 2.1 × 10¹¹ particles per mL. | ||
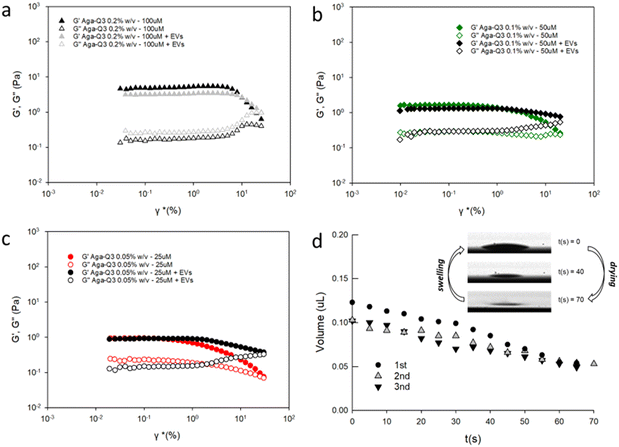
Afterwards, a Q3 peptide stock solution (1 mM) was diluted at different concentrations (25–100 μM) in Aga solution (0.05–0.2% w/v) in PBS, and EVs added at a final concentration of 1010 EVs per mL, which is in the upper range of concentration typically used in EV microarray analysis.29,30 The formation of transparent gels was not impaired by the presence of EVs, as determined by oscillatory rheological measurements (Fig. 2), showing that all the tested samples behaved like typical viscoelastic fluids.
 | ||
| Fig. 2 Comparison between strain sweep experiments (linear Visco elastic region) obtained for different concentrations of Aga-Q3 mixtures13 and Aga-Q3-EV (fixed concentration at 1010 EVs mL−1) mixtures in PBS, detailed as follows: (a) Aga-Q3 0.2% w/v −100 μM (grey solid) and Aga-Q3 0.2% w/v −100 μM with EVs (black solid); (b) Aga-Q3 0.1% w/v −50 μM (green solid) and Aga-Q3 0.1% w/v −50 μM with EVs (black solid); (c) Aga-Q3 0.05% w/v −25 μM (red solid) and Aga-Q3 0.05% w/v −25 μM with EVs (black solid). Oscillation amplitude table: frequency 0.3000 Hz, 10 samples per decade. Each analysis was repeated three times, and representative measures are reported. (d) Drop shape analysis performed by contact angle measurements. Aga-Q3 0.05% w/v −25 μM with EV droplet volume observation by video capturing over three repeated drying/rehydration steps. Inset: hydrogel spots on a microarray slide. | ||
Of note, the presence of EVs within the hydrogel matrix only affected hydrogel deformation properties to a negligible extent, thereby excluding a detrimental effect on its structural properties. The G′ module for EV-loaded hydrogels was 8 Pa, within the G′ reference value of <10 Pa that is to be considered for compatibility with the microfluidic apparatus and successful direct microarray printing. Printed microdroplets also retained their characteristic sponge-like behavior, reversibly maintaining their volume over repeated cycles of drying and swelling, as verified by drop shape analysis.
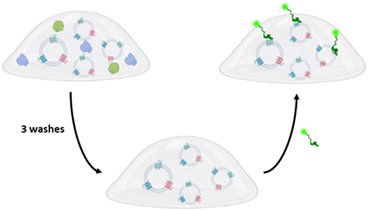
Supported by the favorable premises, we designed a model test to assess the potentialities of our 3D system in EV-microarrays (Fig. 3). EV samples were added (1010 EVs per mL) to the hydrogel matrix under the Aga-Q3 optimized conditions (25 μM Q3/0.05% w/v Aga) and directly spotted on the SiO2 layer as previously described (see the ESI†). As already demonstrated in our previous paper,13,31 the selective tuning of hydrogel microstructure allows us to control the permeation of various analytes differentially, with the hydrodynamic radii of biomolecules controlling the diffusion properties through the hydrogel. In this line, the hydrogel composition was finely optimized to selectively allow the diffusion of antibodies and peptide bioprobes while ideally retaining extracellular vesicles (EVs).
Microdroplet arrays were tested in EV-phenotyping immunoassays through the incubation of fluorescently labelled probes (antibodies and peptides) directed against tetraspanins CD81 and CD63, some of the most common EV-associated surface markers reported in the literature, for which specific peptide binders with nM affinity have already been described.32 Empty gel spots were used as negative controls. A fluorescence response was clearly detectable in EV-loaded spots, demonstrating that the vesicles are stably entrapped, and that the 3D matrix is permeable to probes that can specifically recognize the EV-associated tetraspanin markers. Negligible signals were instead detected in empty control spots, excluding the role of nonspecific probes–matrix interactions. Of note, the peptide probe showed higher fluorescence signals than anti-tetraspanin antibodies in the same experimental concentration (Fig. 4).
This can be ascribed to improved peptide diffusion through the matrix, which is related to the hydrodynamic radii of the differently sized bioprobes.31 In order to estimate the lower concentration of peptides suitable to obtain a significant signal, we tested serial dilution concentrations of Cy3-CD81 and Cy3-CD63 peptide probes (from 500 nM to 2 nM). Experimental results highlight that a statistical difference can be observed until a concentration of 2 nM for both peptides (Fig. 4 and S1†). To assess how the 3D system performs in comparison to more canonical assays, we performed a conventional microarray experiment for detecting EVs in a 2D format, exploiting a pan-tetraspanin panel of antibodies (CD9/CD63/CD81) directly spotted on the analytical surface for EV capturing (further experimental details are provided in the ESI†). However, it should be emphasized that this does not constitute a true direct comparison due to possible variability in CD9/CD63/CD81 abundance.
From the experimental results, the 3D assay showed better performances than the conventional planar 2D assays probably due to a more favorable interaction of epitope probes in the semi-wet system, combined with increased surface loading capacity (see Fig. S3†).13,31
We then moved to investigate the use of the composite hydrogels to detect putative EV-based biomarkers involved under pathological conditions, e.g., cancer diseases.
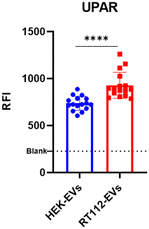
According to the driving principles of liquid biopsy applications, it is indeed well known that EVs derived from tumor cells are enriched with specific biomarkers, as their content reflects the nature and status of progenitor cells.33,34 In this context, extensive evidence has highlighted that the presence of EVs–uPAR (urokinase-type plasminogen activator receptor) expression in plasma patients could be a powerful diagnostic biomarker in the pathophysiology of cancer dissemination (e.g. breast cancer, bladder cancer and melanoma).35–37 Moreover, it has been demonstrated that an increase in EVs–uPAR levels could be connected to drug-resistant mechanisms in cancer treatment, underlining the importance of uPAR in prognosis and providing a useful predictor of high-risk patients.38 With this aim, we synthesized the fluorescent conjugate of a non-natural peptide that showed great targeting properties toward uPAR.39 Based on the experimental conditions optimized above, EV-phenotyping immunoassays were performed to compare the expression of uPAR in two distinct EV preparations (HEK-EVs and RT112-EVs). RT112 is a grade 2 bladder cancer cell line, representative of luminal-like FGFR3-driven cancer, and expresses uPAR on the surface.40 The results showed a statistical difference between the two sample cohorts, demonstrating that microdroplet arrays can indeed represent a suitable platform for EV phenotyping aimed at distinguishing EV subpopulations with prospective clinical relevance (Fig. 5).
In conclusion, we provided a proof-of-concept demonstration of the use of composite peptide–agarose hydrogel microarrays for physically entrapping EVs within a 3D environment, thus avoiding any possible bias due to the differential expression of surface markers usually employed for antibody-mediated capture. Thanks to the hydrogel structural features, direct phenotyping of confined EVs could be performed exploiting different bioprobes.
Importantly, the hydrogel matrix did not interfere with the molecular recognition of EVs, nor did it show nonspecific interactions, allowing biomolecular diffusion of bioprobes and their specific target recognition, including clinically relevant ones. Due to the high versatility and robustness of this sensing platform, we foresee future applications in the multimodal and multiplexed analysis of extracellular vesicles for liquid biopsy-oriented applications.
Author contributions
GB: conceptualization, supervision, resources, writing – review & editing, and methodology. RF: data analysis, validation, and investigation. AM: validation, investigation, and data analysis. GL: investigation and editing. PG: investigation and data analysis. RV: data analysis, validation, and investigation. MC and AG: supervision, writing – review, and funding acquisition.Conflicts of interest
There are no conflicts to declare.Acknowledgements
This work was supported by the project HYDROGEX – grant no. 2018-1720, by Fondazione Cariplo and Regione Lombardia.References
- A. Herrmann, R. Haag and U. Schedler, Adv. Healthcare Mater., 2021, 10, 2100062 CrossRef CAS PubMed.
- T. Billiet, M. Vandenhaute, J. Schelfhout, S. Van Vlierberghe and P. Dubruel, Biomaterials, 2012, 33, 6020–6041 CrossRef CAS PubMed.
- N. Sood, A. Bhardwaj, S. Mehta and A. Mehta, Drug Delivery, 2016, 23, 748–770 CrossRef CAS PubMed.
- Q. Tang, T. N. Plank, T. Zhu, H. Yu, Z. Ge, Q. Li, L. Li, J. T. Davis and H. Pei, ACS Appl. Mater. Interfaces, 2019, 11, 19743–19750 CrossRef CAS PubMed.
- Y. Guo, Z. Bian, Q. Xu, X. Wen, J. Kang, S. Lin, X. Wang, Z. Mi, J. Cui, Z. Zhang, Z. Chen and F. Chen, Mater. Sci. Eng., C, 2021, 130, 112469 CrossRef CAS PubMed.
- R. Zhong, Q. Tang, S. Wang, H. Zhang, F. Zhang, M. Xiao, T. Man, X. Qu, L. Li, W. Zhang and H. Pei, Adv. Mater., 2018, 30, 1706887 CrossRef PubMed.
- H. Cao, L. Duan, Y. Zhang, J. Cao and K. Zhang, Signal Transduction Targeted Ther., 2021, 6, 426 CrossRef CAS PubMed.
- X. Wang, O. Ronsin, B. Gravez, N. Farman, T. Baumberger, F. Jaisser, T. Coradin and C. Hélary, Adv. Sci., 2021, 8, 2004213 CrossRef CAS PubMed.
- M. Rocca, M. Dufresne, M. Salva, C. M. Niemeyer and E. Delamarche, Angew. Chem., Int. Ed., 2021, 60, 24064–24069 CrossRef CAS PubMed.
- A. Stumpf, T. Brandstetter, J. Hübner and J. Rühe, PLoS One, 2019, 14, e0225525 CrossRef CAS PubMed.
- J. Mitrovic, G. Richey, S. Kim and M. O. Guler, Langmuir, 2023, 39, 11935–11945 CrossRef CAS PubMed.
- K. Firipis, M. Boyd-Moss, B. Long, C. Dekiwadia, W. Hoskin, E. Pirogova, D. R. Nisbet, R. M. I. Kapsa, A. F. Quigley and R. J. Williams, ACS Biomater. Sci. Eng., 2021, 7, 3340–3350 CrossRef CAS PubMed.
- G. Bergamaschi, A. Musicò, R. Frigerio, A. Strada, A. Pizzi, B. Talone, J. Ghezzi, A. Gautieri, M. Chiari, P. Metrangolo, R. Vanna, F. Baldelli Bombelli, M. Cretich and A. Gori, ACS Appl. Mater. Interfaces, 2022, 14, 4811–4822 CrossRef CAS PubMed.
- A. G. Yates, R. C. Pink, U. Erdbrügger, P. R. Siljander, E. R. Dellar, P. Pantazi, N. Akbar, W. R. Cooke, M. Vatish, E. Dias-Neto, D. C. Anthony and Y. Couch, J. Extracell. Vesicles, 2022, 11, e12151 CrossRef CAS PubMed.
- C. Théry, et al. , J. Extracell. Vesicles, 2018, 7, 1535750 CrossRef PubMed.
- S. Busatto, A. Zendrini, A. Radeghieri, L. Paolini, M. Romano, M. Presta and P. Bergese, Biomater. Sci., 2020, 8, 39–63 RSC.
- A. Yekula, V. R. Minciacchi, M. Morello, H. Shao, Y. Park, X. Zhang, K. Muralidharan, M. R. Freeman, R. Weissleder, H. Lee, B. Carter, X. O. Breakefield, D. Di Vizio and L. Balaj, J. Extracell. Vesicles, 2019, 9, 1689784 CrossRef PubMed.
- A. Matsumoto, Y. Takahashi, H. Chang, Y. Wu, A. Yamamoto, Y. Ishihama and Y. Takakura, J. Extracell. Vesicles, 2020, 9, 1696517 CrossRef CAS PubMed.
- X. Zhou, Y. Jia, C. Mao and S. Liu, Cancer Lett., 2024, 580, 216481 CrossRef CAS PubMed.
- K. Qian, W. Fu, T. Li, J. Zhao, C. Lei and S. Hu, J. Exp. Clin. Cancer Res., 2022, 41, 286 CrossRef CAS PubMed.
- S. H. Hilton and I. M. White, Sens. Actuators Rep., 2021, 3, 100052 CrossRef PubMed.
- R. Vogel, J. Savage, J. Muzard, G. Della Camera, G. Vella, A. Law, M. Marchioni, D. Mehn, O. Geiss, B. Peacock, D. Aubert, L. Calzolai, F. Caputo and A. Prina-Mello, J. Extracell. Vesicles, 2021, 10, e12052 CrossRef CAS PubMed.
- K. Brennan, K. Martin, S. P. FitzGerald, J. O'Sullivan, Y. Wu, A. Blanco, C. Richardson and M. M. Mc Gee, Sci. Rep., 2020, 10, 1039 CrossRef CAS PubMed.
- A. Ridolfi, L. Conti, M. Brucale, R. Frigerio, J. Cardellini, A. Musicò, M. Romano, A. Zendrini, L. Polito, G. Bergamaschi, A. Gori, C. Montis, S. Panella, L. Barile, D. Berti, A. Radeghieri, P. Bergese, M. Cretich and F. Valle, J. Extracell. Vesicles, 2023, 12, 12349 CrossRef CAS PubMed.
- M. Jørgensen, R. Bæk, S. Pedersen, E. K. L. Søndergaard and S. R. Kristensen, et al. , J. Extracell. Vesicles, 2013, 1, 20920 CrossRef PubMed.
- T. Rojalin, B. Phong, H. J. Koster and R. P. Carney, Front. Chem., 2019, 7, 279 CrossRef CAS PubMed.
- G. G. Daaboul, P. Gagni, L. Benussi, P. Bettotti, M. Ciani, M. Cretich, D. S. Freedman, R. Ghidoni, A. Y. Ozkumur, C. Piotto, D. Prosperi, B. Santini, M. S. Ünlü and M. Chiari, Sci. Rep., 2016, 6, 37246 CrossRef CAS PubMed.
- S. Zuppone, N. Zarovni and R. Vago, Drug Delivery, 2023, 30, 216216 CrossRef PubMed.
- R. Frigerio, A. Musicò, M. Brucale, A. Ridolfi, S. Galbiati, R. Vago, G. Bergamaschi, A. M. Ferretti, M. Chiari, F. Valle, A. Gori and M. Cretich, Cells, 2021, 10, 544 CrossRef CAS PubMed.
- R. Frigerio, A. Musicò, A. Strada, G. Bergamaschi, S. Panella, C. Grange, M. Marelli, A. M. Ferretti, G. Andriolo, B. Bussolati, L. Barile, M. Chiari, A. Gori and M. Cretich, J. Extracell. Biol., 2022, 8, e53 CrossRef.
- P. Gagni, A. Romanato, G. Bergamaschi, P. Bettotti, R. Vanna, C. Piotto, C. F. Morasso, M. Chiari, M. Cretich and A. Gori, Nanoscale Adv., 2019, 1, 490–497 RSC.
- J. Cao, P. Zhao, X. H. Miao, L. J. Zhao, L. J. Xue and Z. T. Qi, Cell Res., 2003, 13, 473–479 CrossRef CAS PubMed.
- Y. Liang, B. M. Lehrich, S. Zheng and M. Lu, J. Extracell. Vesicles, 2021, 10, e12090 CrossRef CAS PubMed.
- L. Min, B. Wang, H. Bao, X. Li, L. Zhao, J. Meng and S. Wang, Adv. Sci., 2021, 8, 2102789 CrossRef CAS PubMed.
- L. Porcelli, M. Guida, S. De Summa, R. Di Fonte, I. De Risi, M. Garofoli, M. Caputo, A. Negri, S. Strippoli, S. Serratì and A. Azzariti, J. Immunother. Cancer, 2021, 9, e002372 CrossRef PubMed.
- A. M. LeBeau, S. Duriseti, S. T. Murphy, F. Pepin, B. Hann, J. W. Gray, H. F. VanBrocklin and C. S. Craik, Cancer Res., 2013, 73, 2070–2081 CrossRef CAS PubMed.
- S. Ulisse, E. Baldini, S. Sorrenti and M. D'Armiento, Curr. Cancer Drug Targets, 2009, 9, 32–71 CrossRef CAS PubMed.
- J. Zhou, K. J. Kwak, Z. Wu, D. Yang, J. Li, M. Chang, Y. Song, H. Zeng, L. J. Lee, J. Hu and C. Bai, Cell. Physiol. Biochem., 2018, 47, 1909–1924 CrossRef CAS PubMed.
- M. Ploug, S. Østergaard, H. Gårdsvoll, K. Kovalski, C. Holst-Hansen, A. Holm, L. Ossowski and K. Danø, Biochemistry, 2001, 40, 12157–12168 CrossRef CAS PubMed.
- S. Zuppone, C. Assalini, C. Minici, S. Bertagnoli, P. Branduardi, M. Degano, M. S. Fabbrini, F. Montorsi, A. Salonia and R. Vago, Sci. Rep., 2020, 10, 2521 CrossRef CAS PubMed.
Footnotes |
| † Electronic supplementary information (ESI) available. See DOI: https://doi.org/10.1039/d3sd00313b |
| ‡ These authors contributed equally. |
| This journal is © The Royal Society of Chemistry 2024 |


