
 Open Access Article
 This Open Access Article is licensed under a Creative Commons Attribution-Non Commercial 3.0 Unported Licence
Sustainable agriculture with LEAFS: a low-cost electrochemical analyzer of foliage stress†
Sina
Khazaee Nejad
 ,
Haozheng
Ma
,
Abdulrahman
Al-Shami
,
Ali
Soleimani
,
Mona A
Mohamed
,
Preston
Dankwah
,
Hannah J.
Lee
and
Maral P. S.
Mousavi
*
,
Haozheng
Ma
,
Abdulrahman
Al-Shami
,
Ali
Soleimani
,
Mona A
Mohamed
,
Preston
Dankwah
,
Hannah J.
Lee
and
Maral P. S.
Mousavi
*
Alfred E. Mann Department of Biomedical Engineering, University of Southern California, 1042 Downey Way, Los Angeles, 90089, CA, USA. E-mail: khazaeen@usc.edu; mahaozhe@usc.edu; aalshami@usc.edu; alisolei@usc.edu; ma_744@usc.edu; pdankwah@usc.edu; hlee9080@usc.edu; mousavi.maral@usc.edu
First published on 9th January 2024
Abstract
Sustainable agricultural practices are vital to meet the needs of a rapidly growing global demand for food. Monitoring plant health is crucial for enhancing crop yields. Salicylic acid (SA) is a plant hormone that plays a key role in the defense mechanisms plants employ against various stress factors. Changes in SA levels serve as an indicator that a plant is experiencing stress. Here, we present a low-cost electrochemical sensor fabricated using porous laser-induced graphene material for the measurement of plant stress. It employs square wave voltammetry to monitor SA levels using a wireless potentiostat. The sensor shows a high sensitivity of 144.28 μA mM−1 to SA, with a linear detection range of 6.6 μM to 200 μM and a limit of detection of 1.44 μM. The surface of the working electrode was modified with Nafion to enable continuous in situ stress monitoring. The sensor's practicality has been demonstrated through real-time stress monitoring in aloe vera and philodendron hederaceum plant species.
1 Introduction
The need for sustainable agricultural practices is crucial to increase crop yields and fulfill the requirements of a rapidly expanding global population. Projections forecast a 100–110% increase in global food demand from 2005 to 2050.1,2 However, farmers are confronted with numerous challenges, including crop vulnerability, extreme temperatures, soil degradation, and drought, which are anticipated to escalate due to global warming. Safeguarding the health of plants contributes to climate change adaptation, effective management of drought and water resources, and the enhancement of crop yields (Fig. 1).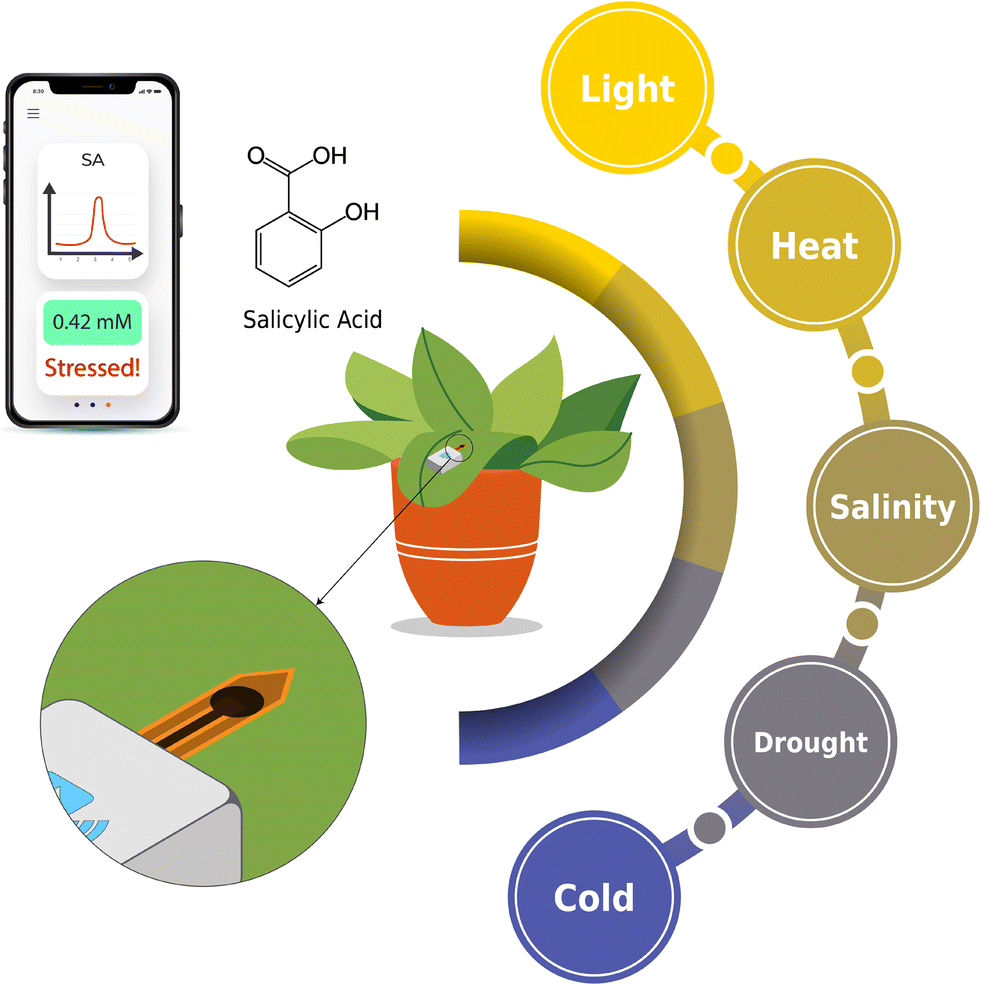 | ||
| Fig. 1 In-field plant stress monitoring with LEAFS (a low-cost electrochemical analyzer of foliage stress). LEAFS can measure SA in blended leaf mixture or can be inserted directly in the plant leaf or stem for continuous monitoring. Abiotic stresses negatively impact the plant and alter the physiological concentration of SA, which can be detected using the LEAFS platform. | ||
Salicylic acid (2-hydroxybenzoic acid3) is a phenolic phytohormone that is involved in plants' defense mechanism against biotic stresses, including various pathogens and abiotic stresses, such as UV-B (ultraviolet B), salt and osmotic, drought, heat, cold, and metal stresses. It also plays a role in stress-influenced developmental transitions, including processes such as flowering, tuberization, and senescence.4–6 Salicylic acid (SA) levels exceed 1 μg g−1 fresh weight in plants such as rice, green foxtail, crabgrass, barley, and soybean.7 An extremely low or high level of SA increases plant vulnerability to stresses. These excessively high or low levels typically lead to cell death due to the overproduction of reactive oxygen species (ROS).6 Therefore, developing an efficient detection methodology for SA levels is crucial to safeguard plant health. Given that SA levels differ from one plant to another, frequent testing to detect changes in SA levels is the best way to detect plant stress.
Traditionally, the detection and quantification of salicylic acid have been accomplished through methods such as liquid chromatography,8–10 gas chromatography,11,12 colorimetry,13–16 and electrokinetic chromatography.17 Although they have good reliability, these techniques often require large equipment, complicated sample preparation, and can be time-consuming. The challenges related to these methods, including sensitivity to interference, limitations in sensitivity, and the need for specialized knowledge, also have driven for alternative methods, like electrochemistry.18–20
Electrochemical analysis offers high sensitivity and selectivity,21–25 ensuring accurate detection from complex plant matrices. Additionally, the rapidity of electrochemical reactions enables fast detection,26 and their cost-effectiveness, coupled with portability, also makes them particularly attractive. For SA detection in plants,27–30 the value of electrochemical methods is further highlighted. They can effectively detect SA, among numerous other compounds in the plant samples, combined with environmental-friendly testing protocols, marking a significant advancement.26,30–33 Low cost and scalable production is a critical factor for realistic applications of electrochemical SA sensors in smart agriculture. Prior electrochemical SA sensors either required complicated and expensive patterning and multi-step fabrication processes, or designed sensors that still require expensive external electrodes for measurement, making them unfit for large scale measurements in the field.34,35
Laser engraving is a scalable and sustainable method to produce graphene. Since its discovery in 2004, graphene has earned considerable attention across diverse scientific fields due to its exceptional physical and chemical properties.36 Graphene exhibits a wide array of applications in various domains, including electronics,37 catalysis,38 energy storage,39 and electrochemical sensors.40–42 In 2014, Lin et al. introduced a novel approach by employing a CO2 laser to synthesize Laser-Induced Graphene (LIG).43 The LIG method leverages direct laser writing to induce the transformation of sp3 carbons into sp2 carbons through a photothermal reaction. In comparison to conventional graphene fabrication methods, such as chemical vapor deposition (CVD), LIG fabrication offers distinct advantages, including rapid production, cost-effectiveness, and eliminating the need for high-temperature equipment. Moreover, LIG stands out as a promising candidate for new-generation sustainable materials due to its cost-effective production and minimal environmental impact. These align with the key principles of material sustainability, which prioritize resource-efficient processes and the consideration of factors such as energy demand, environmental effects, and economic viability.44 Notably, LIG's low energy requirements, compared with the energy-intensive CVD for graphene production, contribute to a more sustainable approach for manufacturing this material.45
This study introduces the first in-field SA graphene sensor capable of monitoring SA levels in plants. The sensor costs less than US$0.5 and requires less than 100 μL of sample for rapid measurement (less than 2 minutes) of SA. We have also developed a flexible thin film sensor that can be implanted in the leaf or stem for continuous monitoring of SA. The LIG-based sensor developed, with all non-toxic materials, in this work exhibited exceptional sensitivity and selectivity to SA within a complex mixture of plant leaf homogenate. The in situ measurements conducted on live plants demonstrate the capability of the sensor for real-time monitoring of plant stress with minimal user intervention. This work paves the way for creating accessible tools for frequent and continuous plant health monitoring, and achieving a more sustainable precision agriculture.
2 Experimental
2.1 Materials and reagents
Salicylic acid (2-hydroxybenzoic acid, 99.0%), sodium hydroxide (NaOH, 97.0%), potassium chloride (KCl, 99.0%), sodium chloride (NaCl, 99.0%), and solution were purchased from Sigma-Aldrich (St. Louis, MO, USA). Boric acid (99.5%), acetic acid (99.7%), and phosphoric acid (85.0%) were purchased from VWR (Radnor, PA, USA). Silver/silver chloride Ink (AGCL-1134) was purchased from Kayaku Advanced Materials (Westborough, MA, USA). Electrical-grade Kapton® Polyimide Film (12′′ × 12′′ × 0.005′′) was acquired from McMaster-Carr, USA. Deionized water (resistivity of 18.20 MΩ cm−1) was used to prepare the solutions. Philodendron hederaceum (Philodendron brasil) and Aloe barbadensis miller (Aloe vera) plants were purchased from Home Depot (Glendale, CA), and used for validation of sensor performance.2.2 Electrode fabrication
The Kapton polyimide film was washed with acetone, isopropyl alcohol, and DI (deionized) water, and placed in an oven for 5 minutes at 90 °C to dry. Then, it was loaded into the laser engraver machine (VLS2.30, Universal Laser Systems Inc.). The laser system is equipped with a 30 W laser source operating at a 9.3 μm wavelength. The electrode pattern, designed by Adobe Illustrator (Adobe, Inc.), was engraved on the PI film in raster mode. After this, the electrodes were again cleaned with DI water and dried in the oven at 90 °C for an additional 5 minutes. A Kapton tape was used to define the surface area of the working electrode. The reference electrode was formed by applying the Ag/AgCl ink over the laser engraved pattern. Finally, the electrodes were cut, and two different sides were attached to each other using a double-sided tape. For reusable electrodes intended for in-plant measurements, a 5 μL volume of a 0.25% v/v Nafion solution diluted in DI water was applied via drop-casting onto the working electrode. Because of the hydrophobic nature of the PI film surface, the solution applied does not spread beyond the working electrode region. The electrode was placed into a vacuum chamber and dried at room temperature for one hour (Fig. 2).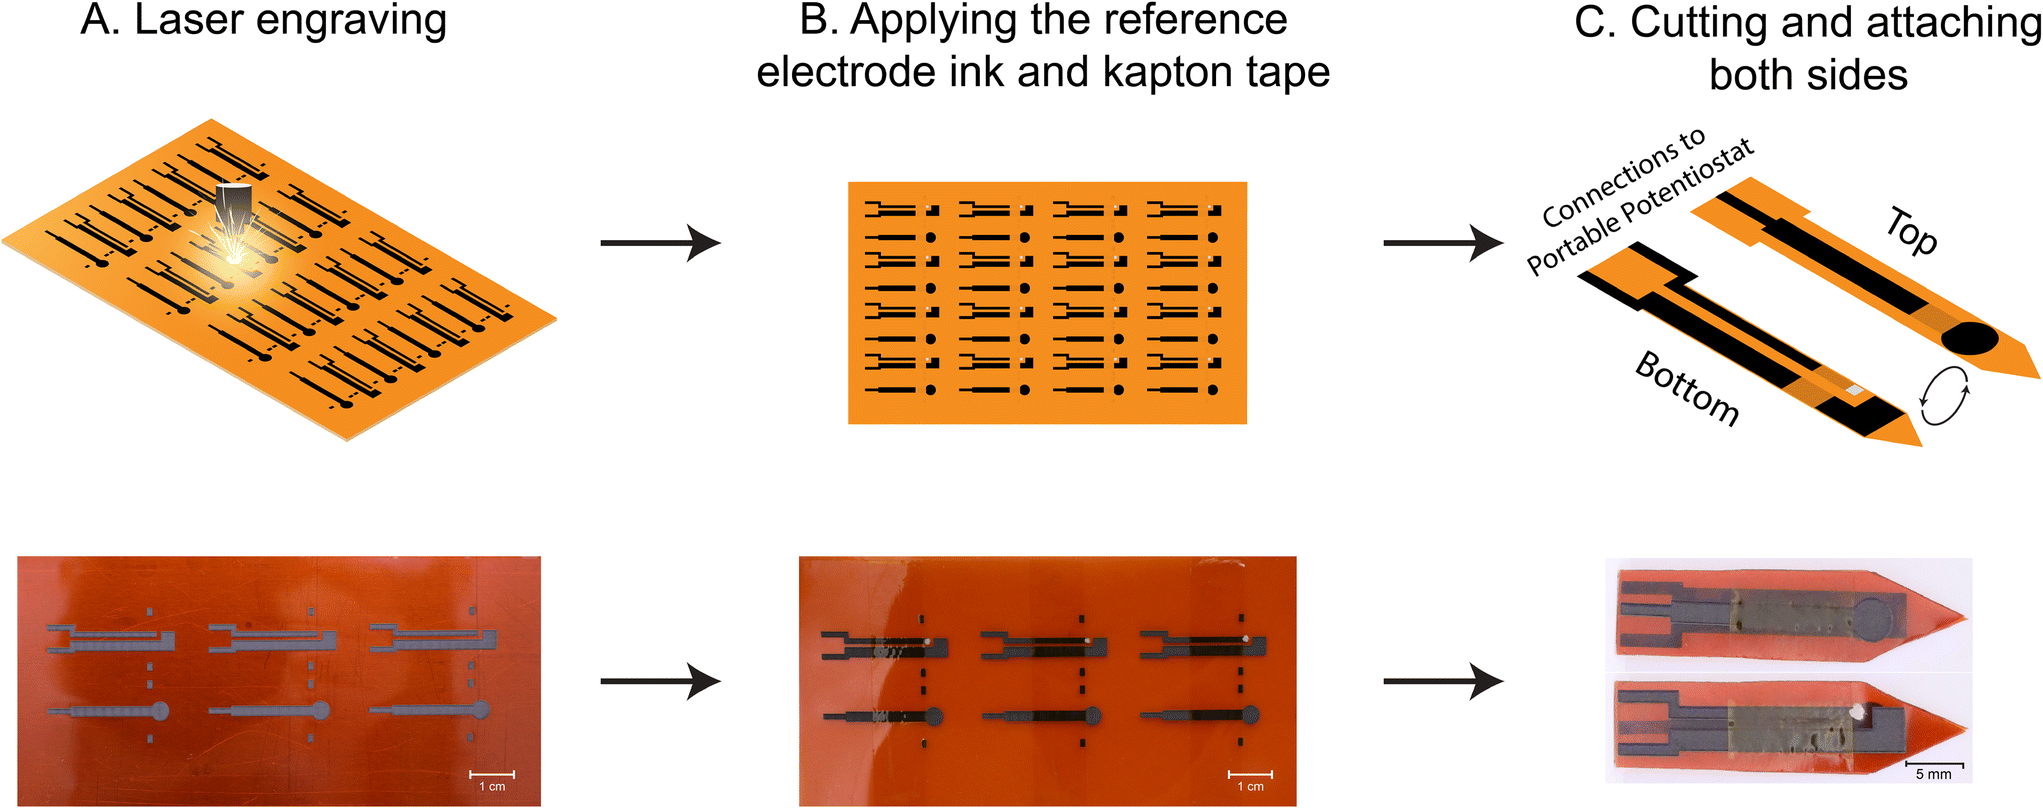 | ||
| Fig. 2 A. Laser engraving the electrode pattern on the PI film. B. Applying a Kapton tape to define the surface area and the Ag/AgCl ink for the reference electrode. C. Cutting and attaching both sides of the electrode together. | ||
2.3 Electrochemical tests
Cyclic voltammetry (CV) and square-wave voltammetry (SWV) tests were carried out using CHI 760E (CH Instruments, TX, USA). Sensit BT (PalmSens BV, Utrecht, Netherlands) was used for wireless in-plant measurements. For electrochemical characterization and calculation of effective surface area, CVs were measured in 100 μL of an electrolytic solution of 2 mM [Fe(CN)6]3−/4− and 100 mM KCl at a scan rate between 20 and 100 mV s−1. SWV was used to detect SA in buffer and solutions of blended plant leaves. SWVs were carried out at a frequency of 4 Hz, 4 mV step potential, and 25 mV amplitude. SWV is a highly sensitive electrochemical technique since it minimizes the effect of capacitive current by sampling the current after a pulse in a forward and reverse path. Britton–Robinson pH buffers with ionic strength of 0.1 M were prepared according to Mongay, et al.46 Briefly, we mixed the theoretically calculated amounts of sodium hydroxide, acetic, phosphoric, and boric acids and then adjusted the ionic strength by adding potassium chloride. Each pH value was calculated theoretically, and then measured using Orion Star™A211 Benchtop pH Meter (Thermo Scientific Inc.). The salicylic acid solution was prepared fresh in DI water with a concentration of 2.0 mM for the purpose of spiking the buffer solution. Every test is conducted using a minimum of three different electrodes, and the reported results are the average value along with the corresponding standard deviation.2.4 Background correction algorithm
Background current in voltammetry is an unwanted and unreproducible signal component that depends on electrode type, sample composition, impurities, and experimental conditions.47 Baseline correction and background removal are important to achieve better accuracy, selectivity, reproducibility, and signal-to-noise ratio in the performance of voltammetric sensors.48 Here, we removed the background current by fitting a polynomial baseline between 0.8 and 1.1 V using pybaselines, which is an open-source python library for the baseline correction of experimental data.49 The fitted baseline was subtracted from the experimental data and the peak current of the obtained signal was recorded as a response to the SA concentration. Additionally, the raw data for SWV responses in the optimization process are reported in the Fig. S1 in the ESI.† This is done to illustrate the SWV response before background subtraction. SciPy, another open-source python library, has been used for processing the data.502.5 Electrode characterization
Scanning electron microscopy (SEM) imaging was conducted using FEI Nova NanoSEM 450 (FEI, OR, USA). Energy dispersive X-ray spectroscopy (EDX) characterization was obtained using Oxford UltimMax 170 Silicon Drift Detector (Oxford instrument, UK). Raman spectroscopy and X-ray photoelectron spectroscopy (XPS) characterization were performed using the Horiba XploRA Raman Microscope System (Horiba, Japan) and Kratos Axis Ultra DLD (Kratos Analytical, UK), respectively. Sheet resistivity and hydrophobicity measurements were conducted using a Four-Point Probe and Contact Angle Goniometer (Ossila Ltd, Sheffield, England).3 Results and discussion
3.1 Overview of LEAFS
LEAFS (low-cost electrochemical analyzer of foliage stress) is a portable sensor that can measure the concentration of SA in plants on-site. This measurement provides information on plant resilience and environmental stresses on the plant, and enable rapid onsite data collection and frequent monitoring of plant state. Such information can be valuable for sustainable agriculture and quantification of best practices to care for crops.LEAFS contains three electrodes that are laser engraved on a polyimide (PI) sheet. Applying a voltage to the working electrode causes oxidation of SA, and an electrical current that is proportional to the SA concentration. Square wave voltammetry (SWV) is utilized for quantification due to its high sensitivity and low limit of detection. The electrode is connected to a commercial wireless potentiostat for electrochemical readout, where the results are sent to an App for visualization and storage. LEAFS can be utilized in the field in two different ways: (1) A fresh leaf is harvested from the plant and blended with the provided buffer (Britton-Robinson buffer of pH 2.4) to create a homogenate (1![[thin space (1/6-em)]](https://www.rsc.org/images/entities/char_2009.gif) :5 w/w ratio of leaf to buffer). This solution is directly added over the working area of LEAFS, and SA is measured. (2) For continuous monitoring in thicker leaves and stems, the sensor can be inserted into the leaf or stem of the plant through a small manual incision. We demonstrate continuous measurements of SA in an Aloe vera plant.
:5 w/w ratio of leaf to buffer). This solution is directly added over the working area of LEAFS, and SA is measured. (2) For continuous monitoring in thicker leaves and stems, the sensor can be inserted into the leaf or stem of the plant through a small manual incision. We demonstrate continuous measurements of SA in an Aloe vera plant.
3.2 Fabrication of LEAFS
The fabrication of laser-induced graphene (LIG) electrodes requires optimization of engraving parameters and conditions to achieve carbon with high conductivity and electrocatalytic activity. These parameters include the focus distance (the distance between the laser focal point and the PI film), image density, power (as a percentage of the maximum laser power), and traveling speed (as a percentage of the maximum speed) of the laser source. We began by optimizing the focus distance and image density while keeping the speed and power constant to achieve the desired conductivity. We increased the distance between the laser focal point and the PI film to strike the substrate with an out-of-focus laser beam. Sheet resistivity is measured for distances ranging from 6.6 mm to 8.6 mm by four-point probe measurement. As depicted in Fig. 3A, altering the focus distance does not significantly affect the sheet resistivity. For electrodes engraved with a focus distance lower than 6.6 mm, the PI film was partially burned, and the carbon material created during the process became separated from it. Additionally, when printing using a lower focus distance, we experienced an enhanced attachment between LIG material and the PI film. In other words, the carbon material did not detach easily from the substrate under multiple intense bending and twisting cycles. Image density was adjusted from the lowest value (level 1) to its highest value (level 7). Fig. 3B illustrates that as long as sufficiently high values were selected for the image density (higher than 5), the conductivity remained relatively constant. As a result, we selected the highest possible value for image density, and 6.6 mm for the focus distance.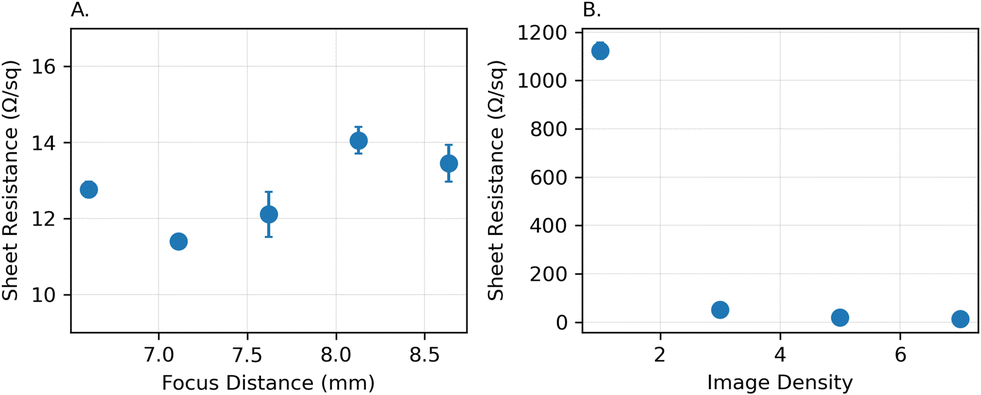 | ||
| Fig. 3 A. The effect of focus distance (the x-axis is the distance between the laser source and PI film) on the LIG sheet resistivity. B. The effect of image density (vertical resolution) on the LIG sheet resistivity. | ||
Beyond achieving high conductivity for the engraved electrodes, we aimed to optimize the engraving parameters for obtaining high electrocatalytic activity for the oxidation of SA at the LIG surface. Therefore, we fine-tuned various power and speed settings to achieve the highest peak current value and sharpest peak in SWV of SA. To optimize these parameters, we considered the sheet resistivity of the electrodes, the peak height value of the SA signal, and the ratio of the peak height to the half-peak width as a measure of peak sharpness.51
We changed the power within the range of 6% to 10% and the speed from 16% to 24%. The square wave voltammograms (SWVs) were recorded in a 200 μM SA solution in a Britton–Robinson buffer with a pH of 2.4, using three electrodes for each set of parameters. Any parameter combinations located above the diagonal line in the matrix were found to be overly powerful, leading to partial burning of the PI film and detachment of the carbon material from it. Fig. 4 displays the SWVs for different engraving conditions. The SA peak height values are presented in Fig. 4A, where SWV of 200 μM SA is measured in a Britton-Robinson buffer of pH 2.4. Fig. 4B reports the values for peak height to the half-peak width ratios (100 μA mV−1); A higher ratio serves as an indicator of a sharper peak, that could lead to higher resolution, and enhanced selectivity.52 A green-red color gradient is used to highlight the values, in which green indicates a higher peak value and a larger peak to half-peak width ratio. The sheet resistivity is also presented for each set of parameters in Fig. 4C. As long as the sheet resistivity is sufficiently low to ensure adequate conductivity, it meets our requirements. All data are an average of three independent electrode fabricated under the same condition. Collectively, using 8% for power (2.4 W), and 20% for travel speed yielded the best performance.
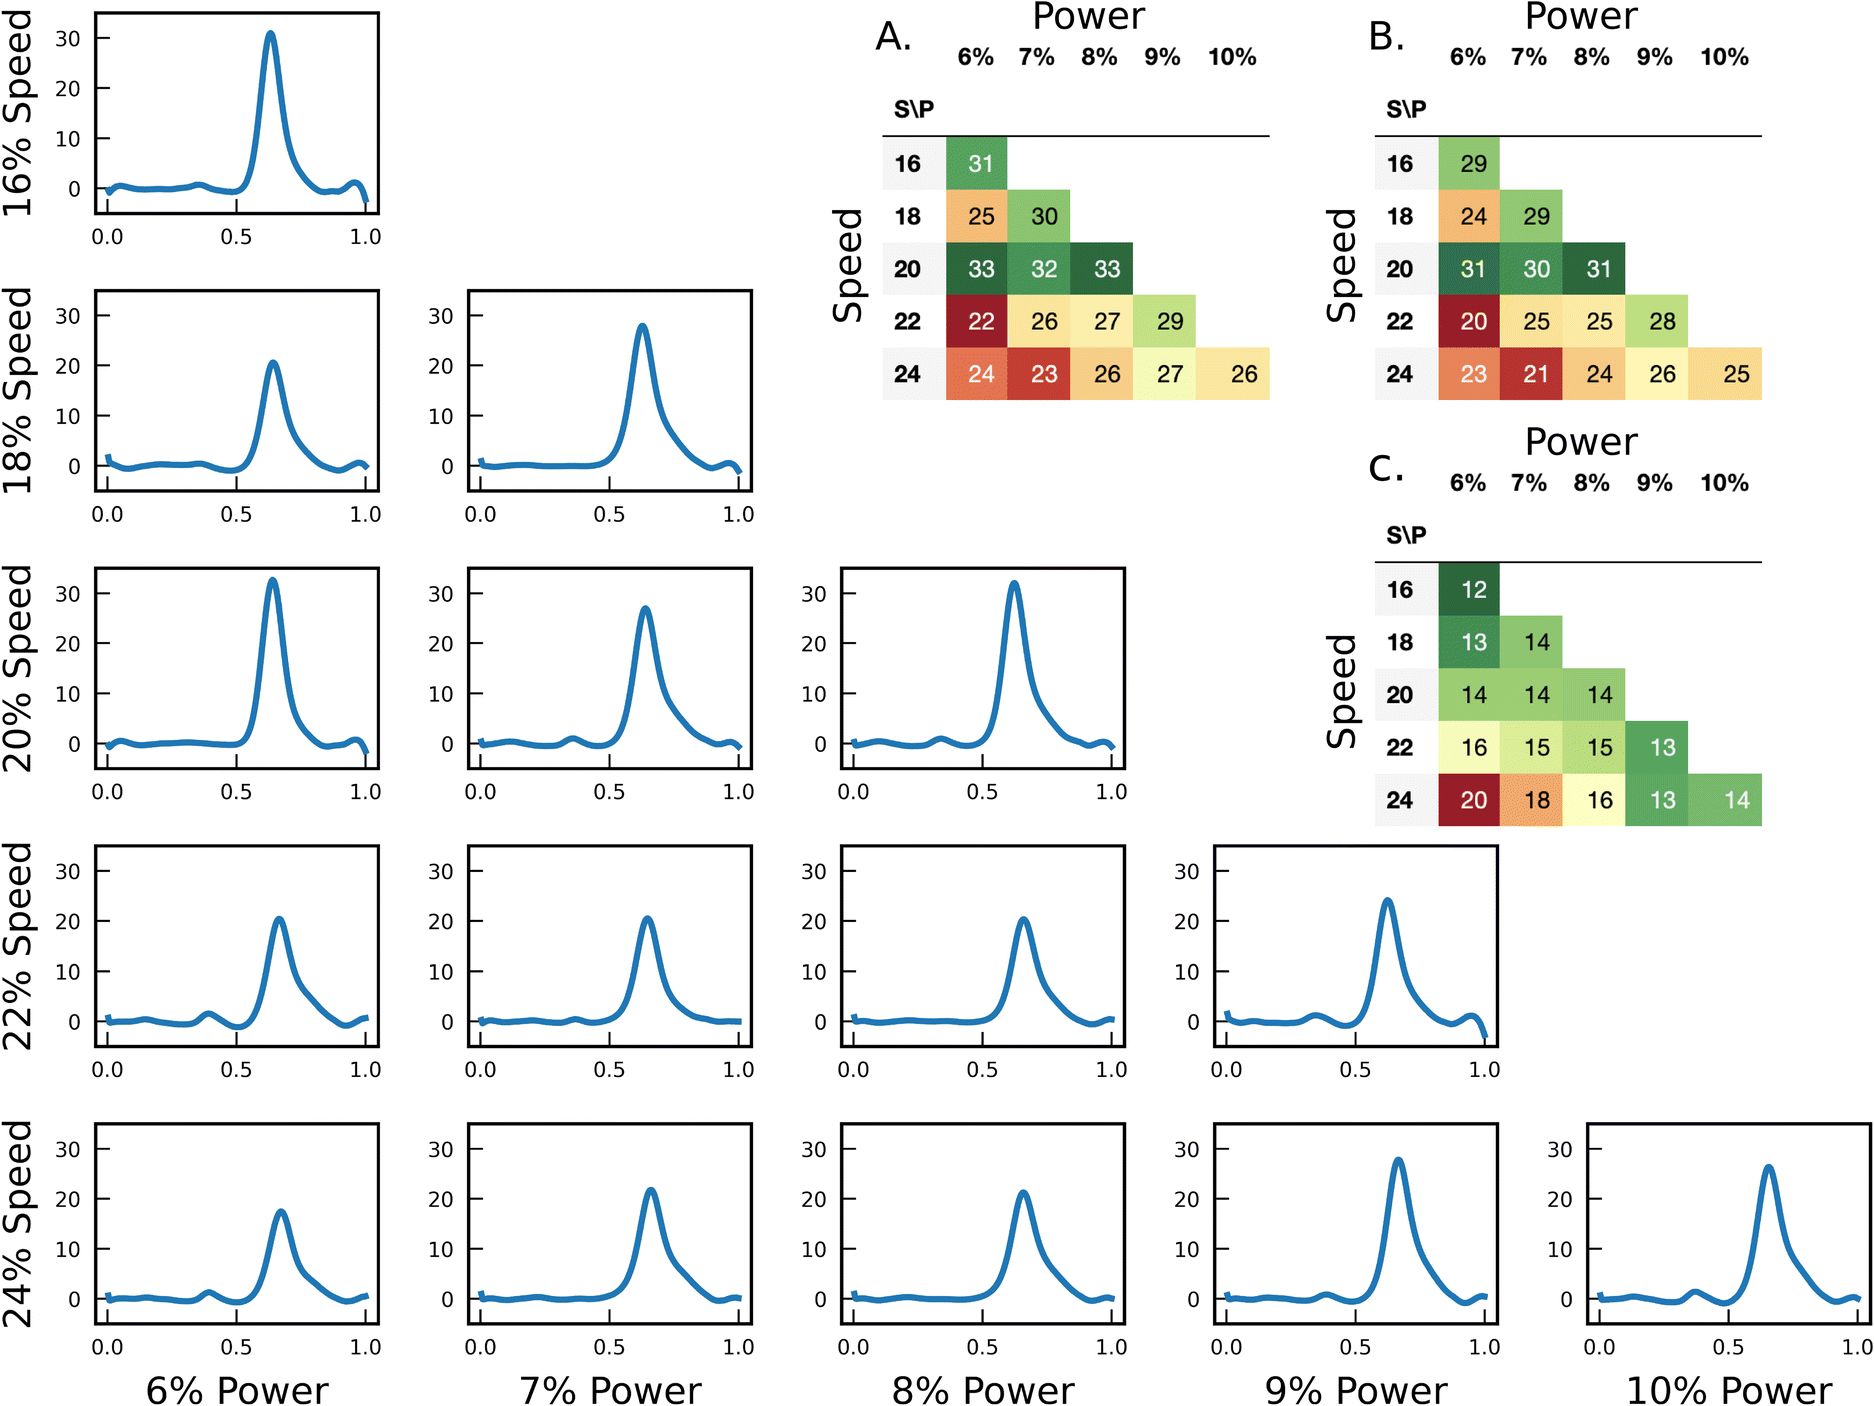 | ||
| Fig. 4 The SWV of 200 μM SA solution in Britton–Robinson buffer of pH 2.4 using LIG electrodes engraved with different parameters. The raw data of these measurements are presented in Fig. S1 in the ESI.† A. Peak height values. (μA, n = 3) B. Peak height to the half-peak width ratio (100 μA mV−1, n = 3). C. Sheet resistivity (Ω sq−1, n = 3). | ||
Another condition we can control during the laser engraving process is the gaseous environment during the high temperature carbonization. To ensure a clean environment is maintained during engraving, we direct gas flow onto the point of contact between the PI film and the laser beam (referred to as the air assist). In addition, the laser chamber is connected to a vacuum suction pump to continuously refresh the air in the chamber. We investigated three different conditions: (1) directing a stream of argon during engraving, (2) directing a stream of compressed air during engraving, and (3) engraving without any air assist. Increasing the content of the oxygen in the lasing chamber makes the surface of the electrodes more hydrophilic.53 As a result, we anticipate to see a more hydrophilic surface when using compressed air. Conversely, by using argon, a decrease in the oxygen content in the chamber resulted in a considerably more hydrophobic surface. A hydrophilic surface can accelerate the rate of electron transfer between the solution and electrode material. Therefore, hydrophilicity is advantageous in voltammetric tests.54 Contact angle measurement was conducted on electrodes fabricated under these three conditions. Fig. 5A–C display the water contact angle on LIG electrodes engraved using no air assist, compressed air, and argon. The contact angle is 16° ± 2°, 40° ± 2°, and 97° ± 7°, respectively. As expected, using compressed air turns the surface of the electrode to be more hydrophilic, whereas using argon makes it hydrophobic. Using air assist with compressed air created a more hydrophilic surface compared to electrodes engraved without any air assist. We therefore used compressed air for fabrication of the electrodes discussed in the next sections.
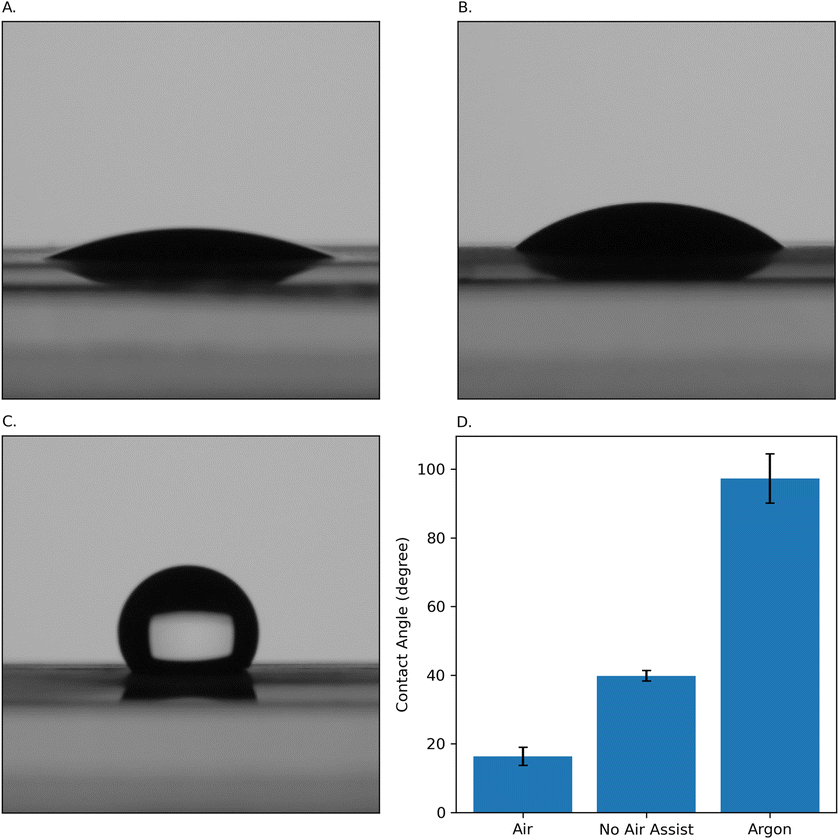 | ||
| Fig. 5 Contact angle test on LIGs engraved using (A) air assist with compressed air, (B) without air assist, and (C) air assist with argon. D. The contact angle measurement for the three engraving conditions as labeled (n = 3). | ||
3.3 Electrode characterization
We utilized scanning electron microscopy (SEM) to characterize the surface topography and cross-sectional thickness of the generated graphitic architecture. Fig. 6A illustrates the formation of a groove-like structure, featuring 3D interconnected, multi-sized pores resulting from the release of gaseous byproducts during the laser engraving process. The highly porous structure and the abundance of edge sites significantly enhance the surface area and electron transfer kinetics through the electrode surface. Consequently, these factors markedly improve the sensitivity and detection limit of LIG-based electrochemical sensors. The cross-sectional image in Fig. 6B indicates the formation of a 3D multilayered carbon structure with a consistent thickness of 50 μm atop the PI film. Energy-dispersive X-ray spectroscopy (EDX) was employed to analyze the elemental composition of the produced LIG. As shown in Fig. 6C, the EDX spectrum demonstrated a carbon content percentage of 100% on the LIG surface, with no detectable amounts of oxygen and nitrogen contents. This observation indicates the significant carbonization of the PI film using laser treatment.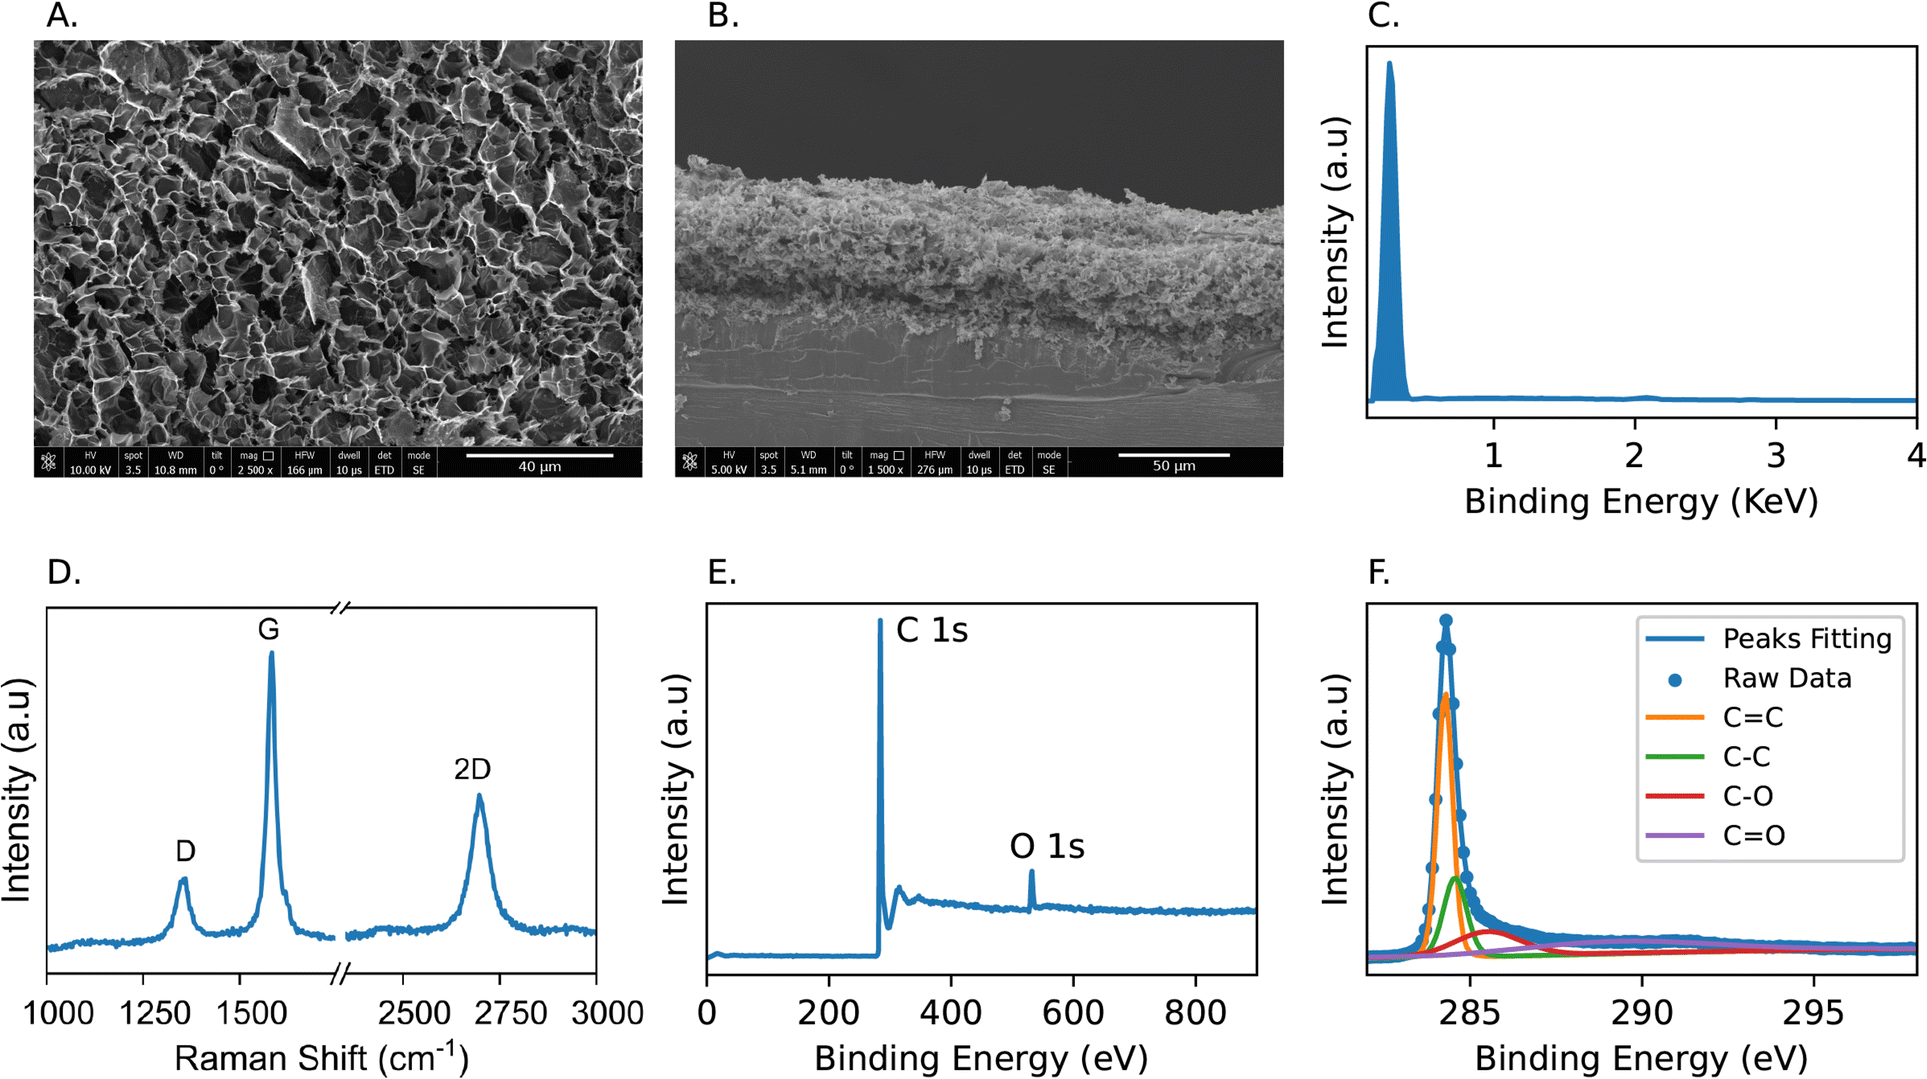 | ||
| Fig. 6 Top (A) and cross-section (B) SEM images of the LIG structure. (C) EDX analysis results of LIG. (D) Raman spectrum of the LIG. (E) XPS survey of the LIG surface. (F) High-resolution XPS spectrum for C 1s peak. | ||
Furthermore, we employed Raman spectroscopy to investigate the quality of the produced carbon materials. The Raman spectrum in Fig. 6D exhibits three distinctive peaks characteristic of multilayered graphene. The G peak, at 1583 cm−1, represents the sp2 hybridization state of carbon atoms in graphene. The D peak, at 1354 cm−1, signifies the existence of defects and disorders within the graphene lattice, which result from bent and/or broken bonds. The peak at 2697 cm−1 features the two-phonon process in graphene.55,56 The ratio I2D/IG obtained here is approximately 0.55, indicating the presence of about 4–5 graphene layers on the surface of the laser-engraved area.57 Additionally, the ID/IG ratio suggests a relatively low degree of disorders and attests to the high quality of the produced graphene structure.
The chemical state and composition of the LIG structure were investigated using the XPS technique (X-ray photoelectron spectroscopy). The survey XPS spectrum (Fig. 6E) revealed distinct peaks corresponding to carbon (C 1s) and oxygen (O 1s) at binding energy values of 284.3 eV and 532.7 eV, respectively. The obtained carbon-to-oxygen ratio is approximately 10.21:1, reflecting the high purity of the induced graphene. We employed the casaXPS software to deconvolute the C 1s peak into individual component peaks to identify the chemical states of the produced carbon. As depicted in Fig. 6F, the sharp, intense peak at 284.3 eV corresponds to the sp2 hybridization within the graphene structure, while a smaller peak at 284.6 eV represents C–C bonds. The broader peaks at 285.5 and 289.3 eV are assigned to C–O and C![[double bond, length as m-dash]](https://www.rsc.org/images/entities/char_e001.gif) O, respectively.58,59 The mismatch in oxygen content between XPS and EDX techniques is attributed to the difference in measurement depth between the two techniques. XPS mostly measures through the top 1–10 nanometers of the sample60–62 while EDX goes down to 2–5 microns.63,64 Therefore, we can conclude that the oxygen content is mostly localized on the surface of the produced LIG at the contact between LIG and flowing compressed air.
O, respectively.58,59 The mismatch in oxygen content between XPS and EDX techniques is attributed to the difference in measurement depth between the two techniques. XPS mostly measures through the top 1–10 nanometers of the sample60–62 while EDX goes down to 2–5 microns.63,64 Therefore, we can conclude that the oxygen content is mostly localized on the surface of the produced LIG at the contact between LIG and flowing compressed air.
We assessed the surface area of LIGs-based electrodes and the reproducibility of the fabrication process through cyclic voltammetry. The experiments were conducted within a potential window from −0.15 to 0.6 V versus an Ag/AgCl reference electrode using an electrolyte solution of 2.0 mM [Fe(CN)6]3−/4− and 100 mM KCl. These experiments were performed at various scan rates (20, 50, 80, and 100 mV s−1) (Fig. 7A). We observed that the oxidation and reduction peak currents exhibited a linear increase in response to the square root of the scan rates (as shown in Fig. 7B) suggesting a diffusion-controlled reaction occurring on the electrode surface.
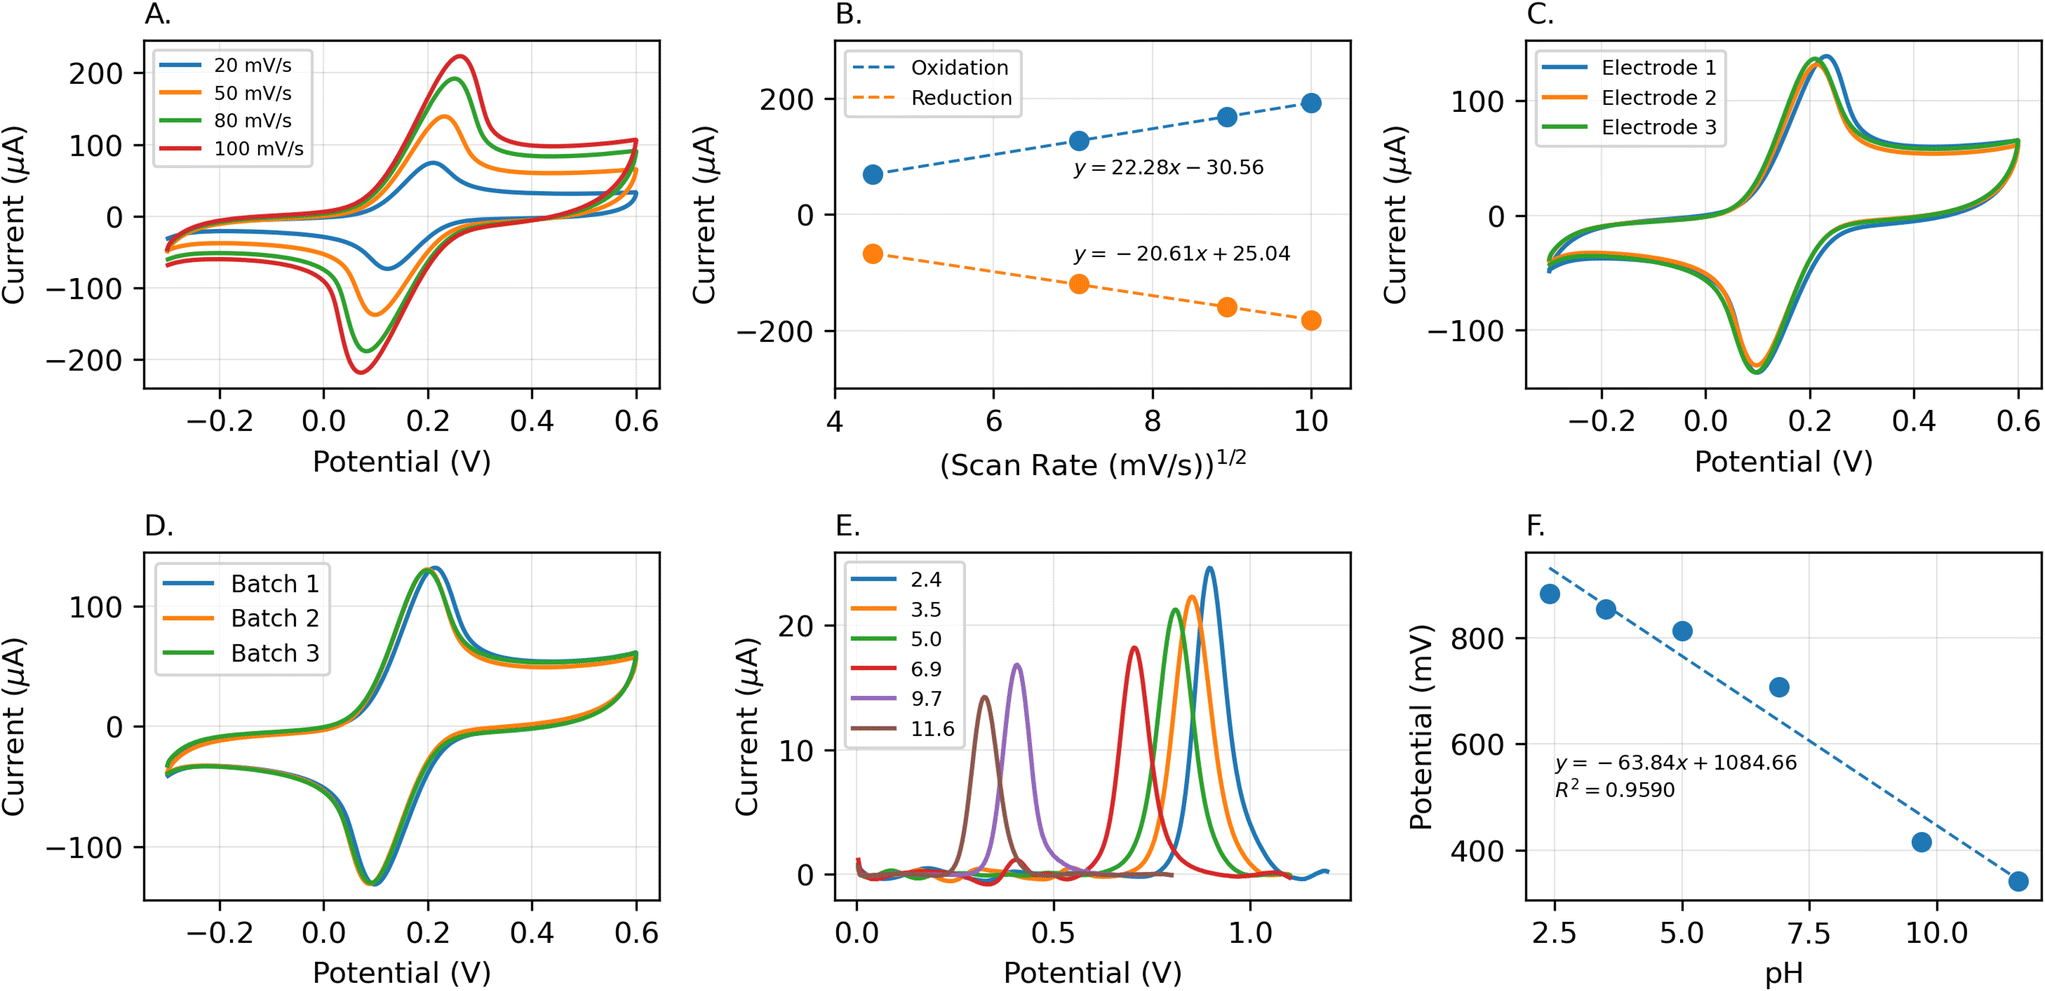 | ||
| Fig. 7 A. Cyclic voltammograms of the LIG electrodes obtained in an electrolytic solution of 2 mM [Fe(CN)6]3−/4− and 100 mM KCl at a scan rate between 20 and 100 mV s−1. B. The relationship of the oxidation and reduction currents with the square root of the scan rate in cyclic voltammetry experiments (n = 4). C. Cyclic voltammetry tests on three electrodes within the same fabricated batch. D. Cyclic voltammetry tests on three electrodes, each from a different fabricated batch. E. The effect of pH on the peak of 200 μM SA. F. The peak potential vs. pH of the solution (n = 3). | ||
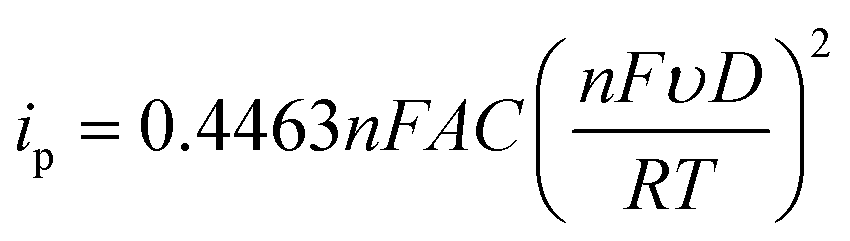
The obtained peak currents were analyzed using the Randles-Sevcik equation (eqn (1)) for the quasi-reversible cyclic voltammetries (Fig. 7A and B) to determine the surface area of the produced electrodes. Remarkably, the LIG electrode exhibited an active surface area (51.14 mm2) approximately four times greater than its geometric area (12.57 mm2), which is attributed to the highly porous morphology of the created LIG. Also, cyclic voltammograms of electrodes within a given batch (Fig. 7C) and across various batches (Fig. 7D) demonstrate that the electrodes consistently exhibit similar peak current values, peak positions, and surface area. The observed variation within the same batch electrodes was less than 1.80%, whereas the inter-batch variability was approximately 2.87%.
 | (1) |
3.4 The effect of pH on SA oxidation
One crucial factor influencing the accurate determination of SA (pKα = 2.97 (ref. 67)) is the pH value of the buffer solution. To assess the impact of pH on the peak current and oxidation potential, SWVs were conducted using the LIG electrode with 200 μM of SA across a pH range from 2.4 to 11.6, as illustrated in Fig. 7E. The results depict that as the pH of the solution increased, the oxidation peak potential (Ep) shifted towards more negative values, suggesting the involvement of protons in the SA oxidation process. The highest observed peak current was at pH 2.4, prompting its selection for further investigation. The Epversus pH plot revealed a slope value of −63.42 mV pH−1, which closely approximated the theoretical value of −59.2 mV pH−1, as shown in Fig. 7F. This alignment confirms the involvement of an equal number of protons and electrons in the electrochemical reaction, and the relationship can be expressed as:| Ep = −63.42 pH + 1.08 (R2 = 0.9612) |
3.5 Quantification of SA using LEAFS
The LIG sensor was calibrated in the salicylic acid solution with varying concentrations of 6.6 μM to 200 μM in Britton–Robinson buffer (pH 2.4). We chose the detection range based on previously reported SA levels in different plant species.7 The SA SWVs were recorded with a frequency of 4 Hz. The porous structure of the LIG led to an increased surface area, which, in turn, resulted in higher capacitance between the electrode's surface and the solution. This capacitance is the source of the background capacitive current observed in SWVs. Selecting a relatively low frequency of 4 Hz, allowed to effectively minimize this background capacitive current, resulting in a more distinct SA peak in the measurements.In a Britton–Robinson pH 2.4 buffer, the sensor showed a linear response within the range of 6.64 μM and 200 μM, with a sensitivity of 144.28 μA mM−1 (Fig. 8A). The limit of detection (LOD) (3σ20 blank measurements/ss) is determined to be 1.44 μM, almost an order of magnitude lower than the lowest target concentration. Additionally, the limit of quantification (10σ20 blank measurements/ss) is found to be 4.81 μM.
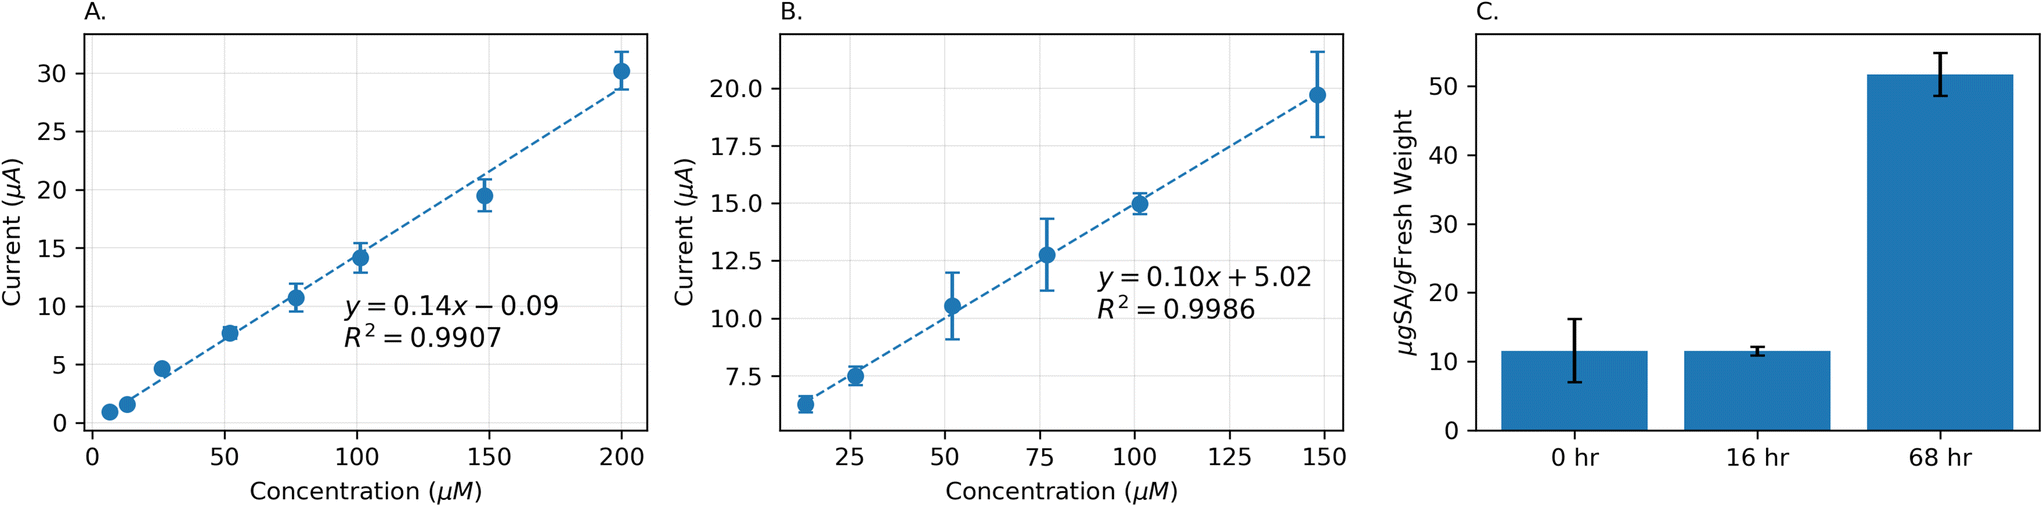 | ||
| Fig. 8 A. The calibration curve of the LIG sensor response to SA concentration in a Britton–Robinson buffer of pH 2.4. B. The calibration curve of the LIG sensor response to SA concentration in a mixture of Philodendron brasil leaves in a Britton–Robbinson buffer of pH 2.4. C. SA levels in a live Philodendron brasil plant over time after watering it with a 2 mM solution of SA at t = 0 h. | ||
Furthermore, for measurement in plant species, the electrode is calibrated in different concentrations of SA spiked in the homogenate solution of Philodendron brasil leaves, prepared as described in section 3.1. The pH of this mixture was determined to be 2.9. Due to the complex nature of this mixture, the linearity range of the electrode started at 13.24 μM, which is slightly larger than the starting point in the buffer solution. This diminished linear range could also be caused by endogenously occurring SA that is unaccounted for. The sensor had a slightly lower sensitivity (99.61 μA mM−1) in comparison to the calibration performed in the buffer (Fig. 8B). Despite this lower sensitivity, the sensor could selectively detect SA in the complex leaf homogenate mixture in the physiologically relevant concentration range. An increase in the standard deviation values in Fig. 8B is due to the matrix effects, stemming from the complex composition of the plant matrix. These effects introduce interference and variability in measurements. Factors such as inherent plant sample heterogeneity and variations in sample preparation contribute to the observed higher standard deviations.34,68
To demonstrate that LEAFS is capable of measuring the dynamics of SA in a given plant, we measured SA in a philodendron brasil house plant. The plant was then watered by an 8 mM SA solution in tap water, to artificially increase physiological SA levels, mimicking the increase in its level in a plant under stress. Many studies have shown and investigated the exogenous SA application to the plants in a similar way.69 In the first step, a single leaf was harvested and mixed with the buffer, following the procedure outlined in section 3.1. SA level was determined in this mixture using the LIG sensor and the SA concentration was found to be 12 ± 5 μgSA gFW−1 (grams of fresh weight). After 16 hours, the same measurement was repeated using a newly cut leaf. The result showed 12 ± 1 μgSA gFW−1 for the second measurement. We speculate that the consistent SA levels are attributed to the relatively slow transport speed of the analytes through the plant's stems and physiological systems. Another measurement was carried out after 68 hours from the initial point, revealing a SA level of 52 ± 3 μgSA gFW−1. This substantial 346% increase in the SA concentration indicates the successful transport of the solution to the leaves and the plant being under stress. Moreover, this measurement demonstrates LEAFS capability of measuring SA dynamics in plants.
3.6 LEAFS performance under different conditions
Before introducing the in-field application of the LIG-based sensor, we validated its performance under various conditions. In the following, the sample solution refers to a solution containing 200 μM of SA in the Britton–Robinson buffer with a pH of 2.4. First, three freshly fabricated electrodes, and three, which had been stored in a dark environment in a Petri dish for a month, were used to conduct SWV tests in the sample solution. As shown in Fig. 9A, there is no significant change (4.2%) in the SA peak current. According to Fig. 9B, the sample solution temperature was adjusted to 4 °C, 20 °C, and 40 °C, and measurements were taken using three electrodes at each temperature. A relative standard deviation of 1.63% across three temperatures indicates a stable sensor response. To simulate high salinity conditions, we added 15 g L−1 of NaCl (sodium chloride) into the sample solution.70 The SA peak in SWV was then measured using three different electrodes, as illustrated in Fig. 9C. There is minimal change in sensor performance under high salinity conditions, with only a slight increase of 1.22% compared to the normal condition. Finally, we tested the flexibility of the sensor by measuring its response through 100 bending cycles. As shown in Fig. 9D, there is no significant change in the performance of the electrode. The relative standard deviation, calculated from five points measured at every 25 bending cycles, was 2.40%.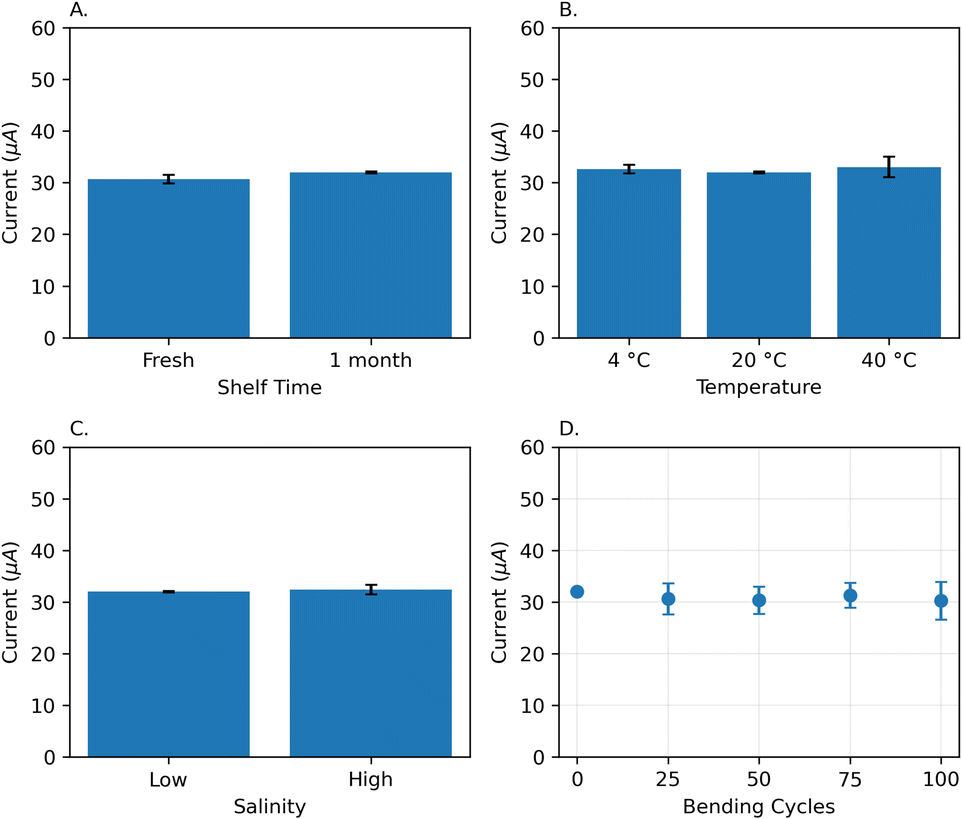 | ||
| Fig. 9 The peak current of 200 μM SA (in a Britton–Robinson buffer of pH 2.4) in SWVs measured (A) by freshly fabricated and 1-month-old (stored in a dark environment) electrodes. (n = 3) (B) at different temperatures (n = 3). (C) in low and high (added 15 g l−1 NaCl to the buffer) salinity. (D) over the course of 100 bending cycles. | ||
3.7 Implanted LEAFS for continuous monitoring of plant stress
In addition to measurement of SA in leaf homogenate, we aimed to develop a compact sensor that can be implanted inside the plant leaf or stem for continuous measurement. Such a system, when paired with other multi-modal sensors to collect environmental data, can shed light on response of different species to environmental stress stimuli. We hope that this will pave the way for a more sustainable and smart agriculture. Although we achieve high sensitivity and low limit of detection for SA with bare LIG electrodes, these electrodes are best suited for single and disposable use. The SA and by-products of its oxidation strongly adsorb on the electrode,71,72 and SA peak disappears after repeated measurements. Moreover, film formation blocks the electrode surface area, diminishing the sensor sensitivity and stability. As depicted in Fig. 10A, the SA peak current decreases by nearly 80% from the first to the second run when using a mixture of Philodendron brasil leaves with 200 μM SA. Subsequently, the SA peak continues to decline with each run, while the peak corresponding to the byproduct of SA oxidation (which might be carboxyl-para-benzoquinone,71) observed around 0.65 V, gradually increases.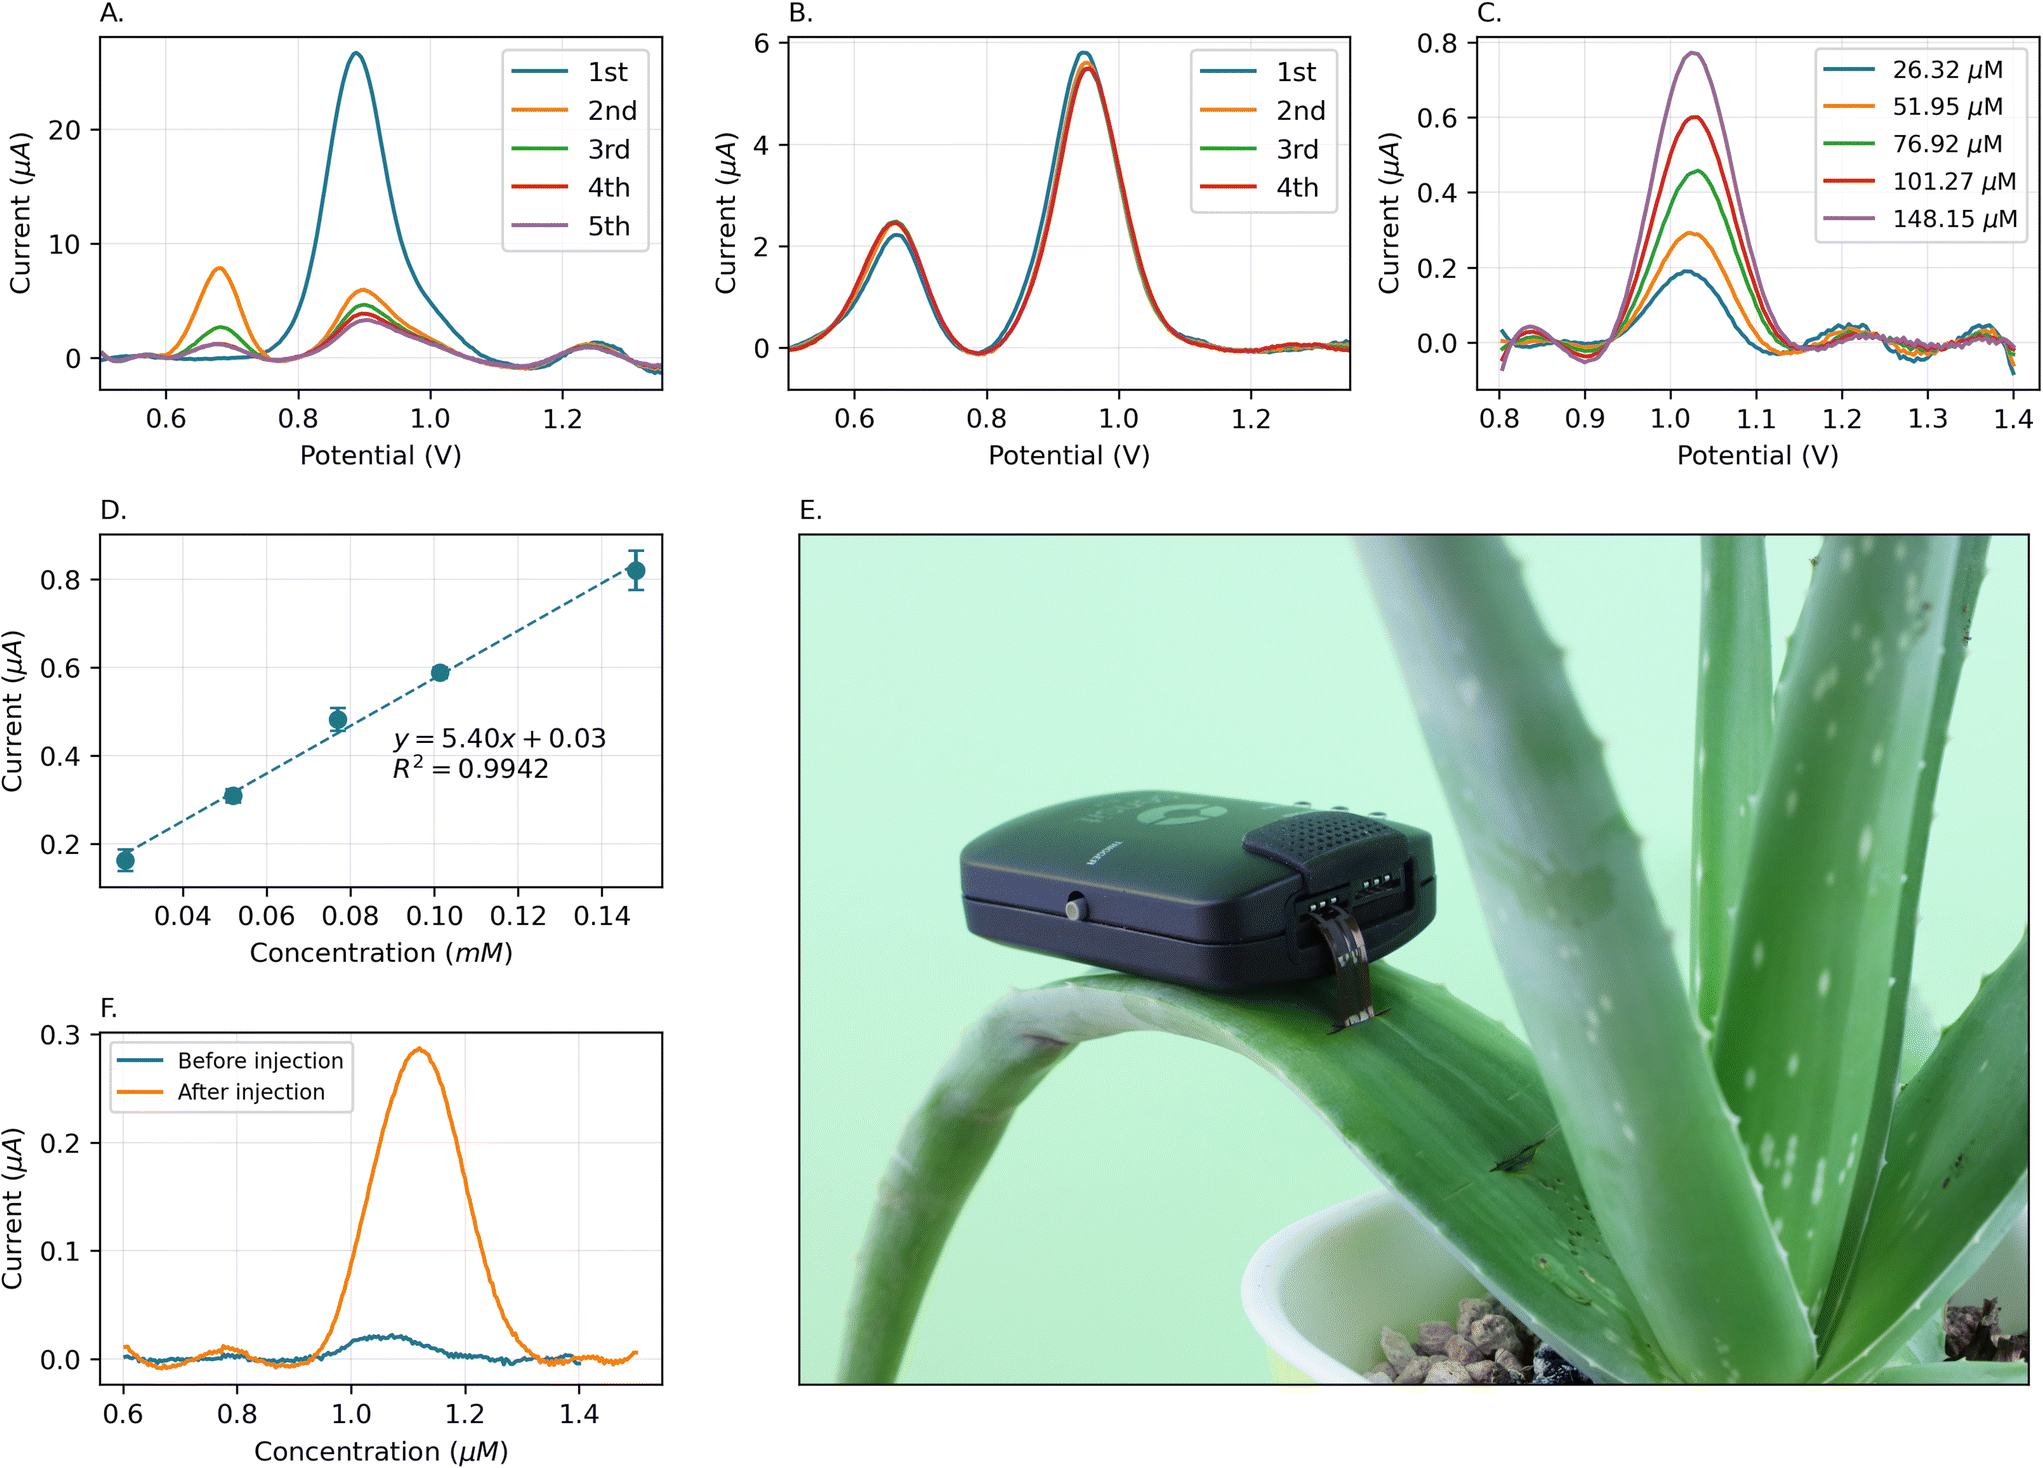 | ||
| Fig. 10 A. The peak of SA oxidation in multiple SWV measurements without Nafion modification. B. The peak of SA oxidation in multiple SWV measurements with Nafion modification. C. The peak of SA with varying concentrations in a mixture of Philodendron brasil leaves. D. The calibration curve of the Nafion-treated LIG sensor to SA concentrations in a mixture of Philodendron brasil leaves. E. In situ monitoring of plant stress in an Aloe vera plant. F. The SA peak response before and after the injection of 500 μL of 15 mM SA solution to the base of the aloe vera leaf. | ||
For the purpose of continuous monitoring of plant stress, we modified the working electrodes with Nafion, a sulfonic-based ionomer, known for its cation exchange capabilities. Nafion is especially adept at concentrating positive ions and repelling negative ions from the electrode surface and minimizing adsorption onto the electrode surface.73,74 After modifying the electrode surface with 0.25% Nafion on working electrode, the result is a consistent and stable SA peak in multiple runs within the same solution, as shown in Fig. 10B. As a pretreatment process, we conducted a single SWV run in the solution before the formal detection process. This allowed SA molecules to disperse into the Nafion layer, enabling ions to reach an equilibrium state. The peak current of SA only decreases by 1.7% from the first to the second run and is stable after multiple runs, while the peak of byproducts also remains stable without a significant increase.
The calibration of surface-treated electrode was carried out with different concentrations of SA in the mixture of Philodendron brasil leaves (Fig. 10C), prepared according to section 3.1. This calibration demonstrates a linear response to SA concentration with R2 = 0.99 and a sensitivity of 5.40 μA mM−1 within the range of 26.32 μM to 148 μM. (Fig. 10D) It is worth noting that the treatment process with Nafion results in a reduced sensitivity of the electrode, thereby causing the starting point of the linearity range to be higher than that of bare electrodes. However, this modification offers stability for continuous in-plant measurements.
To further test this capability, we directly inserted our electrodes into a live Aloe vera leaf, connected to a portable potentiostat, as shown in Fig. 10E and the video named “In-field application of LEAFS.mp4” included in the ESI.† Initially, we measured the level of SA in the aloe leaf. The fluid inside the aloe vera leaf is acidic with a pH between 4 and 5.75,76 Then, we injected 500 μL of 15 mM SA into the base of the leaf. After 7 hours, we conducted another measurement at the same spot using the same electrode without changing the setup. As presented in Fig. 10F, the SA peak was 12.84 times larger than the initial reading. In comparison to the measurements in the Philodendron brasil plant, it is evident that direct injection into the leaf results in a shorter time frame for detecting the rise in SA levels. This experiment demonstrated that Nafion modification of LIG surface enables multi-use of the electrode and enhanced stability and continuous measurement of SA while the sensor is implanted.
The chemical composition of aloe vera extract and philodendron plants consists of anthraquinones, carbohydrates, enzymes, inorganic compounds (such as calcium, chlorine, phosphorous, iron, manganese, potassium, sodium, and zinc), amino acids (such as alanine, arginine, aspartic acid, glutamic acid, glycine, and tyrosine), proteins, saccharides (such as glucose), vitamins (such as C, choline, and folic acid) and miscellaneous (such as arachidonic acid, γ-linolenic acid, and uric acid), β-elemol, and β-ocimene. The detection of SA in these species demonstrates the selective response of LEAFS to SA.77–79
4 Conclusions
In situ plant stress monitoring was achieved using the LEAFS platform by monitoring SA levels. Low-cost laser-induced graphene electrodes were developed through a simple and scalable fabrication process. The porous LIG material exhibits excellent electrochemical performance in measuring SA. SWV was used to determine the SA levels in a buffer solution, a complex leaf homogenate mixture, and in situ in a live plant species in real-time. The LEAFS platform shows a high sensitivity of 144.28 μA mM−1 and a low limit of detection of 1.44 μM for SA.Although LEAFS provides a user-friendly platform for plant stress monitoring, the measurement processes, by cutting a leaf as a sample or inserting the electrode into the leaf through an incision, are still invasive or minimally-invasive approaches, respectively.
Future developments will include field trials and validating the sensor's performance to detect stress induced in plants by natural stimuli, such as various pathogens, UV-B, drought, heat, and cold. Conducting additional validation tests to assess the selectivity against various pesticides commonly employed in agricultural crops will further confirm the sensor's performance for in-field applications. Incorporating other plant stress biomarkers in the future to create a comprehensive multi-biomarker assay will allow us to gain a broad understanding of the plant's real-time physiological state. Further miniaturization by integrating the LEAFS platform with a cost-effective custom potentiostat can further support the cost-effective development of the platform.
Author contributions
Conceptualization, M. M., S. K.; methodology, M. M., S. K., H. M., A. A., A. S., M. A. M.; formal analysis, M. M., S. K., H. M., A. A., A. S., M. A. M.; data collection, S. K., H. M., A. A., A. S., P. D., H. L.; validation, M. M., S. K.; visualization, S. K.; writing – original draft, S. K., H. M., A. A., A. S., M. A. M.; writing – review and editing, M. M., S. K., H. M., A. A., A. S., M. A. M., P. D., H. L.; funding acquisition, M. M. All authors have read and agreed to the published version of the manuscript.Conflicts of interest
There are no conflicts to declare.Acknowledgements
M. Mousavi acknowledges the 3M Nontenured Faculty Award, Women in Science and Engineering at the University of Southern California, and the NIH Director's New Innovator Award (DP2GM150018). The authors would also like to thank the Core Center of Excellence in Nano Imaging at the University of Southern California.Notes and references
- D. Tilman, C. Balzer, J. Hill and B. L. Befort, Proc. Natl. Acad. Sci., 2011, 108, 20260–20264 CrossRef CAS PubMed.
- J. M. Roper, J. F. Garcia and H. Tsutsui, ACS Omega, 2021, 6, 5101–5107 CrossRef CAS PubMed.
- H. A. Favre and W. H. Powell, Nomenclature of Organic Chemistry, The Royal Society of Chemistry, 2013 Search PubMed.
- I. Raskin, H. Skubatz, W. Tang and B. J. D. Meeuse, Ann. Bot., 1990, 66, 369–373 CrossRef CAS.
- C. A. Rossi, E. J. Marchetta, J. H. Kim and C. D. M. Castroverde, Trends Biochem. Sci., 2023, 48, 699–712 CrossRef CAS PubMed.
- S. Yuan and H.-H. Lin, Z. Naturforsch., C: J. Biosci., 2008, 63, 313–320 CrossRef CAS PubMed.
- I. Raskin, Annu. Rev. Plant Physiol. Plant Mol. Biol., 1992, 43, 439–463 CrossRef CAS.
- D. Sirok, M. Pátfalusi, G. Szeleczky, G. Somorjai, D. Greskovits and K. Monostory, Microchem. J., 2018, 136, 200–208 CrossRef CAS.
- X. Fang, G. Chen, J. Qiu, J. Xu, J. Wang, F. Zhu and G. Ouyang, Talanta, 2018, 184, 520–526 CrossRef CAS PubMed.
- M. R. Payan, M. A. B. Lopez, R. Fernandez-Torres, J. L. P. Bernal and M. C. Mochon, Anal. Chim. Acta, 2009, 653, 184–190 CrossRef CAS PubMed.
- M. J. Scotter, D. P. Roberts, L. A. Wilson, F. A. Howard, J. Davis and N. Mansell, Food Chem., 2007, 105, 273–279 CrossRef CAS.
- V. Pastor, C. Vicent, M. Cerezo, B. Mauch-Mani, J. Dean and V. Flors, Plant Physiol. Biochem., 2012, 53, 19–26 CrossRef CAS PubMed.
- C. Chen, S. Feng, M. Zhou, C. Ji, L. Que and W. Wang, Biosens. Bioelectron., 2019, 140, 111342 CrossRef CAS PubMed.
- L. Liang, Y. Huang, W. Liu, W. Zuo, F. Ye and S. Zhao, Front. Chem., 2020, 8, 671 CrossRef CAS PubMed.
- J.-W. Liu, D.-Y. Deng, Y. Yu, F.-F. Liu, B.-X. Lin, Y.-J. Cao, X.-G. Hu and J.-Z. Wu, Luminescence, 2015, 30, 18–25 CrossRef CAS PubMed.
- Y. Shi, W. Li, X. Hu, X. Zhang, X. Huang, Z. Li, X. Zhai, T. Shen, J. Shi, Y. He and X. Zou, Food Chem., 2024, 434, 137260 CrossRef CAS PubMed.
- S. A. Coolen, F. A. Huf and J. C. Reijenga, J. Chromatogr. B: Biomed. Sci. Appl., 1998, 717, 119–124 CrossRef CAS PubMed.
- D. Liu, M. Li, H. Li, C. Li, G. Wang, P. Li and B. Yang, Sens. Actuators, B, 2021, 341, 130027 CrossRef CAS.
- Q. Yu, Y. Zhao, L. Huang, J. Sun, D. Jin, Y. Shu, Q. Xu and X.-Y. Hu, Anal. Methods, 2020, 12, 3892–3900 RSC.
- A. Nikzamir and F. Capolino, Phys. Rev. Appl., 2022, 18, 054059 CrossRef CAS.
- Y. Hu, J. Zhao, H. Li, X. Wang, P. Hou, C. Wang, A. Li and L. Chen, RSC Adv., 2018, 8, 23404–23410 RSC.
- V. Ong, A. Soleimani, F. Amirghasemi, S. Khazaee Nejad, M. Abdelmonem, M. Razaviyayn, P. Hosseinzadeh, L. Comai and M. P. S. Mousavi, Biosensors, 2023, 13, 204 CrossRef CAS PubMed.
- N. O. Gomes, S. C. Teixeira, M. L. Calegaro, S. A. Machado, N. de Fátima Ferreira Soares, T. V. de Oliveira and P. A. Raymundo-Pereira, Chem. Eng. J., 2023, 472, 144775 CrossRef CAS.
- P. A. Raymundo-Pereira, N. O. Gomes, F. M. Shimizu, S. A. Machado and O. N. Oliveira, Chem. Eng. J., 2021, 408, 127279 CrossRef CAS.
- R. T. Paschoalin, N. O. Gomes, G. F. Almeida, S. Bilatto, C. S. Farinas, S. A. Machado, L. H. Mattoso, O. N. Oliveira and P. A. Raymundo-Pereira, Biosens. Bioelectron., 2022, 199, 113875 CrossRef CAS PubMed.
- M. Li, Y. Kuang, Z. Fan, X. Qin, S. Hu, Z. Liang, Q. Liu, W. Zhang, B. Wang and Z. Su, Sensors, 2022, 22, 2222 CrossRef CAS PubMed.
- W. Detpisuttitham, C. Phanthong, S. Ngamchana, P. Rijiravanich and W. Surareungchai, J. Anal. Test., 2020, 4, 291–297 CrossRef.
- L.-J. Sun, Q.-M. Feng, Y.-F. Yan, Z.-Q. Pan, X.-H. Li, F.-M. Song, H. Yang, J.-J. Xu, N. Bao and H.-Y. Gu, Biosens. Bioelectron., 2014, 60, 154–160 CrossRef CAS PubMed.
- F. Zhang, M. Li, H. Li, G. Wang, Y. Long, P. Li, C. Li and B. Yang, Carbon, 2021, 175, 364–376 CrossRef CAS.
- M. Li, P. Zhou, X. Wang, Y. Wen, L. Xu, J. Hu, Z. Huang and M. Li, Comput. Electron. Agric., 2021, 191, 106502 CrossRef.
- Y. Kuang, M. Li, S. Hu, L. Yang, Z. Liang, J. Wang, H. Jiang, X. Zhou and Z. Su, Sensors, 2022, 22, 4476 CrossRef CAS PubMed.
- A. Bukhamsin, A. Ait Lahcen, J. D. O. Filho, S. Shetty, I. Blilou, J. Kosel and K. N. Salama, Biosens. Bioelectron., 2022, 214, 114515 CrossRef CAS PubMed.
- E. Rabie, H. Assaf, A. Shamroukh and M. Khodari, Egypt. J. Chem., 2019, 62, 165–175 Search PubMed.
- S. C. Teixeira, N. O. Gomes, M. L. Calegaro, S. A. Machado, T. V. de Oliveira, N. de Fátima Ferreira Soares and P. A. Raymundo-Pereira, Biomater. Adv., 2023, 155, 213676 CrossRef CAS PubMed.
- S. C. Teixeira, N. O. Gomes, T. V. de Oliveira, P. Fortes-Da-Silva, N. de Fátima Ferreira Soares and P. A. Raymundo-Pereira, Biosens. Bioelectron.: X, 2023, 14, 100371 CAS.
- K. S. Novoselov, A. K. Geim, S. V. Morozov, D.-E. Jiang, Y. Zhang, S. V. Dubonos, I. V. Grigorieva and A. A. Firsov, Science, 2004, 306, 666–669 CrossRef CAS PubMed.
- N. O. Weiss, H. Zhou, L. Liao, Y. Liu, S. Jiang, Y. Huang and X. Duan, Adv. Mater., 2012, 24, 5782–5825 CrossRef CAS PubMed.
- B. F. Machado and P. Serp, Catal. Sci. Technol., 2012, 2, 54–75 RSC.
- Y. Huang, J. Liang and Y. Chen, Small, 2012, 8, 1805–1834 CrossRef CAS PubMed.
- J. Zhu, S. Liu, Z. Hu, X. Zhang, N. Yi, K. Tang, M. G. Dexheimer, X. Lian, Q. Wang and J. Yang, et al. , Biosens. Bioelectron., 2021, 193, 113606 CrossRef CAS PubMed.
- T. Pinheiro, S. Silvestre, J. Coelho, A. C. Marques, R. Martins, M. G. F. Sales and E. Fortunato, Adv. Mater. Interfaces, 2021, 8, 2101502 CrossRef CAS.
- V. P. Wanjari, A. S. Reddy, S. P. Duttagupta and S. P. Singh, Environ. Sci. Pollut. Res., 2023, 30, 42643–42657 CrossRef CAS.
- J. Lin, Z. Peng, Y. Liu, F. Ruiz-Zepeda, R. Ye, E. L. Samuel, M. J. Yacaman, B. I. Yakobson and J. M. Tour, Nat. Commun., 2014, 5, 5714 CrossRef CAS PubMed.
- T. Tambouratzis, D. Karalekas and N. Moustakas, J. Ind. Ecol., 2014, 18, 508–516 CrossRef CAS.
- N. Dixit and S. P. Singh, ACS Omega, 2022, 7, 5112–5130 CrossRef CAS PubMed.
- C. Mongay and V. Cerdà, Ann. Chim., 1974, 64, 409–412 CAS.
- Ł. Górski, F. Ciepiela and M. Jakubowska, Electrochim. Acta, 2014, 136, 195–203 CrossRef.
- M. Jakubowska, Electroanalysis, 2011, 23, 553–572 CrossRef CAS.
- D. Erb, pybaselines: A Python library of algorithms for the baseline correction of experimental data, https://github.com/derb12/pybaselines Search PubMed.
- P. Virtanen, R. Gommers, T. E. Oliphant, M. Haberland, T. Reddy, D. Cournapeau, E. Burovski, P. Peterson, W. Weckesser, J. Bright, S. J. van der Walt, M. Brett, J. Wilson, K. J. Millman, N. Mayorov, A. R. J. Nelson, E. Jones, R. Kern, E. Larson, C. J. Carey, İ. Polat, Y. Feng, E. W. Moore, J. VanderPlas, D. Laxalde, J. Perktold, R. Cimrman, I. Henriksen, E. A. Quintero, C. R. Harris, A. M. Archibald, A. H. Ribeiro, F. Pedregosa, P. van Mulbregt and SciPy 1.0 Contributors, Nat. Methods, 2020, 17, 261–272 CrossRef CAS PubMed.
- Electroanalytical Methods, ed. F. Scholz, A. Bond, R. Compton, D. Fiedler, G. Inzelt, H. Kahlert, Š. Komorsky-Lovrić, H. Lohse, M. Lovrić, F. Marken, A. Neudeck, U. Retter, F. Scholz and Z. Stojek, Springer Berlin Heidelberg, Berlin, Heidelberg, 2010 Search PubMed.
- W. Kang, X. Pei, C. A. Rusinek, A. Bange, E. N. Haynes, W. R. Heineman and I. Papautsky, Anal. Chem., 2017, 89, 3345–3352 CrossRef CAS PubMed.
- G. M. Swain, Handbook of Electrochemistry, Elsevier, Amsterdam, 2007, pp. 111–153 Search PubMed.
- N. Akkarachanchainon, P. Rattanawaleedirojn, O. Chailapakul and N. Rodthongkum, Talanta, 2017, 165, 692–701 CrossRef CAS PubMed.
- Y. Bleu, F. Bourquard, A.-S. Loir, V. Barnier, F. Garrelie and C. Donnet, J. Raman Spectrosc., 2019, 50, 1630–1641 CrossRef CAS.
- R. Barber, S. Cameron, A. Devine, A. McCombe, L. K. Pourshahidi, J. Cundell, S. Roy, A. Mathur, C. Casimero and P. Papakonstantinou, et al. , Electrochem. Commun., 2021, 123, 106914 CrossRef CAS.
- K. Muzyka and G. Xu, Electroanalysis, 2022, 34, 574–589 CrossRef CAS.
- B. Kulyk, B. F. Silva, A. F. Carvalho, S. Silvestre, A. J. Fernandes, R. Martins, E. Fortunato and F. M. Costa, ACS Appl. Mater. Interfaces, 2021, 13, 10210–10221 CrossRef CAS PubMed.
- Y. Wei, X. Li, Y. Wang, T. Hirtz, Z. Guo, Y. Qiao, T. Cui, H. Tian, Y. Yang and T.-L. Ren, ACS Nano, 2021, 15, 17738–17747 CrossRef CAS PubMed.
- O. J. Guy and K.-A. D. Walker, Silicon Carbide Biotechnol., 2016, 85–141 CAS.
- M. Omidi, A. Fatehinya, M. Farahani, Z. Akbari, S. Shahmoradi, F. Yazdian, M. Tahriri, K. Moharamzadeh, L. Tayebi and D. Vashaee, Biomaterials for oral and dental tissue engineering, Elsevier, 2017, pp. 97–115 Search PubMed.
- R. R. Mather, Surface modification of textiles, Elsevier, 2009, pp. 296–317 Search PubMed.
- D. Titus, E. J. J. Samuel and S. M. Roopan, Green synthesis, characterization and applications of nanoparticles, Elsevier, 2019, pp. 303–319 Search PubMed.
- S. M. Hues and L. Lovejoy, Handbook of silicon wafer cleaning technology, Elsevier, 2018, pp. 701–741 Search PubMed.
- T. Pinheiro, S. Silvestre, J. Coelho, A. C. Marques, R. Martins, M. G. F. Sales and E. Fortunato, Adv. Mater. Interfaces, 2021, 8, 2101502 CrossRef CAS.
- Y. F. Makableh, M. Al-Fandi, H. Jaradat, A. Al-Shami, I. Rawashdeh and T. Harahsha, Bull. Mater. Sci., 2020, 43, 240 CrossRef CAS.
- E. P. Serjeant and B. Dempsey, Ionisation constants of organic acids in aqueous solution, ed. E. P. Serjeant and B. Dempsey, Pergamon Press, Oxford, 1979 Search PubMed.
- M. Caban, N. Migowska, P. Stepnowski, M. Kwiatkowski and J. Kumirska, J. Chromatogr. A, 2012, 1258, 117–127 CrossRef CAS PubMed.
- B. Joseph, D. Jini and S. Sujatha, Asian J. Crop Sci., 2010, 2, 226–235 CrossRef.
- C. Brouwer, A. Goffeau and M. Heibloem, Irrigation Water Management: Training Manual No. 1 - Introduction to Irrigation, 1985 Search PubMed.
- W.-D. Zhang, B. Xu, Y.-X. Hong, Y.-X. Yu, J.-S. Ye and J.-Q. Zhang, J. Solid State Electrochem., 2010, 14, 1713–1718 CrossRef CAS.
- V. Supalkova, J. Petrek, L. Havel, S. Krizkova, J. Petrlova, V. Adam, D. Potesil, P. Babula, M. Beklova, A. Horna and R. Kizek, Sensors, 2006, 6, 1483–1497 CrossRef CAS.
- K. A. Mauritz and R. B. Moore, Chem. Rev., 2004, 104, 4535–4586 CrossRef PubMed.
- S. Hernandez-Aldave, A. Tarat, J. D. McGettrick and P. Bertoncello, Nanomaterials, 2019, 9, 221 CrossRef CAS PubMed.
- L. Suriati, I. M. Utama, B. A. Harjosuwono and I. B. W. Gunam, IOP Conf. Ser.: Mater. Sci. Eng., 2020, 411, 012053 Search PubMed.
- N. Soltanizadeh and M. S. Mousavinejad, J. Food Sci. Technol., 2015, 52, 6647–6654 CrossRef CAS PubMed.
- S. Rahman, P. Carter and N. Bhattarai, J. Funct. Biomater., 2017, 8, 6 CrossRef PubMed.
- A. Lis, E. Boczek and J. Góra, Flavour Fragrance J., 2004, 19, 549–553 CrossRef CAS.
- M. Z. B. Bezerra, M. Andrade-Neto, R. M. de Freitas, C. M. Feitosa and I. M. de Andrade, J. Essent. Oil Res., 2002, 14, 56–57 CrossRef CAS.
Footnote |
| † Electronic supplementary information (ESI) available. See DOI: https://doi.org/10.1039/d3sd00296a |
| This journal is © The Royal Society of Chemistry 2024 |